

Abstract
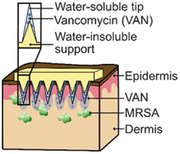
Skin and soft tissue infections (SSTIs) caused by methicillin‐resistant Staphylococcus aureus (MRSA) are a major healthcare burden, often treated with intravenous injection of the glycopeptide antibiotic vancomycin (VAN). However, low local drug concentration in the skin limits its treatment efficiency, while systemic exposure promotes the development of resistant bacterial strains. Topical administration of VAN on skin is ineffective as its high molecular weight prohibits transdermal penetration. In order to implement a local VAN delivery, microneedle (MN) arrays with a water‐insoluble support layer for the controlled administration of VAN into the skin are developed. The utilization of such a support layer results in water‐insoluble needle shafts surrounded by drug‐loaded water‐soluble tips with high drug encapsulation. The developed MN arrays can penetrate the dermal barriers of both porcine and fresh human skin. Permeation studies on porcine skin reveal that the majority of the delivered VAN is retained within the skin. It is shown that the VAN‐MN array reduces MRSA growth both in vitro and ex vivo on skin. The developed VAN‐MN arrays may be extended to several drugs and may facilitate localized treatment of MRSA‐caused skin infections while minimizing adverse systemic effects.
Keywords: antibiotic, local delivery, microneedle patch, MRSA, PMMA
The antibiotic vancomycin is delivered locally into the skin via microneedle arrays for potential treatment of methicillin‐resistant Staphylococcus aureus infections. The microneedle arrays consist of a water‐insoluble support layer surrounded by drug‐loaded, water‐soluble tips to ensure controlled administration of vancomycin. The performance of the arrays is explored in vitro and ex vivo for insertion capability, drug delivery, and antibacterial effect.
1. Introduction
Skin and soft tissue infections (SSTIs) are a major healthcare burden, accounting for 7–10% of all hospitalized patients annually.[ 1 , 2 , 3 ] In the past two decades there has been a rise in the incidence of SSTIs‐associated hospitalizations[ 4 , 5 , 6 ] and it is estimated that they caused an overall economic burden in the United States of $15 billion in 2012, three times more than in 2000.[ 4 ] Importantly, the majority of SSTIs are caused by Staphylococcus aureus (S. aureus),[ 1 , 7 ] and the growing incidence of SSTIs has been associated with the increasing emergence of methicillin‐resistant S. aureus (MRSA).[ 8 , 9 ] The rising emergence of antibiotic resistance is a reason for global concern, and a major contributing factor to this resistance is the inappropriate use of antibiotics.
The antibiotic vancomycin hydrochloride (VAN) is a mainstay for the treatment of MRSA‐associated SSTIs through its inhibition of the bacterial cell‐wall biosynthesis.[ 10 , 11 , 12 , 13 ] VAN is a hydrophilic glycopeptide with a molecular weight (MW) of 1.449 kDa. These characteristics inhibit VAN administration both orally (because of its poor gastro‐intestinal absorption)[ 14 ] and topically (due to the barrier function of skin against molecules larger than ≈500 Da).[ 15 ] Therefore, VAN for SSTIs is almost exclusively administered intravenously resulting in systemic exposure and yet shows poor skin tissue absorption.[ 16 ] This combination reduces the effectiveness of systemic VAN against MRSA in SSTIs and may contribute to resistance development,[ 17 , 18 ] such as VAN‐resistant S. aureus.[ 19 , 20 ] Systemic exposure of VAN may result in significant side effects including local pain, thrombophlebitis, kidney damage, and in rare cases even anaphylaxis, erythema, or reduced white blood cells.[ 21 , 22 ] To address the above‐mentioned challenges and to provide VAN treatment in settings where clinical surveillance is limited, a local delivery route for VAN is urgently needed.
There have been several attempts, mainly in the field of nanotechnology, to improve local organ concentration of VAN while reducing its side effects. VAN‐loaded liposomes,[ 23 , 24 ] solid lipid nanoparticles,[ 25 ] and polymeric nanoparticles[ 26 ] have been reported to improve the drug accumulation at different sites of infections. Moreover, nanoplexes,[ 27 ] supramolecular self‐assembled drug delivery systems,[ 28 ] and oleic acid nanoparticles[ 29 ] have been successfully employed for improved treatment of MRSA‐caused skin infections in vivo. Intradermal delivery of VAN in vivo has been reported in mediastinitis[ 30 ] by incorporating it in nanoscale phospholipid bilayers containing ethanol combined with iontophoresis.[ 31 ] However, the majority of these studies relied on either intravenous or intradermal injections, which is associated with side effects of VAN,[ 21 , 22 ] pain, or problematic patient compliance.[ 32 ]
To overcome the disadvantages associated with injections, which includes i) systemic drug exposure; ii) low patient compliance; iii) need for trained personnel; and iv) hazardous sharp waste, delivery of drugs via polymeric microneedles (MNs) arrays has gained increasing interest.[ 33 , 34 , 35 ] MNs are micron‐sized needles organized in arrays that can breach the stratum corneum of the skin and deliver drugs that are normally prevented from intradermal delivery. Water‐soluble MN arrays loaded with several drugs including VAN have exhibited successful transdermal drug delivery and effective plasma and skin tissue concentration highlighting their great potential as drug delivery systems.[ 36 , 37 ] However, the effectiveness of locally delivered VAN by MN arrays against MRSA‐caused SSTIs has yet to be shown. Another challenge of water‐soluble polymeric MN arrays is the limited drug localization in the needle tips. When both the needles and the support layer in MN arrays are made from water‐soluble polymers with similar drug solubilities, part of the drug loaded in the needles may diffuse back in the support layer impeding the efficient and reproducible drug dose administration and final performance.[ 38 , 39 ] This unreliable dosing is highlighted as one of the major obstacles that needs to be addressed to successfully translate MN arrays into clinics,[ 40 ] which has triggered research into strategies to obtain tip‐loaded MN arrays.[ 38 , 41 , 42 , 43 , 44 , 45 , 46 , 47 , 48 ]
Here, we developed a novel VAN‐MN array design for the local treatment of MRSA‐caused SSTIs. This MN design employs a water‐insoluble support layer allowing for a precise and reproducible VAN amount located in the water‐soluble needle tips. We explored the skin penetration capacity of the MN arrays in both thawed porcine and fresh human skin. Furthermore, we studied, for the first time, the local VAN drug release and skin permeation of the developed VAN‐MN arrays with emphasis on their capacity to reduce MRSA bacterial growth both in vitro and ex vivo. This study lays the foundation for prospective clinical application of such a novel delivery route for VAN.
2. Results and Discussion
2.1. Fabrication of VAN‐MN Arrays
The fabrication process of VAN‐loaded MN with water‐soluble tips and water‐insoluble support layer is illustrated in Figure 1 . The water‐soluble, drug‐ (or dye‐) loaded MN tips (polyvinyl alcohol, PVA), and the water‐insoluble support layer (polymethylmethacrylate, PMMA) are formed using MN molds, two subsequent centrifugations, and overnight drying steps. The final MN arrays are then removed from the mold. There are several advantages of the process developed here. First, temperature‐sensitive biomolecules can be easily incorporated in the MN tips because the drying of both tips and support layer occurs at room temperature (reducing the drying temperature of the PMMA support does not affect drug loading, see Figure S1, Supporting Information). Second, the polymer matrix is formed into MN arrays by centrifugation enabling easy and fast MN production in any basic laboratory. Third, the PMMA water‐insoluble support layer facilitates the fabrication of MN arrays with a reliable dosage because drug diffusion into the support layer is minimized while simultaneously defining a precise dose in the water‐soluble MN tips.
Figure 1.
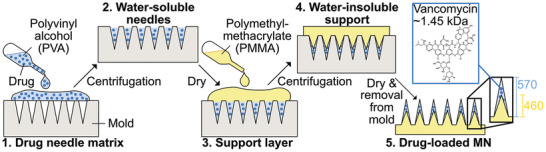
Schematic illustration of the fabrication process of VAN‐loaded MN arrays. The needle matrix is made of water‐soluble PVA (30 wt% in water) and the support layer is made from water‐insoluble PMMA (40 wt% in ethyl lactate). 1) First, the water‐soluble MN tips are produced by adding drug‐ or dye‐loaded PVA polymer in MN molds. 2) The needle polymer‐mix is concentrated in the mold cavities by centrifugation, excess polymer is removed with a spatula, and MN arrays are dried overnight. 3,4) The water‐insoluble support layer made from PMMA is added, centrifuged, and dried overnight. The centrifugation presses the water‐insoluble PMMA support into the cavities, forming smaller needle shafts. 5) Finally, the MN arrays are detached from the mold with PMMA needle tips and shafts of around 570 and 460 µm height, respectively.
To visualize the drug dissolution from MN tips into the support layer, MN arrays with the pink dye sulforhodamine B (SR) in the needles were produced with both a water‐soluble (polyvinylpyrrolidone, PVP) and water‐insoluble (PMMA) support layer, as shown in Figure 2a. There is a reduced diffusion of SR into the MN support layer when it is made from water‐insoluble PMMA instead of water‐soluble PVP. To study whether VAN follows a similar diffusion trend in the three different polymers PVA, PVP, and PMMA, the solubility of VAN in each of the polymers was determined by differential scanning calorimetry (DSC). A high drug solubility in a polymer correlates with its diffusion gradient and VAN exhibits the highest solubility in PVA followed by PVP and PMMA with predicted solubilities at room temperature of 35, 10, and 1 wt%, respectively (Figure S2, Supporting Information). The significantly lower solubility of VAN in PMMA than PVP indicates that the VAN diffusion into the support layer of PMMA may be minimized resulting in higher drug encapsulation in the tips. Furthermore, Figure 2b,c shows MN arrays with PMMA as a support layer but with different thicknesses. Reducing the amount of PMMA from 100 to 25 mg per array facilitates the production of a thin and thus flexible PMMA support layer. Such flexibility of MN arrays may be a desired functionality for their clinical application. Figure 2 also shows scanning electron microscopy (SEM) images of MN arrays loaded with 10 (Figure 2d,e) and 100 µg (Figure 2f,g) of VAN. Sharp and uniform needles independent of VAN loading are observed. However, small changes in the morphology of the needles for high VAN loading are detected with rough surfaces at the bottom and the edges of the needle tips (Figure 2e,f). High drug loadings are correlated with increased brittleness of MNs[ 49 ] and this loading‐dependent increase of needle brittleness may also influence the skin insertion capability of the MN arrays.
Figure 2.
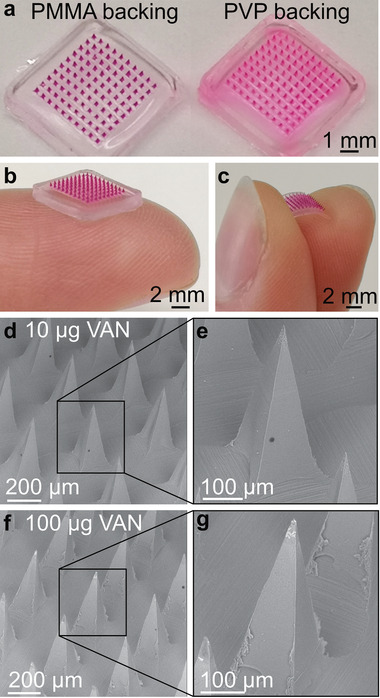
Images of MN arrays with water‐insoluble PMMA or water‐soluble PVP support layer. a) Digital images of dye‐loaded PMMA/PVA MN arrays in comparison to PVP/PVA arrays. Digital image of MN arrays loaded with SR with b) a thick, rigid or c) thin, flexible PMMA support layer. SEM images of PMMA/PVA MN arrays loaded with d,e) 10 µg or f,g) 100 µg VAN.
2.2. Skin Insertion Capability
To investigate the skin insertion capability of the developed VAN‐MN, we employed the so‐called parafilm insertion model in which parafilm layers are used as a skin equivalent to test MN insertion.[ 50 ] Figure 3a shows the percentage of holes created in each of the 130 µm thick parafilm layers (bottom abscissa) that also corresponds to the total piercing depth (top abscissa) for MN arrays with increasing VAN loading (0–150 µg). There is no clear trend in the amounts of holes pierced in each parafilm layer for MN arrays up to 150 µg loading (also valid when spring applicator was used, Figure S3a, Supporting Information) indicating that the VAN concentration does not significantly affect the piercing capacity of these MN arrays. However, microscopic observation of the first parafilm layer reveals that with increasing VAN concentration more needles broke after MN removal (Figure 3b,c red arrows). To investigate the effect of VAN concentration upon the mechanical properties of MNs, single needles were monitored for their displacement distance after transverse force application (Figure 4 ). With this method, mechanically strong needles withstand higher forces before first displacement. The needles are irreversibly bent after their displacement (Figure 4b,c). Figure 4d shows the maximum force required before needle failure for MN array with increasing VAN loading (raw data, Figure S3b, Supporting Information). There is no significant difference in maximum force depending on VAN loading. However, dissolving the MN arrays and measuring the force required for needle bending for the PMMA core only shows a slight decrease of maximum force for increasing VAN loadings (Figure S3c, Supporting Information). For the rest of this study, we choose 100 µg VAN for loading in our developed MN arrays.
Figure 3.
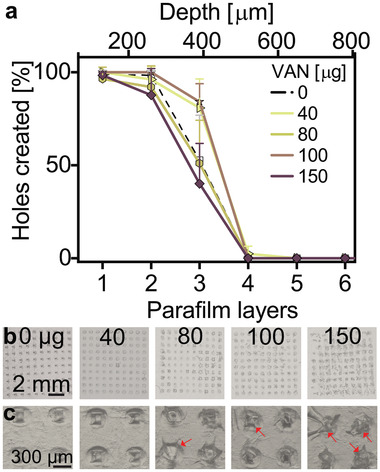
Insertion capabilities of MN arrays with water‐insoluble support layer. a) Insertion depth of VAN‐loaded MN arrays into eight stacked layers of parafilm as a skin model, n = 3. b) 2x and c) 8x magnification of first layer of pierced parafilm after MN insertion for different VAN concentrations in µg (red arrows indicate needles broken off after insertion).
Figure 4.
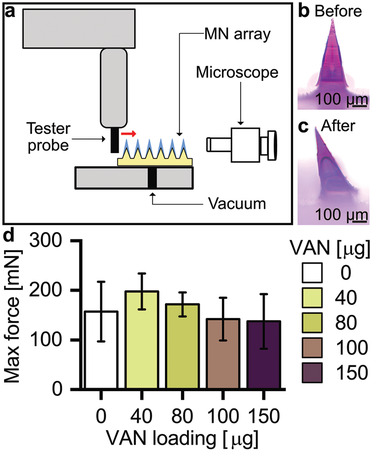
Mechanical stability testing of MN arrays after transverse force application. a) Schematic of the experimental set‐up, showing the tester probe running against single needles transversally. MN arrays are positioned on a stage with vacuum suction with the aid of a microscope. Microscopic image of SR‐loaded needle b) before and c) after mechanical test. d) Maximum force detected before needle failure for MN arrays loaded with increasing concentrations of VAN, n = 9.
To further study successful insertion of MN arrays with water‐insoluble support layer, we qualitatively analyzed piercing into thawed porcine and fresh human skin. Figure 5a,b shows top‐view images of i) porcine and ii) human skin after insertion of SR‐loaded MN arrays revealing successful insertion of the full array. To investigate the insertion depth, histological cross‐sections of cryopreserved tissues after SR‐MN (Figure 5c,d) and VAN‐MN (Figure 5e,f) application were analyzed. We observe successful insertion resulting in formation of cavities up to 100–200 µm depth after both manual (Figure 5a,c,e) and applicator‐assisted insertion (Figure 5b,d,f,g and Figure S4, Supporting Information) without polymeric residues. This is attributed to the water‐soluble PVA tip dissolution in the moist tissue environment and removal of the PMMA needle shaft. Therefore, increasing VAN concentration may lead to increased breakage of needles after removal from dry environments such as parafilm; however, this does not seem to negatively affect the successful skin insertion of VAN‐MN arrays at 100 μg loading (Figure 5e,f). The SR dye is clearly present in the skin cavities demonstrating that our MN arrays are suitable for the delivery of VAN into the local skin environment. The stratum corneum in the thawed porcine skin was clearly visible in light microscopy (Figure 5c), but the basement membrane was not identified at higher magnification, which may be due to the freeze–thawing process. In contrast, fresh human skin shows well‐defined layer differentiation, showing that the MN arrays can successfully breach the entire epidermal layer and dermal–epidermal basement membrane (Figure 5f, red arrow). We further verified this breaching with immunohistochemical imaging of human skin after VAN‐MN insertion (Figure 5d, blue: cell nuclei, red: collagen), which demonstrated rupture of the collagen‐rich epidermal–dermal junction after VAN‐MN insertion. The successful skin insertion in fresh human skin validates that the developed MN arrays here are strong enough to ensure VAN delivery into the dermis. This ensures successful drug delivery into the deeper skin layers that may be important for treatment of deep skin infections such as cutaneous abscess or cellulitis.[ 51 ]
Figure 5.
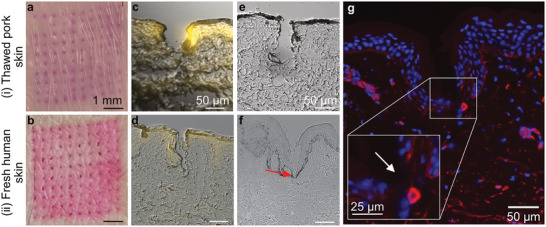
Insertion of PVA/PMMA MN arrays into i) thawed pork and ii) fresh human skin. a,b) Top‐view digital images of skin after insertion of SR‐loaded MN arrays. c,d) Fluorescence and bright field overlay micrograph of histological section of skin after SR‐loaded MN array insertion. e,f) Bright field micrograph of skin section after insertion of 100 µg VAN‐MN array insertion, red arrow indicates rupture of epidermal–dermal junction. g) Immunofluorescence staining of histological section of human skin after insertion of 100 µg VAN‐MN arrays with cell nuclei in blue and collagen in red. Inset shows breaching of epidermal–dermal junction.
2.3. Ex Vivo Drug Permeation through Skin
The dermatokinetic profile of VAN released from the developed MN arrays was assessed by Franz diffusion cell experiments quantifying VAN using high‐pressure liquid chromatography (HPLC; Figure S5, Supporting Information). Figure 6a shows a schematic of these Franz diffusion cell experiments with full‐thickness porcine skin mounted between the donor and receptor chamber. The epidermal side faced toward the donor chamber (air interface) and allowed MN application, while the dermal side was in contact with the phosphate buffered saline (PBS) filled receptor chamber (aqueous interface) from which samples were withdrawn via a sampling port. Figure 6b shows the amount of VAN detected in the receptor chamber as a function of time for application of the MN array for 10 min (squares) and 24 h (triangles). The duration of the application did not greatly affect the VAN permeation across the skin. Therefore, 10 min MN array application is sufficient to obtain the full drug delivery potential of the present MN array design.
Figure 6.
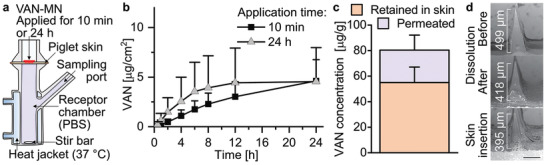
Release of VAN from MN arrays. a) Illustration of Franz cell set‐up for release measurement of VAN‐MN. MN arrays are applied for 10 min or 24 h into piglet skin mounted onto PBS‐filled receptor chamber. b) VAN permeated across the skin in Franz diffusion assay over 24 h after application of 100 µg VAN‐MN for 10 min or 24 h, n = 6. c) VAN amount after 24 h in the skin (retained) and in the receptor chamber (permeated) for 10 min MN application, n = 6. d) Representative SEM images of 100 µg VAN‐MN before and after dissolution in PBS and after insertion in skin for 10 min, scale bar: 200 µm.
Following a 10 min MN application, Figure 6c shows the amount of VAN per gram tissue that was retained in, or permeated through the skin after 24 h. The VAN amount that is retained within or on the skin is >2 times than the amount that permeated through the skin, with 55.0 ± 12.1 and 25.4 ± 11.8 µg g−1, respectively. However, comparing this VAN amount relative to the total loading of the MN arrays (Figure S6, Supporting Information) shows that a large fraction of the VAN (52 ± 20.8%) is removed with the MN array after application. This could be attributed to the high moisture of the thawed tissue that results in smearing of the PVA matrix onto the porcine skin, as observed with SR‐loaded MN arrays (not shown). This finding may be specifically correlated with the use of thawed skin tissue, as this was not observed when we utilized fresh excised human skin. Therefore, future studies may investigate the effect of the utilized skin upon the delivery efficacy. However, it may also highlight the challenges in efficient drug delivery from MN arrays. To improve the drug delivery efficacy future studies could also explore increasing the PVA polymer concentration to reduce the size of the inner PMMA core. Nevertheless, the VAN concentration retained in the skin is somewhat higher than reported previously for dissolvable MN arrays in vivo.[ 37 ] Importantly, the local VAN concentration is more than 500‐fold higher than reported for intravenous injected VAN at clinically relevant concentrations,[ 37 ] showing the potential of the MN arrays to deliver VAN as an alternative, local treatment option for skin infections while reducing the side effects associated with systemic VAN exposure.
Finally, Figure 6d shows the SEM of single needles from 100 µg VAN‐MN arrays before and after full dissolution in water, and after skin insertion for 10 min. Fully dissolving the VAN‐MN arrays does not result in a complete removal of the needles, indicating that a part of the PMMA support layer is being pressed into the cavities during fabrication, forming an internal MN structure. However, a height reduction after dissolution is visible that indicates the formation of a coating layer of the water‐soluble drug‐PVA matrix around the smaller, water‐insoluble PMMA tip. Importantly, this height reduction is similar between fully dissolved needles and those inserted into porcine skin for 10 min. Such a comparable height reduction shows that the PVA‐part of the needles is completely dissolved after 10 min skin application. Moreover, the intact removal of the water‐insoluble tip support after the MN array application on the skin further validates that nonbiodegradable polymeric residues of the PMMA do not reside within the skin after MN removal. Thus, our VAN‐MN array allows for VAN delivery into and across the skin.
2.4. In Vitro Growth Inhibition of MRSA
To evaluate whether the VAN retains its antibacterial activity following the MN fabrication process and subsequent dissolution of the PVA needle tips, agar diffusion tests with selected amounts of VAN against a skin‐associated MRSA strain (USA300) were performed. MN arrays pierced the agar successfully as highlighted in the inset of Figure 7a. Furthermore, Figure 7a depicts the zones of inhibition of MRSA after 5 min application of MN arrays or positive controls (VAN‐infused filter paper cut at identical dimensions as MN arrays) at different VAN loadings (0–40 µg). For both the VAN‐MN arrays as well as the positive controls, higher VAN amounts increase the zones of inhibition. Plotting the inhibition zones as a function of VAN concentration for both the positive control (PC, blue squares) and the VAN‐MN arrays (green circles) demonstrates a correlation (in Figure 7b). The VAN concentration in the MN arrays is measured by HPLC of fully dissolved arrays (Figure S6a, Supporting Information). Most importantly, the VAN released from the MN arrays can inhibit the growth of MRSA in a comparable manner to the positive control, demonstrating that the VAN retains its full antibacterial activity after release from the MN.
Figure 7.
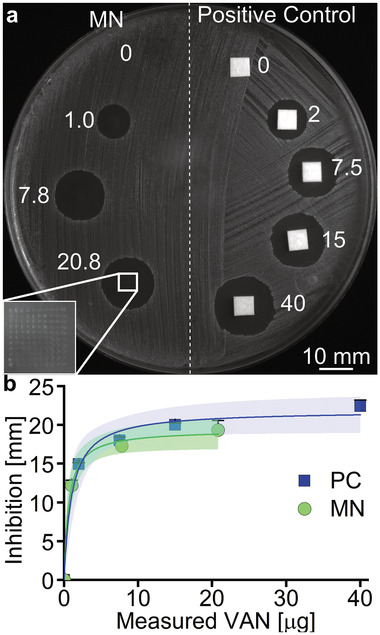
Growth inhibition of MRSA in agar diffusion assay after VAN‐MN application. a) Example image of MRSA bacterial lawn after application of VAN‐loaded paper disks (positive controls) and VAN‐MN for 5 min for different nominal VAN amounts (µg). Inset shows magnification of the holes created after MN application. b) Depicts the measurement of inhibition zones as a function of VAN concentration with corresponding 95% confidence interval for n = 6 (MN) and n = 3 (PC).
2.5. Ex Vivo MRSA Skin Infection Study
The effectiveness of the developed VAN‐MN arrays against MRSA was further evaluated with an ex vivo skin infection model. Figure 8a shows a schematic of the steps for this model, in which i) an appropriate MRSA bacterial population was injected intradermally and ii) incubated for 1–20 h in an air–liquid interface, followed by iii) a double MN array application (3 h interval) and subsequent overnight incubation and iv) tissue homogenization and colony forming unit (CFU) quantification. Figure 8 also shows SEM images of the porcine skin before (Figure 8b,c) and after (Figure 8d,e) infection with MRSA. After infection, the skin is colonized by cocci organized in clusters typical of Staphylococcus. Interestingly, rod‐shaped microbes are present as well that are most likely Lactobacilli; bacteria common on healthy porcine skin.[ 52 ] Complete disinfection of the porcine skin cannot be achieved without significant destruction of tissue integrity, removal of the stratum corneum, and creation of large craters after MN insertion (Figure S7, Supporting Information). Moreover, healthy human skin is naturally colonized by a diverse microbiota,[ 53 ] so to preserve a high translational value of the ex vivo infection model, a mild disinfection and MRSA‐selective agar for CFU quantification was used.
Figure 8.
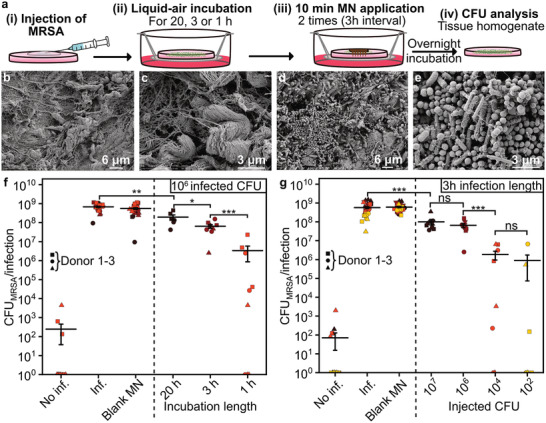
Infection of porcine skin with MRSA and effect of VAN‐MN application. a) Illustration of experimental set‐up, depicting the injection of MRSA followed by liquid‐air incubation for different time lengths. Afterwards, MN were applied for 10 min for two times with 3 h interval. After final overnight incubation, the skin was homogenized and analyzed for MRSA CFUs. b,c) SEM images of section of porcine skin before infection with MRSA at b) 5k and c) 20k magnification. d,e) SEM images of section of porcine skin after 22 h of MRSA infection at d) 5k and e) 20k magnification. f,g) CFU count of tissue homogenate of porcine skin after injection with MRSA. MN arrays were applied either without (blank MN) or with VAN. f) The first 100 µg VAN‐MN array was applied after varying times of infection (20, 3, or 1 h) followed by a second patch 3 h thereafter. g) The 3 h infection length was performed for different injected CFUs (102, 104, 106, 107). Each time condition was repeated in triplicates for up to three donors, n = 9. For visualization purpose in the log‐scale, zero CFU counts were plotted as values of one CFU count. Average with SE of the mean is plotted, student t‐test was performed against control of the same experimental group ** p < 0.01, *** p < 0.001.
Figure 8f shows the results of the CFU counts from MRSA‐infected skin homogenates after treatment of VAN as a function of the time between infection (106 CFU) and start of treatment. The bacterial killing was reduced with increasing establishment time for the infection prior to the first VAN‐MN treatment. Significant killing after two applications with 100 µg VAN‐MN of 99.5%, 89.5%, 73.4% is achieved for infections established for 1, 3, or 20 h, respectively. The infection length of 1 h results in a considerable variation which is likely caused by experimental variability of the injection and treatment locations. However, this uncertainty is reduced with increased infection establishment time. Furthermore, treatment with two additional VAN‐MN arrays did not further improve the bacterial growth reduction (Figure S8a, Supporting Information). This is in agreement with previous publications, showing that VAN has a time rather than concentration‐dependent effect.[ 10 ] Moreover, decreased killing with longer incubation time has been attributed to the possible formation of bacterial biofilm which can reduce antibiotic susceptibility.[ 54 ] Nevertheless, even for a 20 h incubation we could achieve statistically significant growth reduction with our VAN‐MN arrays.
In addition to the different durations of infection establishment, we also explored the effect of the initial inoculation of MRSA on killing efficiency. Figure 8g shows the CFU counts from skin homogenates after treatment with VAN‐MN arrays for different initial inoculations of MRSA with treatment start after 3 h. Decreasing the initial inoculation of MRSA improved bacterial killing following VAN‐MN application (89.0%, 89.5%, 99.6%, and 99.5% killing for 107, 106, 104, 102 injected CFU, respectively). However, if left untreated even low initial MRSA injections grew to similar densities as high initial injections. Plotting the percentage killing against the bacterial burden at the time of treatment start (Figure S8b, Supporting Information) shows that the amount of bacteria present at the start of treatment affects treatment success. These two findings indicate that in our model the VAN released from the MN array may inhibit the MRSA growth rather than killing established skin infections. Taking the results together, VAN‐MN can effectively be used for reduction of MRSA growth in skin indicating potential applicability for the developed MN arrays for MRSA eradication prior to medical intervention or in the treatment of early MRSA skin infections.
3. Conclusions
This work demonstrates the fabrication of MN arrays loaded with the antibiotic VAN to fight skin infections caused by MRSA. The VAN‐containing tips of the arrays consist of water‐soluble polymer (PVA) that allows effective drug release in the skin. The MN tips are supported by a water‐insoluble polymer layer (PMMA), in which VAN has poor solubility, facilitating precise drug dosage formulation. The developed VAN‐MN arrays can effectively penetrate through the dermal barrier of skin. The majority of the delivered VAN dose is retained in skin within 24 h. The locally delivered VAN is in active form and can reduce bacterial MRSA growth both in vitro and ex vivo. This local drug delivery platform enabled by the novel MN array design here may represent an effective treatment option of MRSA‐associated SSTIs. Such local VAN delivery reduces systemic VAN exposure thus minimizing side effects and the emergence of VAN‐resistant MRSA strains in uninfected body parts. To further explore the efficacy of the developed MN array drug delivery platform, future studies should focus on utilizing these arrays against in vivo skin infection animal models, such as humanized mouse models,[ 55 , 56 ] to investigate in detail the potential clinical translation.
4. Experimental Section
Fabrication of MN Arrays
VAN‐MN arrays were produced using a two‐step centrifugation method (Figure 1). In brief, selected concentrations of VAN (Sigma‐Aldrich) were dissolved in an aqueous blend of PVA (30 w/v%, 87–89% hydroxylation, MW 12–23k, Sigma‐Aldrich). VAN‐PVA (50 ± 1 mg) was added into silicone MN molds (H:600 µm, B:200 µm, 10 x 10, Micropoint Technology) and centrifuged at 3500 rpm for 30 min. Excess VAN‐PVA was removed from the molds with a spatula and subsequently centrifuged a second time to concentrate the drug‐polymer in the needles. The molds were left to dry at room temperature overnight. After drying, the water‐insoluble support layer made of PMMA in ethyl lactate (100 ± 5 mg, 40 w/v%, MW 120k, Sigma‐Aldrich) was added. The support was centrifuged for 10 min at 3500 rpm and dried overnight. In case of a water‐soluble support layer, an aqueous blend of PVP (40 w/v%, MW 360k, Sigma‐Aldrich) was added. For visualization purpose, the dye SR (75% dye content, Sigma‐Aldrich) was dissolved in the PVA needle matrix. The nominal dye or drug amount in the needles was calculated similarly to previous reports (Equation (1))[ 57 ]
| (1) |
where N is the amount of needle per array (100 needles), H is the height of the needles (600 µm), B is the length of the needle base (200 µm), ρPVA is the density of PVA (≈1.25 g cm−3), and c drug is the weight percentage of the drug or dye in the polymer mix (in μgdrug mgpolymer −1).
Determination of VAN Solubility in Polymers
The solubility of VAN in PVA, PVP, and PMMA was estimated by relating the measured melting point depression to the drug‐polymer solubility using the Flory–Huggins model.[ 58 ] For this, 100 mg physical mixtures of VAN and each polymer were prepared with mortar and pestle with different VAN concentrations (90, 85, 80, 75, and 70 wt%). The weights were corrected for the water content (previously determined with a thermogravimetric analyzer) of VAN and the respective polymer. Each mixture (3–5 mg) was placed in an aluminum pan with a perforated hermetically sealing lid in a DSC (Q2000, TA Instruments). A standard heating ramp of 1 °C min−1 to 220 °C was applied after equilibration at 100 °C for 10 min (to allow for water evaporation). The onset of melting was determined using the Trios software (version 5.1.1, TA Instruments). Additionally, the melting enthalpy of pure VAN was determined using the same method as described above and calculated from the integration of melting peak. The melting enthalpy was corrected for water content and degradation (previously determined with a thermogravimetric analyzer). Each run was conducted in duplicates. The raw data and estimated mean ± standard deviation (SD) were plotted.
Insertion Capabilities of MN Array in Parafilm
To determine the insertion capabilities of MN arrays with water‐insoluble PMMA support for different loadings of VAN, the VAN‐MN arrays were inserted with thumb pressure or spring applicator at 1.6 N force for 30 s into eight layers of Parafilm M, which was used as a skin model.[ 50 ] The layers were separated, imaged via stereomicroscopy, and the number of holes was counted.
Transverse Force as a Function of Displacement
Displacement of single needles after application of transverse force was measured with bond test equipment (Dage PC2400, Nordson DAGE). MN arrays were aligned so that the probe moved against a single needle horizontally with 50 µm s−1 at 300 µm height. Threshold, fallback, and overtravel were set to 10 mN, 30%, and 10 µm, respectively. Nine needles were measured per VAN loading for whole MN arrays, three needles were measured for the PMMA core (obtained via dissolution of MN arrays) only.
Collection of Skin Samples
Full‐thickness neonatal porcine skin was obtained from stillborn piglets from a local breeder, for which ethical permission is not required (Swedish Board of Agriculture), stored (−20 °C) and thawed in PBS (0.1 m, pH 7.4) at room temperature prior to use. Hair was cut short with scissors. Fresh human skin from healthy subjects was received from the Department of Reconstructive Plastic Surgery, Karolinska University Hospital, Stockholm, Sweden. Samples were collected according to the Declaration of Helsinki Principles (regional ethical committee of Stockholm, reference no. 2012/50‐31/2). Signed consent forms were collected for all patients. The fresh human skin (kept at 4 °C) was used within 2 days after excision.
Insertion Capabilities of MN Arrays in Skin
SR‐loaded or VAN‐loaded (100 µg) MN arrays were inserted into the skin. When using porcine skin, the MN arrays were inserted with thumb pressure or with the use of a spring applicator at 1.6 N force and 2 m s–1 while the skin was immobilized. In case of the human skin, MN arrays were applied with the use of the applicator. After insertion, skin samples were collected and frozen (−80 °C). The samples were embedded in optimal cutting temperature medium (OCT) and cut into sections (10 µm) via cryostat (ThermoFisher Scientific). Fresh human skin samples were stained with an anti‐collagen‐4 mouse (dilution 1:300, Cell Signaling Technology, USA) and visualized with Alexa Fluor 594 goat anti‐mouse. Sections were mounted with mounting medium containing 4′,6‐diamidino‐2‐phenylindole (Vector Laboratories). Bright‐field and fluorescence microscopy was performed with a widefield microscope (Nikon).
Ex Vivo Dermatokinetic Study
The permeation of VAN into and across neonatal porcine skin after MN insertion was analyzed using Franz diffusion cell assays.[ 59 ] VAN‐MN (100 µg) were inserted in thawed porcine skin with the thumb for 30 s and left on the skin samples for a total of 10 min or 24 h. The skin with inserted MN was mounted on heat‐controlled (37 °C) Franz cells containing PBS (8 mL). The MNs were kept in place with a weight (5 g). At selected time points (30 min, 1, 2, 4, 6, 8, 12, and 24 h), 300 µL samples were withdrawn and replaced with fresh PBS. The MN arrays after insertion were obtained and dissolved in PBS to calculate the remaining VAN in the MN array. After termination of the experiment, 12 mm skin sections were obtained in the area of Franc cell orifices, cut into small pieces, lysed in the Fastprep using lysing matrix (type M, 6.0 m s−1, 6 x 20 s, MP Biomedicals) in 1 mL PBS and the supernatant was obtained after centrifugation. All samples were filtered through 10k MW cut‐off filters (14k g, 20 min, VWR). Filtrates were analyzed for VAN content using UV‐detection in revered‐phase HPLC (1260, Agilent). The isocratic detection method was reported previously.[ 60 ] In brief, NH4H2PO4 (50 × 10−3 m, pH 4) and acetonitrile (92:8) were fed at 1 mL min−1 into Nucleosil C18 column (5 µm particle size, 15 cm length, 4.6 mm inner diameter, Sigma‐Aldrich). The column temperature was maintained at 40 °C, injection volume was 20 µL, run time 11 min, and detection was performed at 220 nm referenced against 360 nm. Retention time of VAN was detected at around 9 min and the concentration of VAN was calculated via linear correlation of concentration to peak area of a VAN standard (0.05–2 µg mL−1). Accumulative released or retained amount in and across the skin from Franz diffusion samples was calculated and the mean of six replicates ± SD was plotted.
In Vitro Agar Diffusion Test of VAN‐MN
The agar diffusion test from VAN‐MN against bacterial lawn of MRSA (SF8300 USA300‐0114) was performed following the guidelines of the European Committee of Antimicrobial Susceptibility Testing (EUCAST).[ 61 , 62 ] In brief, VAN‐loaded MNs were produced at selected concentrations. Positive controls with the same area as the MN arrays were prepared from Whatman paper, 10 µL of corresponding VAN concentrations in water were applied and dried (37 °C, 10 min). MRSA was cultured on Luria agar overnight, a single colony was suspended in saline and diluted to 0.5 McFarland turbidity. Using a sterile cotton swab, the MRSA bacterial lawn was spread onto Mueller‐Hinton agar plates. MN arrays and positive controls were applied onto the lawn, and the MN arrays were removed after 5 min application. Plates were incubated (18 ± 2 h, 37 °C) and inhibition zones were measured using a caliper, the mean of three or six replicates ± SD for positive control and MN arrays, respectively, was plotted. Nonlinear regression for zero‐ and first‐order kinetics was fitted. Plates were imaged using white light in darkroom (ChemiDoc, Bio‐Rad).
Ex Vivo Antimicrobial Activity of VAN‐MN
To assess the antimicrobial activity of VAN released from MN arrays against MRSA ex vivo, porcine skin was infected with MRSA similarly as described previously.[ 54 , 63 , 64 ] In detail, MRSA was cultured overnight (37 °C) on Luria agar and multiple colonies were resuspended in PBS. Optical density (OD600nm) was correlated to corresponding CFU and adjusted accordingly. Thawed porcine skin sections (10 mm) were cleaned shortly by dipping in 70% EtOH. 5 µL MRSA solution was injected intradermally utilizing a 10 µL syringe (26 gauge, Hamilton) for different amounts of CFUs (102, 104, 106, 107). For the noninfected controls, 5 µL of PBS was injected instead. The skin samples were incubated in air–liquid interface on CO2 independent medium (GIBCO) supplemented with glutamax (1%, Thermo Fisher Scientific) and fetal bovine serum (10%, Sigma‐Aldrich) at 37 °C for different lengths (1, 3, or 20 h). Afterward, VAN‐MN arrays (100 or 0 µg for the control) were inserted with thumb pressure for 30 s and kept on skin for 10 min with weights (5 g). The treatment was repeated (3 h interval) for a total of two or four treatment applications. The skin was incubated for a total of 22 h (for 1 and 3 h infection) or for 42 h (for 20 h infection). After termination, skin samples were lysed in the Fastprep using the lysing matrix (type M, 6.0 m s−1, 3 × 20 s) in 500 µL PBS. 1:10 dilutions were performed to a total dilution of 10−7, and 100 µL of selected dilutions were plated on MRSA II Select (Bio‐Rad). Plates were incubated overnight (37 °C) and CFU were counted for at least two dilution duplicates. Experiments were repeated three times with triplicates of noninfected, infected, no‐treatment, and blank MN control. All data points were plotted with their respective mean ± standard error (SE). Statistical analysis was performed utilizing the two‐sample t‐test at significance interval of p < 0.05 against the specific control group. One outlier in 102 infection group was excluded based on Grupps's test.
Scanning Electron Microscopy
SEMs were obtained for VAN‐MN arrays before and after dissolution in PBS and after 10 min insertion in porcine skin. MNs were sputter‐coated with carbon nanolayer and imaged with the Phenom Pharos SEM (Thermo Fisher Scientific). SEMs of the infected porcine tissue were performed on porcine skin after injection of 5 µL PBS (no infection) or 106 CFU MRSA and incubated for 1, 3, or 20 h. The samples were fixed using glutaraldehyde (2.5%) in PBS. The fixed samples were washed in ultrapure water prior to stepwise ethanol dehydration and critical‐point‐drying using carbon dioxide (Leica EM CPD 030). The samples were then oriented and mounted on specimen stubs using carbon adhesive tabs and sputter coated with platinum (Quorum Q150T ES). SEM images were acquired using an Ultra 55 field emission SEM (Zeiss) at 5 kV and the SE2 detector.
Conflict of Interest
The authors declare no conflict of interest.
Supporting information
Supporting Information
Acknowledgements
This research had received funding from the European Research Council (ERC) under the European Union's Horizon 2020 research and innovation program (ERC Grant agreement no. 758705). The authors gratefully acknowledge funding from NordForsk (Nordic University Hub project no. 85352; Nordic POP). Funding from the Karolinska Institutet Faculty Board, the Swedish Research Council (2016‐03471), the Torsten Söderberg Foundation (M87/18), and the Swedish Foundation for Strategic Research (FFL18‐0043) is kindly acknowledged. The authors thank Edmund Loh and Christel Bergstrom for access to laboratory equipment, Shno Asad for support with method development, and Anneli Julander and Klara Midander for provision and help with processing of materials. The authors also thank the electron microscopy unit (EMil) from Karolinska Institutet for SEM images. Finally, the authors thank Birgitta Henriques‐Normark, Staffan Normark, and the BHN group (KI) for the insightful discussions.
Ziesmer J., Tajpara P., Hempel N.‐J., Ehrström M., Melican K., Eidsmo L., Sotiriou G. A., Vancomycin‐Loaded Microneedle Arrays against Methicillin‐Resistant Staphylococcus Aureus Skin Infections. Adv. Mater. Technol. 2021, 6, 2001307. 10.1002/admt.202001307
Data Availability Statement
Research data are not shared.
References
- 1. Ki V., Rotstein C., Can. J. Infect. Dis. Med. Microbiol. 2008, 19, 173. [DOI] [PMC free article] [PubMed] [Google Scholar]
- 2. Abhilash K. P., Varghese S., Curr. Med. Issues 2019, 17, 30. [Google Scholar]
- 3. Miller L. G., Eisenberg D. F., Liu H., Chang C.‐L. L., Wang Y., Luthra R., Wallace A., Fang C., Singer J., Suaya J. A., BMC Infect. Dis. 2015, 15, 362. [DOI] [PMC free article] [PubMed] [Google Scholar]
- 4. Tun K., Shurko J. F., Ryan L., Lee G. C., PLoS One 2018, 13, e0206893. [DOI] [PMC free article] [PubMed] [Google Scholar]
- 5. Pallin D. J., Egan D. J., Pelletier A. J., Espinola J. A., Hooper D. C., Camargo C. A., Ann. Emerg. Med. 2008, 51, 291. [DOI] [PubMed] [Google Scholar]
- 6. Hersh A. L., Arch. Intern. Med. 2008, 168, 1585. [DOI] [PubMed] [Google Scholar]
- 7. Esposito S., Noviello S., Leone S., Curr. Opin. Infect. Dis. 2016, 29, 109. [DOI] [PubMed] [Google Scholar]
- 8. Kaye K. S., Petty L. A., Shorr A. F., Zilberberg M. D., Clin. Infect. Dis. 2019, 68, S193. [DOI] [PMC free article] [PubMed] [Google Scholar]
- 9. Dryden M. S., Int. J. Antimicrob. Agents 2009, 34, S2. [DOI] [PubMed] [Google Scholar]
- 10. Savoldi A., Azzini A. M., Baur D., Tacconelli E., Curr. Opin. Infect. Dis. 2018, 31, 120. [DOI] [PubMed] [Google Scholar]
- 11. Soriano A., Rossolini G. M., Pea F., Expert Rev. Anti‐Infect. Ther. 2020, 18, 415. [DOI] [PubMed] [Google Scholar]
- 12. Bal A. M., David M. Z., Garau J., Gottlieb T., Mazzei T., Scaglione F., Tattevin P., Gould I. M., J. Glob. Antimicrob. Resist. 2017, 10, 295. [DOI] [PubMed] [Google Scholar]
- 13. Russo A., Concia E., Cristini F., De Rosa F. G., Esposito S., Menichetti F., Petrosillo N., Tumbarello M., Venditti M., Viale P., Viscoli C., Bassetti M., Clin. Microbiol. Infect. 2016, 22, 466. [DOI] [PubMed] [Google Scholar]
- 14. Moellering R. C., J. Antimicrob. Chemother. 1984, 14, 43. [DOI] [PubMed] [Google Scholar]
- 15. Bos J. D., Meinardi M. M. H. M., Exp. Dermatol. 2000, 9, 165. [DOI] [PubMed] [Google Scholar]
- 16. Skhirtladze K., Hutschala D., Fleck T., Thalhammer F., Ehrlich M., Vukovich T., Müller M., Tschernko E. M., Antimicrob. Agents Chemother. 2006, 50, 1372. [DOI] [PMC free article] [PubMed] [Google Scholar]
- 17. Shariati A., Dadashi M., Moghadam M. T., van Belkum A., Yaslianifard S., Darban‐Sarokhalil D., Sci. Rep. 2020, 10, 12689. [DOI] [PMC free article] [PubMed] [Google Scholar]
- 18. Gardete S., Tomasz A., J. Clin. Invest. 2014, 124, 2836. [DOI] [PMC free article] [PubMed] [Google Scholar]
- 19. Zhang S., Sun X., Chang W., Dai Y., Ma X., PLoS One 2015, 10, e0136082. [DOI] [PMC free article] [PubMed] [Google Scholar]
- 20. Chang S., Sievert D. M., Hageman J. C., Boulton M. L., Tenover F. C., Downes F. P., Shah S., Rudrik J. T., Pupp G. R., Brown W. J., Cardo D., Fridkin S. K., N. Engl. J. Med. 2003, 348, 1342. [DOI] [PubMed] [Google Scholar]
- 21. Farber B. F., Moellering R. C., Antimicrob. Agents Chemother. 1983, 23, 138. [DOI] [PMC free article] [PubMed] [Google Scholar]
- 22. Jeffres M. N., Isakow W., Doherty J. A., Micek S. T., Kollef M. H., Clin. Ther. 2007, 29, 1107. [DOI] [PubMed] [Google Scholar]
- 23. Liu J., Wang Z., Li F., Gao J., Wang L., Huang G., Asian J. Pharm. Sci. 2015, 10, 212. [Google Scholar]
- 24. Yang Z., Liu J., Gao J., Chen S., Huang G., Int. J. Pharm. 2015, 495, 508. [DOI] [PubMed] [Google Scholar]
- 25. Yousry C., Fahmy R. H., Essam T., El‐laithy H. M., Elkheshen S. A., Drug Dev. Ind. Pharm. 2016, 42, 1752. [DOI] [PubMed] [Google Scholar]
- 26. Xu J., Xu B., Shou D., Xia X., Hu Y., Polymers 2015, 7, 1850. [Google Scholar]
- 27. Hassan D., Omolo C. A., Gannimani R., Waddad A. Y., Mocktar C., Rambharose S., Agrawal N., Govender T., Int. J. Pharm. 2019, 558, 143. [DOI] [PubMed] [Google Scholar]
- 28. Salih M., Omolo C. A., Devnarain N., Elrashedy A. A., Mocktar C., Soliman M. E. S., Govender T., Pharm. Dev. Technol. 2020, 25, 1090. [DOI] [PubMed] [Google Scholar]
- 29. Omolo C. A., Kalhapure R. S., Jadhav M., Rambharose S., Mocktar C., Ndesendo V. M. K., Govender T., Eur. J. Pharm. Biopharm. 2017, 112, 96. [DOI] [PubMed] [Google Scholar]
- 30. Mohammed M. I., Makky A. M. A., Teaima M. H. M., Abdellatif M. M., Hamzawy M. A., Khalil M. A. F., Drug Delivery 2016, 23, 297. [DOI] [PubMed] [Google Scholar]
- 31. Mohammed M. I., Makky A. M. A., Abdellatif M. M., Int. J. Pharm. Pharm. Sci. 2014, 6, 190. [Google Scholar]
- 32. Jain K. K., Methods Mol. Biol. 2008, 437, 1. [DOI] [PubMed] [Google Scholar]
- 33. Singh P., Carrier A., Chen Y., Lin S., Wang J., Cui S., Zhang X., J. Controlled Release 2019, 315, 97. [DOI] [PubMed] [Google Scholar]
- 34. Cheung K., Das D. B., Drug Delivery 2014, 23, 2338. [DOI] [PubMed] [Google Scholar]
- 35. Prausnitz M. R., Adv. Drug Delivery Rev. 2004, 56, 581. [DOI] [PubMed] [Google Scholar]
- 36. Jamaledin R., Yiu C. K. Y., Zare E. N., Niu L., Vecchione R., Chen G., Gu Z., Tay F. R., Makvandi P., Adv. Mater. 2020, 32, 2002129. [DOI] [PubMed] [Google Scholar]
- 37. Ramadon D., Permana A. D., Courtenay A. J., McCrudden M. T. C., Tekko I. A., McAlister E., Anjani Q. K., Utomo E., McCarthy H. O., Donnelly R. F., Mol. Pharmaceutics 2020, 17, 3353. [DOI] [PubMed] [Google Scholar]
- 38. Chu L. Y., Choi S.‐O., Prausnitz M. R., J. Pharm. Sci. 2010, 99, 4228. [DOI] [PubMed] [Google Scholar]
- 39. Wang Q. L., Zhu D. D., Liu X. B., Chen B. Z., Guo X. D., Sci. Rep. 2016, 6, 1.28442746 [Google Scholar]
- 40. Donnelly R., Brady A., in Nanoscience in Dermatology (Eds: Hamblin M. R., Avci P., Prow T. W.), Elsevier, New York: 2016, pp. 47–56. [Google Scholar]
- 41. Liu S., Wu D., Quan Y. S., Kamiyama F., Kusamori K., Katsumi H., Sakane T., Yamamoto A., Mol. Pharmaceutics 2016, 13, 272. [DOI] [PubMed] [Google Scholar]
- 42. Korkmaz E., Friedrich E. E., Ramadan M. H., Erdos G., Mathers A. R., Burak O., Ozdoganlar, Washburn N. R., Falo L. D., Acta Biomater. 2015, 24, 96. [DOI] [PMC free article] [PubMed] [Google Scholar]
- 43. Zhao X., Li X., Zhang P., Du J., Wang Y., J. Controlled Release 2018, 286, 201. [DOI] [PubMed] [Google Scholar]
- 44. Kim J. Y., Han M. R., Kim Y. H., Shin S. W., Nam S. Y., Park J. H., Eur. J. Pharm. Biopharm. 2016, 105, 148. [DOI] [PubMed] [Google Scholar]
- 45. Chu L. Y., Prausnitz M. R., J. Controlled Release 2011, 149, 242. [DOI] [PMC free article] [PubMed] [Google Scholar]
- 46. Seong K. Y., Seo M. S., Hwang D. Y., O'Cearbhaill E. D., Sreenan S., Karp J. M., Yang S. Y., J. Controlled Release 2017, 265, 48. [DOI] [PubMed] [Google Scholar]
- 47. Chen M. C., Huang S. F., Lai K. Y., Ling M. H., Biomaterials 2013, 34, 3077. [DOI] [PubMed] [Google Scholar]
- 48. Ito Y., Hirono M., Fukushima K., Sugioka N., Takada K., Int. J. Pharm. 2012, 436, 387. [DOI] [PubMed] [Google Scholar]
- 49. Jeong H. R., Kim J. Y., Kim S. N., Park J. H., Eur. J. Pharm. Biopharm. 2018, 127, 237. [DOI] [PubMed] [Google Scholar]
- 50. Larrañeta E., Moore J., Vicente‐Pérez E. M., González‐Vázquez P., Lutton R., Woolfson A. D., Donnelly R. F., Int. J. Pharm. 2014, 472, 65. [DOI] [PMC free article] [PubMed] [Google Scholar]
- 51. Tong S. Y. C., Davis J. S., Eichenberger E., Holland T. L., Fowler V. G., Clin. Microbiol. Rev. 2015, 28, 603. [DOI] [PMC free article] [PubMed] [Google Scholar]
- 52. Strube M. L., Hansen J. E., Rasmussen S., Pedersen K., Sci. Rep. 2018, 8, 12751. [DOI] [PMC free article] [PubMed] [Google Scholar]
- 53. Byrd A. L., Belkaid Y., Segre J. A., Nat. Rev. Microbiol. 2018, 16, 143. [DOI] [PubMed] [Google Scholar]
- 54. Rancan F., Contardi M., Jurisch J., Blume‐Peytavi U., Vogt A., Bayer L. S., Schaudinn C., Pharmaceutics 2019, 11, 527. [DOI] [PMC free article] [PubMed] [Google Scholar]
- 55. Melican K., Duménil G., Future Microbiol. 2013, 8, 567. [DOI] [PubMed] [Google Scholar]
- 56. Melican K., Aubey F., Duménil G., J. Visualized Exp. 2014, 86, 511343791. [DOI] [PMC free article] [PubMed] [Google Scholar]
- 57. Permana A. D., McCrudden M. T. C., Donnelly R. F., Pharmaceutics 2019, 11, 346. [DOI] [PMC free article] [PubMed] [Google Scholar]
- 58. Knopp M. M., Tajber L., Tian Y., Olesen N. E., Jones D. S., Kozyra A., Löbmann K., Paluch K., Brennan C. M., Holm R., Healy A. M., Andrews G. P., Rades T., Mol. Pharmaceutics 2015, 12, 3408. [DOI] [PubMed] [Google Scholar]
- 59. Finnin B., Walters K. A., Franz T. J., in Topical and Transdermal Drug Delivery: Principles and Practice (Eds: Benson H. A. E., Watkinson A. C.), John Wiley & Sons, Inc., New York: 2012, pp. 85–108. [Google Scholar]
- 60. de Jesús Valle M. J., López F. G., Navarro A. S., J. Pharm. Biomed. Anal. 2008, 48, 835. [DOI] [PubMed] [Google Scholar]
- 61. Matuschek E., Brown D. F. J., Kahlmeter G., Clin. Microbiol. Infect. 2014, 20, O255. [DOI] [PubMed] [Google Scholar]
- 62. Tenover F. C., McDougal L. K., Goering R. V., Killgore G., Projan S. J., Patel J. B., Dunman P. M., J. Clin. Microbiol. 2006, 44, 108. [DOI] [PMC free article] [PubMed] [Google Scholar]
- 63. Schaudinn C., Dittmann C., Jurisch J., Laue M., Günday‐Türeli N., Blume‐Peytavi U., Vogt A., Rancan F., PLoS One 2017, 12, e0186946. [DOI] [PMC free article] [PubMed] [Google Scholar]
- 64. Schulz A., Jiang L., de Vor L., Ehrström M., Wermeling F., Eidsmo L., Melican K., Cell Rep. 2019, 29, 1074. [DOI] [PubMed] [Google Scholar]
Associated Data
This section collects any data citations, data availability statements, or supplementary materials included in this article.
Supplementary Materials
Supporting Information
Data Availability Statement
Research data are not shared.