

Abstract
Despite significant advances in HIV treatment over the past 30 years, critical barriers to an HIV cure persist. The HIV reservoir, defined at both the cellular and anatomical level, constitutes the main barrier to cure. While the mechanisms underlying the reservoir are not yet well understood, one theory to explain persistence at the anatomical level is that subtherapeutic exposure to antiretroviral therapy (ART) within certain tissue compartments permits ongoing replication. Characterizing ART pharmacology throughout the body is important in the context of these potential pharmacologic sanctuaries and for maximizing the probability of success with forthcoming cure strategies that rely on latency reversal and require ART to prevent reseeding the reservoir. In this review, we provide a comprehensive overview of ART and LRA distribution at the site of action for HIV cure (i.e. anatomical sites commonly associated with HIV persistence, such as lymphoid organs and the central nervous system). We also discuss methodologic approaches that provide insight into HIV cure pharmacology, including experimental design and advances within the computational, pharmaceutical, and analytical chemistry fields. The information discussed in this review will assist in streamlining the development of investigational cure strategies by providing a roadmap to ensure therapeutic exposure within the site of action for HIV cure.
Keywords: HIV Cure, Antiretroviral, Pharmacology, Distribution
Introduction to an HIV Cure
Since the introduction of highly active antiretroviral therapy (HAART) in 1996, HIV treatment has advanced from taking multiple pills, multiple times a day to single tablet, once daily regimens. However, despite initial optimism that early treatment and sustained virologic suppression with modern antiretroviral therapy (ART) might eradicate and cure HIV, viral rebound has been uniformly described in people living with HIV (PLWH) who stop ART and typically occurs within 2–3 weeks of cessation. Chun et al. first described the underlying mechanism of this rebound as the HIV reservoir, a pool of long-lived, resting CD4+ T cells harboring transcriptionally silent, replication competent proviral DNA.1 Since this sentinel report, Perelson et al utilized mathematical modeling to predict that 70 years of complete virologic suppression would be required to clear all proviral DNA within a PLWH by ART alone.2 A recent study identified that the half-life of replication-competent proviral DNA is significantly shorter when compared to total proviral DNA (6.5 vs 22.9 years, respectively) suggesting that this early prediction (predicated on total proviral DNA measurements) may be overly conservative.3 To date, two patients are believed to have been cured of HIV following bone marrow transplantation. These cases provide the impetus that cure is achievable, and their details are described in the Identifying an HIV Cure section below.
HIV cure strategies currently under investigation can be classified based on 2 categories of goal. A sterilizing cure aims to completely eradicate HIV from the host, while a functional cure aims to achieve long-term, medication-free remission despite persistence of replication competent virus.4 The “Kick and Kill” strategy (also known as “Shock and Clear”) proposes to achieve a sterilizing cure by reactivating latent virus thereby targeting infected cells for clearance by natural or engineered immune effector mechanisms.4 Thirteen unique latency reversal agents (LRAs) from 6 mechanistic classes have been tested in completed or actively enrolling clinical trials.5 While, to date, LRAs demonstrate only modest ability to induce latent virus in the blood of PLWH, activation of the non-canonical NF-κB signaling pathway by an investigational compound called AZD5582 has demonstrated strong reactivation of latent virus. In this study reactivation was measured by quantifiable simian immunodeficiency virus (SIV)-and HIV-RNA in blood and lymphoid tissues (such as the lymph nodes and spleen) of chronically infected, ART-suppressed nonhuman primates (NHP) and humanized mice, respectively.6 These data provide compelling proof of concept that the HIV reservoir can be induced out of latency within tissues. Proposed clearance interventions (the Kill in this strategy) largely center on broadly neutralizing antibodies and T cell vaccines, which have been reviewed in detail elsewhere.4 A final essential consideration of this Kick and Kill strategy is the ability of ART to completely inhibit HIV entry and integration within all compartments of the body to prevent uninfected cells from becoming infected upon reactivation of latent HIV.
Gene editing with CRISPR/Cas9 has also been explored to epigenetically silence HIV by excising proviral DNA (either in part or in total) from infected cells.4 Some experts have proposed using gene editing to augment the Kick and Kill approach by reducing the burden of latent virus that must be reactivated. Additionally, gene editing may be paired with the leading functional cure paradigm, “Block and Lock”, which aims to achieve deep latency by locking the promoter region of the proviral DNA thereby inhibiting downstream transcription and replication events independently of ART.4 These different Cure strategies are represented graphically in Figure 1.
Figure 1.
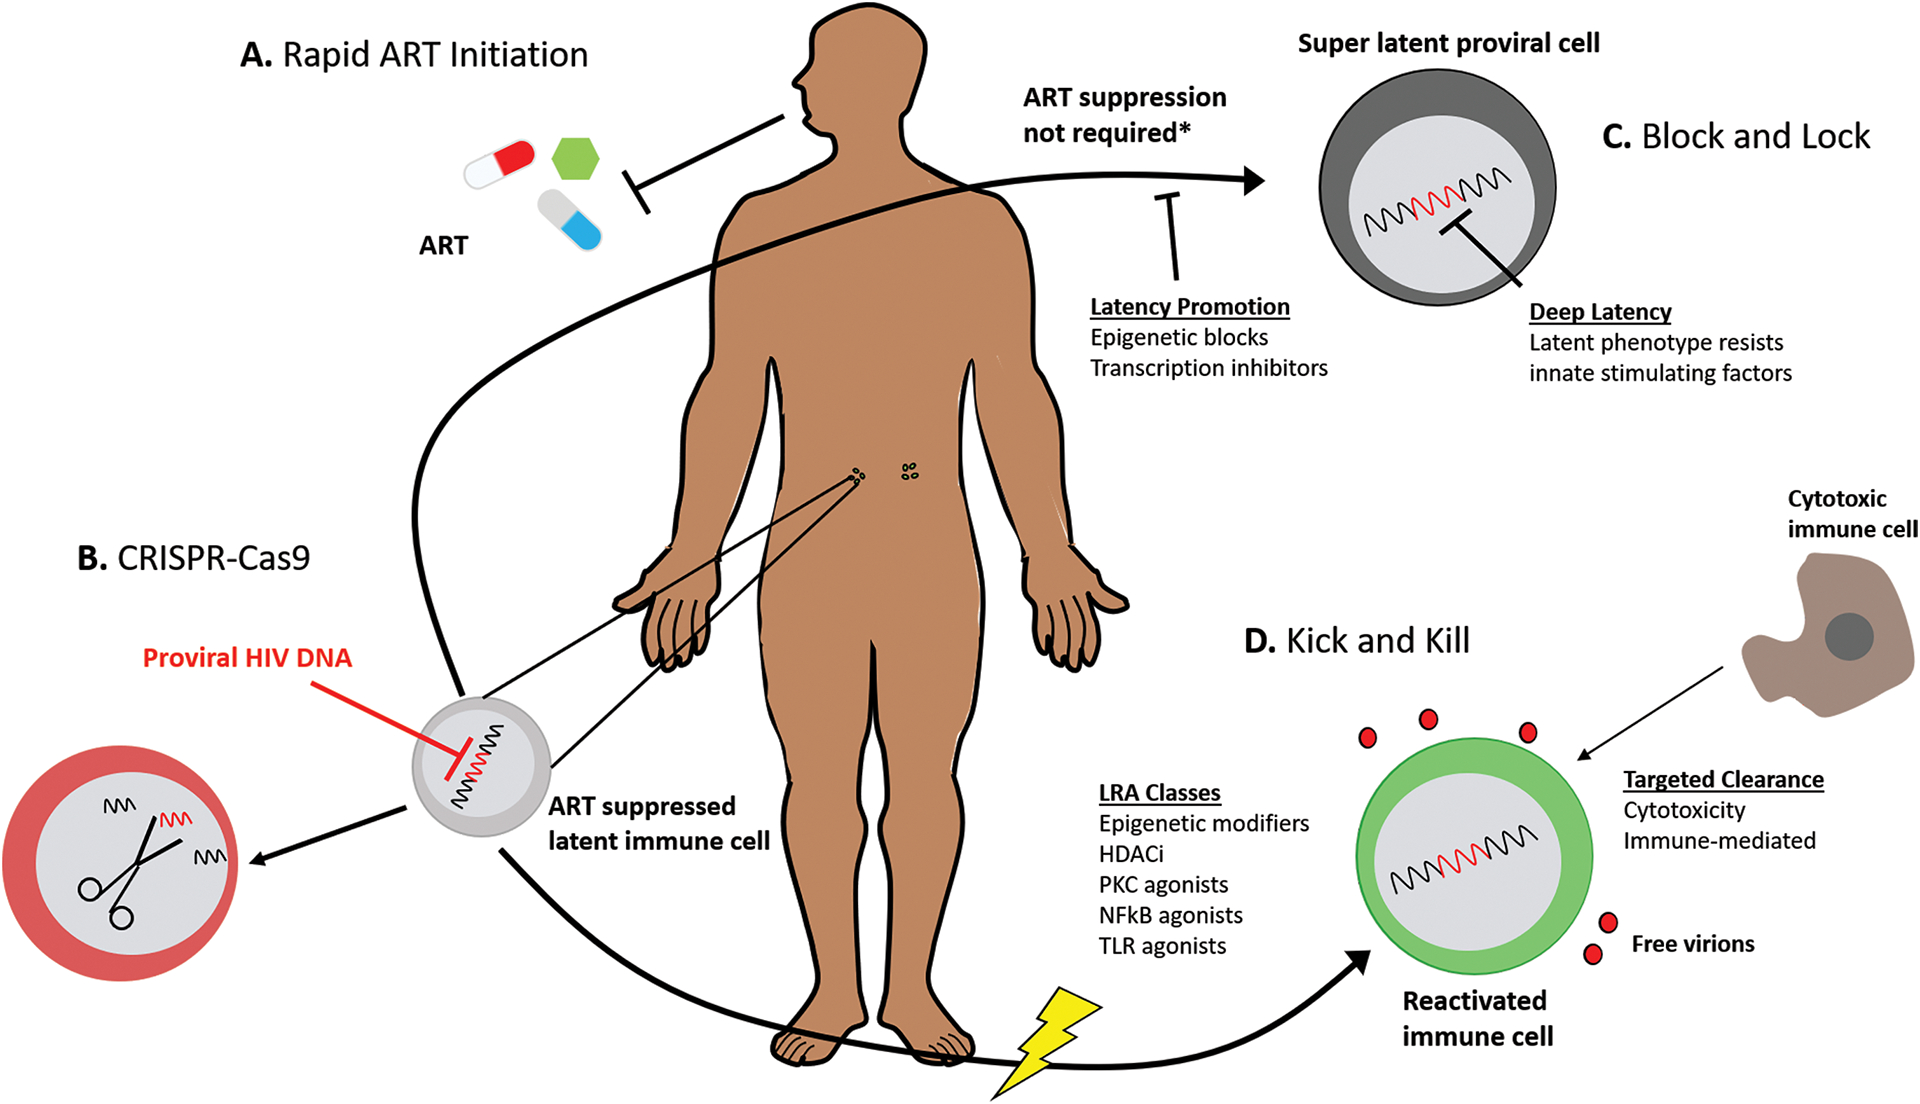
Investigational Strategies to Impede and/or Eradicate the HIV Reservoir
(a) Rapid ART initiation during the hyperacute phase of HIV infection has been proposed to restrict formation of the HIV reservoir; (b) CRISPR-Cas9 gene editing technology has been proposed to excise fragments of integrated proviral DNA rendering latent virus non-infectious; (c) Block & Lock would use xenobiotics to force the HIV reservoir into deep latency that resists reactivation by natural stimulating factors; (d) Kick and Kill would use xenobiotics to reactivate latent virus thereby targeting infected cells for clearance by natural or engineered immune mechanisms. ART: antiretroviral therapy; CRISPR: clustered regularly interspaced short palindromic repeats; Cas9 – CRISPR associated protein 9; LRA: latency reversal agent; HDACi: histone deacetylase inhibitors; PKC: protein kinase C; NF-κb: nuclear factor kappa-light-chain-enhancer of activated B cells; TLR: toll-like receptor.
Sites of Action: Defining the HIV Reservoir
Understanding why and where HIV persists in PLWH on suppressive ART is a critical component to designing therapeutic cure strategies targeted to the site of action. The mechanisms of persistence have been widely debated and largely fall into 2 categories: 1) latently infected cells are extremely long lived and/or undergo clonal expansion; or 2) inadequate ART permits ongoing replication within pharmacologic sanctuaries. While in truth some combination of these two theories may explain HIV persistence, for the purposes of this review they will be discussed distinctly in the context of the latent reservoir (the former theory) and the active reservoir (the latter theory).
The Latent Reservoir
Latency is generally recognized as a relatively rare event within an individual that is catalyzed by a combination of virus and host factors.7 At the cellular level, experts define the latent reservoir as: a cell which does not express viral particles at one moment in time but can be induced to express infectious viral particles.8 The field generally agrees that resting, central memory CD4+ T cells are the major component of the latent reservoir but evidence does exist that other cellular phenotypes may meet this definition including, other CD4+ T cell subsets (naïve and transitional memory), stem memory T cells, macrophages, microglia and astrocytes.8 At the anatomical level, the latent reservoir may be defined as organs or tissues that harbor latently infected cells. The inability to observe the initial virus following a reactivation event makes identifying this reservoir extremely difficult, and there is little consensus about the exact anatomical location of the latent reservoir. Some experts contend that tissues in which central memory CD4+ T cells reside (the secondary lymphoid organs including, lymph nodes, spleen and gut mucosa) likely house the latent reservoir. However, recent investigation characterizing the genotype of full-length envelope HIV DNA at the time of death in 4 PLWH suppressed on ART demonstrates that near intact (and presumably replication competent) virus was present in all 28 types of tissues sampled, including anatomical compartments not frequently associated with the presence of central, memory CD4+ T cells such as the heart, liver, kidneys and reproductive organs.9 The study also revealed that multiple peripheral tissue sites could serve as a hub of dissemination (with the blood and lymphoid tissue being the major conduit) for rebounding virus in 2 PLWH that elected to stop ART near the time of death.9 These findings are suggestive that either alternative cellular phenotypes comprise the latent reservoir or that ongoing replication within these peripheral tissues occurs.
The Active Reservoir
The proposed mechanism of the active reservoir is that heterogenous distribution of ART within tissues leads to subtherapeutic concentrations that permit ongoing viral replication despite suppressing plasma viremia.10 This hypothesis remains controversial, because the length of time that someone remains on ART does not correlate with the development of ART resistance as would be expected given subtherapeutic exposure. Some investigators have reconciled this by postulating that ART resistance is only developed if the mutation (typically associated with a cost to viral fitness) confers a survival advantage over wildtype virus and that this may not be the case if concentrations are extremely subtherapeutic.11 The best evidence for ongoing replication is compartmentalization (or virus that is replication competent and genomically dissimilar from the strain observed in other anatomical compartments) in PLWH on suppressive ART based on viral sequencing. Anatomical compartments where such evidence exists include the central nervous system12 and lymphoid tissues (lymph nodes9, spleen9,13, and gut-associated lymphoid tissue9,14) and the corresponding measures of viral diversity range from differences in full-length env and nef DNA sequences as well as ART-resistant mutations. These findings of compartmentalization are suggestive that HIV replication and the corresponding genetic drift occur in an isolated fashion within some tissues despite seemingly suppressive ART (Figure 2).
Figure 2.
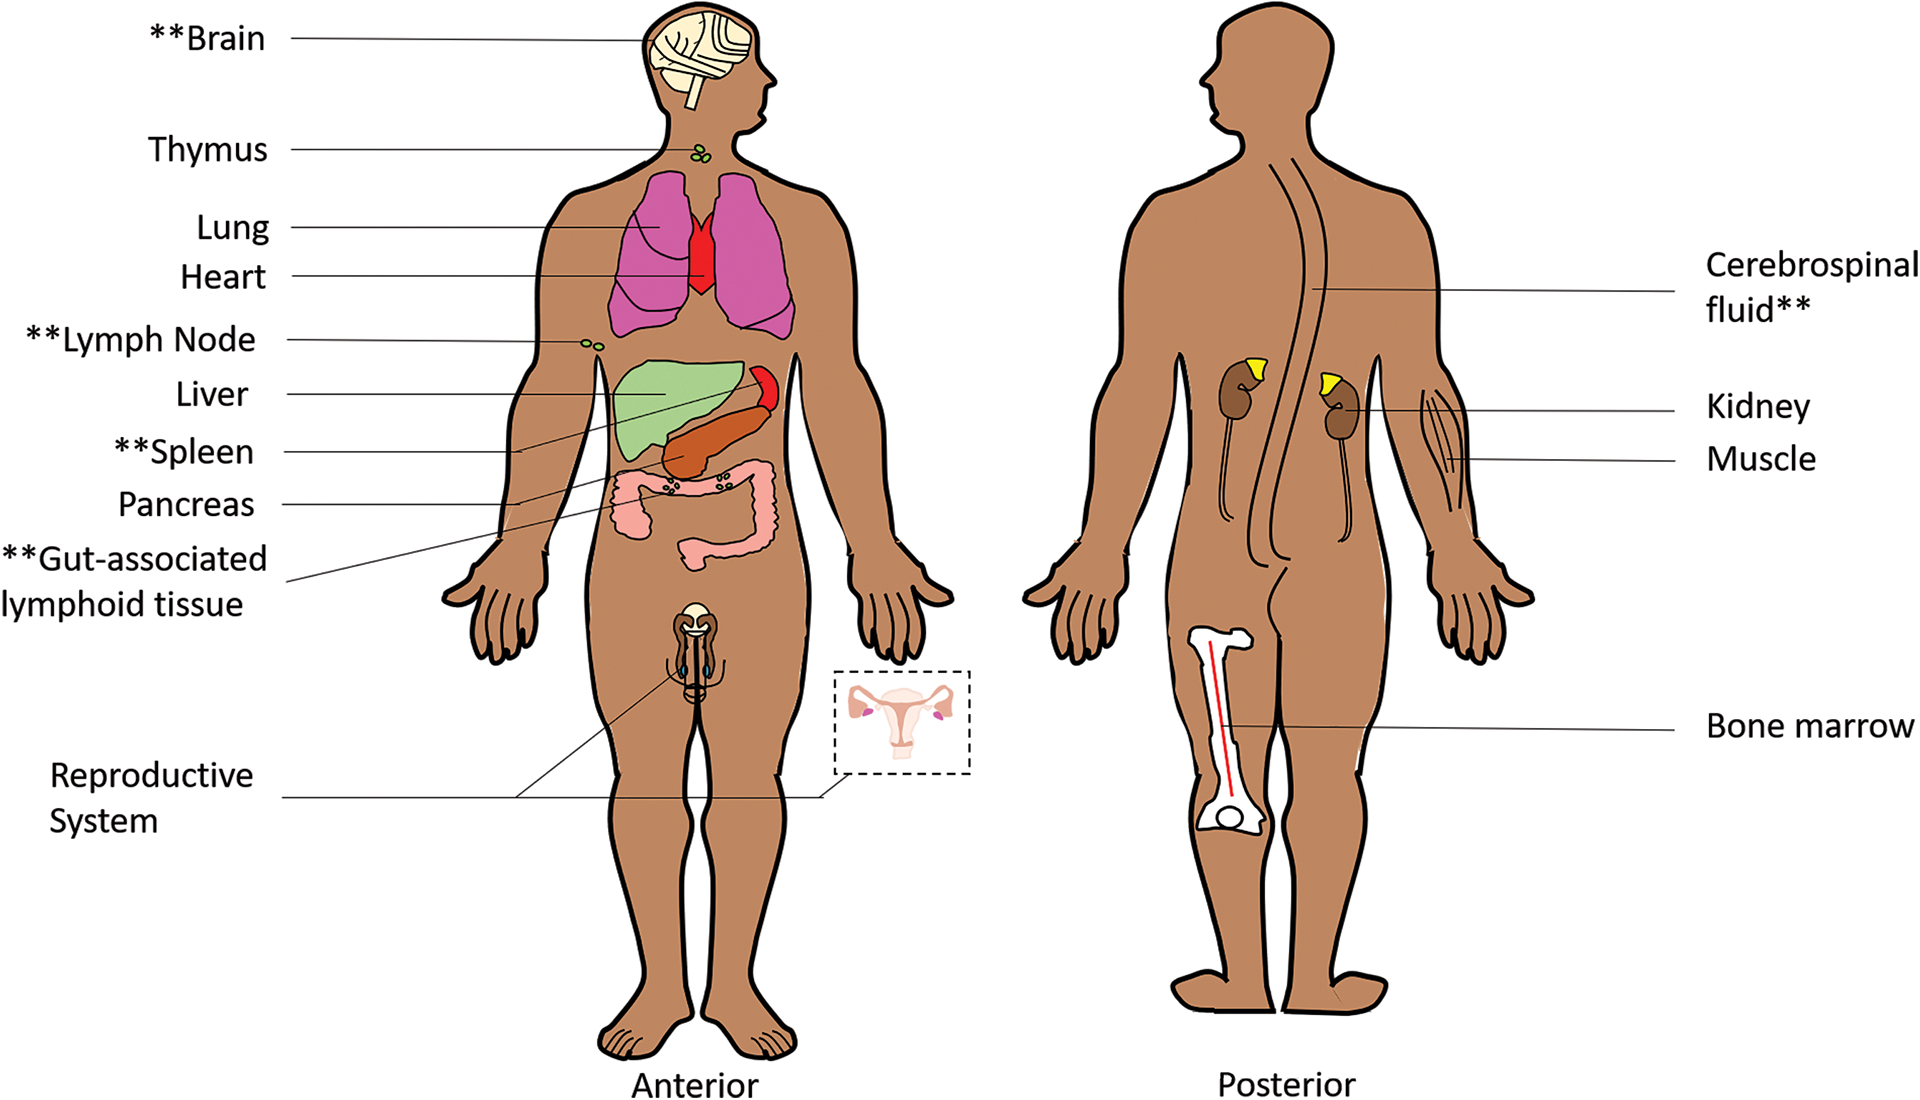
Schematic of Anatomic Reservoirs
Double asterisks are used to denote tissues for which evidence of HIV compartmentalization in PLWH on suppressive ART has been reported. These tissues may serve as pharmacologic sanctuaries in which HIV replication occurs in isolation due to subtherapeutic ART.
Pharmacology in the HIV Reservoir
Understanding the pharmacology of ART and investigational cure strategies within the anatomical compartments associated with both the latent and active reservoir is extremely important for designing therapeutic strategies that maximize the likelihood of success. In the context of HIV cure, ART serves a 2-fold purpose, 1) to suppress any ongoing replication from the active reservoir and 2) to ensure uninfected cells remain so after reactivation of the latent reservoir. This characterization is also important to ensure investigational agents intended to reactivate latently infected cells or block and lock latent virus achieve therapeutic concentration at their site of action. The following sections will review ART pharmacology in anatomic compartments associated with both the latent and active reservoir (summarized in Table 1) along with any available evidence for small molecules being investigated for HIV cure.
Table 1.
Summary of ART penetration into anatomic compartments
| Organ | ART Class | Penetration Ratio†,§ Category | |||
|---|---|---|---|---|---|
| CNS | NRTI | TFV | FTC>ABC>3TC | ||
| NNRTI | ETR>RPV>EFV | ||||
| PI | DRV>ATV>LPV/RTV | ||||
| INSTI | RAL>DTG>BIC>EVG | ||||
| EI | MVC | ||||
| Lymph Node | NRTI | FTCtp>TFVdp | |||
| NNRTI | EFV | ||||
| PI | ATV | RTV>DRV>LPV | |||
| INSTI | DTG* | RAL | |||
| EI | |||||
| Spleen | NRTI | TFV | FTC | ||
| NNRTI | EFV | ||||
| PI | ATV | ||||
| INSTI | RAL¶ | ||||
| EI | MVC* | ||||
| GI Tract | NRTI | FTC | TFV | ||
| NNRTI | RPV | ETR | |||
| PI | DRV | ATV>RTV | |||
| INSTI | BIC | DTG | EVG | RAL>EVG | |
| EI | MVC | ||||
| Male Reproductive Tract | NRTI | 3TC>TFV>FTC>AZT>ABC | |||
| NNRTI | NVP>EFV | ETR | |||
| PI | RTV>LPV | DRV=APV>ATV | |||
| INSTI | DTG>BIC | RAL | |||
| EI | MVC | ||||
| Female Reproductive Tract | NRTI | ABC | TFV | 3TC>FTC>AZT | |
| NNRTI | EFV | NVP | ETR | ||
| PI | LPV | RTV | DRV | ||
| INSTI | DTG | RAL | |||
| EI | MVC | ||||
| Lung*‡ | NRTI | TFV≥FTC | |||
| PI | DRV | ||||
| EI | MVC | ||||
| Heart*‡ | PI | DRV | |||
| EI | MVC | ||||
| Liver*‡ | NRTI | 3TC=FTC | TFV | ||
| PI | DRV | ||||
| INSTI | RAL | ||||
| EI | MVC | ||||
| Kidney*‡ | NRTI | TFV | |||
| PI | DRV | ||||
| EI | MVC | ||||
| Thymus*‡ | PI | RTV | |||
Penetration ratio is the concentration observed in cerebrospinal fluid, tissue, cervicovaginal fluid, or semen/seminal plasma normalized to a matched concentration observed in plasma as available in the published literature.
TFV TPRs are derived from TDF dosing.
Only data from limited clinical observation (N=1) following an unwitnessed dose is available.
Indicates that data is only available from pre-clinical animal studies.
Indicates organs for which no data is available for certain classes of antiretrovirals.
Abbreviations (in alphabetical order): 3TC, lamivudine; ART, antiretroviral therapy; ATV, atazanavir; AZT, zidovudine, BIC, bictegravir; CNS, central nervous system; CsfPR, cerebrospinal fluid-to-plasma ratio; DRV, darunavir; DTG, dolutegravir; EFV, efavirenz; EI, entry inhibitor; ETR, etravirine; EVG, elvitegravir; FTC, emtricitabine; FTCtp, emtricitabine triphosphate; GI, gastrointestinal; INSTIs, integrase strand transfer inhibitors; MVC, maraviroc; NNRTIs, non-nucleoside reverse transcriptase inhibitors; NRTIs, nucleos(t)ide reverse transcriptase inhibitors; NVP, nevirapine; PIs, protease inhibitors; RPV; rilpivirine; RTV, ritonavir; TDF, tenofovir disoproxil fumarate; TFV, tenofovir; TFVdp, tenofovir diphosphate; TPR, tissue-to-plasma ratio
Central Nervous System
The central nervous system (CNS; composed of the brain and spinal cord) is one of the best studied HIV reservoirs and exhibits the strongest evidence of active replication while on suppressive ART.15,16 Viral escape in the CNS typically refers to discordant findings of detectable HIV RNA in biologic specimen sampled from the CNS (most frequently cerebrospinal fluid; CSF) versus the blood. In a large cross-sectional analysis of PLWH on suppressive ART (n=1264) viral escape was evident in the CSF of 4.4% of participants and independently associated with atazanavir (ATV)-based ART when compared to other non-nucleoside reverse transcriptase inhibitors (NNRTI)- or raltegravir (RAL)-based regimens.17 Importantly, viral sequencing was not performed as part of this study so it is uncertain whether the sampled population reflected new strains of virus arising from active replication or archived strains arising from clonal expansion. Joseph et al examined plasma and CSF samples collected from 101 PLWH on suppressive ART and reported viral escape in 6%.16 In a small subset of participants for whom viral envelope sequencing was performed, the viral lineage demonstrated active replication in 1 participant versus clonal expansion in 2 participants.16 Taken together, these data provide a theoretical framework that in some cases viral escape in the CNS may arise from active replication due to subtherapeutic ART exposure.
The blood-brain barrier (BBB) and the blood-CSF barrier (BCB) serve as physical barriers against xenobiotic penetration into the CNS due to endothelial cells connected by tight junctions and the expression of efflux drug transporter proteins. Thus key physicochemical properties that determine the extent to which ART distribute into the CNS include; protein binding, lipophilicity, and affinity for efflux or uptake drug transporters.18 Lower protein binding potential in the plasma generally correlates with a greater propensity for the drug to distribute into the CNS as well as other peripheral tissues.18 More lipophilic drugs are also associated with greater permeability, in general, due to the lipophilic environment of the BBB. High affinity for efflux drug transporters expressed along the BBB and BCB (P-glycoprotein; P-gp and breast cancer resistance protein; BCRP) is associated with lower penetration into the CNS. Conversely substrates for uptake inhibitors expressed in the BBB and BCB (organic anion transporter; OAT 1, 2, and 3) exhibit higher penetration into the CNS.18
The ability to correspond ART pharmacokinetic (PK) in the CNS with pharmacodynamic (PD) efficacy is key for cure strategies at the site of action, especially in privileged sites like the CNS. One important mathematical marker to contextualize PK in the CNS is the CSF-to-plasma penetration ratio (CsfPR), which is the concentration of ART observed in the CSF normalized to that observed in the plasma at either a single, matched moment in time or averaged over a defined time frame.18 An additional PK/PD marker is the inhibitory quotient (IQ) or an observed ART concentration value that is normalized to the inhibitory concentration (IC) value. Calcagno et al have proposed IQ values in the CSF, and determined that IQ values greater than 1 are correlated with virologic control, and therefore denote therapeutic ART exposure in the CNS.19
The PK of ART in the CNS has been exclusively reviewed elsewhere18, and will only be summarized herein. As a class, NNRTIs are highly lipophilic and highly protein bound (≥99% with the exception of 60% for nevirapine). Efavirenz (EFV) exhibits a wide range of neurologic side effects in PLWH suggesting a high degree of distribution across the lipophilic BBB into the brain parenchyma (i.e. the functional tissues). However, total (i.e. free and protein bound) EFV concentrations are minimal when compared to the plasma (CsfPR <0.01). Importantly, free (i.e. pharmacologically active) EFV CSF concentrations approximate free plasma concentrations likely explaining EFV’s PD activity within the CNS. Total and free etravirine (ETR) CsfPRs were 0.04 and 0.02, respectively, and free concentrations are lower than the wild-type IC50 values.20 Lastly, rilpivirine (RPV) exhibits a CsfPR of 0.014.21 Yet, despite this low CsfPR in a small (n=13) cohort of PLWH the majority (11/13, 85%) exhibited RPV CSF concentrations above the EC90.21 While there are currently no published studies of doravirine (DOR) exposure in the CNS, data from actively enrolling studies are forthcoming (clinicaltrials.gov, NCT04079452).
Nucleoside reverse transcriptase inhibitors (NRTIs) are hydrophilic compounds with low affinity for plasma proteins (4–50% protein bound) that generally exhibit a low degree of penetration into the CSF with CsfPR of <1 (emtricitabine [FTC]=0.7, abacavir [ABC]=0.36, lamivudine [3TC]~0.2, tenofovir [TFV]=0.05). These seemingly unexpected findings of low CSF penetration may be attributable to active transport out of the CSF, either into the brain parenchyma or into the blood since as a class NRTIs exhibit affinity for a number of different efflux and uptake transporters.22−24 Importantly, despite low CSF ABC concentrations, exposure exceeds ABC’s IC50 for at least 85% of the dosing interval.25 CSF concentrations of FTC23 and 3TC24 but not TFV22 have also been shown to exceed IC50 values. In a preclinical study, FTC and TFV brain tissue concentrations were normalized to plasma concentrations and these ratios ranged from 0.5–1.55 and 0.0–0.75, respectively, indicating poor parenchymal penetration. These concentrations did not exceed the IC50 values for either NRTI.26 Additionally, there was no correlation between CSF and brain tissue concentrations in this study, highlighting the fact that CSF may not always be an appropriate surrogate for brain tissue PK.26
As a class, protease inhibitors (PIs) are large, lipophilic molecules that are highly (86–99%) protein bound, and as such would be expected to exhibit low distribution into the CSF. CsfPR for this class are <0.01 where total CSF concentrations of darunavir (DRV), ATV, and lopinavir/ritonavir (LPV/RTV) were 70, 100, and 500-fold lower when compared to the plasma, respectively.27 DRV protein binding in CSF (2.8%) is 33-fold lower than in plasma which suggests that CNS proteins exhibit altered affinity for PIs when compared to plasma proteins.28 Thus, this pattern of altered binding may imply that lower exposure is needed to achieve a matched PD effect in the CNS compared to the blood. Importantly, these relatively low total DRV and LPV/RTV CSF concentrations still exceed IC50 values for wild-type virus by ≥5-fold.29 However, ATV CSF concentrations rarely exceed the IC50 potentially providing a pharmacologic explanation of the findings reviewed above that ATV-based ART is independently associated with CSF escape.
Integrase strand transfer inhibitors (INSTIs) comprise a heterogenous group of compounds with plasma protein binding range ranging from 83 to 99% and lipophilicity ranging from logP values of 1.1–5.3. This heterogeneity is reflected in their respective CSF distribution. In one clinical study, elvitegravir (EVG) CsfPR was ≤0.004 in PLWH on ART30; yet despite this extremely low CNS exposure, 100% of CSF samples exhibited undetectable HIV RNA (<40copies/ml).30 Similarly, dolutegravir (DTG) and bictegravir (BIC) CsfPRs were <0.01 but these concentrations still exceed their respective EC50 values for wild-type virus over their entire dosing interval.31,32 Of the INSTIs, RAL is the most hydrophilic and, interestingly, CsfPRs are the highest (~0.05) observed for this class. Additionally, in a small cohort of 21 PLWH RAL CSF concentrations exceeded the IC50 value by ~4.5-fold.33
Lastly, the entry inhibitor maraviroc (MVC) median CsfPRs were 0.022 and 0.094 for total and free concentrations, respectively.34
Finally, spatial location within the brain is an important consideration when exploring ART pharmacology in the CNS, especially considering that specialized immune cells (microglial cells and astrocytes) may harbor latent HIV and are typically located throughout the brain parenchyma and along the tight junctions of the BBB.35 It was previously noted that LPV concentrations were greater in white matter versus cortical gray matter and global pallidus regions of the brain.36 However, this assessment was based on findings in 9 PLWH diagnosed with AIDS near the time of their death and may not be reflective of persons receiving current standard of care. Srinivas et al utilized mass spectrometry imaging (MSI; described in greater detail in Future Directions) to visualize the spatial location of EFV within the brain of NHPs and noted no morphological differences in distributions patterns between white and gray matter within the cerebellum.26
To date, no in vivo PK data have been reported for LRAs in the CNS. Given the high probability that a portion of the HIV reservoir resides in the CNS, ensuring that therapeutic exposure to latency reversing agents is achieved within this compartment is of high importance for designing successful HIV cure strategies. Gray et al explored an in vitro model for brain perivascular macrophages and evaluated the PD of LRAs in both primary, human fetal astrocytes and monocyte-derived macrophages.37 These authors noted that in primary fetal astrocytes, romidepsin, the bromodomain inhibitor JQ-1, and panobinostat, induced viral transcription by 11-, 9-, and 7-fold, respectively with similar trends for monocyte-derived macrophages (albeit at a lower fold-change of 2- to 4-fold).37 Given the paucity of data available for LRAs within the CNS, findings that CNS exposure to ART is generally low, and that CSF escape is common (>4%) the CNS represents an important site for continued pharmacology characterization as HIV cure strategies advance towards the clinic.
Lymph Nodes
Lymph nodes (LNs) are fibrous organs subdivided into lobules, populated by lymphocytes.38 These lobules receive blood flow from specialized post-capillary venous channels known as high endothelial venules (HEVs) that facilitates the cross-over from blood to LN parenchyma.38 They are of particular interest due to the high density of cellular phenotypes that can be latently infected with HIV as well as previous identification of HIV persistence. Horiike et al utilized a NHP model that was chronically infected with SIV and suppressed on ART, to explore viral rebound after ART cessation. The investigators noted significant amounts of viral RNA in the LNs which appeared to be the source of viral rebound following analytical treatment interruption (ATI) providing compelling evidence that LNs are an HIV reservoir.39 Lorenzo-Redondo et al have also demonstrated a unique pattern of viral evolution (suggesting ongoing replication) within the LNs by sequencing viral strains from inguinal LNs of three PLWH on suppressive ART.11 However, some experts contend that their findings were an artifact of sampling from PLWH too recently (within 6 months) after starting ART and have suggested that repeated studies are needed with samples collected after more than 1 year of ART suppression.40
LNs are pharmacologically unique since xenobiotics enter a lymphoid follicle (the primary point of entry into a LN lobule) through HEVs versus “traditional” blood flow as seen with other organs.38 Like the CsfPR, a key measure of ART distribution into peripheral tissues is the tissue-to-plasma penetration ratio (TPR), which is the concentration of ART observed in a particular tissue normalized to that observed in the plasma at either a single, matched moment in time or averaged over a defined time frame. A ratio of 1 indicates that the tissue exposure is equivalent to that of the blood.41
Solas et al examined concentrations of PIs in LN biopsies from PLWH on ART and reported LPV/RTV were approximately 4.7- and 1.6-fold lower, respectively, in LN tissue versus plasma. Consistent with these relatively low concentrations, HIV RNA was detected in lymph node mononuclear cells (LNMCs) of all study participants.42 Compared to peripheral blood mononuclear cells (PBMCs), Fletcher et al demonstrated that LN tissue concentrations of TFV’s active metabolite (tenofovir diphosphate; TFVdp), FTC’s active metabolite (emtricitabine triphosphate; FTCtp), ATV, DRV, and EFV, were significantly lower (median differences ranged from −70 to −100%).10 In a follow-up study, these investigators measured TFVdp concentrations in LN tissue of PLWH who switched to the newer prodrug of TFV (tenofovir alafenamide; TAF) from tenofovir disoproxil fumarate (TDF) and found concentrations were 6.4-fold higher. These data may suggest that TAF is a superior formulation for HIV treatment in the context of HIV cure.43 Lee et al also demonstrated poor penetration of ART into LNs with median TPRs for RAL and DRV of ~0.2 and 0.3, respectively in a cross-sectional analysis of virally suppressed PLWH.44 Finally, Dyavar et al examined LN tissue from mice dosed with DTG and found a PR of 0.08 suggesting poor penetration; however, human LN data are not available for this INSTI.45
Data regarding concentrations of LRAs in the LNs are minimal. Rosen et al examined panobinostat by MSI in the LNs of three NHPs chronically infected with SIV and suppressed on ART. They found that panobinostat was heterogeneously distributed within the LN with 45–68% of drug localized to the vasculature and that parenchymal concentrations were 260nM and exceeded the in vitro EC50 value (1.6 nM) by >100-fold.46,47 While these data are encouraging that LRAs distribute into the LNs, the paucity of LRA PK data, the generally low ART concentrations, and the high probability that LNs house a large portion of the HIV reservoir warrant additional PK/PD exploration in the LNs.
Spleen
The spleen contains nearly one-quarter of the body’s lymphocytes and is comprised of two functional units: the white pulp and red pulp.48 The white pulp is primarily composed of aggregated immunological cells (e.g. central memory CD4+ T cells) while the red pulp is composed of primarily red blood cells and platelets.48 The spleen also receives a relatively low degree (5%) of total cardiac output and 90% of that blood flow is delivered to the white pulp.48 These anatomical and physiologic properties create an environment that is favorable for HIV persistence within the spleen yet this organ has been relatively understudied in the context of HIV cure. One study examined post-mortem spleens from PLWH on suppressive ART up until the time of their death and demonstrated a high degree of viral diversity in the env and nef genes suggesting the spleen as a role in compartmentalization of HIV.13
Data regarding ART penetration into the spleen is also extremely limited, but splenic ART pharmacology has been evaluated in preclinical models (humanized mice and NHPs) as well as 13 humans post mortem.49 The median TPRs across species were high for MVC (3.3) and FTC (3.0), modest for ATV (1.7), TFV (1.7), and EFV (1.5), and low for RAL (0.3). Importantly, all of these TPRs exceeded 1 (meaning tissue exposure is high relative to blood exposure) with the exception of RAL.49 Interestingly, despite a TPR of >1, FTC and TFV exhibited IQ values that were less than 1, which would suggest subtherapeutic exposure in both the spleen and blood.49 One important limitation of the human samples included in this study is that ART doses were not witnessed. Thus, these low spleen and plasma concentrations may be attributable to poor adherence, which highlights the importance of considering tissue distribution in the context of plasma exposure rather than absolute concentration alone. This same interspecies study found a statistically significant, positive linear relationship between plasma and spleen concentrations for all ART (FTC, TFV, EFV, ATV, and MVC) but RAL indicating that plasma concentrations are likely an adequate surrogate of splenic tissue PK.50
Although intentional PK studies exploring LRA distribution into the spleen have not been reported, there are components of published, whole-body biodistribution studies that provide insight. Guo et al evaluated romidepsin, a histone deacetylase inhibitor (HDACi) that is being tested in clinical HIV cure studies, in a cutaneous burn model using C57Bl/6 mice. The study demonstrated a 17% increase in histone acetylation (a biomarker of romidepsin’s effect) within spleen tissue following 3 consecutive days of 5 mg/kg daily dosing when compared to only a 10% increase in the CNS (as assessed by neurons collected from the spinal dorsal horn).51 Additionally, Perrin et al examined panobinostat (also and HDACi) concentrations in splenic tissue collected from rats dosed with an intravenous bolus 10 mg/kg panobinostat and noted a mean concentration of 2900 nM after 90 minutes (Supplementary Figure 10 of reference 51).52 These observed concentrations are >1000-fold higher than panobinostat’s in vitro EC50 value (1.6 nM) to induce wild type HIV.47 These HDACi data paired with ART data indicating generally high exposure are encouraging that therapeutic exposure can be achieved in the spleen. However, the paucity of data for other classes of LRAs warrants further pharmacologic study for HIV cure strategies.
Gastrointestinal Tract
The lymphoid tissue in the gastrointestinal tract (GIT) is collectively called the gut-associated lymphoid tissue (GALT). GALT contains high concentrations of CD4+ T cells, which begin to decrease within 4 days after HIV exposure with discordant immune reconstitution following ART.53,54 Indeed, viral compartmentalization has been observed in biopsies from the upper and lower GIT (esophagus, stomach, duodenum, and colorectum) as evidenced by phylogenetic analyses of the Nef protein-encoding region.55
Pharmacology of the GIT – specifically with ART – is complex for several reasons. First, the anatomical and physiological heterogeneity of the GIT (e.g. acidity of the stomach versus basicity of the ileum) affects the pKa of small molecules, which impacts absorption. Second, the heterogeneity of the expression of drug-metabolizing enzymes and transporters along the GIT yields segmental ART concentration differences. ART pharmacology in the GALT has been reviewed extensively.41,56,57 Herein a summary of the literature is provided in the context of HIV cure specifically.
Patterson et al explored NRTI exposure in the lower GIT and noted a calculated median TPR of 3.2 and 32.8 for FTC and TFV in rectal tissue, respectively, over 14 days following a single dose.58 Regarding NNRTI distribution, PK studies have demonstrated TPRs of 20–40 in GIT biopsies collected from PLWH taking ETR.59,60 Whereas, RPV (administered in a long-acting formulation) exhibited a much lower TPR (~1) in clinical studies.61 To date, there are no published studies examining DOR concentrations in the GIT.
Given their lipophilic properties, PIs are expected to distribute well within the GALT. A cross-tissue analysis by Devanathan et al noted median ATV TPRs in humans >10 with concentrations exceeding ATV’s in vitro IC90 by ~10-fold.50 Clinical studies in healthy volunteers and PLWH demonstrate a median DRV TPR of approximately 2.7 and 3.1, respectively.59,60 Lee et al, observed median TPRs for DRV and ATV of 2.1 and 33.7, respectively in illeal tissue collected from PLWH on suppressive ART and 2.8, and 2.8, respectively in rectal tissue demonstrating heterogeneity of distribution along the GIT for ATV.44 Interestingly, Fletcher et al isolated mononuclear cells from rectal tissue biopsies of PLWH on ART and noted relatively low concentrations when compared to PBMC for ATV, DRV and the NNRTI, EFV (median differences ranged from −30 to −100%).10 However, one important limitation of this study was that these particular ART can cross cell membranes by passive diffusion, and therefore may have been lost during the intensive processing steps required to disaggregate tissue biopsies and isolate mononuclear cells.
INSTIs, as noted before, are a heterogenous group of compounds and their penetration into the GIT reflects this heterogeneity of physiochemical properties. One small (n=7) study in HIV-negative men explored EVG concentrations in rectal tissue biopsies 24 hours (C24h) after a single, cobicistat-boosted dose and found that concentrations ranged from 1000–10000 ng/g, which is 2–20-fold higher than EVG’s typical C24h in the blood plasma.62 Conversely, Greener et al noted a DTG TPR of 0.17 in colorectal tissue collected from healthy male study participants following 8 daily doses.63 Despite seemingly low penetration these DTG concentrations still exceeded the protein-adjusted IC90 value.63 In contrast, RAL distribution is rapid, highly variable, and extensive throughout the GIT and studies exploring RAL concentrations in tissue biopsies collected from healthy volunteers and PLWH have reported TPRs of 8.1–156 in the terminal ileum, 68–659 in splenic fixture, and 1.5–239 in the rectum.44,64 Finally, Imaz et al conducted a prospective multicenter study of treatment-naïve patients receiving BIC/FTC/TAF and noted the median TPR of 0.026, indicating poor penetration into the GIT; however, concentrations exceeded the EC50 value by 67-fold.65
To our knowledge, there are no data examining LRA concentrations in the GIT. However, there is published evidence of the effectiveness of LRAs in the GIT. Bjerg Christensen et al conducted a single-arm trial with 15 ART-suppressed PLWH receiving multiple doses of panobinostat (20 mg three times weekly every other week).66 Sigmoid biopsies collected after 4 week of dosing demonstrated an approximately 4-25-fold increase in the epithelial regions for the number of cells producing IL-17A (a downstream biomarker of effect, p=0.04).66 Furthermore, a modest (7.4-fold) increase in HIV RNA levels was observed in CD4+ T cells isolated from rectal biopsies following 14 days of once daily dosing of vorinostat in 20 PLWH.67 While LRA concentrations were not analyzed in these studies, these data do provide evidence of PD response to LRA treatment in the GIT. These data along with the generally high concentrations exhibited in PLWH on ART suggest that forthcoming cure strategies may be successful in eradicating HIV reservoir from the GIT specifically, but further study is warranted.
Reproductive Organs
Quantifying ART pharmacology within the human reproductive system is of particular interest within the HIV prevention field. Thus, much work has focused on ART PK within the anatomical compartments of the male and female reproductive systems most associated with HIV transmission such as the semen and the lower female genital tract (i.e. cervix and vagina). For convenience sampling purposes, seminal plasma and cervicovaginal fluid are frequently used as surrogates for tissue concentrations. Antiretroviral PK in lower female genital tract secretions and seminal plasma have been reviewed extensively elsewhere.57 The present review will focus on data generated since this historical review was published or describe tissue concentrations, specifically.
In general, the male genital tract is regarded as a pharmacologic sanctuary created by high expression of efflux drug transporters that localize at the blood-testis barrier. In testes collected from a cohort of PLWH on ART (n=5) versus HIV uninfected (n=8) participants undergoing elective orchiectomy for gender modification, both mRNA and protein of five ABC efflux transporters (P-gp, MRP1, MRP2, MRP4, and BCRP) were present within testicular tissue and localized at the blood-testis barrier.68 SLC uptake transporters (OATP1B1 and 2B1, OAT1, CNT1 and ENT2) were also present. Interestingly, PIs (which are typically substrates of ABC efflux transporters) displayed highly variable and generally low tissue concentrations in these testicular tissue samples while NNRTIs (which are typically substrates for SLC transporters) approximated blood plasma concentrations.
These pharmacologic trends are similar to previous data in human seminal plasma aggregated by Trezza et al. where concentrations of NRTIs (TFV, zidovudine [AZT], ABC, 3TC and FTC) and RAL are up to 10-fold higher and those of PIs (DRV, amprenavir [APV], ATV, LPV, and RTV), NNRTIs (EFV, nevirapine [NVP] and ETR) and DTG are up to 100-fold lower.57 Like DTG, total BIC concentrations are significantly lower (38-fold) in seminal plasma when compared to the blood plasma.65 Despite relatively low concentrations in seminal plasma, both DTG and BIC are associated with rapid suppression of HIV RNA to undetectable levels in the seminal plasma.65,69 This may be attributable to altered protein binding characteristics in the blood plasma (where free DTG and BIC are <1% of total concentration) versus the seminal plasma where ~48–49% of DTG and BIC are present as free drug.
However, whether the viral decay and protein binding kinetics of seminal plasma are an adequate surrogate of testicular tissue remains to be determined. Recent analysis of HIV DNA in testicular tissue collected from participants maintaining undetectable plasma viral loads on ART for >6 months demonstrate quantifiable intact provirus in 8 of 10 participants but that the proviral populations in the testes did not substantially differ from those in the blood except by unbalanced distributions of identical sequences70. Thus, compartmentalized replication secondary to poor ART distribution into the testicular microenvironment is an unlikely explanation of HIV persistence in the male genital tract.
The female genital tract represents a complex mucosal environment subject to modulation by a dynamic hormone profile as well as inflammatory mediators. Pharmacologic considerations such as the impact of drug metabolizing enzymes and transporters in the female genital tract have been reviewed in detail elsewhere in the context of HIV prevention.71 Trezza et al. aggregated ART PK data in cervicovaginal secretions compared to the blood plasma reporting exposure was higher (2-4-fold) for FTC, 3TC, MVC, and AZT; approximate (i.e. within 1.5-fold) for TFV, RAL, DRV, NVP and ETR and lower (3-250-fold) for RTV, ABC, LPV, DTG, and EFV.57 While previous clinical studies have demonstrated a predictable relationship between samples of cervicovaginal fluid and lower female genital tract tissue for TFV, FTC, MVC and RAL, these cervicovagional fluid concentrations were generally higher (3-10-fold) than tissue. Thus cervicovaginal fluid they should be considered a best case scenario of tissue concentrations.72
To date, no studies have explored HIV decay in the female genital tract after initiating ART therapy. Cross-sectional studies exploring shedding of HIV RNA in vaginal lavage samples collected from women on ART and with suppressed plasma viral loads indicate shedding viral RNA in the female genital tract occurs in 9–19% of visits.73,74 Yet, phylogenic analysis of HIV-1 env from the blood and cervix of women on effective ART demonstrate monotypic sequences between the 2 compartments which suggests that cells harboring provirus undergo clonal expansion in the cervix rather than virus arising from ongoing replication. While there are no published studies of DOR exposure in the male or female genital tract, data from actively enrolling studies are forthcoming (clinicaltrials.gov, NCT04097925)
To our knowledge, the PK of LRAs have not been characterized within the male and female genital tract. If indeed these anatomical sites harbor replication competent latent virus, then this pharmacologic characterization represents an important component to developing maximally effective therapies that activate latently infected cells. As investigators consider ART regimens to be paired with investigational cure strategies these highly variable distribution patterns should be considered to govern the selection of maximal potent ART within the reproductive organs.
Other Deep Tissues
Due to the invasiveness of procedures required to collect tissue samples from internal organs such as the lung, heart, liver, kidneys, thymus, and bone marrow, much of what is known about ART distribution into these tissues is derived from animal studies. Given dissimilarities between animal and human dosing strategies, it is especially important to consider tissue concentrations in the context of plasma concentrations. In general, ART demonstrates higher concentrations within these peripheral organs when compared to plasma. In lung tissue, rat and BLT mice exhibit TPRs for FTC (3)75, MVC (4)76, TFV (2–5)75,77, and DRV (116).78 Conversely, RAL mouse lung concentrations are 2-fold lower than blood plasma75. In heart tissue, rats exhibit TPRs of 3 and 93 for MVC and DRV, respectively.76,78 In liver tissue, mice and rats exhibit TPRs of 2 for 3TC, FTC, RAL75,79, 5 (MVC)76, 5–25 (TFV)75,77, and 1800 for DRV.78 In kidney tissue, rats exhibit TPRs of 5, 116, and 930 for MVC, TFV, and DRV, respectively.76–78 Finally, in thymus tissue only RTV data have been generated to date, which demonstrate slightly lower (1.3-fold) concentrations compared to blood plasma in rats.80 Interestingly, RTV is a known P-gp substrate which increases in activity as thymocytes mature81. Thus, age may be an important determinant of distribution into the thymus for P-gp substrates like the PIs.
Of the tissue distribution studies reviewed in this section, only one explored HIV decay within these potential reservoir organs. Using a BLT mouse model infected with HIV and treated with daily intraperitoneal injection of RAL/TFV/FTC 56/208/240mg/kg, Denton et al found that at the termination of the study despite achieving generally high ART tissue concentrations and suppressing plasma HIV below limits of quantification for >20 days, cell-associated HIV RNA was still detectable in all sampled tissues (liver, lung, spleen, LN, intestines, and bone marrow).75 These PK/PD findings may suggest that delayed rate of decay observed in the tissues represents persistence of infected cells rather than ongoing replication within these particular tissues.
Interestingly, Panobinostat demonstrates readily detectable concentrations within lung and kidney tissues 48 hours after a single intraperitoneal injection, which is consistent with the expectation of extensive tissue distribution based on the multi-compartmental plasma concentration time curve observed in cancer patients.82,83 Valproic acid (VPA) is a potential LRA that has demonstrated modest and inconsistent results in clinical studies with >50% decline in infected cells per billion (IUPB) resting CD4+ cells in just 4 of 11 treated patients.84 In rats and NHPs, VPA demonstrates minimal distribution out of the blood plasma.85,86 This distribution pattern may explain VPA’s lackluster results in reducing the latent reservoir. The limited data for LRAs within reproductive organs warrants further PK evaluation as cure strategies advance.
Future Directions
Identifying an HIV Cure
To date, a few cases of sustained HIV remission following ATI have been reported and provide precedent that a cure is achievable. The most notable of these is that of Timothy Brown (the Berlin Patient) who has been in remission for >13 years since stopping ART following an allogeneic hematopoietic stem cell transplant (HSCT) from a homozygous for CCR5 Δ32 donor.87 A second patient identified as the London patient also appears to have been cured following an similar treatment course as Mr. Brown and has been in HIV remission for >30 months since stopping ART.88 Yet in the case of other alternative interventions such allogenic HSCT from heterozygous donors whose cells express CCR5 receptor (the two Boston patients) or extremely early ART initiation (the “Mississippi baby” and pre-exposure prophylaxis [PrEP] participants), HIV relapse following prolonged remission during an ATI has been extremely unpredictable ranging from 3–22 months.89–91
In the absence of a definitive biomarker for HIV cure, monitoring for relapse during an ATI is a necessary component of cure research. However, given these limited and variable remission data, there is no scientific consensus about the exact length of time required to declare that a patient is cured. This uncertainty necessitates frequent monitoring events especially because relapse in a sexually active participant could result in transmission to their uninfected partners. Consensus recommendations for ATIs currently suggest weekly monitoring for the first 12 weeks and biweekly for the indefinite future thereafter.92 However, some experts contend that as more remission data become available the field may be able to draw on experience from malignant disease to design tapered monitoring schedules.93
Another key feature of identifying an HIV cure is participant adherence to the ATI. Much data from the HIV prevention sciences suggests that, participants enroll and participate in clinical research for reasons in addition to altruism including access to health care and financial incentives. As such, adherence to study interventions tend to wane over time and some participants choose never to initiate treatment upon enrollment into the study. These findings have led to a standard in clinical trial design which includes an objective adherence measurement such as plasma drug concentrations or directly observed dosing. Understandably, participants may be eager to participate in HIV cure research, but may feel anxiety or unwillingness to stop ART completely. Yet, to date, no data have been reported regarding objective measures of participant adherence to ART cessation schedules. Interrogation for the presence of antiretroviral concentrations in samples collected from presumptive elite controllers who reported being HIV negative and not taking ART to the South African National Blood Service (SANBS) identified that >60% were taking ART.94 Undisclosed ART use was also identified ~23% and 39% of study participants at enrollment into the HPTN052 clinical trial and Botswana Combination Prevention Project, respectively.95,96 Given these finding of a high prevalence of non-disclosure of ART use among study participants, an important consideration as larger numbers of participants are enrolled into HIV cure research that require an ATI will be the inclusion of objective measures of ART cessation.
Objective measures currently being used or explored to assess ART adherence may also be employed to confirm ART cessation and include sampling plasma, urine, whole blood, and hair to quantify ARV concentrations (typically by HPLC-MS/MS). Because of the relatively short half-lives of ARV in plasma and urine these measurements only provide evidence of ART use or non-use within a limited window of time (typically <1 week). Dried whole blood spots (DBS) can be collected via a non-invasive finger stick, have been utilized extensively to measure adherence to PrEP in the HIV prevention field, and can provide evidence of use or non-use over a much longer window of time (~1 to 3 months).97 Novel patient-centric devices such as TASSO-M20, Hemaspot, and Mitra microsamplers are currently being explored for their potential to facilitate self-collection of dried whole blood in a patient’s home and minimize the need for clinic visits. Hair may provide an even longer-term assessment of ARV use or non-use (~1 month for each 1 cm of hair closest to the scalp) and has been extensively studied to measure adherence to HIV treatment.98 Hair collection is also non-invasive, and could be collected in a patient’s home. Although many of these long-term adherence measurements are still under investigation, they improve upon plasma measurements by providing an objective determination of ART use or non-use and could be incorporated into clinical trials to ensure adherence to scheduled ATIs.
Modeling and Simulation to Expedite Drug Development
Examining the sites of action for ART and small molecule cure strategies can provide insights into barriers that could potentially preclude the distribution of these agents into the various tissue and cellular reservoirs. Because tissues are difficult and invasive to sample, plasma or blood are often used as surrogate measures. There are comparatively limited data that correlate the presence of virus and ART in these tissue compartments. Therefore, alternative methods – specifically in silico models – to examine pharmacology in difficult-to-obtain tissues are necessary.
Regulatory agencies such as the Food and Drug Administration recognize the value of mathematical modeling and simulation exercises in the drug development process. Examples of the importance of mathematical models that provide insight into ART pharmacology exist, but these have not been extensively studied with LRAs. For instance, physiologically based pharmacokinetic models (PBPK) have provided deep insight into the disposition of ART, even in altered physiological states (like pregnancy). These models often avert the need of intensive in vivo clinical trials by utilizing historical controls for validation. As a representative example, Colbers et al modeled DRV/RTV PK in pregnancy to determine the impact of altered expression of drug transporters and demonstrated that 600/100 mg twice daily dosing can compensate for the predicted decrease in DRV exposure of 800/100 mg once daily dosing.99 Because PBPK models are constructed from a “bottom-up” approach (i.e. organ by organ) these are ideally suited for the study of ART and other HIV cure approaches in difficult to sample tissues not that exhibit evidence of compartmentalization. While an extensive review on PBPK models is beyond the scope of this review, the authors refer readers to a primer article by Jones and Rowland-Yeo.100
For the LRAs, there have been few published mathematical models, and we direct the readers to a review of modeling cure strategies by Hernandez-Vargas.101 Briefly, Ke et al fitted dynamic models and measured induction of HIV transcription, demonstrating that induction from vorinostat was transient and concluded that vorinostat treatment alone is not sufficient to induce virion production and the modeled effect on HIV reservoir size of vorinostat combined with a clearance strategy of cytotoxic T cell mediated killing was minimal.102 This model can serve as a framework for other exploratory LRAs or LRA combinations and highlights the flexibility of pharmacometrics. Additionally, Policicchio et al developed a model incorporating data from in vivo reactivation experiments following three doses of romidepsin every 35–50 days in SIV-infected NHPs.103 The authors demonstrated an increase in T cell activation as well as viral rebounds (104 copies/mL) 5–12 days after treatment, indicating that romidepsin increases viral expression but does not diminish T cell function to control replication.103 Similar to the implications of the previously described models, this can serve as a framework to prioritize potential cure strategies with LRAs and/or combination of LRAs with immune modulators for animal and human study.
Mathematical approaches to modelling the PK/PD of LRAs and other HIV cure strategies can propel the field forward through a deeper understanding of pharmacology, biology, and immunology. Modelling approaches that incorporate in vitro experiments, in vivo animal studies, and clinical trials, will help bridge the knowledge gaps and invite experts from numerous fields into the HIV cure space to further the goal of HIV cure.
Long-Acting HIV Treatment
Utilizing current ART to achieve either a functional or sterilizing cure creates a formidable obstacle as it is especially difficult to parse out whether HIV persists because of sporadic periods of non-adherence rather than compartmentalization and pharmacologic sanctuaries. Upon initiating ART, virus in the blood is cleared more quickly than in the tissues because long-lived cells that might become infected primarily reside in the latter. Thus, a brief drug holiday between routine clinic visits may not be made apparent by plasma viral load. Long-acting formulations are appealing as a strategy to overcome the possibility of incomplete adherence. These have been reviewed previously by Edagwa et al104 and more recently by Cobb et al.105
Currently, cabotegravir (CAB), RPV and islatravir (ISL) are being studied as long-acting formulations in clinical trials. In the Phase III LATTE-2 study an intramuscular injection of CAB (a novel INSTI) and RPV every 4- and 8-weeks demonstrated non-inferiority in suppressing plasma HIV RNA when compared with standard of care oral treatment regimens.106 ISL (a nucleoside reverse transcriptase translocation inhibitor; NRTTI) exhibits a very long intracellular half-life (78.5 to 128 hours) which may allow for once monthly oral administration and is being studied as HIV PrEP in an ongoing Phase III trial (clinicaltrials.gov, NCT04003103). ISL has also been formulated into a subcutaneous, drug-eluting implant which has been studied in a Phase I clinical trial.107 Drug eluting implants – historically utilized for hormonal contraception – are of particular interest in the HIV treatment and prevention fields for their potential to provide more predictable ARV release for up to 5 years and have been reviewed extensively elsewhere.108
Specialized formulations designed to extend dosing intervals may also augment ART distribution into tissues via alterations in the chemical make-up of the vehicles in which ART resides (e.g. lipid nanoparticles).104 For instance, lipid nanoparticles have been formulated that establish precedent that combination ART can be delivered through one administration. Freeling et al subcutaneously administered lipid nanoparticle formulations of LPV 25 mg/kg, RTV 14.3 mg/kg, and TFV 17.1 mg/kg into four NHPs.109 The authors noted that in the primates dosed with the lipid nanoparticle formulation, intracellular concentrations of LPV and RTV were 50-fold higher compared to the control group that received matched dosing with immediate release formulations.109 Guo et al examined a novel nanoformulation 3TC in male Balb/cJ mice110 and found concentrations in the liver, LN, and spleen, ranged from 5–15 ng/g after 14 days post dose versus undetectable following conventional 3TC formulations. Similarly, nanoformulated ABC exhibits 2.6-4.9-fold higher tissue distribution when compared with conventional formulation.111 These results demonstrate the implications of chemical alterations to enhance distribution into tissue reservoirs.
Mass Spectrometric Imaging Analyses
Conventionally, the gold standard for tissue quantification of ART and other small molecules has been HPLC-MS/MS in homogenates of tissues, which assume uniform distribution across tissues. This has provided insight into the tissue reservoir, but only an average across the entire tissue. Heterogenous distribution may indicate that seemingly high ART concentrations – as measured by homogenized tissues – are not adequate because ART is restricted from the spatial location of latently infected cell.
A novel mass spectrometry imaging method – known as infrared matrix-assisted laser desorption electrospray ionization (IR-MALDESI) – provides key spatial information of distribution of small molecules across a tissue slice, and the process and workflow of this methodology has been described in detail previously.112 This approach can be used to overlay contiguous slices of tissue and create map of ART spatial distribution (from IR-MALDESI) compared to that of CD4+ T cells (from immunohistochemistry), and that of viral particles (from in situ hybridization). These PK/PD maps may be used to illustrate potential failure of xenobiotics to distribute to the exact site of action with a tissue at the microanatomical level. Conclusions from this pharmacological approach may demonstrate that ART distribution does not necessarily “travel” to where the virus is located, either cell-associated or not.
Indeed, this holistic analysis has been demonstrated previously in the GIT.112 The authors measured distribution of ART in relation to CD3+ T cells and noted that nearly half of the T cells remained unexposed to ART.112 This potential for suboptimal concentrations on a geographical level sheds light on the limitations of current ART to distribute where virus is located, and this work is ongoing by our group in lymph nodes and spleen. To our knowledge, there are no spatial data for LRAs, and evaluation alongside ART would provide an understanding of how effective the Kick in the “Kick and Kill” strategy is on a more granular and geographic scale.
Concluding Thoughts
Elucidating and fully characterizing the HIV reservoir has been the major obstacle to developing a cure since the first case was described nearly 5 decades ago. Fully defining the site of action for an HIV cure and characterizing pharmacology within that site of action remains an important consideration in accelerating the development of a cure. This review highlights an important knowledge gap regarding the distribution of LRAs (already in clinical trials) into their site of action. Fully characterizing the pharmacology of LRAs remains an important consideration for designing rational dosing modalities that maximize the likelihood of success of immune clearance by protected cells that could clear de novo virus via accompanied adequate ART penetration.
Future approaches to understanding pharmacology at the site of action in the context of both ART and LRAs will be needed to ensure first that reactivated virus does not infect uninfected host cells and 2) that the HIV reservoir cannot evade cure strategies within pharmacologic sanctuaries. Standardization of terminology used within the field including the term “cure” itself will allow for greater objectivity and transposable results to subsequent clinical trials examining these pharmacological options. Computational approaches to develop validated pharmacological models that are accepted by regulatory agencies may obviate the need for deep tissue sampling and encourage experts from other scientific disciplines to lend their fresh perspectives and unique skills to advance an HIV cure. Lastly, technological advances within analytical chemistry can provide additional, granular data to help characterize the PK/PD relationships of curative strategies at the microanatomical level. In combination, these advances will assist in filling important knowledge gaps and accelerating an HIV cure.
Acknowledgements
The authors wish to acknowledge and thank Ms. Talisa Kinsale for her assistance in designing Figure 1, outlining the flow of information presented in our review, and assisting with the literature search preceding the review.
Funding Information:
This work was supported by the University of North Carolina at Chapel Hill Center for AIDS Research (CFAR), an NIH funded program P30 AI050410. ASD is supported by the National Institute of General Medical Sciences of the NIH under Award Number T32GM086330. The content is solely the responsibility of the authors and does not necessarily represent the official views of National Institutes of Health.
Conflict of Interest:
MLC is faculty within the University of North Carolina (UNC) HIV Cure Center, a public-private partnership between UNC and ViiV Healthcare, and has received research support from the Center. All other authors declared no competing interests for this work.
References
- 1.Chun TW et al. Early establishment of a pool of latently infected, resting CD4(+) T cells during primary HIV-1 infection. Proc. Natl. Acad. Sci. USA 95, 8869–8873 (1998). [DOI] [PMC free article] [PubMed] [Google Scholar]
- 2.Perelson AS et al. Decay characteristics of HIV-1-infected compartments during combination therapy. Nature 387, 188–191 (1997). [DOI] [PubMed] [Google Scholar]
- 3.Gandhi RT Intact Proviral DNA Levels Decline in People with HIV on Antiretroiral Therapy. Presented at: Conference on Retroviruses and Opportunistic Infections 2020 (Abstract #75). (2020).at <https://www.croiconference.org/abstract/intact-proviral-dna-levels-decline-in-people-with-hiv-on-antiretroviral-therapy/> [Google Scholar]
- 4.Pitman MC, Lau JSY, McMahon JH & Lewin SR Barriers and strategies to achieve a cure for HIV. Lancet HIV 5, e317–e328 (2018). [DOI] [PMC free article] [PubMed] [Google Scholar]
- 5.Zerbato JM, Purves HV, Lewin SR & Rasmussen TA Between a shock and a hard place: challenges and developments in HIV latency reversal. Curr Opin Virol 38, 1–9 (2019). [DOI] [PMC free article] [PubMed] [Google Scholar]
- 6.Nixon CC et al. Systemic HIV and SIV latency reversal via non-canonical NF-κB signalling in vivo. Nature 578, 160–165 (2020). [DOI] [PMC free article] [PubMed] [Google Scholar]
- 7.Sengupta S & Siliciano RF Targeting the Latent Reservoir for HIV-1. Immunity 48, 872–895 (2018). [DOI] [PMC free article] [PubMed] [Google Scholar]
- 8.Churchill MJ, Deeks SG, Margolis DM, Siliciano RF & Swanstrom R HIV reservoirs: what, where and how to target them. Nat. Rev. Microbiol 14, 55–60 (2016). [DOI] [PubMed] [Google Scholar]
- 9.Chaillon A et al. HIV persists throughout deep tissues with repopulation from multiple anatomical sources. J. Clin. Invest 130, 1699–1712 (2020). [DOI] [PMC free article] [PubMed] [Google Scholar]
- 10.Fletcher CV et al. Persistent HIV-1 replication is associated with lower antiretroviral drug concentrations in lymphatic tissues. Proc. Natl. Acad. Sci. USA 111, 2307–2312 (2014). [DOI] [PMC free article] [PubMed] [Google Scholar]
- 11.Lorenzo-Redondo R et al. Persistent HIV-1 replication maintains the tissue reservoir during therapy. Nature 530, 51–56 (2016). [DOI] [PMC free article] [PubMed] [Google Scholar]
- 12.Canestri A et al. Discordance between cerebral spinal fluid and plasma HIV replication in patients with neurological symptoms who are receiving suppressive antiretroviral therapy. Clin. Infect. Dis 50, 773–778 (2010). [DOI] [PubMed] [Google Scholar]
- 13.Nolan DJ et al. The Spleen Is an HIV-1 Sanctuary During Combined Antiretroviral Therapy. AIDS Res. Hum. Retroviruses 34, 123–125 (2018). [DOI] [PMC free article] [PubMed] [Google Scholar]
- 14.Yukl SA et al. The distribution of HIV DNA and RNA in cell subsets differs in gut and blood of HIV-positive patients on ART: implications for viral persistence. J. Infect. Dis 208, 1212–1220 (2013). [DOI] [PMC free article] [PubMed] [Google Scholar]
- 15.Fois AF & Brew BJ The Potential of the CNS as a Reservoir for HIV-1 Infection: Implications for HIV Eradication. Curr HIV/AIDS Rep 12, 299–303 (2015). [DOI] [PubMed] [Google Scholar]
- 16.Joseph SB et al. Human Immunodeficiency Virus Type 1 RNA Detected in the Central Nervous System (CNS) After Years of Suppressive Antiretroviral Therapy Can Originate from a Replicating CNS Reservoir or Clonally Expanded Cells. Clin. Infect. Dis 69, 1345–1352 (2019). [DOI] [PMC free article] [PubMed] [Google Scholar]
- 17.Pérez-Valero I et al. Cerebrospinal fluid viral escape in aviremic HIV-infected patients receiving antiretroviral therapy: prevalence, risk factors and neurocognitive effects. AIDS 33, 475–481 (2019). [DOI] [PMC free article] [PubMed] [Google Scholar]
- 18.Calcagno A, Perri G & Bonora S. Pharmacokinetics and pharmacodynamics of antiretrovirals in the central nervous system. Clin Pharmacokinet 53, 891–906 (2014). [DOI] [PubMed] [Google Scholar]
- 19.Calcagno A et al. Cerebrospinal fluid inhibitory quotients of antiretroviral drugs in HIV-infected patients are associated with compartmental viral control. Clin. Infect. Dis 60, 311–317 (2015). [DOI] [PubMed] [Google Scholar]
- 20.Nguyen A et al. Etravirine in CSF is highly protein bound. J. Antimicrob. Chemother 68, 1161–1168 (2013). [DOI] [PMC free article] [PubMed] [Google Scholar]
- 21.Mora-Peris B et al. Rilpivirine exposure in plasma and sanctuary site compartments after switching from nevirapine-containing combined antiretroviral therapy. J. Antimicrob. Chemother 69, 1642–1647 (2014). [DOI] [PubMed] [Google Scholar]
- 22.Best BM et al. Low cerebrospinal fluid concentrations of the nucleotide HIV reverse transcriptase inhibitor, tenofovir. J. Acquir. Immune Defic. Syndr 59, 376–381 (2012). [DOI] [PMC free article] [PubMed] [Google Scholar]
- 23.Lahiri CD et al. Cerebrospinal fluid concentrations of tenofovir and emtricitabine in the setting of HIV-1 protease inhibitor-based regimens. J. Clin. Pharmacol 56, 492–496 (2016). [DOI] [PMC free article] [PubMed] [Google Scholar]
- 24.Foudraine NA et al. Cerebrospinal-fluid HIV-1 RNA and drug concentrations after treatment with lamivudine plus zidovudine or stavudine. Lancet 351, 1547–1551 (1998). [DOI] [PubMed] [Google Scholar]
- 25.Capparelli EV et al. Population pharmacokinetics of abacavir in plasma and cerebrospinal fluid. Antimicrob. Agents Chemother 49, 2504–2506 (2005). [DOI] [PMC free article] [PubMed] [Google Scholar]
- 26.Srinivas N et al. Antiretroviral concentrations and surrogate measures of efficacy in the brain tissue and CSF of preclinical species. Xenobiotica 49, 1192–1201 (2019). [DOI] [PMC free article] [PubMed] [Google Scholar]
- 27.Best BM et al. Low atazanavir concentrations in cerebrospinal fluid. AIDS 23, 83–87 (2009). [DOI] [PMC free article] [PubMed] [Google Scholar]
- 28.Croteau D et al. Darunavir is predominantly unbound to protein in cerebrospinal fluid and concentrations exceed the wild-type HIV-1 median 90% inhibitory concentration. J. Antimicrob. Chemother 68, 684–689 (2013). [DOI] [PMC free article] [PubMed] [Google Scholar]
- 29.DiCenzo R, DiFrancesco R, Cruttenden K, Donnelly J & Schifitto G Lopinavir cerebrospinal fluid steady-state trough concentrations in HIV-infected adults. Ann. Pharmacother 43, 1972–1977 (2009). [DOI] [PubMed] [Google Scholar]
- 30.Ma Q et al. Switching to Tenofovir Alafenamide in Elvitegravir-Based Regimens: Pharmacokinetics and Antiviral Activity in Cerebrospinal Fluid. Clin. Infect. Dis 71, 982–988 (2020). [DOI] [PMC free article] [PubMed] [Google Scholar]
- 31.Letendre SL et al. ING116070: a study of the pharmacokinetics and antiviral activity of dolutegravir in cerebrospinal fluid in HIV-1-infected, antiretroviral therapy-naive subjects. Clin. Infect. Dis 59, 1032–1037 (2014). [DOI] [PMC free article] [PubMed] [Google Scholar]
- 32.Tiraboschi J et al. Total and Unbound Bictegravir Concentrations and Viral Suppression in Cerebrospinal Fluid of Human Immunodeficiency Virus-Infected Patients (Spanish HIV/AIDS Research Network, PreEC/RIS 56). J. Infect. Dis 221, 1425–1428 (2020). [DOI] [PubMed] [Google Scholar]
- 33.Croteau D et al. Total raltegravir concentrations in cerebrospinal fluid exceed the 50-percent inhibitory concentration for wild-type HIV-1. Antimicrob. Agents Chemother 54, 5156–5160 (2010). [DOI] [PMC free article] [PubMed] [Google Scholar]
- 34.Tiraboschi JM, Niubo J, Curto J & Podzamczer D Maraviroc concentrations in cerebrospinal fluid in HIV-infected patients. J. Acquir. Immune Defic. Syndr 55, 606–609 (2010). [DOI] [PubMed] [Google Scholar]
- 35.Wallet C et al. Microglial Cells: The Main HIV-1 Reservoir in the Brain. Front. Cell Infect. Microbiol 9, 362 (2019). [DOI] [PMC free article] [PubMed] [Google Scholar]
- 36.Srinivas N, Maffuid K & Kashuba ADM Clinical pharmacokinetics and pharmacodynamics of drugs in the central nervous system. Clin Pharmacokinet 57, 1059–1074 (2018). [DOI] [PMC free article] [PubMed] [Google Scholar]
- 37.Gray LR et al. Toxicity and in vitro activity of HIV-1 latency-reversing agents in primary CNS cells. J. Neurovirol 22, 455–463 (2016). [DOI] [PubMed] [Google Scholar]
- 38.Jagarapu A, Piovoso MJ & Zurakowski R An Integrated Spatial Dynamics-Pharmacokinetic Model Explaining Poor Penetration of Anti-retroviral Drugs in Lymph Nodes. Front. Bioeng. Biotechnol 8, 667 (2020). [DOI] [PMC free article] [PubMed] [Google Scholar]
- 39.Horiike M et al. Lymph nodes harbor viral reservoirs that cause rebound of plasma viremia in SIV-infected macaques upon cessation of combined antiretroviral therapy. Virology 423, 107–118 (2012). [DOI] [PubMed] [Google Scholar]
- 40.Rosenbloom DIS, Hill AL, Laskey SB & Siliciano RF Re-evaluating evolution in the HIV reservoir. Nature 551, E6–E9 (2017). [DOI] [PMC free article] [PubMed] [Google Scholar]
- 41.Cottrell ML, Srinivas N & Kashuba ADM Pharmacokinetics of antiretrovirals in mucosal tissue. Expert Opin Drug Metab Toxicol 11, 893–905 (2015). [DOI] [PMC free article] [PubMed] [Google Scholar]
- 42.Solas C et al. Discrepancies between protease inhibitor concentrations and viral load in reservoirs and sanctuary sites in human immunodeficiency virus-infected patients. Antimicrob. Agents Chemother 47, 238–243 (2003). [DOI] [PMC free article] [PubMed] [Google Scholar]
- 43.Fletcher CV et al. The Lymphoid Tissue Pharmacokinetics of Tenofovir Disoproxil Fumarate and Tenofovir Alafenamide in HIV-Infected Persons. Clin. Pharmacol. Ther (2020).doi: 10.1002/cpt.1883 [DOI] [PMC free article] [PubMed] [Google Scholar]
- 44.Lee SA et al. Antiretroviral Therapy Concentrations Differ in Gut vs. Lymph Node Tissues and Are Associated With HIV Viral Transcription by a Novel RT-ddPCR Assay. J. Acquir. Immune Defic. Syndr 83, 530–537 (2020). [DOI] [PMC free article] [PubMed] [Google Scholar]
- 45.Dyavar SR et al. Assessing the lymphoid tissue bioavailability of antiretrovirals in human primary lymphoid endothelial cells and in mice. J. Antimicrob. Chemother 74, 2974–2978 (2019). [DOI] [PMC free article] [PubMed] [Google Scholar]
- 46.Rosen E et al. Panobinostat distribution in rhesus macaque lymph nodes following anti-latency therapy. Presented at the 9th IAS Conference on HIV Science. (2017).at <http://programme.ias2017.org/Abstract/Abstract/4693> [Google Scholar]
- 47.Norton NJ, Mok HP, Sharif F, Hirst JC & Lever AML HIV silencing and inducibility are heterogeneous and are affected by factors intrinsic to the virus. MBio 10, (2019). [DOI] [PMC free article] [PubMed] [Google Scholar]
- 48.Cesta MF Normal structure, function, and histology of the spleen. Toxicol. Pathol 34, 455–465 (2006). [DOI] [PubMed] [Google Scholar]
- 49.Devanathan AS et al. Antiretroviral penetration and drug transporter concentrations in the spleens of three preclinical animal models and humans. Antimicrob. Agents Chemother (2020).doi: 10.1128/AAC.01384-20 [DOI] [PMC free article] [PubMed] [Google Scholar]
- 50.Devanathan AS et al. Antiretroviral Penetration across Three Preclinical Animal Models and Humans in Eight Putative HIV Viral Reservoirs. Antimicrob. Agents Chemother 64, (2019). [DOI] [PMC free article] [PubMed] [Google Scholar]
- 51.Guo Y et al. Therapeutic potential of Pak1 inhibition for pain associated with cutaneous burn injury. Mol. Pain 14, 1744806918788648 (2018). [DOI] [PMC free article] [PubMed] [Google Scholar]
- 52.Perrin J et al. Identifying drug targets in tissues and whole blood with thermal-shift profiling. Nat. Biotechnol 38, 303–308 (2020). [DOI] [PubMed] [Google Scholar]
- 53.Guadalupe M et al. Severe CD4+ T-cell depletion in gut lymphoid tissue during primary human immunodeficiency virus type 1 infection and substantial delay in restoration following highly active antiretroviral therapy. J. Virol 77, 11708–11717 (2003). [DOI] [PMC free article] [PubMed] [Google Scholar]
- 54.Sainz T et al. Delayed gastrointestinal-associated lymphoid tissue reconstitution in duodenum compared with rectum in HIV-infected patients initiating antiretroviral therapy. AIDS 33, 2289–2298 (2019). [DOI] [PMC free article] [PubMed] [Google Scholar]
- 55.van Marle G et al. Compartmentalization of the gut viral reservoir in HIV-1 infected patients. Retrovirology 4, 87 (2007). [DOI] [PMC free article] [PubMed] [Google Scholar]
- 56.Thompson CG, Cohen MS & Kashuba ADM Antiretroviral pharmacology in mucosal tissues. J. Acquir. Immune Defic. Syndr 63 Suppl 2, S240–7 (2013). [DOI] [PMC free article] [PubMed] [Google Scholar]
- 57.Trezza CR & Kashuba ADM Pharmacokinetics of antiretrovirals in genital secretions and anatomic sites of HIV transmission: implications for HIV prevention. Clin Pharmacokinet 53, 611–624 (2014). [DOI] [PMC free article] [PubMed] [Google Scholar]
- 58.Patterson KB et al. Penetration of tenofovir and emtricitabine in mucosal tissues: implications for prevention of HIV-1 transmission. Sci. Transl. Med 3, 112re4 (2011). [DOI] [PMC free article] [PubMed] [Google Scholar]
- 59.Brown KC et al. Single- and multiple-dose pharmacokinetics of darunavir plus ritonavir and etravirine in semen and rectal tissue of HIV-negative men. J. Acquir. Immune Defic. Syndr 61, 138–144 (2012). [DOI] [PMC free article] [PubMed] [Google Scholar]
- 60.Gay CL et al. Efficacy, pharmacokinetics and neurocognitive performance of dual, NRTI-sparing antiretroviral therapy in acute HIV-infection. AIDS 34, 1923–1931 (2020). [DOI] [PMC free article] [PubMed] [Google Scholar]
- 61.Jackson AGA et al. A compartmental pharmacokinetic evaluation of long-acting rilpivirine in HIV-negative volunteers for pre-exposure prophylaxis. Clin. Pharmacol. Ther 96, 314–323 (2014). [DOI] [PubMed] [Google Scholar]
- 62.Massud I et al. Single oral dose for HIV pre or post-exposure prophylaxis: user desirability and biological efficacy in macaques. EBioMedicine 58, 102894 (2020). [DOI] [PMC free article] [PubMed] [Google Scholar]
- 63.Greener BN et al. Dolutegravir pharmacokinetics in the genital tract and colorectum of HIV-negative men after single and multiple dosing. J. Acquir. Immune Defic. Syndr 64, 39–44 (2013). [DOI] [PMC free article] [PubMed] [Google Scholar]
- 64.Patterson KB et al. Differential penetration of raltegravir throughout gastrointestinal tissue: implications for eradication and cure. AIDS 27, 1413–1419 (2013). [DOI] [PMC free article] [PubMed] [Google Scholar]
- 65.Imaz A et al. Dynamics of the decay of HIV RNA and distribution of bictegravir in the genital tract and rectum in antiretroviral-naïve HIV-1-infected adults treated with bictegravir/emtricitabine/tenofovir alafenamide (Spanish HIV/AIDS Research Network, PreEC/RIS 58). Clin. Infect. Dis (2020).doi: 10.1093/cid/ciaa1416 [DOI] [PMC free article] [PubMed] [Google Scholar]
- 66.Bjerg Christensen A et al. Administration of Panobinostat Is Associated with Increased IL-17A mRNA in the Intestinal Epithelium of HIV-1 Patients. Mediators Inflamm. 2015, 120605 (2015). [DOI] [PMC free article] [PubMed] [Google Scholar]
- 67.Elliott JH et al. Activation of HIV transcription with short-course vorinostat in HIV-infected patients on suppressive antiretroviral therapy. PLoS Pathog. 10, e1004473 (2014). [DOI] [PMC free article] [PubMed] [Google Scholar]
- 68.Huang Y et al. Antiretroviral drug transporters and metabolic enzymes in human testicular tissue: potential contribution to HIV-1 sanctuary site. J. Antimicrob. Chemother 71, 1954–1965 (2016). [DOI] [PMC free article] [PubMed] [Google Scholar]
- 69.Imaz A et al. HIV-1-RNA Decay and Dolutegravir Concentrations in Semen of Patients Starting a First Antiretroviral Regimen. J. Infect. Dis 214, 1512–1519 (2016). [DOI] [PMC free article] [PubMed] [Google Scholar]
- 70.Miller RL et al. HIV Diversity and Genetic Compartmentalization in Blood and Testes during Suppressive Antiretroviral Therapy. J. Virol 93, (2019). [DOI] [PMC free article] [PubMed] [Google Scholar]
- 71.Nicol MR, Corbino JA & Cottrell ML Pharmacology of antiretrovirals in the female genital tract for HIV prevention. J. Clin. Pharmacol 58, 1381–1395 (2018). [DOI] [PMC free article] [PubMed] [Google Scholar]
- 72.Cottrell ML et al. Cervicovaginal and rectal fluid as a surrogate marker of antiretroviral tissue concentration: implications for clinical trial design. J. Acquir. Immune Defic. Syndr 72, 498–506 (2016). [DOI] [PMC free article] [PubMed] [Google Scholar]
- 73.Low AJ et al. Cervicovaginal HIV-1 shedding in women taking antiretroviral therapy in Burkina Faso: a longitudinal study. J. Acquir. Immune Defic. Syndr 65, 237–245 (2014). [DOI] [PMC free article] [PubMed] [Google Scholar]
- 74.Cu-Uvin S et al. Genital tract HIV-1 RNA shedding among women with below detectable plasma viral load. AIDS 24, 2489–2497 (2010). [DOI] [PubMed] [Google Scholar]
- 75.Denton PW et al. Targeted cytotoxic therapy kills persisting HIV infected cells during ART. PLoS Pathog. 10, e1003872 (2014). [DOI] [PMC free article] [PubMed] [Google Scholar]
- 76.Savage AC et al. Improving maraviroc oral bioavailability by formation of solid drug nanoparticles. Eur J Pharm Biopharm 138, 30–36 (2019). [DOI] [PubMed] [Google Scholar]
- 77.Mascio M. Di et al. Antiretroviral tissue kinetics: in vivo imaging using positron emission tomography. Antimicrob. Agents Chemother 53, 4086–4095 (2009). [DOI] [PMC free article] [PubMed] [Google Scholar]
- 78.Desai J & Thakkar H Darunavir-Loaded Lipid Nanoparticles for Targeting to HIV Reservoirs. AAPS PharmSciTech 19, 648–660 (2018). [DOI] [PubMed] [Google Scholar]
- 79.Gautam N et al. Simultaneous quantification of intracellular lamivudine and abacavir triphosphate metabolites by LC-MS/MS. J. Pharm. Biomed. Anal 153, 248–259 (2018). [DOI] [PMC free article] [PubMed] [Google Scholar]
- 80.Ahammed V et al. Development and in vivo evaluation of functionalized ritonavir proliposomes for lymphatic targeting. Life Sci. 183, 11–20 (2017). [DOI] [PubMed] [Google Scholar]
- 81.Haraguchi S, Ho SK, Morrow M, Goodenow MM & Sleasman JW Developmental regulation of P-glycoprotein activity within thymocytes results in increased anti-HIV protease inhibitor activity. J. Leukoc. Biol 90, 653–660 (2011). [DOI] [PMC free article] [PubMed] [Google Scholar]
- 82.Estella-Hermoso de Mendoza A et al. Development and validation of ultra high performance liquid chromatography-mass spectrometry method for LBH589 in mouse plasma and tissues. J. Chromatogr. B, Analyt. Technol. Biomed. Life Sci 879, 3490–3496 (2011). [DOI] [PubMed] [Google Scholar]
- 83.Clive S et al. Characterizing the disposition, metabolism, and excretion of an orally active pan-deacetylase inhibitor, panobinostat, via trace radiolabeled 14C material in advanced cancer patients. Cancer Chemother. Pharmacol 70, 513–522 (2012). [DOI] [PubMed] [Google Scholar]
- 84.Archin NM et al. Valproic acid without intensified antiviral therapy has limited impact on persistent HIV infection of resting CD4+ T cells. AIDS 22, 1131–1135 (2008). [DOI] [PMC free article] [PubMed] [Google Scholar]
- 85.Kim SW et al. Whole-body pharmacokinetics of HDAC inhibitor drugs, butyric acid, valproic acid and 4-phenylbutyric acid measured with carbon-11 labeled analogs by PET. Nucl Med Biol 40, 912–918 (2013). [DOI] [PMC free article] [PubMed] [Google Scholar]
- 86.Correa-Basurto AM et al. Pharmacokinetics and tissue distribution of N-(2-hydroxyphenyl)-2-propylpentanamide in Wistar Rats and its binding properties to human serum albumin. J. Pharm. Biomed. Anal 162, 130–139 (2019). [DOI] [PubMed] [Google Scholar]
- 87.Hütter G et al. Long-term control of HIV by CCR5 Delta32/Delta32 stem-cell transplantation. N. Engl. J. Med 360, 692–698 (2009). [DOI] [PubMed] [Google Scholar]
- 88.Gupta RK et al. Evidence for HIV-1 cure after CCR5Δ32/Δ32 allogeneic haemopoietic stem-cell transplantation 30 months post analytical treatment interruption: a case report. Lancet HIV 7, e340–e347 (2020). [DOI] [PMC free article] [PubMed] [Google Scholar]
- 89.Henrich TJ et al. Antiretroviral-free HIV-1 remission and viral rebound after allogeneic stem cell transplantation: report of 2 cases. Ann. Intern. Med 161, 319–327 (2014). [DOI] [PMC free article] [PubMed] [Google Scholar]
- 90.Henrich TJ et al. HIV-1 persistence following extremely early initiation of antiretroviral therapy (ART) during acute HIV-1 infection: An observational study. PLoS Med. 14, e1002417 (2017). [DOI] [PMC free article] [PubMed] [Google Scholar]
- 91.Luzuriaga K et al. Viremic relapse after HIV-1 remission in a perinatally infected child. N. Engl. J. Med 372, 786–788 (2015). [DOI] [PMC free article] [PubMed] [Google Scholar]
- 92.Julg B et al. Recommendations for analytical antiretroviral treatment interruptions in HIV research trials-report of a consensus meeting. Lancet HIV 6, e259–e268 (2019). [DOI] [PMC free article] [PubMed] [Google Scholar]
- 93.Zerbato JM & Lewin SR A cure for HIV: how would we know? Lancet HIV 7, e304–e306 (2020). [DOI] [PubMed] [Google Scholar]
- 94.Sykes W et al. Discovery of False Elite Controllers: HIV Antibody-Positive RNA-Negative Blood Donors Found To Be on Antiretroviral Therapy. J. Infect. Dis 220, 643–647 (2019). [DOI] [PMC free article] [PubMed] [Google Scholar]
- 95.Fogel JM et al. Undisclosed antiretroviral drug use in a multinational clinical trial (HIV Prevention Trials Network 052). J. Infect. Dis 208, 1624–1628 (2013). [DOI] [PMC free article] [PubMed] [Google Scholar]
- 96.Moyo S et al. Undisclosed antiretroviral drug use in Botswana: implication for national estimates. AIDS 32, 1543–1546 (2018). [DOI] [PMC free article] [PubMed] [Google Scholar]
- 97.Anderson PL et al. Intracellular Tenofovir-Diphosphate and Emtricitabine-Triphosphate in Dried Blood Spots following Directly Observed Therapy. Antimicrob. Agents Chemother 62, (2018). [DOI] [PMC free article] [PubMed] [Google Scholar]
- 98.Spinelli MA et al. Approaches to objectively measure antiretroviral medication adherence and drive adherence interventions. Curr HIV/AIDS Rep 17, 301–314 (2020). [DOI] [PMC free article] [PubMed] [Google Scholar]
- 99.Colbers A, Greupink R, Litjens C, Burger D & Russel FGM Physiologically based modelling of darunavir/ritonavir pharmacokinetics during pregnancy. Clin Pharmacokinet 55, 381–396 (2016). [DOI] [PMC free article] [PubMed] [Google Scholar]
- 100.Jones H & Rowland-Yeo K Basic concepts in physiologically based pharmacokinetic modeling in drug discovery and development. CPT Pharmacometrics Syst. Pharmacol 2, e63 (2013). [DOI] [PMC free article] [PubMed] [Google Scholar]
- 101.Hernandez-Vargas EA Modeling Kick-Kill Strategies toward HIV Cure. Front. Immunol 8, 995 (2017). [DOI] [PMC free article] [PubMed] [Google Scholar]
- 102.Ke R, Lewin SR, Elliott JH & Perelson AS Modeling the Effects of Vorinostat In Vivo Reveals both Transient and Delayed HIV Transcriptional Activation and Minimal Killing of Latently Infected Cells. PLoS Pathog. 11, e1005237 (2015). [DOI] [PMC free article] [PubMed] [Google Scholar]
- 103.Policicchio BB et al. Multi-dose Romidepsin Reactivates Replication Competent SIV in Post-antiretroviral Rhesus Macaque Controllers. PLoS Pathog. 12, e1005879 (2016). [DOI] [PMC free article] [PubMed] [Google Scholar]
- 104.Edagwa B, McMillan J, Sillman B & Gendelman HE Long-acting slow effective release antiretroviral therapy. Expert Opin Drug Deliv 1–11 (2017).doi: 10.1080/17425247.2017.1288212 [DOI] [PMC free article] [PubMed] [Google Scholar]
- 105.Cobb DA, Smith NA, Edagwa BJ & McMillan JM Long-acting approaches for delivery of antiretroviral drugs for prevention and treatment of HIV: a review of recent research. Expert Opin Drug Deliv 17, 1227–1238 (2020). [DOI] [PMC free article] [PubMed] [Google Scholar]
- 106.Margolis DA et al. Long-acting intramuscular cabotegravir and rilpivirine in adults with HIV-1 infection (LATTE-2): 96-week results of a randomised, open-label, phase 2b, non-inferiority trial. Lancet 390, 1499–1510 (2017). [DOI] [PubMed] [Google Scholar]
- 107.Matthews RP et al. First-in-human trial of MK-8591-eluting implants demonstrates concentrations suitable for HIV prophylaxis for at least one year. (2019).at <https://programme.ias2019.org/Abstract/Abstract/4843>
- 108.Weld ED & Flexner C Long-acting implants to treat and prevent HIV infection. Curr Opin HIV AIDS 15, 33–41 (2020). [DOI] [PMC free article] [PubMed] [Google Scholar]
- 109.Freeling JP, Koehn J, Shu C, Sun J & Ho RJY Anti-HIV drug-combination nanoparticles enhance plasma drug exposure duration as well as triple-drug combination levels in cells within lymph nodes and blood in primates. AIDS Res. Hum. Retroviruses 31, 107–114 (2015). [DOI] [PMC free article] [PubMed] [Google Scholar]
- 110.Guo D et al. Creation of a Long-Acting Nanoformulated 2’,3’-Dideoxy-3’-Thiacytidine. J. Acquir. Immune Defic. Syndr 74, e75–e83 (2017). [DOI] [PMC free article] [PubMed] [Google Scholar]
- 111.Singh D et al. Development and characterization of a long-acting nanoformulated abacavir prodrug. Nanomedicine (Lond.) 11, 1913–1927 (2016). [DOI] [PMC free article] [PubMed] [Google Scholar]
- 112.Thompson CG et al. Heterogeneous antiretroviral drug distribution and HIV/SHIV detection in the gut of three species. Sci. Transl. Med 11, (2019). [DOI] [PMC free article] [PubMed] [Google Scholar]