

Abstract
Although metabolism plays an active role in antibiotic lethality, antibiotic resistance is generally associated with drug target modification, enzymatic inactivation, and/or transport rather than metabolic processes. Evolution experiments of Escherichia coli rely on growth-dependent selection, which may provide a limited view of the antibiotic resistance landscape. We sequenced and analyzed E. coli adapted to representative antibiotics at increasingly heightened metabolic states. This revealed various underappreciated noncanonical genes, such as those related to central carbon and energy metabolism, which are implicated in antibiotic resistance. These metabolic alterations lead to lower basal respiration, which prevents antibiotic-mediated induction of tricarboxylic acid cycle activity, thus avoiding metabolic toxicity and minimizing drug lethality. Several of the identified metabolism-specific mutations are overrepresented in the genomes of >3500 clinical E. coli pathogens, indicating clinical relevance.
INTRODUCTION:
Despite the complexity of antibiotic lethality, canonical mechanisms of resistance are generally grouped into three broad categories: target modification, drug inactivation, and drug transport. Although metabolism has been shown to actively contribute to antibiotic lethality, antibiotic resistance mutations are infrequently identified in metabolic genes, and metabolic dysregulation is not a commonly cited mechanism of antibiotic resistance. One explanation is that previous approaches provide a limited view of the antibiotic resistance landscape. Indeed, laboratory evolutions paired with sequencing candidate genes and/or a small number of clonal isolates per condition highlight mutations that are either expected, or repeatedly occur, at high frequency. Moreover, antibiotic-mediated effects on bacterial metabolism involve numerous, complex, and coordinated biomolecular networks, which makes it challenging to predict candidates of likely resistance a priori. Additionally, the diversity of involved pathways increases the number of possible evolutionary outcomes, which reduces the likelihood for convergent mutations, and thus would be readily missed using previous methods. As a result, genetic mechanisms of antibiotic resistance related to metabolism are significantly understudied.
RATIONALE:
The importance of population-level analyses for understanding the evolutionary landscape in response to drug treatment is becoming increasingly recognized. Low-frequency mutants make up most genetic diversity within a population, and in many cases, beneficial mutations may drift to extinction before becoming established. This is particularly relevant for genes involved in cellular metabolism, in which the diverse array of metabolic pathways can lead to a myriad of potential evolutionary outcomes compared with canonical drug targets. As such, we sought to use a more comprehensive view afforded by both population and clonal analyses to elucidate metabolic aspects of antibiotic resistance. Moreover, considering these constraints, typical laboratory evolution protocols and their analysis methods are not optimized to detect mutations in metabolism-related genes. Constant antibiotic exposure imposes growth-dependent selection, and a lack of metabolic-specific selection pressure further minimizes the likelihood of enriching for metabolic-specific pathways and processes. Thus, we reasoned that maximizing metabolic rather than growth adaptation would allow us to shift these dynamics and further tease out antibiotic-specific metabolic variants.
RESULTS:
We sequenced and analyzed Escherichia coli adapted to three representative antibiotics at increasingly heightened metabolic states. Doing so revealed a variety of underappreciated noncanonical genes, such as those related to central carbon and energy metabolism, which are implicated in antibiotic resistance. These mutations in metabolic genes often arose in multiple independent populations and/or in response to more than one drug. Several of the identified metabolism-specific mutations are overrepresented in the genomes of >3500 clinical E. coli pathogens at levels similar to, and in some cases greater than, known resistance mutations indicating their clinical relevance. To evaluate whether these metabolic mutations confer resistance, we chose a representative subset of both genes related to metabolism and classic resistance on the basis of their prevalence and clinical significance. We expressed the wild-type and mutant variants of each gene from a medium-copy plasmid introduced into the corresponding chromosomal knockout strain. In all cases, metabolic mutations increased the minimum inhibitory concentration to at least one, and in many cases more than one, of the antibiotics. Finally, phenotypic and genotypic analyses of one representative mutation in the 2-oxoglutarate dehydrogenase (sucA) enzyme provides a preliminary picture of how altered metabolism gives rise to antibiotic resistance: Lower basal respiration prevents antibiotic-mediated induction of tricarboxylic acid cycle activity, thereby avoiding metabolic toxicity and minimizing lethality.
CONCLUSION:
Our findings that metabolic mutations arise in response to antibiotic treatment, and that these mutations confer resistance and are highly prevalent in clinical pathogens, suggests that the three general antibiotic resistance categories may not be as representative, nor the mechanisms as comprehensive, as previously thought. Indeed, metabolic adaptation may represent a separate class of resistance mechanisms beyond conferring tolerance, whereby cells also alter their metabolic response to mitigate downstream toxic aspects of antibiotic lethality.
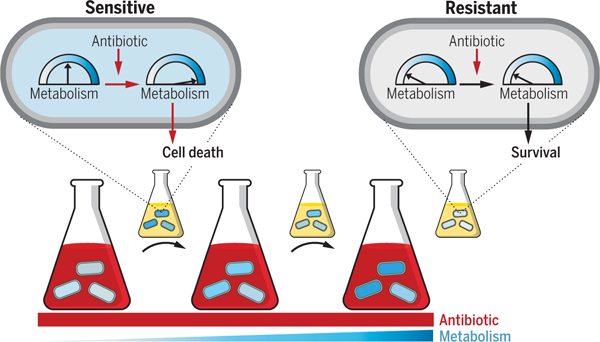
Graphical Abstract
Altered metabolic state confers antibiotic resistance. Cells were exposed to high antibiotic concentrations (red) for short durations under incrementally increasing metabolic states (blue), separated by rounds of drug-free growth (small flasks). Left to right indicates evolutionary time. Initially, antibiotic-mediated metabolic stimulation partially contributes to cell lethality (sensitive cell). Evolved cells acquire resistance caused by decreased basal metabolic activity that avoids antibiotic-mediated stimulation and subsequent lethality (resistant cell).
Canonical mechanisms of antibiotic resistance are associated with drug target modification, transport, or enzymatic inactivation (1, 2). Antibiotic resistance mutations are infrequently identified in metabolic genes, and metabolic dysregulation is not a commonly cited mechanism of antibiotic resistance, although metabolism has been shown to actively contribute to antibiotic lethality (3–5). Previous approaches may provide a limited view of the antibiotic resistance landscape (6–9) because they investigated candidate genes and/or a small number of clonal isolates (one to three) per condition (10–12) and highlighted mutations that are either expected or repeatedly occur at high frequency under these conditions (13, 14). Moreover, antibiotic-mediated effects on bacterial metabolism involve numerous, complex, and coordinated biomolecular networks, which makes it challenging to predict candidates of likely resistance a priori. Additionally, metabolic genes involved in antibiotic lethality are located downstream relative to primary drug targets, which may lead to a decreased likelihood of convergent mutations and therefore a higher probability of being overlooked with conventional methods (15, 16). Finally, because natural selection environments are more complex than their simplified experimental counterparts, in vitro mutation frequencies do not necessarily capture those present in the clinical setting.
The importance of population-level analyses for understanding the evolutionary landscape in response to drug treatment is becoming increasingly recognized (6, 17, 18). Low-frequency mutants make up most genetic diversity within a population, and in many cases, beneficial mutations may drift to extinction before becoming established (19). This is particularly relevant for genes involved in cellular metabolism, in which the diverse array of metabolic pathways can lead to a myriad of potential evolutionary outcomes compared with canonical drug targets.
The ubiquitous role of metabolism within the cellular context means that even mutations that confer resistance may result in comparatively small increases in overall fitness and therefore have a minimal likelihood of being identified. Indeed, application of a mathematical model revealed that the frequency of a metabolic mutant is expected to be far lower than that of a canonical one after multiple rounds of growth during antibiotic selection (fig. S1A) (20, 21). Considering these constraints, typical laboratory evolution protocols and their analysis methods are not optimized to detect mutations in metabolism-related genes. As such, we reasoned that a more comprehensive view afforded by both population and clonal analyses would elucidate metabolic aspects of antibiotic resistance (22).
Evolving antibiotic resistance using the classical approach
To test this idea, we first evolved the Escherichia coli strain BW25113 (table S1) to the three representative bactericidal drugs, streptomycin (strep), ciprofloxacin (Cipro), and carbenicillin (carb), along with an untreated control, using the classical approach (6, 23). Briefly, three replicate populations for each condition were inoculated in a 96-well plate and grown in MOPS EZ Rich Defined Medium (Teknova, #M2105; hereafter referred to as “rich medium”) at 37°C (Fig. 1A). Every 24 hours (~10 generations), the optical density at 600 nm (OD600) was measured and populations were diluted 500× into fresh medium. After one cycle in the absence of antibiotic (24), the concentration was increased daily in fixed increments of 85%, starting at 0.085× the minimum inhibitory concentration required to inhibit 50% of cells (MIC50) on day 0, reaching 1× MIC50 on day 4, and ending at 40× MIC50 on day 10, consistent with previous reports (11) (table S2 and fig. S1B). We chose a strong concentration gradient to increase the likelihood of selecting for typical variants (25); this gradient was expected to surpass the adaptation limit at higher concentrations. Indeed, extinction began on day 5 (1.85× MIC50), as indicated by the reduction in OD600 (Fig. 1B), at which point glycerol stocks were frozen daily. At the end of 10 days, all frozen samples were revived in antibiotic-free medium, and the end points were determined from the last day that each population was able to recover. This terminal day differed for each population depending on both the lineage and the drug (Fig. 1C); none of the drug-treated populations survived until day 10, whereas all control populations did.
Fig. 1. Classic evolution schematic and characterization.
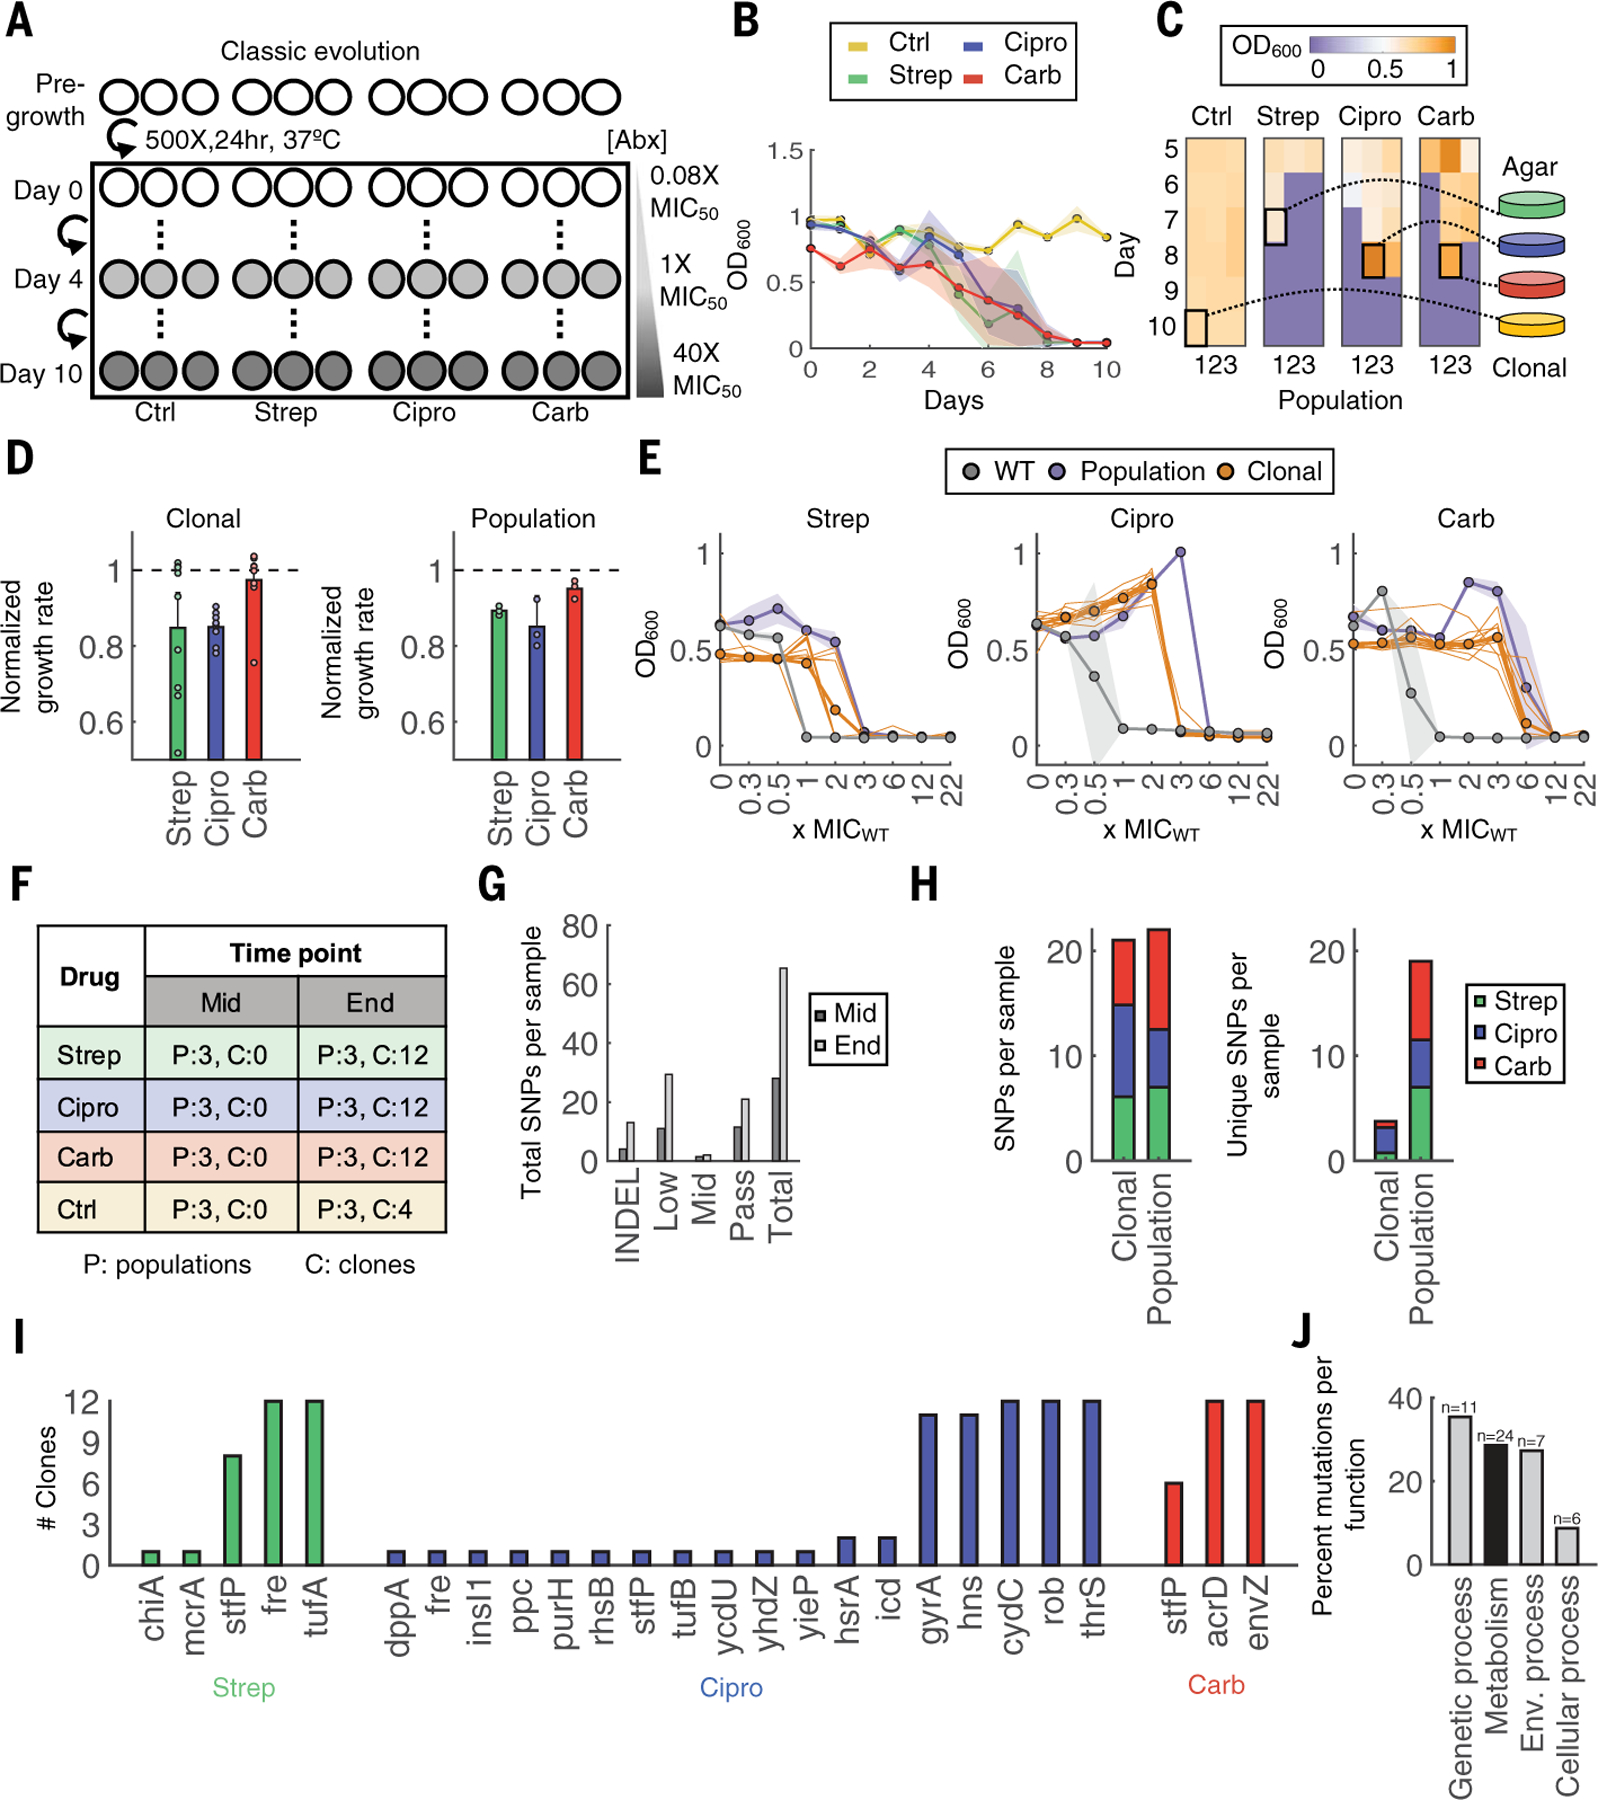
(A) Evolution schematic. Triplicate populations were treated with no antibiotic, strep, carb, or Cipro at increasing concentrations from 0.08× to 40× MIC50 over 11 days (days 0 to 10). (B) Daily OD600 measurements. Shaded color represents SD of three population replicates. The colors yellow, green, blue, and red indicate control, strep, Cipro, and carb, respectively. (C) Frozen samples of all populations starting on day 5 until day 10 were revived in drug-free medium to identify the terminal population per condition (highlighted square). Heatmap shading from purple to orange indicates OD600 levels from low to high, respectively. (D) Growth rates of 12 individual clones (left) or whole populations (right). Growth rates were normalized to the average growth rate of the untreated control (dashed black line for reference). Bars represent average of either 12 clones (left) or three biological replicates (right), and error bars indicate SD. (E) MICs of clones and populations. Bolded gray, orange, and purple lines indicate averages of three WT strain replicates, 12 clones, or three terminal population replicates, respectively. The 12 individual clones are shown in thin orange lines, and shading indicates the SD for WT and population samples. (F) Sequencing sample overview. Each number corresponds to the number of samples sequenced for population (P) or clonal (C) samples. (G) Mutations summary. Mutations include indels and SNPs at frequencies determined by Pilon (passing >~90%; midlevel ~25 to 90%; low ~0.2 to 25%). SNPs per sample are summed across all samples at each time point. (H) Total SNPs per population compared with clonal samples (left). Unique SNPs per population compared with clonal samples (right). (I) Passing SNPs per gene in sequenced clones. (J) KEGG Orthology and BRITE hierarchy classification for broad functional categories; n is the number of genes per category, and the y-axis is the percentage of all genes grouped into the corresponding category.
To characterize trends across drug treatments, we selected the population that survived to the highest antibiotic concentrations and also had the highest cell density if more than one population reached the same antibiotic concentration from each drug group. From these populations, we isolated 41 total clones [n = 12 per drug, n = 4 per no-drug control, and n = 1 wild-type (WT)] (Fig. 1C). Individual clones from all drug conditions displayed variability in growth rates and, on average, grew slower compared with both the untreated adapted control and WT strains (Fig. 1D, left, and fig. S1C). This is consistent with a stepwise evolution of resistance mutations that can impose a fitness cost (26). Moreover, on average, the 12 clones from each of the three terminal populations exhibited an increase in MIC (Fig. 1E); however, as with growth rates, individual MICs also appeared variable, likely dependent on the specific genotype.
To test how representative these 12 clones were of their evolved lineages, we also characterized the population samples; these experiments were initiated using a 500× dilution from partially thawed glycerol stocks to ensure consistency between replicates. Population-level measurements generally supported the average phenotypes of all 12 clones. Each population grew more slowly (Fig. 1D, right) and their MIC increased between four- and 10-fold compared with the WT for all drug conditions (Fig. 1E). Population MICs were overall higher than MICs of individual clones (27).
Identifying genetic changes associated with antibiotic resistance
We next sought to determine the genetic changes that contributed to the observed phenotypes. To do so, we sequenced all replicate populations from day 5, which corresponded to populations evolved to concentrations of MIC50, as well as the terminal population from each lineage if that corresponded to a different concentration, making up 20 total populations. We also sequenced the 41 clones as described above (Fig. 1F and table S3). Pilon (28) was used to identify genetic changes in each population down to frequencies of 2% with a minimum threshold of five reads; this strict threshold requires greater coverage to detect lower-frequency changes at a similar confidence level (table S4).
We tabulated the total number of genomic changes per sample [large indels and single nucleotide polymorphisms (SNPs) at various frequency levels]. SNPs were grouped into categories by Pilon as either passing or midlevel (i.e., >~90% or ~25 to 90%, respectively) and low frequency (~2 to 25%). Overall, total genomic changes per sample increased over time, from 28 on day 5 to 64.5 at the final time point (Fig. 1G), consistent with our expectations.
Further evaluation of these samples by treatment group revealed that both individual clones and populations had a similar number of average mutations per sample (Fig. 1H, left). However, populations had a greater number of unique mutations per sample compared with the clonal isolates (Fig. 1H, right) regardless of whether SNPs in the control group or SNPs at lower frequencies were included in the clonal analysis (fig. S2, A and B). This finding highlights the overrepresentation of high-frequency variants, and the resulting loss of information, from clonal analysis alone.
Examination of passing SNPs from the clonal isolates revealed that high-frequency mutations (e.g., those present in >90% of clones) were consistent with known resistance mechanisms (Fig. 1I). For example, 92% of Cipro-treated clones had mutations in the drug’s target (encoded by gyrA or gyrB) and 100% had acquired mutations in rob, which encodes for a known global transcriptional regulator of multidrug resistance and stress response. However, a subset of clones acquired mutations that were noncanonical and, in several cases, related to central metabolic processes. For example, two clones (16.7%) had mutations in icd, which encodes for a core metabolic enzyme involved in oxidizing isocitrate during the tricarboxylic acid (TCA) cycle. Other genes that appeared in only one of 12 clones were also involved in core metabolic processes (e.g., purH and fre). We observed similar results for strep; most high-frequency mutations were related to drug targets [e.g., tufA, which encodes the elongation factor Tu (29, 30)]. However, others were directly involved in cellular metabolism; for example, 100% of the clones had mutations in fre encoding the electron carrier flavin reductase, which is critical for sensitivity to reactive species in the cell (31). Treatment with carb appeared to result in less diverse clonal variants because the 12 isolates carried mutations in only three genes; of those with known function, both were canonical (the multidrug efflux transporter encoded by acrD and the sensory histidine kinase encoded by envZ).
Several high-frequency mutations from clonal isolates were present in replicate populations as well, consistent with highly constrained evolutionary trajectories associated with classic resistance mechanisms (fig. S3) (14). By contrast, metabolic mutations from the clonal isolates were not necessarily present in all populations, even in cases where they became fixed in a single one. Moreover, although populations revealed additional metabolic genes of interest, these mutations still occurred at low frequency. Using KEGG Orthology combined with BRITE hierarchies, we classified the function of all gene hits from clonal and population samples into the broad categories of (i) “Genetic processing,” (ii) “Environmental processing,” (iii) “metabolism,” and/or (iv) “(signaling and) Cellular processes” (table S5). Note that not all genes are annotated with these databases. However, antibiotic- and metabolism-specific processes are highly represented, and ~80% (48) of all genes could be classified in this way. Genetic processing accounted for the largest percentage of all mutations (~36%) in 11 genes. This was expected because this category includes classic mechanisms of resistance that occurred at high frequency (Fig. 1J). By contrast, “Metabolism” only accounted for ~29% of mutations despite occurring in 24 total genes because of the lower frequency of each.
Evolving antibiotic resistance using a metabolic-dependent approach
The presence of metabolic mutations suggests their potential, and heretofore underappreciated, involvement in the adaptive response to antibiotic treatment. However, these mutations were challenging to interpret because they occurred at relatively low frequencies and with greater diversity than those associated with canonical resistance mechanisms. Indeed, classical evolution experiments are not necessarily designed to isolate metabolic variants: Constant antibiotic exposure imposes growth-dependent selection, whereas a lack of metabolic-specific selection pressure further minimizes the likelihood of enriching for metabolic-specific pathways and/or processes. We reasoned that maximizing metabolic rather than growth adaptation would allow us to shift these dynamics and further tease out antibiotic-specific metabolic variants. To test this idea, we designed and implemented an alternative evolution protocol consisting of short-term drug exposure at incrementally increasing metabolic activities, separated by rounds of drug-free growth, to minimize growth-dependent selection and lineage extinction (Fig. 2A). Indeed, unlike in the classic protocol, the OD600 remained stable throughout the experiments (Fig. 2B). We chose 1 hour for the treatment duration because survival over this time window was sufficient to discriminate resistant from sensitive populations (Fig. 2C) while minimizing growth during treatment. As a proof-of-concept, temperature was used to control metabolic activity during antibiotic exposure because it is an established modulator of basal metabolic activities. The temperature was fixed 30 min before and throughout the duration of the treatment (control and each antibiotic); 30 min was sufficient for transcriptional adaptation (32). Temperature was increased daily in increments of 1°C (20 to 30°C from day 0 to day 10). After treatment, cells were washed 2× in phosphate-buffered saline (PBS) and grown overnight for 22 hours at 37°C. Otherwise, this protocol remained identical to that shown in Fig. 1A.
Fig. 2. Metabolic evolution leads to acquired resistance with no obvious growth defect.
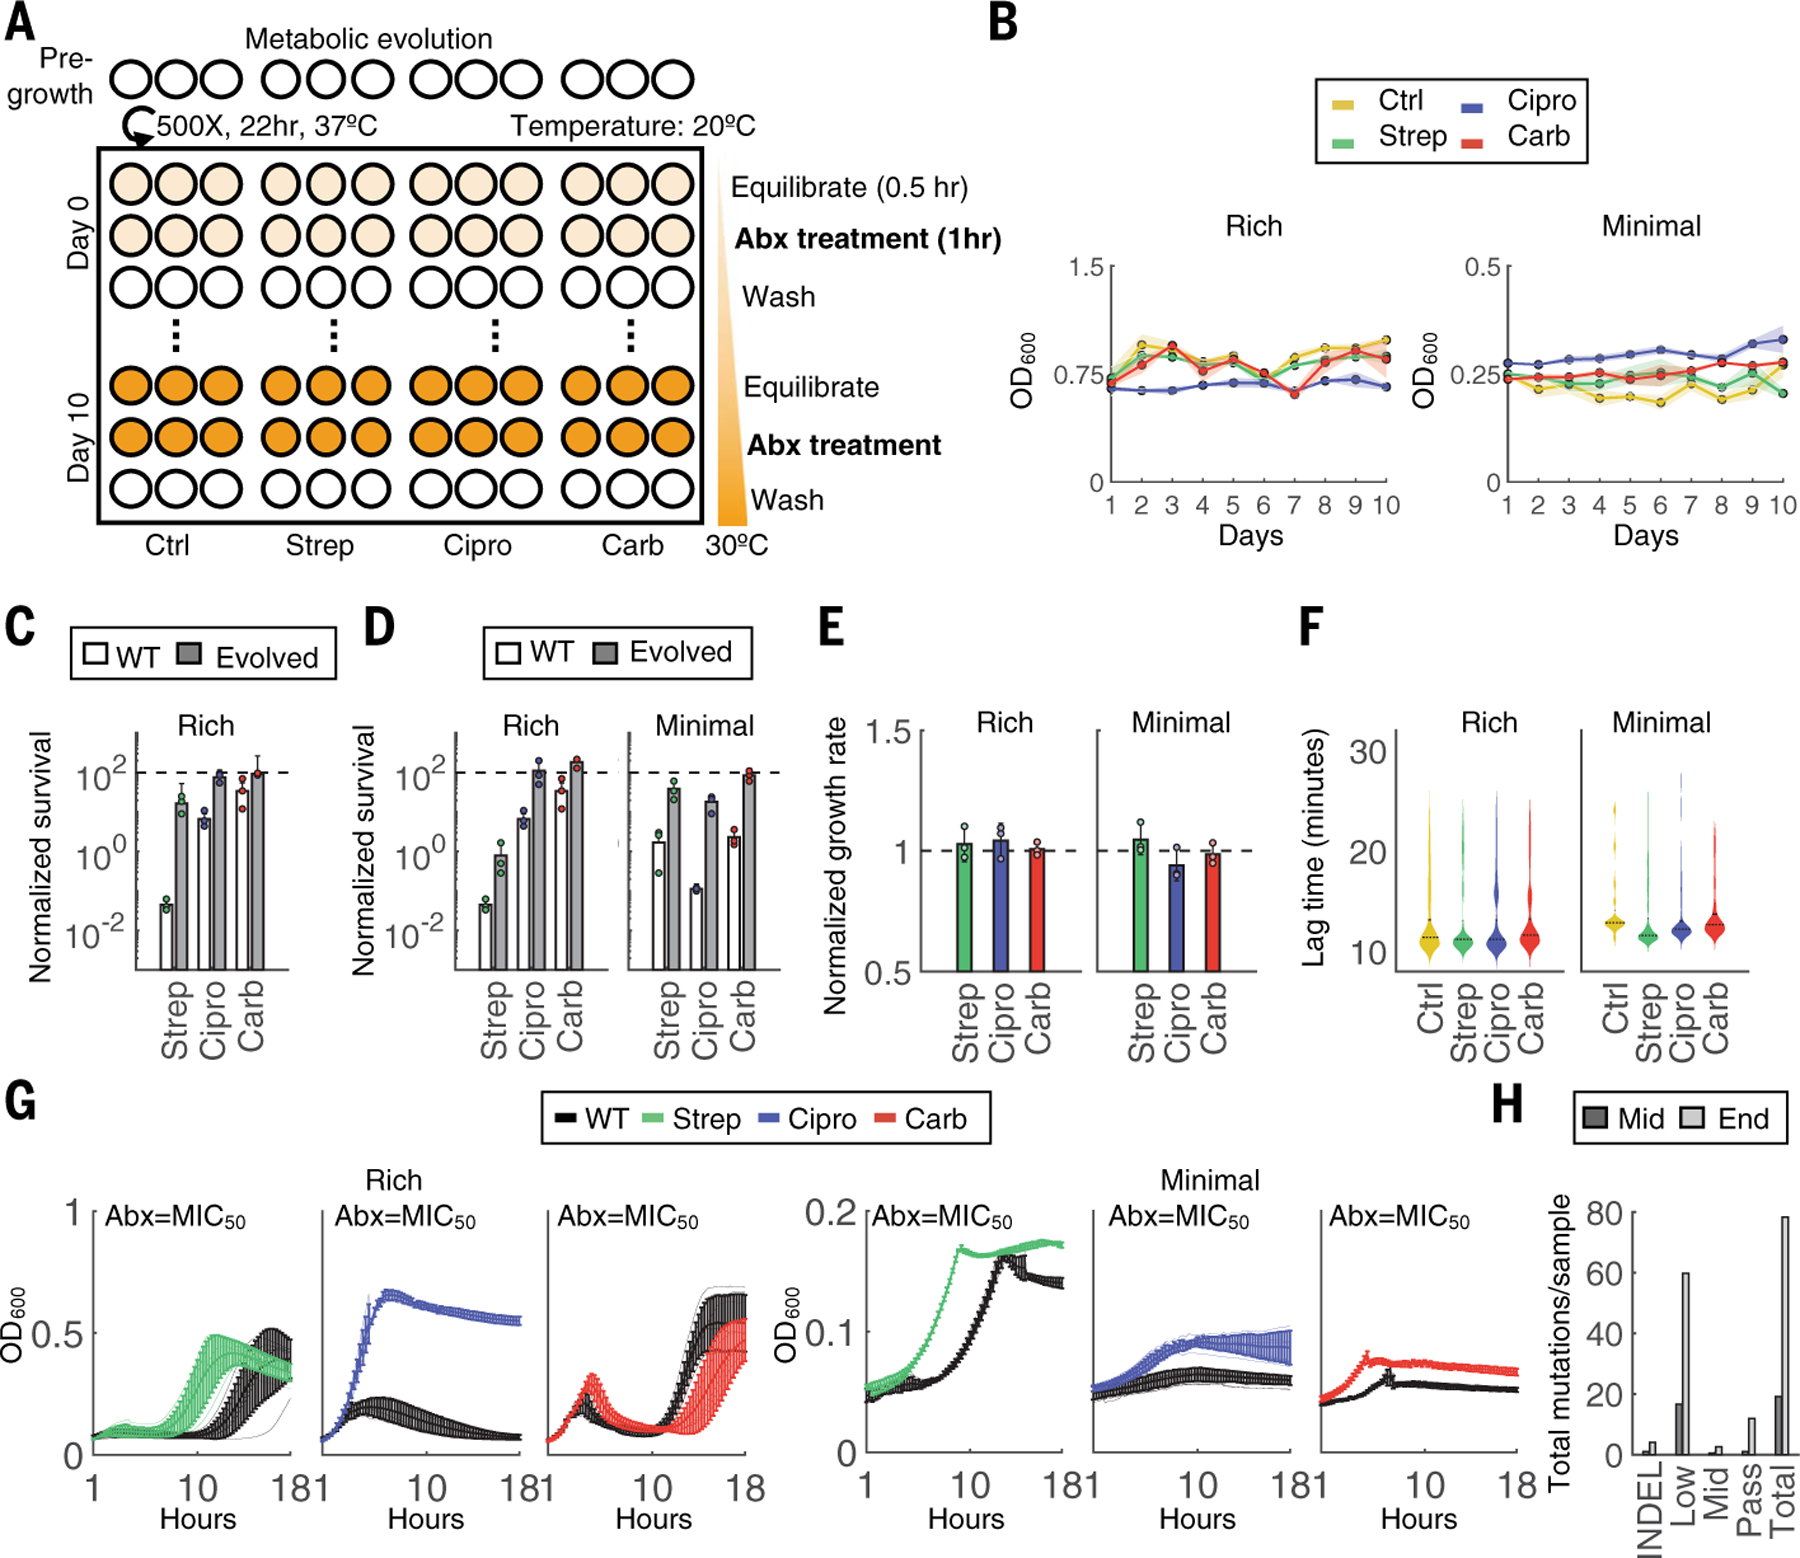
(A) Evolution schematic. Triplicate populations were treated with no antibiotic, strep, carb, or Cipro for a total of 11 days at 40× MIC50 for 1 hour at increasing metabolic states. Thirty minutes before antibiotic treatment, cells were equilibrated to a temperature that increased daily in 1°C increments beginning on day 0 at 20°C and concluding on day 10 at 30°C. After antibiotic treatment, cells were washed 2× in PBS and grown analogously to the classic evolution. (B) OD600 measurements were obtained before daily dilutions and are shown for both rich medium (left) and minimal medium with 0.04% glucose (right) conditions. (C) Survival over the 1-hour treatment for the WT compared with terminal populations evolved through the classic evolution protocol. All experiments were performed at 30°C. Bars represent average of three biological replicates, and error bars indicate SD. (D) Survival over the 1-hour treatment for the WT compared with terminal populations evolved through the metabolic evolution protocol for rich medium (left) and minimal medium (right) conditions. All experiments were performed at 30°C. Bars represent average of three biological replicates, and error bars indicate SD. (E) Growth rates of each terminal population from rich medium (left) and minimal medium (right) conditions. One population per treatment group was tested in three independent biological replicates. Results are normalized to the untreated control (black dashed line). Bars represent the average of three biological replicates, and error bars indicate SD. (F) Lag times of individual clones evolved in either rich medium (left) or minimal medium (right). Lag times were calculated analogously to ScanLag. At least 65 clones were measured for each condition. Violin plots are shown for each distribution; black dotted line indicates the median, and solid line is the mean of the samples. (G) Growth rates for populations evolved in either rich medium (left) or minimal medium (right). OD600 (y-axis) is shown over time in hours (x-axis) obtained at intervals of 15 min for 18 hours. Lines are the average of three biological replicates, and error bars are the SD. Black lines are the WT strain. (H) Mutations summary. Mutations include indels and SNPs at frequencies determined by Pilon (passing >~90%; midlevel ~25 to 90%; low ~0.2 to 25%). SNPs per sample are summed across all samples at each time point.
We implemented this evolutionary experiment with rich medium, as with the previous evolution trajectory, and MOPS Minimal Medium (Teknova#M2106; hereafter referred to as “minimal medium”) supplemented with 0.04% glucose to further constrain metabolism. The terminal populations from both conditions exhibited increased survival over the 1-hour killing window at 30°C, suggesting either acquired resistance or tolerance (Fig. 2D). These evolved populations exhibited no reduction in exponential growth rates (P > 0.1, Student’s t test; Fig. 2E), ruling out tolerance caused by slow growth (33). Moreover, using a method analogous to ScanLag (34), single-colony analysis revealed no significant increase in lag time (P > 0.1, Student’s t test; Fig. 2F). These results suggest that the increased survival was due to acquired resistance and not to tolerance by lag. Indeed, populations grew faster at antibiotic concentrations of MIC50 for both medium conditions compared with the WT (Fig. 2G), indicating acquired resistance. Populations adapted to rich medium exhibited increases in their MIC (fig. S4A); although the MIC did not increase at the population level for minimal medium, analysis of 96 individual clones revealed that, on average, isolates exhibited an increase in MIC compared with the ancestral strain (fig. S4B).
Identifying genetic changes associated with metabolic-dependent antibiotic adaptation
We sequenced all terminal populations from each drug group, along with the midpoint populations and 12 clonal isolates per antibiotic (rich medium) (fig. S5A). The data were analyzed with the same previous pipeline (table S6). Overall, clonal isolates had fewer fixed mutations and more low-frequency mutations compared with the classic evolution experiments (Fig. 2H and fig. S5B). Combined, the samples exhibited a rich diversity of metabolic mutations, and unlike the previous results, several of these mutations occurred across multiple conditions (population and/or drug) (fig. S5C). For example, all three carb-treated populations accumulated mutations in the gene encoding for glutamate synthase, gltB, and one of three also acquired mutations in gltD and/or gltA. Similarly, two of the three Cipro-treated populations acquired mutations in icd, consistent with earlier observations. Fewer canonical mutations occurred.
Our metabolic evolution protocol was specifically designed to ensure equivalent selection dynamics (e.g., growth or no-growth cycles) for all conditions: At low metabolic activity (e.g., 20°C), growth was minimal, whereas at high metabolic activity (e.g., 30°C), all four conditions exhibited similar increases in biomass caused by either normal growth (control) or acquired resistance (drug-treated) (fig. S5, D and E). Despite the minimal growth observed, there remains a possibility that growth-based selection occurs during this cyclic treatment. To further validate whether mutations in metabolic genes arose from the cycling protocol rather than from the antibiotic treatment, we implemented a second metabolic evolution experiment in which temperature was maintained at 20°C for each treatment (referred to as TStat) but was otherwise identical to the original protocol (TInc) (fig. S6, A and B). Any overlap in mutations between TStat control and TInc drug-treated groups, would suggest adaptation caused by growth cycles rather than antibiotic treatment. Sequencing the three terminal populations revealed mutations in 19 unique genes: two from the control, seven from Cipro, eight from strep, and four from carb treatment (table S7). One control gene also occurred in the TInc control and thus was already excluded from analysis, whereas the other was not found in any TInc condition. Moreover, ~77% (13) of genes from the antibiotic-treated groups were identical to those identified from TInc treatment, although at lower frequency. This result was likely due to the reduced metabolic selective pressure. These results further confirm that mutations identified using this approach are specific to the antibiotic treatment under this unique protocol.
Gene Ontology differs between evolution experiments
Having confirmed the antibiotic specificity of these mutations, we next used Gene Ontology (GO) enrichment analysis to compare the biological processes that were significantly affected between the classic and metabolic evolutions. We combined all unique genes across both media from the temperature-increasing metabolic evolution to enable statistical comparisons (Fig. 3A). Among the genes identified from the classic evolution, “response to antibiotics” was the most significantly enriched biological process (n = 9, P =4× 10⁻⁵, Fisher’s exact test), as expected (Fig. 3B). From the metabolic evolution, the most significantly enriched biological process was “generation of precursor metabolites and energy” (n = 11, P = 1 × 10⁻⁴, Fisher’s exact test) (Fig. 3C). Almost all other significantly enriched processes (P < 0.01, Fisher’s exact test) from the metabolic evolution were also directly related to cellular metabolism, including but not limited to glutamate synthesis, respiration, and electron transport chain (table S8). Overall, and consistent with both our hypothesis and literature, the occurrence of parallel metabolic mutations suggests the importance of modulating metabolism as an adaptive strategy against antibiotic stress.
Fig. 3. Gene Ontology (GO) enrichment analysis differs between evolutions.
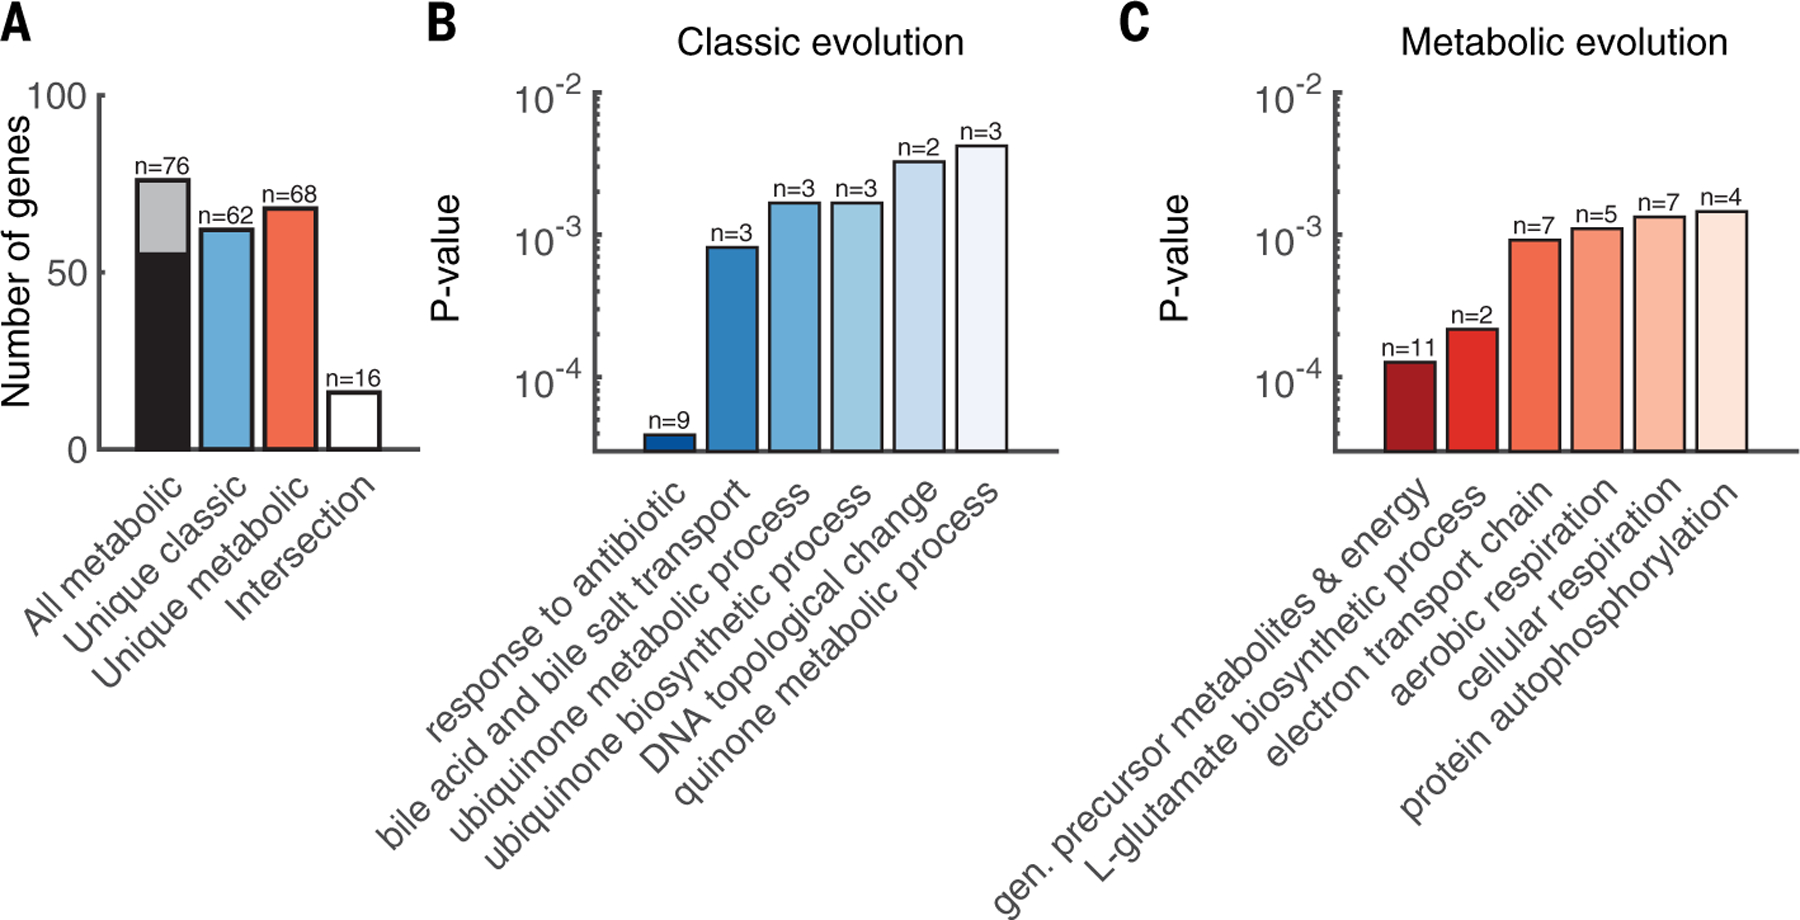
(A) Pooling metabolic mutations across medium type yielded an equivalent number of unique mutations from both evolutions. Black and gray color represents genes from rich and minimal (min) medium, respectively. (B) GO enrichment of biological processes for all unique mutations from the classic evolution. (C) GO enrichment of biological processes for all unique mutations from the metabolic evolution. Dark to light shading indicates P values from low to high, respectively.
It is unsurprising that each protocol enriched different functional classes of mutations. However, because neither protocol necessarily reflects realistic clinical environments, the prevalence of these mutations in clinical strains is a better indicator of their relevance. To investigate this, we analyzed a library of 7243 E. coli genomes from NCBI Pathogen Detection (table S9). Specifically, we calculated the total abundance of each of 109 coding sequence mutations identified from both evolution experiments and compared the frequency in isolates classified as clinical (n = 3700) with those classified as environmental or other (n = 3543) (fig. S7A). Variation in gyrA S83 and D87 was used as the baseline for comparison because the clinical prevalence of these nine variants is well established (35, 36). Overall, ~20% of strains had at least one mutation in S83 (~18% gyrA S83L and 1.5% gyrA S83A), and ~12% of the strains had at least one mutation in D87 (gyrA D87N) (table S10). Only two of the six gyrA loci were statistically overrepresented in clinical isolates. For example, S83L is one of the most common variants associated with quinolone resistance (37). However, despite occurring in 1332 f 7319 strains, only 673 were designated as clinical (P = 0.23, Fisher’s exact test; Fig. 4A). This highlights that the NCBI clinical or environmental strain designation likely does not distinguish between strains based on previous antibiotic exposure. Rather, the known importance of gyrA suggests that mutation prevalence alone indicates a potential clinical impact, and further enrichment in clinical isolates highlights a potent subset of clinically relevant mutations; this was consistent with canonical mutations identified in our study (e.g., ompF and acrD). Overall, 67 of the 109 mutations were not identified in any of the 7234 genomes. The remaining 42 were present in at least one, and up to 7068, of the isolates (fig. S7B). Several mutations in metabolic genes were abundantly present at levels similar to, and in some cases greater than, gyrA (Fig. 4A). As with gyrA, some were statistically enriched in clinical isolates (P < 0.01, Fisher’s exact test), suggesting their clinical relevance.
Fig. 4. Metabolic mutations are highly prevalent in clinical E. coli genomes and confer resistance.
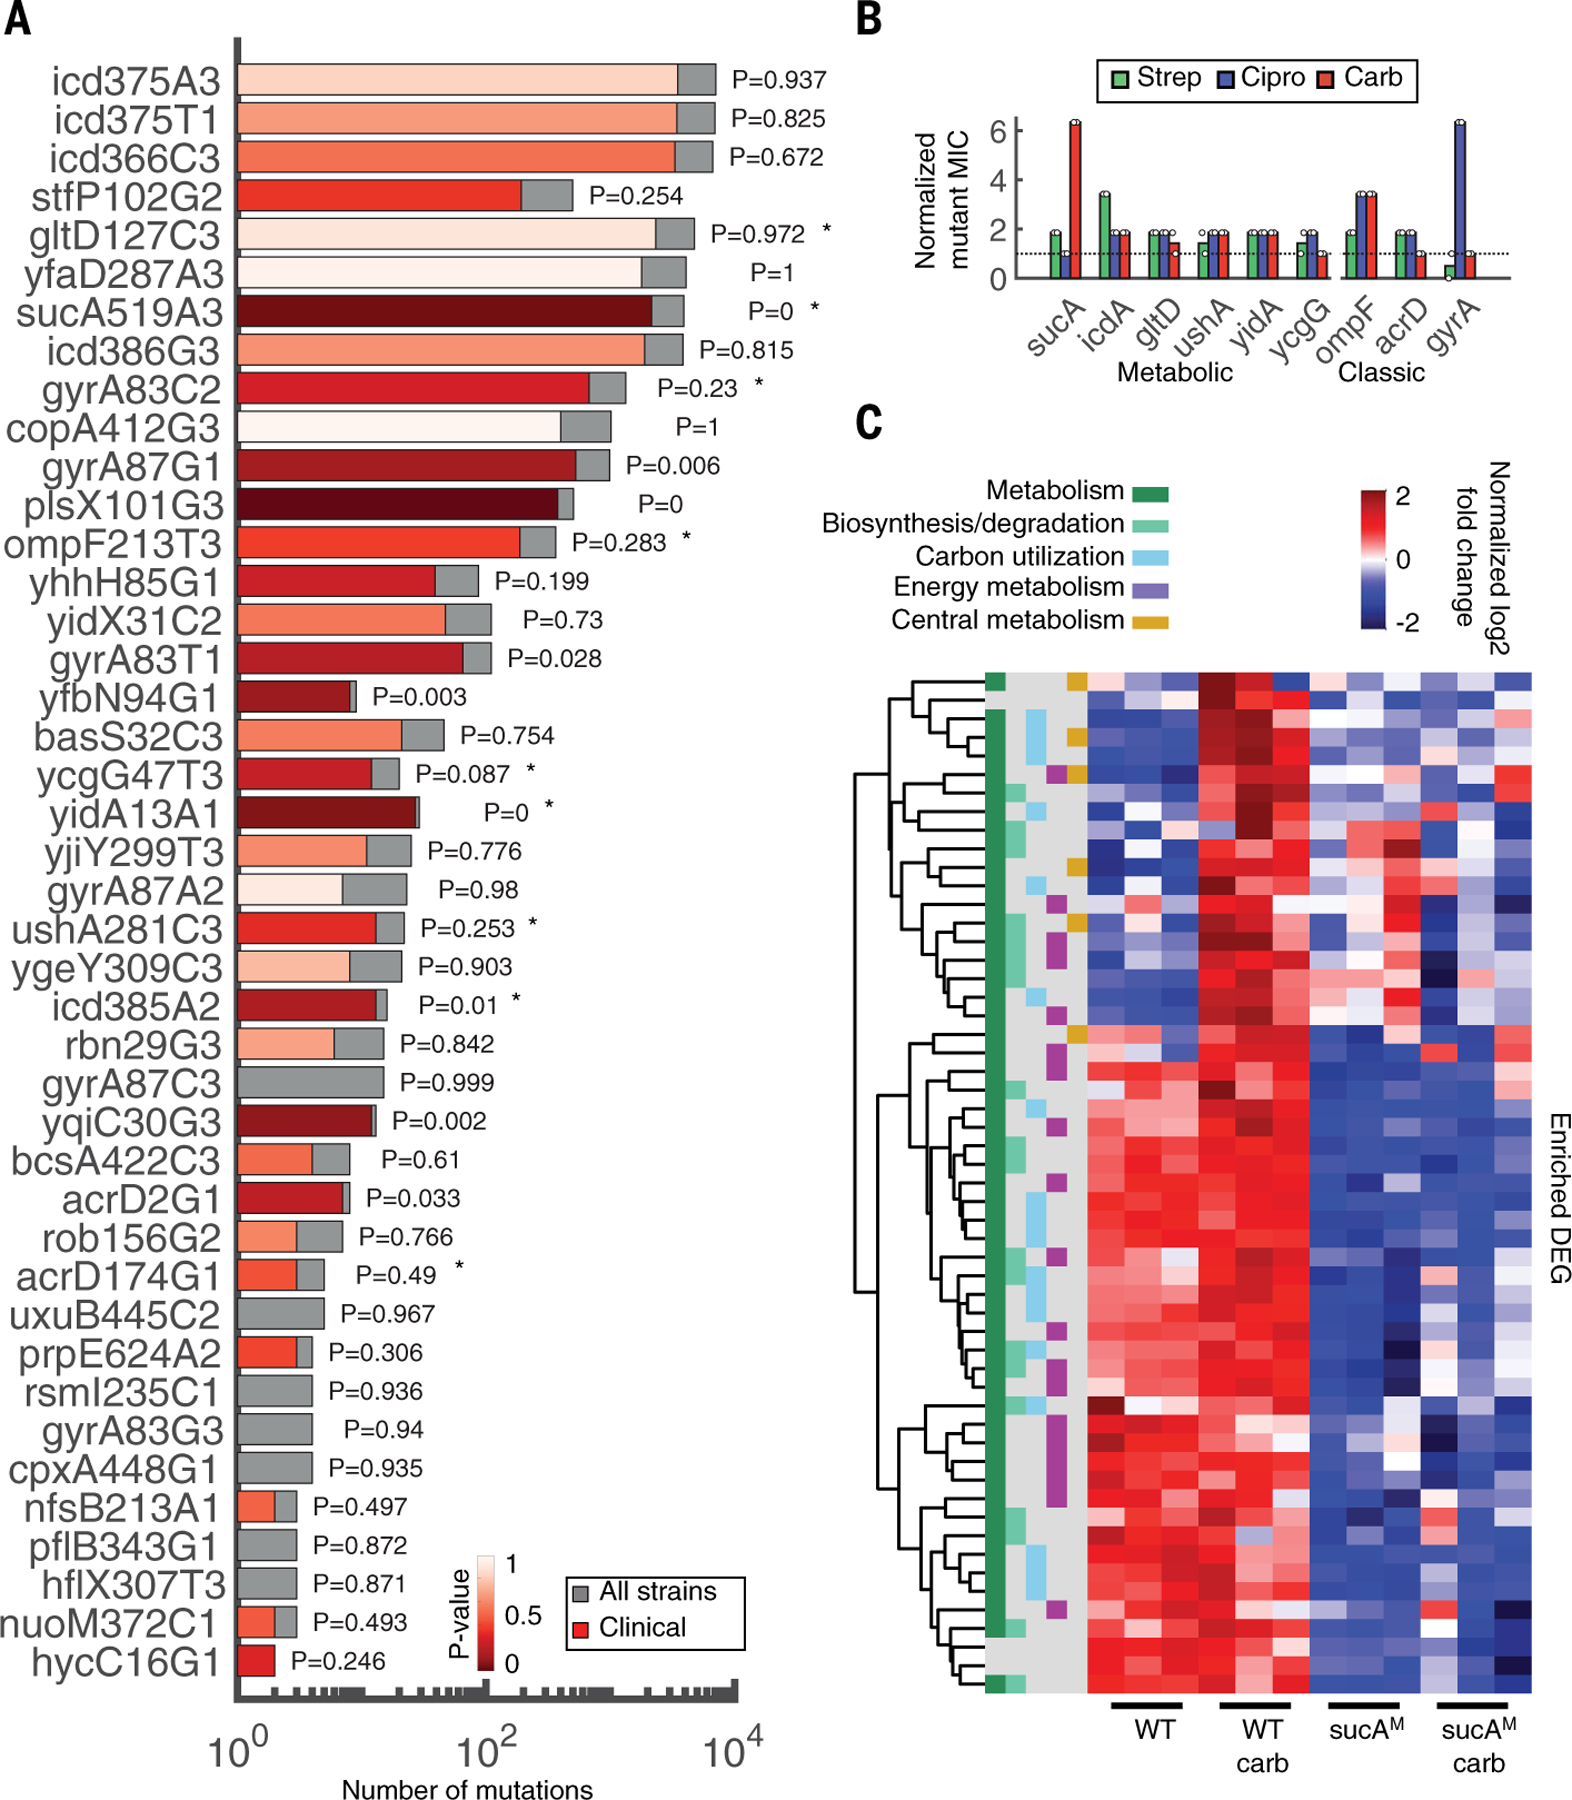
(A) Mutations in coding sequences were searched for in a database of 7243 genomes downloaded from NCBI. Bars indicate the number of strains with the specific mutation from our dataset (gray, total number; red, clinical strains). The significance and P values of the overrepresentation of each mutation within the subset of clinical strains is colored in varying degrees of red, from highly to not significant (dark to light red, respectively). Stars denote mutations tested in (B). The y-axis labels consist of gene name, codon position, reference allele, and nucleotide position, respectively. (B) MIC fold change of mutants compared with WT. Mutant sequences of a representative subset of metabolic (sucA, icd, gltD, ushA, yidA, and ycgG) and classic (ompF, acrD, and gyrA) genes were integrated onto the plasmid pAB downstream of the strong constitutive promoter proD. Each plasmid was introduced into the corresponding knockout strain, except for gyrA, which was introduced into the WT strain BW25113 because this gene is essential, and ycgG, which is compared with the knockout strain only because this mutation disrupted the gene. Control strain is BW25113 carrying pAB191 (black dashed line). Two biological replicates are represented by the circles; bars represent the average of both. MICs for all three drugs (strep, Cipro, and carb; green, blue, and red, respectively) were obtained after 10 hours. (C) Hierarchical clustering of DEGs in the presence and absence of carb treatment. All down-regulated DEGs between carb-treated WT and sucAM were enriched for overrepresented pathways in Ecocyc. Read counts were converted into counts per million (CPM). Heatmap color represents the log-2–transformed, trimmed mean of M values (TMM)–normalized CPM values. Functional categories are defined from MultiFun ontologies from Ecocyc. The y-axis includes all genes that were significantly enriched. The ordered list of genes can be found in table S14.
Knockout and overexpression confirm genetic underpinnings of antibiotic resistance
To evaluate whether these metabolic mutations confer resistance, we chose a representative subset of both genes related to metabolism (sucA, gltD, ushA, icd, ycgG, and yidA) and classic resistance (ompF, acrD, and gyrA) on the basis of their prevalence and clinical significance (Fig. 4A, stars). We expressed the WT and mutant variants of each gene from a medium-copy plasmid (pAB) introduced into the corresponding chromosomal knockout strain; these MICs were compared with the WT carrying pAB191, which expresses the innocuous gene lacZ to account for any plasmid-specific effects. In all cases, metabolic mutations increased the MIC to at least one, and in many cases more than one, of the antibiotics (Fig. 4B). These trends were confirmed by measuring growth inhibition (fig. S8); in all cases, metabolic mutants were resistant to at least one of the antibiotics, consistent with corresponding MIC levels. The plasmid-expressed WT metabolic genes in many cases also increased resistance, whereas the knockout strain carrying pAB191 exhibited heightened drug sensitivity (fig. S9, top); this is in contrast to the classic genes, in which expression of the WT gene from the plasmid often increased sensitivity compared with the knockout strain carrying pAB191 (fig. S9, bottom). This suggests that metabolic mutations may influence expression levels and/or catalytic activity rather than protein structure or function, although such mechanistic effects remain to be tested. Overall, these results indicate that these clinically relevant metabolic variants indeed confer resistance.
Because both canonical and metabolic mutation types confer, on average, similar levels of resistance and neither one introduces significant fitness burdens in these experimental conditions, it is possible they each may be selected for independently. Moreover, fluctuation tests revealed that the WT strain mutation rate was statistically identical to that of the representative canonical and metabolic mutants ompF and sucA (fig. S10), respectively, suggesting that neither mutation type made a strain more likely to acquire additional mutations. In addition, bioinformatic analysis revealed that mutation acquisition (canonical or metabolic) did not preferentially predispose strains to acquire an additional mutation of either type (table S11). Thus, although there may indeed be a temporal relationship between the emergence of mutation types, these findings indicate that neither one necessarily favors the occurrence of the other.
Finally, we sought to gain insights into the mechanism(s) by which altered metabolism may confer antibiotic resistance. It is known that antibiotic-stimulated metabolic activity results in the formation of toxic metabolic species that contribute to drug lethality (5, 38). We thus reasoned that resistance could arise from one of multiple strategies, including decreased sensitivity to oxidative stress or prevention of antibiotic-induced stimulation of the tricarboxylic acid (TCA) cycle. To investigate these possibilities, we focused on the metabolic mutation in sucA (sucAM), which confers high levels of protection against carb. We used RNA sequencing to compare gene expression differences between sucAM and WT in the presence or absence of carb treatment (tables S12 and S13). Compared with WT cells, which exhibited a distinct transcriptional shift in response to carb and almost 300 differentially expressed genes (DEGs), sucAM was indistinguishable from its untreated control, with only 17 DEGs (fig. S11, A and B). Hierarchical clustering and KEGG-based pathway analysis revealed two clear phenotypes: significant up-regulation in WT metabolic genes in response to carb (P < 0.05, Fisher’s exact test) and overall down-regulated activity in core metabolic pathways such as central and energy metabolism in sucAM compared with WT regardless of the treatment (Fig. 4C and table S14). Combined, these results suggest that sucAM resistance may occur by bypassing carb-mediated TCA activation, presumably linked to lower overall basal respiration rates. Indeed, both the oxygen consumption rate and ATP levels were significantly lower for sucAM compared with WT (fig. S11, C and D), consistent with reduced respiration. Moreover, unlike the WT strain, sucAM did not exhibit elevated NAD+/NADH levels after carb treatment, a hallmark of hyperactive TCA cycle activity during oxidative stress (fig. S11E). This combination of phenotypic and genotypic analyses provides a preliminary picture of sucAM-mediated carb resistance: Lower basal respiration prevents antibiotic-mediated induction of TCA cycle activity, thereby avoiding metabolic toxicity and minimizing lethality. Given the diversity and abundance of metabolic resistance mechanisms, focused approaches are needed to determine the generality of this and other metabolic resistance strategies.
Discussion
Despite the complexity of antibiotic lethality, canonical mechanisms of resistance are generally grouped into only three broad categories: target modification, drug inactivation, and drug transport (39, 40). Our findings that metabolic mutations arise in response to antibiotic treatment, and that these mutations confer resistance and are highly prevalent in clinical pathogens, suggests that these three distinct categories may not be as representative, nor the mechanisms as comprehensive, as previously thought. Indeed, metabolic adaptation may represent a class of resistance mechanisms whereby, beyond conferring tolerance, cells alter their metabolic response to mitigate downstream toxic aspects of antibiotic lethality. This is consistent with previous works in which metabolic constraints limit the evolution of antibiotic resistance (41, 42). Along these lines, even mutations considered canonical, such as those in regulatory elements or efflux systems, appeared in both the classic and metabolic evolutions; whether these mutations arise because they reduce the concentration of bound target or minimize the stress response that follows remains unclear. What is known, however, is that antibiotic dynamics in vivo are widely variable and rarely if ever follow a simple continuous gradient. Thus, implementing new protocols to increase the accessible evolutionary pathways could facilitate the discovery of new resistance mechanisms and thereby enhance our ability to limit the development and spread of antibiotic resistance.
Materials and Methods
A detailed description of all experimental and computational methods, including the evolution protocols, strain characterization, mutant validation, sample preparation for next-generation sequencing, modeling, and bioinformatics, can be found in the supplementary materials (21).
Evolution protocol and strain characterization
All evolutions used the E. coli strain BW25113. Briefly, a single colony was picked from a streaked agar plate and grown in 3 ml of rich medium overnight with shaking at 250 rpm. After 16 hours, cells were diluted 500× into fresh rich medium and aliquoted into one row (12 wells) of a 96-well plate for each evolution. Plates were sealed with an AeraSeal film (Sigma-Aldrich, #A9224), covered with a fitted plastic cover, and grown for 24 hours at 37°C with shaking at 450 rpm. For the classic evolution, after the first cycle of pregrowth, cells were diluted 500× into fresh rich medium daily; antibiotic was added to all treatment wells and sterile water was added to the control at the concentrations shown in table S2. For the metabolic evolution, the protocol was identical, with the following modifications. After the first cycle of pregrowth and dilution into fresh medium, cells were equilibrated to the daily temperature for 30 min, followed by 1 hour of drug treatment. After 1 hour of treatment, cells were washed 2× with PBS, resuspended in the corresponding medium, sealed as described above, and grown at 37°C for the remaining 22 hours with 450 rpm agitation. Every day thereafter, the equilibration and/or treatment temperature increased in 1°C increments until day 10, which ended at 30°C. In both cases, before the dilution every morning, OD600 measurements were obtained and a control row of blank medium was included; no cell growth was observed in these control wells throughout any evolution. The static metabolic evolution was performed similarly to the first metabolic evolution, with the following changes: minimal medium was used and during every antibiotic treatment window, the temperature was maintained at 20°C. Otherwise, the protocol remained identical. In all cases, samples were saved daily starting on day 5 and for every day thereafter until day 10. Detailed protocols for quantifying the MIC, growth rates, and survival after 1 hour can be found in the supplementary materials (21).
Genomic DNA extraction, library prep, high-throughput sequencing, and bioinformatics
For all evolutions, populations were revived by thawing the tops of frozen samples and diluting 1000× into 1.5 ml of fresh rich medium in a deep 96-well plate. To determine the terminal populations in the case of the classic evolution, cells were diluted such that the top row corresponded to the populations saved on day 5 and the bottom row corresponded to the populations saved on day 10. OD600 measurements were taken the following morning to determine the terminal population (Fig. 1C). Cells from each terminal population were streaked directly onto blank agar to acquire individual clones. One milliliter of this overnight culture was pelleted and frozen at −80°C for 48 hours to be used directly for genomic DNA (gDNA) extraction (21). Clonal plates were grown at 37°C for 16 hours; all colonies were grown as described for subsequent gDNA extraction in parallel with the frozen population samples. gDNA from individual clones, populations, and the WT strain was extracted using the PureLink Pro 96 Genomic DNA Kit (#K182104). Pooled libraries were prepared using the plexWell 384 kit supplied from SeqWell; whole-genome sequencing was performed on a HiSeq 2500 Rapid Run flow cell with 150 base paired-end reads with an average read depth of 100× at the Broad Institute. All bioinformatic analysis details, along with the comparative analysis of variants to published E. coli genomes, can be found in the supplementary materials (21).
Mutation validation
The plasmid backbone (pAB) used for all constructs consists of a strong constitutive synthetic promoter proD, chloramphenicol resistance, and a p15A origin of replication. The control plasmid, pAB191, contains the innocuous gene lacZ under the control of proD. All WT genes were obtained from the E. coli genome using polymerase chain reaction (PCR) and cloned into the pAB backbone using either Gibson assembly or USER cloning. All mutant variants were generated with USER cloning. All final constructs were fully sequenced for validation. The corresponding knockout strains for each relevant gene were obtained from the Keio collection. Each strain was validated using PCR, and kanamycin resistance (kanR) was removed with FLP recombinase (pCP20). All plasmids expressing either the WT or mutant variants were introduced into the strain with the corresponding gene chromosomally deleted, except for gyrA, which was introduced into the WT strain BW25113 because this gene is essential. All experiments that used these strains were conducted in the presence of 100 µg/ml chloramphenicol.
RNA sequencing, analysis, and strain validation
Strains were grown overnight as previously described. After 16 hours, all strains were diluted 500× into rich medium. Cells were treated with MIC50 concentrations of the control strain and incubated at 37°C with 250 rpm agitation for 1 hour. After 1 hour, cells were flash-frozen and submitted to Medgenomics for RNA extraction and sequencing. RNA sequencing was performed using NovaSeq 150 base paired-end reads with 25 M total reads per sample. All bioinformatic analysis details can be found in the supplementary materials (21).
Supplementary Material
ACKNOWLEDGMENTS
We thank A. Pironti and B. Walker for help with analysis and helpful discussions, M. Takahashi for feedback on the manuscript, and B. Li for helpful discussions.
Funding: This work was supported by the Defense Threat Reduction Agency (HDTRA1–15-1–0051), the National Institutes of Health (R00GM118907, R01AI146194), the National Institutes of Health Director’s Early Independence Award (DP5-OD-024590), the National Science Foundation Graduate Research Fellowship Program (1122374), the Broad Institute of MIT and Harvard, and a generous gift from Anita and Josh Bekenstein. This work has also been funded in part with funds from the National Institute of Allergy and Infectious Diseases, National Institutes of Health, Department of Health and Human Services, under grant no. U19AI110818 to the Broad Institute.
Footnotes
Competing interests: J.J.C. is scientific cofounder and scientific advisory board chair of EnBiotix, an antibiotic drug discovery company. The remaining authors declare no conflicting interests.
Data and materials availability: All sequencing data are available on the Sequence Read Archive repository under BioProject accession no. PRJNA665848. All other raw data are available in the supplementary tables (21). Code for the mathematical model is available at https://github.com/ajlopatkin/metabolic-mutant-model and is archived on Zenodo (43).
SUPPLEMENTARY MATERIALS
science.sciencemag.org/content/371/6531/eaba0862/suppl/DC1
Materials and Methods
Figs. S1 to S11
Tables S1 to S15
References (44–59)
MDAR Reproducibility Checklist
REFERENCES AND NOTES
- 1.Giedraitienė A, Vitkauskienė A, Naginienė R, Pavilonis A, Antibiotic resistance mechanisms of clinically important bacteria. Medicina (Kaunas) 47, 137–146 (2011). [PubMed] [Google Scholar]
- 2.Espedido BA, Gosbell IB, Chromosomal mutations involved in antibiotic resistance in Staphylococcus aureus. Front. Biosci. (Schol. Ed.) 4, 900–915 (2012). [DOI] [PubMed] [Google Scholar]
- 3.Yang JH, Bening SC, Collins JJ, Antibiotic efficacy-context matters. Curr. Opin. Microbiol 39, 73–80 (2017). doi: 10.1016/j.mib.2017.09.002 [DOI] [PMC free article] [PubMed] [Google Scholar]
- 4.Stokes JM, Lopatkin AJ, Lobritz MA, Collins JJ, Bacterial metabolism and antibiotic efficacy. Cell Metab 30, 251–259 (2019). doi: 10.1016/j.cmet.2019.06.009 [DOI] [PMC free article] [PubMed] [Google Scholar]
- 5.Dwyer DJ et al. , Antibiotics induce redox-related physiological alterations as part of their lethality. Proc. Natl. Acad. Sci. U.S.A 111, E2100–E2109 (2014). doi: 10.1073/pnas.1401876111 [DOI] [PMC free article] [PubMed] [Google Scholar]
- 6.Lang GI, Desai MM, The spectrum of adaptive mutations in experimental evolution. Genomics 104 (6 Pt A), 412–416 (2014). doi: 10.1016/j.ygeno.2014.09.011 [DOI] [PMC free article] [PubMed] [Google Scholar]
- 7.Charusanti P et al. , Exploiting adaptive laboratory evolution of Streptomyces clavuligerus for antibiotic discovery and overproduction. PLOS ONE 7, e33727 (2012). doi: 10.1371/journal.pone.0033727 [DOI] [PMC free article] [PubMed] [Google Scholar]
- 8.Rodriguez de Evgrafov M, Gumpert H, Munck C, Thomsen TT, Sommer MOA, Collateral resistance and sensitivity modulate evolution of high-level resistance to drug combination treatment in Staphylococcus aureus. Mol. Biol. Evol 32, 1175–1185 (2015). doi: 10.1093/molbev/msv006 [DOI] [PubMed] [Google Scholar]
- 9.Toprak E et al. , Evolutionary paths to antibiotic resistance under dynamically sustained drug selection. Nat. Genet 44, 101–105 (2011). doi: 10.1038/ng.1034 [DOI] [PMC free article] [PubMed] [Google Scholar]
- 10.Suzuki S, Horinouchi T, Furusawa C, Prediction of antibiotic resistance by gene expression profiles. Nat. Commun 5, 5792 (2014). doi: 10.1038/ncomms6792 [DOI] [PMC free article] [PubMed] [Google Scholar]
- 11.Jahn LJ, Munck C, Ellabaan MMH, Sommer MOA, Adaptive laboratory evolution of antibiotic resistance using different selection regimes lead to similar phenotypes and genotypes. Front. Microbiol 8, 816 (2017). doi: 10.3389/fmicb.2017.00816 [DOI] [PMC free article] [PubMed] [Google Scholar]
- 12.Dettman JR et al. , Evolutionary insight from whole-genome sequencing of experimentally evolved microbes. Mol. Ecol 21, 2058–2077 (2012). doi: 10.1111/j.1365-294X.2012.05484.x [DOI] [PubMed] [Google Scholar]
- 13.Schenk MF, de Visser JAGM, Predicting the evolution of antibiotic resistance. BMC Biol 11, 14 (2013). doi: 10.1186/1741-7007-11-14 [DOI] [PMC free article] [PubMed] [Google Scholar]
- 14.Couce A, Rodríguez-Rojas A, Blázquez J, Bypass of genetic constraints during mutator evolution to antibiotic resistance. Proc. Biol. Sci 282, 20142698 (2015). doi: 10.1098/rspb.2014.2698 [DOI] [PMC free article] [PubMed] [Google Scholar]
- 15.Matias Rodrigues JF, Wagner A, Evolutionary plasticity and innovations in complex metabolic reaction networks. PLOS Comput. Biol 5, e1000613 (2009). doi: 10.1371/journal. [DOI] [PMC free article] [PubMed] [Google Scholar]
- 16.Leinonen T, McCairns RJS, Herczeg G, Merilä J, Multiple evolutionary pathways to decreased lateral plate coverage in freshwater threespine sticklebacks. Evolution 66, 3866–3875 (2012). [DOI] [PubMed] [Google Scholar]
- 17.Wilm A et al. , LoFreq: A sequence-quality aware, ultra-sensitive variant caller for uncovering cell-population heterogeneity from high-throughput sequencing datasets. Nucleic Acids Res 40, 11189–11201 (2012). doi: 10.1093/nar/gks918 [DOI] [PMC free article] [PubMed] [Google Scholar]
- 18.Martinez JL, Baquero F, Mutation frequencies and antibiotic resistance. Antimicrob. Agents Chemother 44, 1771–1777 (2000). doi: 10.1128/AAC.44.7.1771-1777.2000 [DOI] [PMC free article] [PubMed] [Google Scholar]
- 19.Levy SF et al. , Quantitative evolutionary dynamics using high-resolution lineage tracking. Nature 519, 181–186 (2015). doi: 10.1038/nature14279 [DOI] [PMC free article] [PubMed] [Google Scholar]
- 20.Levin-Reisman I et al. , Antibiotic tolerance facilitates the evolution of resistance. Science 355, 826–830 (2017). doi: 10.1126/science.aaj2191 [DOI] [PubMed] [Google Scholar]
- 21. Materials and methods are available as supplementary materials.
- 22.McElroy K, Thomas T, Luciani F, Deep sequencing of evolving pathogen populations: Applications, errors, and bioinformatic solutions. Microb. Inform. Exp 4, 1 (2014). doi: 10.1186/2042-5783-4-1 [DOI] [PMC free article] [PubMed] [Google Scholar]
- 23.Wong A, Rodrigue N, Kassen R, Genomics of adaptation during experimental evolution of the opportunistic pathogen Pseudomonas aeruginosa. PLOS Genet 8, e1002928 (2012). doi: 10.1371/journal.pgen.1002928 [DOI] [PMC free article] [PubMed] [Google Scholar]
- 24.Lenski RE, Travisano M, Dynamics of adaptation and diversification: A 10,000-generation experiment with bacterial populations. Proc. Natl. Acad. Sci. U.S.A 91, 6808–6814 (1994). doi: 10.1073/pnas.91.15.6808 [DOI] [PMC free article] [PubMed] [Google Scholar]
- 25.Oz T et al. , Strength of selection pressure is an important parameter contributing to the complexity of antibiotic resistance evolution. Mol. Biol. Evol 31, 2387–2401 (2014). doi: 10.1093/molbev/msu191 [DOI] [PMC free article] [PubMed] [Google Scholar]
- 26.Melnyk AH, Wong A, Kassen R, The fitness costs of antibiotic resistance mutations. Evol. Appl 8, 273–283 (2015). doi: 10.1111/eva.12196 [DOI] [PMC free article] [PubMed] [Google Scholar]
- 27.Lee HH, Molla MN, Cantor CR, Collins JJ, Bacterial charity work leads to population-wide resistance. Nature 467, 82–85 (2010). doi: 10.1038/nature09354 [DOI] [PMC free article] [PubMed] [Google Scholar]
- 28.Walker BJ et al. , Pilon: An integrated tool for comprehensive microbial variant detection and genome assembly improvement. PLOS ONE 9, e112963 (2014). doi: 10.1371/journal.pone.0112963 [DOI] [PMC free article] [PubMed] [Google Scholar]
- 29.Andersson DI, Hughes D, Persistence of antibiotic resistance in bacterial populations. FEMS Microbiol. Rev 35, 901–911 (2011). doi: 10.1111/j.1574-6976.2011.00289.x [DOI] [PubMed] [Google Scholar]
- 30.Pinto L et al. , Multiomics assessment of gene expression in a clinical strain of CTX-M-15-producing ST131 Escherichia coli. Front. Microbiol 10, 831 (2019). doi: 10.3389/fmicb.2019.00831 [DOI] [PMC free article] [PubMed] [Google Scholar]
- 31.Woodmansee AN, Imlay JA, Reduced flavins promote oxidative DNA damage in non-respiring Escherichia coli by delivering electrons to intracellular free iron. J. Biol. Chem 277, 34055–34066 (2002). doi: 10.1074/jbc.M203977200 [DOI] [PubMed] [Google Scholar]
- 32.Chang D-E, Smalley DJ, Conway T, Gene expression profiling of Escherichia coli growth transitions: An expanded stringent response model. Mol. Microbiol 45, 289–306 (2002). doi: 10.1046/j.1365-2958.2002.03001.x [DOI] [PubMed] [Google Scholar]
- 33.Levin-Reisman I, Brauner A, Ronin I, Balaban NQ, Epistasis between antibiotic tolerance, persistence, and resistance mutations. Proc. Natl. Acad. Sci. U.S.A 116, 14734–14739 (2019). doi: 10.1073/pnas.1906169116 [DOI] [PMC free article] [PubMed] [Google Scholar]
- 34.Levin-Reisman I, Fridman O, Balaban NQ, ScanLag: High-throughput quantification of colony growth and lag time. J. Vis. Exp (89): (2014). doi: 10.3791/51456 [DOI] [PMC free article] [PubMed] [Google Scholar]
- 35.Oram M, Fisher LM, 4-Quinolone resistance mutations in the DNA gyrase of Escherichia coli clinical isolates identified by using the polymerase chain reaction. Antimicrob. Agents Chemother 35, 387–389 (1991). doi: 10.1128/AAC.35.2.387 [DOI] [PMC free article] [PubMed] [Google Scholar]
- 36.Yoshida H, Bogaki M, Nakamura M, Nakamura S, Quinolone resistance-determining region in the DNA gyrase gyrA gene of Escherichia coli. Antimicrob. Agents Chemother 34, 1271–1272 (1990). doi: 10.1128/AAC.34.6.1271 [DOI] [PMC free article] [PubMed] [Google Scholar]
- 37.Vila J et al. , Association between double mutation in gyrA gene of ciprofloxacin-resistant clinical isolates of Escherichia coli and MICs. Antimicrob. Agents Chemother 38, 2477–2479 (1994). doi: 10.1128/AAC.38.10.2477 [DOI] [PMC free article] [PubMed] [Google Scholar]
- 38.Kohanski MA, Dwyer DJ, Hayete B, Lawrence CA, Collins JJ, A common mechanism of cellular death induced by bactericidal antibiotics. Cell 130, 797–810 (2007). doi: 10.1016/j.cell.2007.06.049 [DOI] [PubMed] [Google Scholar]
- 39.Blair JMA, Webber MA, Baylay AJ, Ogbolu DO, Piddock LJV, Molecular mechanisms of antibiotic resistance. Nat. Rev. Microbiol 13, 42–51 (2015). doi: 10.1038/nrmicro3380 [DOI] [PubMed] [Google Scholar]
- 40.Woodford N, Ellington MJ, The emergence of antibiotic resistance by mutation. Clin. Microbiol. Infect 13, 5–18 (2007). doi: 10.1111/j.1469-0691.2006.01492.x [DOI] [PubMed] [Google Scholar]
- 41.Zampieri M et al. , Metabolic constraints on the evolution of antibiotic resistance. Mol. Syst. Biol 13, 917 (2017). doi: 10.15252/msb.20167028 [DOI] [PMC free article] [PubMed] [Google Scholar]
- 42.Zampieri M, Zimmermann M, Claassen M, Sauer U, Nontargeted metabolomics reveals the multilevel response to antibiotic perturbations. Cell Rep 19, 1214–1228 (2017). doi: 10.1016/j.celrep.2017.04.002 [DOI] [PubMed] [Google Scholar]
- 43.Lopatkin AJ et al. , Mathematical model code for: Clinically relevant mutations in core metabolic genes confer antibiotic resistance (2020); 10.5281/zenodo.4323054. [DOI] [PMC free article] [PubMed] [Google Scholar]
Associated Data
This section collects any data citations, data availability statements, or supplementary materials included in this article.