

Abstract
Objective:
Examine sequence of weakness in arm muscles from longitudinal hand-held dynamometry (HHD) data in ALS for congruence with contiguous spread of neurodegeneration along spinal cord segments.
Methods:
Longitudinal HHD data from the Ceftriaxone clinical trial were examined using nonlinear mixed models, assuming a logistic trajectory from normal to zero strength. Unobserved baseline normal strength of weak muscles was assumed using strength of the best-preserved muscle. A novel metric called “time from onset to midway strength” (TOMS) was estimated for each muscle group, and TOMS ratios were examined to identify sequence of weakness, overall and by onset site.
Results:
Shoulder flexion (SF), elbow flexion (EF), elbow extension (EE), wrist extension (WE), and first dorsal interosseous (FDI) were measured on each side. Over a median of 36 weeks, 513 subjects provided 2589 sets of HHD measures. TOMS increased sequentially in the following order: FDI, WE, SF, EF, and EE. TOMS ratios estimates with 95% CIs (adjusted for multiple comparisons) were: WE/FDI 1.32 (1.24–1.41), SF/WE 1.06 (1.01–1.10), EF/SF 1.06 (1.02–1.10), and EE/EF 1.18 (1.12–1.23). Elbow and shoulder flexors weakened sooner than did elbow extensors. The sequence of arm muscle weakness progression was similar regardless of onset site.
Conclusion:
Nonsegmental progression of arm muscle weakness that is similar for different onset sites favors cortical influence/network spread over contiguous spread of neurodegeneration in the spinal cord. Furthermore, this study confirms the “split elbow” pattern. TOMS and other proposed methods may have value as outcome measures in clinical research.
Keywords: Muscle strength, hand-held dynamometry, dissociated muscle atrophy, non-linear mixed models
Introduction
Multiple factors potentially influence the sequence of weakness of muscles in an extremity: (a) segmental spread of neurodegeneration (1), whereby anterior horn cell loss propagates linearly along the length of the spinal cord with sequential involvement of consecutive segments/myotomes, (b) cortical influences, notably cortical representation of a muscle, and handedness (2–4), (c) distance from the spinal cord, which may be inversely related to efficiency of collateral reinnervation (5), (d) normal baseline muscle-specific innervation ratio (6), and (e) normal baseline strength that varies by muscle. From the time of early reports of the “split hand syndrome” (7), differential patterns of muscle weakness in an extremity in amyotrophic lateral sclerosis (ALS) have received considerable attention. Recently, similar patterns of dissociated muscle atrophy are reported, notably “split leg” (8) and “split elbow” (9) syndromes. Such patterns serve not only as diagnostic markers, but also as windows to understand the pathophysiology of progression of ALS.
Inconsistency, insensitivity, and the non-linear ordinal nature of manual motor testing (MMT) (10), differences in normal strength by muscle and by individual, and progression of weakness with time with ceiling and floor effects make it challenging to accurately determine the order of involvement of different muscles in ALS in the course of routine care. In contrast, hand-held dynamometry (HHD) has excellent metric properties (11) as well as desirable characteristics as an outcome measure in therapeutic trials (12). In the context of therapeutic trials, HHD measures from multiple muscle groups are typically standardized and summated into a limb megascore. Herein, we present an analysis of repeated HHD measures of five muscle groups of each arm, obtained during the course of a clinical trial, to address three questions: (a) what is the sequence of weakness in arm muscles? (b) Does the site of onset of weakness (bulbar, arm or leg) influence the order of weakness of arm muscles? and (c) Can HHD data confirm the “split elbow” syndrome?
Methods
Patients and variables
Anonymized repeated HHD measures of patients participating in the Ceftriaxone trial were obtained from the Northeast ALS Consortium and the Neurological Clinical Research Institute at Massachusetts General Hospital. Consent was not sought for aggregate analysis of existing anonymized data. Methods and negative results of the Ceftriaxone trial have been reported previously (13). A total of 513 subjects (340 and 173 allocated to Ceftriaxone and placebo, respectively) were evaluated approximately every three months. The measurement protocol, normative values, rates of decline of mean- and standard deviation (SD)-scaled HHD strength measures (z-scores), and correlated rates of decline of individual muscle groups were also reported (12). Age- and sex-specific normative values were not employed for z-score calculation. In the arm, HHD was measured in five muscle groups on each side, namely shoulder flexion (SF), elbow flexion (EF), elbow extension (EE), wrist extension (WE), and first dorsal interosseous (FDI). In the leg, four muscle groups were measured on each side, namely hip flexion, knee extension, knee flexion, and ankle dorsiflexion. Throughout this paper, we will use the terms muscle and muscle group loosely and interchangeably, by context, to indicate a muscle group that effects a specific joint movement. Leg muscle z-scores were considered for calculating subject-specific normal strength, but were not analyzed further in this report. Only the best HHD values (of two or three trials at each evaluation) were used for analysis. Site of onset (bulbar or limb) was ascertained from trial records. Within limb-onset subjects, arm- or leg-onset was inferred from initial arm and leg summated z-scores (by median difference, adjusted for number of muscle groups). The weaker arm (left or right) was similarly determined from the lower of side-wise summated z-scores for all observations. Descriptive statistics and paired t-test comparisons of individual arm muscle initial z-scores are reported.
Outcomes and statistical methods
Time from onset (of symptoms) to midway weakness (that we call TOMS, the same as time to half strength, or half-life) was the outcome of interest for each muscle group. The challenge in estimating TOMS lies in specifying (unobserved) baseline normal strength in an already weak muscle. We propose a heuristic approach premised on the observation that in normal individuals, strength across muscles is correlated (14). For example, quadriceps and hand strength may both be particularly strong (with similarly high z-scores) in a healthy muscular young individual, whereas the same muscles may be less strong (with similarly low z-scores) in a normal, although frail, elderly individual. In early stages of disease, we expect some muscles to be intact. We exploited these observations to guess the baseline strength of a weak muscle based on how strong the preserved muscle was. For instance, if a preserved muscle (muscle A) was above average (zA-baseline=z(0)>0), we adjusted up the presumed baseline strength of an already weakened muscle (muscle B) by that amount (zB-baseline=z(0)). For each muscle group in each individual, we determined this presumed baseline strength and assigned that a value of 1, with 0 representing total paralysis. This gave us a normalized metric (that we call zero-one scaling (ZOS)) to compare progress across muscles and individuals. We then used logistic non-linear trajectory models to estimate location and scale parameters (TOMS and SCAL, respectively). As rates of decline of strength are correlated across muscles (12,15), we assumed that muscle TOMS were proportional to each other, and to an underlying patient-specific parameter indicating disease rapidity. To compare muscle groups, we were interested in estimating TOMS ratios. Ratios are more realistic than differences in this context: if time for triceps to weaken 50% is 3 months longer than the corresponding time for biceps in a patient with rapidly progressive disease, the difference is expected to be longer in a patient with slowly progressive disease. Ratio estimation was accomplished by parameterizing models with the natural logarithm of TOMS (logTOMS), and estimating the difference in logTOMS. Details of methods including ZOS, the functional form of logistic non-linear mixed effect models, model selection, and the list of estimated parameters are described in Supplementary File. Briefly, models with increasingly complex fixed effects were constructed to obtain the full final model with 60 fixed effects parameters corresponding to logTOMS terms for (a) 10 muscle groups (five on each side), (b) site of onset (bulbar, arm or leg), and (c) side of worse arm weakness (right or left), and interactions. Additionally, 30 fixed effects for logSCAL, and subject-level random effects were also assigned. TOMS ratios were calculated from linear contrasts of logTOMS parameters. Confidence intervals were adjusted for multiple comparison by the conservative Scheffé’s method (16). TOMS ratios for muscles were reported as unweighted geometric means by site and side of onset. Significance threshold was set throughout at p < 0.05. R version 3.5.2 (R Foundation for Statistical Computing, Vienna, Austria) with additional package nlme (17) was used for analysis.
Sensitivity analyses
Analyses were repeated with alternative choices of the unobserved normal. TOMS order and ratios were also examined for less complex models that did not account for site of onset or for side of worse weakness (Supplementary File).
Results
z-Score comparisons
Site of onset was bulbar in 110 (21.4%) of 513 subjects. Among 403 (78.6%) limb-onset (including nine generalized-onset) subjects, 202 were classified as arm-onset and 201 as leg-onset by initial z-scores. Over a median of 36 weeks (interquartile range, or IQR 16–80 weeks), a total of 2589 sets of HHD measures were obtained (median of 4 measures per subject, IQR 3–6). Initial mean z-scores of 10 muscle groups of the arms are displayed in Figure 1 along with SDs. The ascending order of mean z-scores was FDI (lowest), SF, WE, EF, and EE (highest), with all consecutive differences being significant (p < 0.01, paired t-test). This order was similar across sites of onset. Notably, EF (biceps) z-scores were lower than EE (triceps) z-scores. Summating across all measures, the right arm had lower summated z scores than the left in 296 (57.7%) and the right leg had lower summated z-scores than the left in 288 (56.1%). Agreement between the side of worse weakness between the arms and legs was 69.2%. Knee extension and EE provided the most best z-scores for scaling other muscles, 215 and 69 of 513 patients, respectively (Supplementary File). Relative preservation of some muscles initially in this cohort is supported by the observation that best z-scores were <0, < −1, and < −2 in only 120, 30, and one of 513 patients, respectively.
Figure 1.
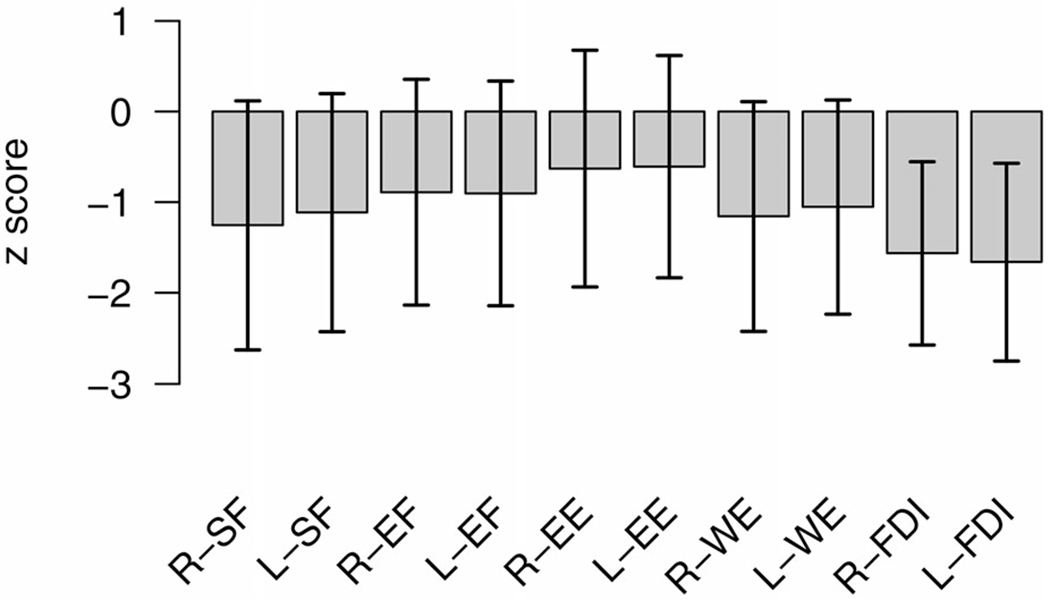
Mean initial strength of five muscle groups on each side, namely shoulder flexion (SF), elbow flexion (EF), elbow extension (EE), wrist extension (WE), and first dorsal interosseous (FDI), on the z-scale. Segments indicate ± standard deviation (SD).
Non-linear mixed models
The full model (with 90 fixed effects parameters, three subject-level random effects variance parameters, and one residual variance parameter) provided a better fit to the data than models with only either site of onset or weaker arm included as variables, and a model without those variables (Supplementary File Table 1), and a considerably better fit than models with only one subject-level random effect for logTOMS. Residual SD for the final model (SD of difference between observations and modeled trajectory) was 0.125 (in units of normal strength). logTOMS SD was 0.49, corresponding to a 0.613-fold to 1.632-fold ± SD range of TOMS between patients. Correlation of individual logTOMS and logSCAL random effects was very high (0.833), implying a steep rate of strength decline among patients with short TOMS. Zero-one scaled HHD measures of three subjects with superimposed modeled trajectories are illustrated in Figure 2.
Figure 2.
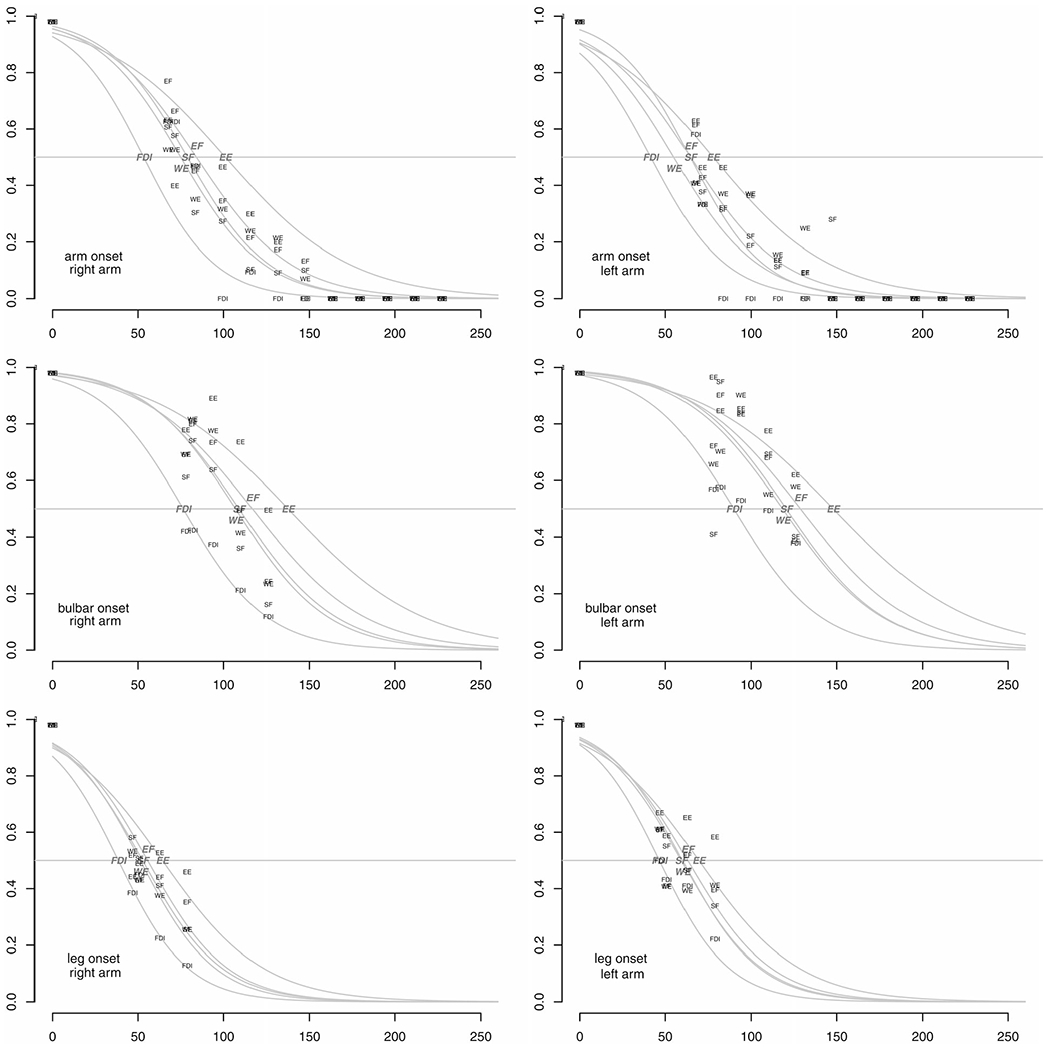
Observed (labeled in small font) and modeled (gray logistic curves with larger italicized labels) strength over time of three patients (arm-, bulbar-, and leg-onset from top to bottom). Models represent aggregate trajectory patterns, explaining deviations from individual data points. The x-axis indicates time in weeks from onset, whereas the y-axis indicates strength scaled between presumed normal strength (1) and total paralysis (0). Right and left arm are plotted on the left and right, respectively. Five muscle groups are depicted in each plot, namely shoulder flexion (SF), elbow flexion (EF), elbow extension (EE), wrist extension (WE), and first dorsal interosseous (FDI).
TOMS estimates and ratios
TOMS estimates (geometric means) overall (assigning equal weights to three sites of onset and weaker side), and by site of onset and weaker side, are detailed in Table 1 and also displayed in Figure 3. TOMS were shortest in the weaker arm in arm-onset subjects, and progressively increased by columns from left to right, being highest in the stronger arm in leg-onset subjects. Regardless of onset site, TOMS were shortest for FDI and longest for EE. Table 2 shows TOMS ratios (overall) by sequence of involvement with confidence intervals adjusted for multiple comparisons. An EE/EF TOMS ratio of 1.18 means it took, on average, 18% longer from onset to reach midway strength for triceps than for biceps. Similarly, triceps took 74% longer to midway strength than FDI (EE/FDI TOMS ratio = 1.74). Sensitivity analyses revealed this sequence of arm muscle group involvement to be invariant regardless of empirical choice of ZOS method, and regardless of non-linear model employed.
Table 1.
TOMS (time from onset to midway strength) estimates (geometric means) with 95% confidence intervals, overall, and by site of onset and by weaker/stronger arm, in weeks.
| Muscle group | Overall | Arm onset |
Bulbar onset |
Leg onset |
|||
|---|---|---|---|---|---|---|---|
| Weaker arm | Stronger arm | Weaker arm | Stronger arm | Weaker arm | Stronger arm | ||
| Shoulder flexion | 74.8 | 56.7 | 68.7 | 70.5 | 78.5 | 85.3 | 95.1 |
| (71.5, 78.2) | (52.8, 60.9) | (64.1, 73.7) | (64.2, 77.5) | (71.5, 86.2) | (79.6, 91.4) | (88.8, 101.9) | |
| Elbow flexion | 79.1 | 56.2 | 71.0 | 77.1 | 85.8 | 90.7 | 102.4 |
| (75.6, 82.8) | (52.3, 60.3) | (66.2, 76.1) | (70.2, 84.7) | (78.2, 94.3) | (84.7, 97.2) | (95.6, 109.7) | |
| Elbow extension | 93.1 | 69.0 | 86.0 | 91.9 | 100.2 | 103.8 | 114.9 |
| (89.0, 97.4) | (64.3, 74.0) | (80.2, 92.2) | (83.7, 101.0) | (91.2, 110.1) | (96.9, 111.3) | (107.3, 123.2) | |
| Wrist extension | 70.7 | 46.9 | 62.3 | 69.2 | 78.8 | 82.1 | 95.9 |
| (67.6, 74.0) | (43.5, 50.5) | (58.0, 66.8) | (63.0, 76.1) | (71.8, 86.5) | (76.6, 87.9) | (89.5, 102.7) | |
| First dorsal inter-osseous | 53.4 | 36.1 | 47.7 | 51.4 | 59.7 | 60.1 | 73.3 |
| (51.0, 56.0) | (33.3, 39.2) | (44.3, 51.3) | (46.7, 56.7) | (54.3, 65.6) | (56.0, 64.5) | (68.4, 78.6) | |
Figure 3.
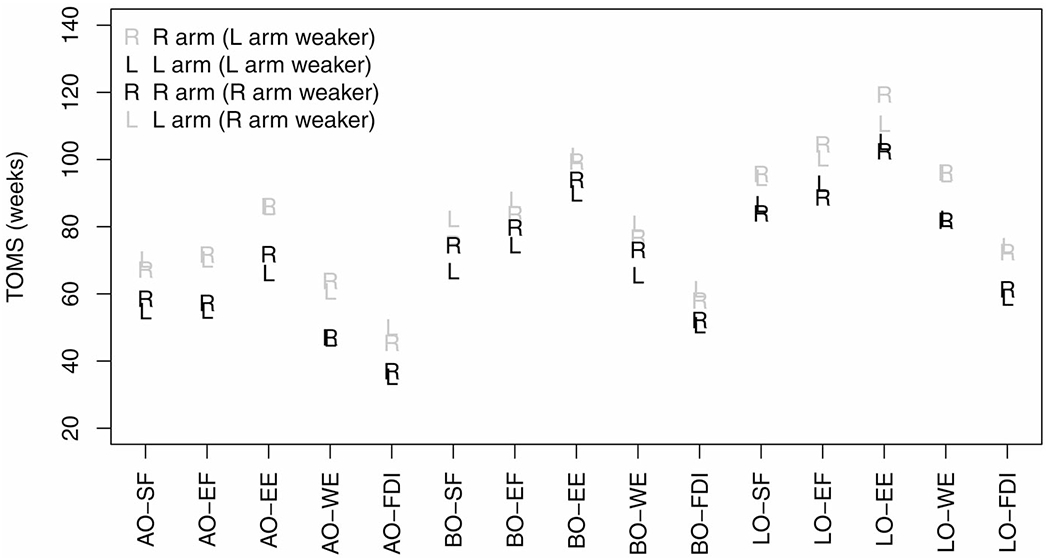
Point estimates of (geometric means of) TOMS (time from onset to midway strength) in weeks, plotted in three sets (by onset site) of five muscle groups. The letter marking the point (R or L) indicates side measured. Estimates for the weaker arm are black, whereas estimates the contralateral stronger arm are gray. Note that the order of weakness is similar for all sites of onset. Muscle groups are: shoulder flexion (SF), elbow flexion (EF), elbow extension (EE), wrist extension (WE), and first dorsal interosseous (FDI). Onset sites are: arm (AO), bulbar (BO), and leg (LO).
Table 2.
TOMS (time from onset to midway strength) ratios by muscle group pairs (row group TOMS/column group TOMS), with 95% confidence intervals adjusted for multiple comparisons.
| Elbow flexion | Shoulder flexion | Wrist extension | First dorsal interosseous | |
|---|---|---|---|---|
| Elbow extension | 1.18 (1.13, 1.23) | 1.25 (1.19, 1.30) | 1.32 (1.26, 1.38) | 1.74 (1.63, 1.86) |
| Elbow flexion | − | 1.06 (1.02, 1.10) | 1.12 (1.07, 1.17) | 1.48 (1.39, 1.58) |
| Shoulder flexion | − | − | 1.06 (1.01, 1.10) | 1.40 (1.32, 1.49) |
| Wrist extension | − | − | − | 1.32 (1.24, 1.41) |
Other TOMS contrasts of interest
Table 3 displays some TOMS ratio estimates by site of onset. Although there was a trend for higher ratios with arm-onset, SF/FDI (corresponding to spinal segments C5–6/C8), EE/EF (C7/C5–6), and EE/FDI (the largest ratio) TOMS ratios did not significantly differ by site of onset, adjusting for multiple comparisons. Inter-side TOMS ratios (stronger vs. weaker sides, all muscles) were significantly higher for arm-onset than bulbar- or legonset. TOMS ratio between right and left sides overall and for any onset site was not significantly different from 1 (data not presented).
Table 3.
Contrasts of interest by onset site, with 95% confidence intervals adjusted for multiple comparisons.
| TOMS ratio | Arm onset | Bulbar onset | Leg onset | Significance of differences (ratios of TOMS ratios) |
|---|---|---|---|---|
| SF/FDI (C5-6/C8) | 1.50 (1.32, 1.71 | 1.34 (1.20, 1.50) | 1.36 (1.27, 1.46) | All differences ns |
| EE/EF (C7/C5-6) | 1.22 (1.14, 1.31) | 1.18 (1.08, 1.28) | 1.13 (1.07, 1.20) | All differences ns |
| EE/FDI (C7/C8) | 1.86 (1.63, 2.11) | 1.73 (1.54, 1.95) | 1.65 (1.53, 1.78) | All differences ns |
| Stronger arm/weaker arm | 1.27 (1.20, 1.35) | 1.12 (1.06, 1.19) | 1.15 (1.11, 1.19) | p < 0.05 for arm/bulbar and arm/leg onset differences. Bulbar/leg onset difference ns. |
TOMS: time from onset to midway weakness; SF: shoulder flexion; FDI: first dorsal interosseous; EE: elbow extension; EF: elbow flexion; ns: not significant.
Significance of differences by site (ratios of TOMS ratios by onset site) is similarly examined, adjusted for multiple comparisons.
Rate of decline of strength
Across muscle groups, estimated SCAL parameters (geometric means, inversely related to maximum rate of decline) were almost linearly correlated with TOMS, as depicted in Figure 4. This finding is in keeping with the expectation that muscles with the shortest TOMS had the highest rate of loss of strength.
Figure 4.
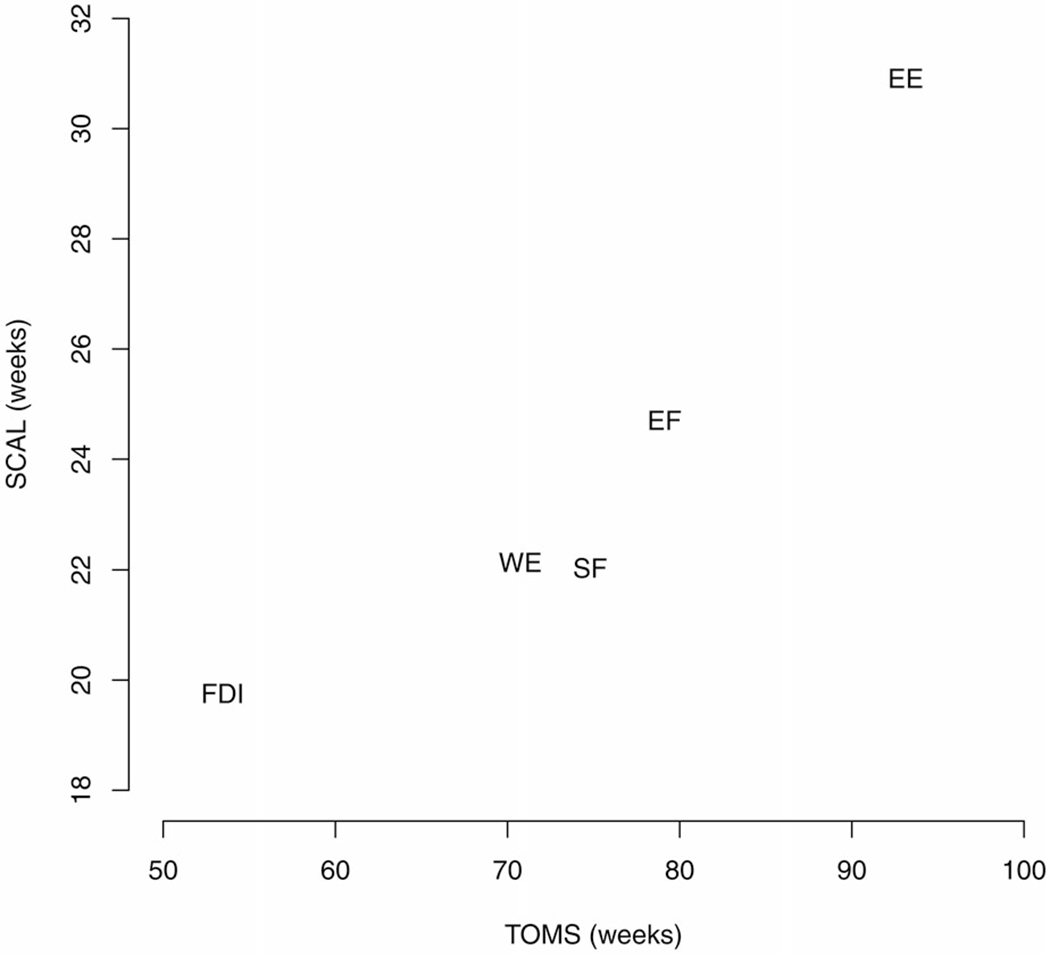
Geometric means of SCAL (the logistic scale parameter, inversely related to maximum rate of decline) plotted against geometric means of TOMS (time from onset to midway strength) for five muscle groups, demonstrating remarkable, almost linear, correlation. Muscle groups are: shoulder flexion (SF), elbow flexion (EF), elbow extension (EE), wrist extension (WE), and first dorsal interosseous (FDI).
Discussion
Notable observations include: (a) weakness in the arm is earliest in distal muscles; (b) among proximal muscles, SF and biceps are affected earlier, on average, than triceps; (c) sequence of arm muscle involvement is similar regardless of onset site (arm, leg, or bulbar); (d) inter-side differences in timing of arm weakness are greater with armonset than with bulbar- or leg-onset; (e) introduction of novel standardization and analytic methods for HHD measures, namely ZOS and TOMS, which have utility as outcome measures in clinical research.
Due to collateral reinnervation, decline in muscle strength lags behind anterior horn cell loss (6). With time, the few surviving motor neurons can no longer cope with reinnervation needs of denervated muscle fibers. Failure of this compensatory process with advancing disease manifests with more rapid loss of strength and the appearance of fibrillation potentials on electromyography. Less efficient collateral reinnervation by longer axons probably explains more fibrillations in distal muscles (5), and also the earlier distal muscles weakness we observed, rather than preferential involvement because of cortical influences or segmental spread.
Although biceps and triceps are about equidistant from the cervical cord, it took 18% longer time from onset to reach midway strength for the latter (EE/EF TOMS ratio), confirming the recently described “split elbow” pattern (9). We additionally demonstrate that this pattern is found not only in arm-onset disease, but also with onset elsewhere. However, “split elbow” by initial z-scores occurred in only 638/1026 arms (62.2%), indicating its insensitivity as a diagnostic indicator. Shoulder flexion (anterior deltoid) weakened even earlier than biceps. Such differential muscle involvement, taken with anatomical, physiological, and functional imaging evidence, is often used as a persuasive argument for corticofugal degeneration as the driving force in ALS (3,18,19).
An alternative explanation for differential involvement of muscles in the arm is sequential segmental spread of neurodegeneration (1). By this principle, biceps (C5/6 myotomes) could be affected earlier than triceps (C7 myotome) because of rostrocaudal spread. Contrarily, earlier involvement of thenar muscles (T1 myotome) than hypothenar muscles (C8 myotome) would favor spread in the caudo-rostral direction. If segmental spread was a major determinant of differential arm muscle involvement, variation in the order of arm muscle weakness would be expected by site of weakness onset. Our examination did not identify such a pattern. Indeed, the TOMS sequence was similar regardless of onset site, although there was a trend for greater relative separation of TOMS (between muscle groups) for arm-onset than for bulbar- or leg-onset (Table 3). It is therefore likely that cortical influences and/or local network connections in the cervical cord override segmental spread in determining the sequence of arm muscle involvement.
Although lacking information on handedness, these data offer interesting insights into side-related patterns. First, by z-score sums, the right arm was more frequently weaker than the left. This difference was found in the legs as well. It is unlikely that this is an artifact of a systematic bias (miscalibration) of normative values derived from 228 normal volunteers (12). Assuming that the majority of subjects were right-hand dominant, this finding supports prior reports of concordance between handedness and side of onset (4,20). Handedness influences on onset side are probably subtle, given that a significant inter-side TOMS ratio was not observed, and a chart review of 700 personally examined patients has found no concordance or asymmetry (21). Second, there was almost 70% concordance of the weaker side between arms and legs, in keeping with the well-recognized pattern of spread of unilateral limb-onset disease to the corresponding contralateral limb, and then to other ipsilateral limb (22). Third, the stronger-weaker arm TOMS ratio was less for bulbar- and leg-onset disease than for arm-onset disease, implying that asymmetry of weakness diminishes with spread to other regions of the neuraxis from the site of onset.
Are the formulations of ZOS and TOMS we present clinically meaningful? In practice, it is challenging to clinically interpret single HHD measures in force units, or even as z-scores because of variability between muscles and between subjects. ZOS normalization makes HHD data directly meaningful to health care providers as well as patients and families. Review of MMT-HHD comparisons (23) suggests that 50% weakness would probably be unequivocally weak on clinical examination, falling somewhere in the wide MRC grade 4 range. TOMS could roughly translate to time to unequivocal/evident moderate weakness. As MMT descriptors within the grade 4 range (such as “4 minus”, “4 plus”, or “4.5”) are highly variable/inconsistent, translating 50% HHD strength to a more specific sub-part of that range is best avoided. What does midway strength mean pathologically at the motor neuron level? Electrophysiological studies suggest a roughly curvilinear relationship between the motor unit number estimate (MUNE) and strength because of compensatory re-innervation (24), implying that at midway strength, motor neuron loss already exceeds 50%.
Could zero-one scaled HHD measures and TOMS serve as outcome measures? ZOS strength is correlated with the fine motor questions of ALSFRS. Arm ZOS megascore and its slope are highly correlated with fine motor subscore and its slope (Supplementary File). ZOS strength reduces between-patient variability relative to crude and z-scored strength. A megascores obtained by summating ZOS strength improves variation compared to megascores derived from z-scores (see Supplementary File for performance metrics), and may therefore improve efficiency in therapeutic research. If TOMS is used as a time-to-event outcome, it occurs earlier in the course of ALS than time to zero force (25), and therefore may be applicable in earlier stages of disease, especially in the study of muscles that are well-preserved at initial assessment. Specification of expected normal strength requires some muscles to be preserved, implying that ZOS and TOMS estimation may not be possible when all muscles are weak. With a heightened interest in enriching trials with patients in early-stage disease, this limitation of our method is anticipated not to be problematic. Prospectively piloting ZOS and TOMS in clinical trials, especially those testing treatments that are expected to improve muscle strength in early disease, would be required to demonstrate their value as outcome measures.
This study has significant limitations. First is the obvious risk of misspecification of unobserved normal strength; it should be emphasized that “midway” in TOMS is only approximate. ZOS strength would be underestimated as would TOMS if presumed normal strength was set higher than its unobserved true value, and vice versa. A consistent bias in normal strength specification across muscles (from an outlier best z score), however, would affect TOMS similarly, and therefore would not bias TOMS ratios. Importantly, qualitative aspects of results were consistent across sensitivity analyses employing different assumptions of normal strength. Age- and sex-specific normative data could improve accuracy of ZOS scaling but was not available for the employed HHD measurement method. An alternative construct (see time to half initial strength discussed in Supplementary File) requires no baseline strength assumption, but being confounded by diagnostic delay, is less interpretable from a biological perspective. Second, the clinical trial cohort may not be representative of the ALS population. Third, only a limited set of muscles was examined, therefore the data are unable to address other comparisons such as “split hand” and “split leg” (ankle dorsiflexors and plantar flexors). Fourth, there was no information on handedness. Last, because of data limitations, we are unable to estimate variability in the order of muscle involvement using hierarchical models.
Despite these limitations, our analytic methods offer a novel and discriminating perspective on longitudinal weakness patterns that prior “snapshot” descriptions of MMT findings (3,9) cannot provide. Additionally, these methods instigate the development of new outcome metrics, such as a zero-one scaled measures, zero-one megascores, TOMS and TOMS ratios that could be meaningful for longitudinal assessment of motor function in ALS and other progressive neuromuscular diseases.
Supplementary Material
Acknowledgements
The authors thank Northeast ALS Consortium (NEALS), NCRI at Massachusetts General Hospital, Professor David Schoenfeld and Dr. Hong Yu for providing clinical trial data that we have used in this study. We are indebted to Professor Richard Bohannon for insights into HHD and muscle strength correlations. We would also like to thank the Neurological Institute Center for Outcomes, Research and Evaluation (NI-CORE) and Quantitative Health Sciences (QHS) at Cleveland Clinic for supporting this effort.
Funding
This study was not supported by any external or internal grant. NJT has received research support from Novartis Pharmaceuticals Corp. for unrelated work. BJD was supported by NIH Award No. R01-EB014877. BRL has received research support from Novartis Pharmaceuticals Corp., Teva Pharmaceuticals USA, Inc., and PhRMA Foundation for unrelated work. EPP is holder of the Barry Winovich (Bright Side of the Road Foundation) Chair in ALS Research, receives support from the Samuel J. and Connie M. Frankino Charitable Foundation, and clinical trial and research funding from NIH/CDC and the ALS Association.
Footnotes
Ethics approval and patient consent
None sought for analysis of a de-identified dataset.
Declaration of interest
No potential conflict of interest was reported by the author(s).
References
- 1.Ravits JM, La Spada AR. ALS motor phenotype heterogeneity, focality, and spread: deconstructing motor neuron degeneration. Neurology. 2009;73:805–11. [DOI] [PMC free article] [PubMed] [Google Scholar]
- 2.Vucic S Split elbow sign: more evidence for the importance of cortical dysfunction in ALS. J Neurol Neurosurg Psychiatry. 2019;90:729. [DOI] [PubMed] [Google Scholar]
- 3.Ludolph AC, Emilian S, Dreyhaupt J, Rosenbohm A, Kraskov A, Lemon RN, et al. Pattern of paresis in ALS is consistent with the physiology of the corticomotoneuronal projections to different muscle groups. J Neurol Neurosurg Psychiatry. 2020;91:991–8. [DOI] [PubMed] [Google Scholar]
- 4.Devine MS, Woodhouse H, McCombe PA, Henderson RD. The relationship between limb dominance, disease lateralization and spread of weakness in amyotrophic lateral sclerosis (ALS). Amyotroph Lateral Scler Frontotemporal Degener. 2013;14:150–1. [DOI] [PubMed] [Google Scholar]
- 5.Shayya L, Babu S, Pioro EP, Li J, Li Y. Distal predominance of electrodiagnostic abnormalities in early-stage amyotrophic lateral sclerosis. Muscle Nerve. 2018;58:389–95. [DOI] [PubMed] [Google Scholar]
- 6.Hansen S, Ballantyne JP. A quantitative electrophysiological study of motor neurone disease. J Neurol Neurosurg Psychiatry. 1978;41:773–83. [DOI] [PMC free article] [PubMed] [Google Scholar]
- 7.Wilbourn AJ. The “split hand syndrome”. Muscle Nerve. 2000;23:138. [DOI] [PubMed] [Google Scholar]
- 8.Simon NG, Lee M, Bae JS, Mioshi E, Lin CS-Y, Pfluger CM, et al. Dissociated lower limb muscle involvement in amyotrophic lateral sclerosis. J Neurol. 2015;262:1424–32. [DOI] [PubMed] [Google Scholar]
- 9.Khalaf R, Martin S, Ellis C, Burman R, Sreedharan J, Shaw C, et al. Relative preservation of triceps over biceps strength in upper limb-onset ALS: the “split elbow”. J Neurol Neurosurg Psychiatry. 2019;90:730–3. [DOI] [PMC free article] [PubMed] [Google Scholar]
- 10.Shefner JM. Strength testing in motor neuron diseases. Neurotherapeutics. 2017;14:154–60. [DOI] [PMC free article] [PubMed] [Google Scholar]
- 11.Bohannon RW. Considerations and practical options for measuring muscle strength: a narrative review. Biomed Res Int. 2019;2019:8194537. [DOI] [PMC free article] [PubMed] [Google Scholar]
- 12.Shefner JM, Liu D, Leitner ML, Schoenfeld D, Johns DR, Ferguson T, et al. Quantitative strength testing in ALS clinical trials. Neurology. 2016;87:617–24. [DOI] [PMC free article] [PubMed] [Google Scholar]
- 13.Cudkowicz ME, Titus S, Kearney M, Yu H, Sherman A, Schoenfeld D, et al. Safety and efficacy of ceftriaxone for amyotrophic lateral sclerosis: a multi-stage, randomised, double-blind, placebo-controlled trial. Lancet Neurol. 2014;13:1083–91. [DOI] [PMC free article] [PubMed] [Google Scholar]
- 14.Bohannon RW, Magasi SR, Bubela DJ, Wang Y-C, Gershon RC. Grip and knee extension muscle strength reflect a common construct among adults. Muscle Nerve. 2012;46:555–8. [DOI] [PMC free article] [PubMed] [Google Scholar]
- 15.Rushton DJ, Andres PL, Allred P, Baloh RH, Svendsen CN. Patients with ALS show highly correlated progression rates in left and right limb muscles. Neurology. 2017;89:196–206. [DOI] [PMC free article] [PubMed] [Google Scholar]
- 16.Seber GA, Lee AJ. Linear regression analysis. 2nd ed. Hoboken, NJ: John Wiley & Sons, Inc.; 2003. [Google Scholar]
- 17.Pinheiro J, Bates D, DebRoy S, Sarkar D. R Core Team. nlme: linear and nonlinear mixed effects models [Internet]; 2020. Available at: https://CRAN.R-project.org/package=nlme.
- 18.Eisen A, Kim S, Pant B. Amyotrophic lateral sclerosis (ALS): a phylogenetic disease of the corticomotoneuron? Muscle Nerve. 1992;15:219–24. [DOI] [PubMed] [Google Scholar]
- 19.Eisen A, Braak H, Del Tredici K, Lemon R, Ludolph AC, Kiernan MC. Cortical influences drive amyotrophic lateral sclerosis. J Neurol Neurosurg Psychiatry. 2017;88:917–24. [DOI] [PubMed] [Google Scholar]
- 20.Turner MR, Wicks P, Brownstein CA, Massagli MP, Toronjo M, Talbot K, et al. Concordance between site of onset and limb dominance in amyotrophic lateral sclerosis. J Neurol Neurosurg Psychiatr. 2011;82:853–4. [DOI] [PubMed] [Google Scholar]
- 21.Pioro E, Thakore N. Handedness and side of onset in limb-onset ALS: is there a connection? Amyotroph Lateral Scler Frontotemporal Degener. 2016;17:86–100.27825252 [Google Scholar]
- 22.Walhout R, Verstraete E, van den Heuvel MP, Veldink JH, van den Berg LH. Patterns of symptom development in patients with motor neuron disease. Amyotroph Lateral Scler Frontotemporal Degener. 2018;19:21–8. [DOI] [PubMed] [Google Scholar]
- 23.Bohannon RW. Measuring knee extensor muscle strength. Am J Phys Med Rehabil. 2001;80:13–8. [DOI] [PubMed] [Google Scholar]
- 24.Bromberg MB, Forshew DA, Nau KL, Bromberg J, Simmons Z, Fries TJ. Motor unit number estimation, isometric strength, and electromyographic measures in amyotrophic lateral sclerosis. Muscle Nerve. 1993;16:1213–9. [DOI] [PubMed] [Google Scholar]
- 25.Johns D, Liu D, Ferguson T, Cedarbaum JM. Methods for evaluating patients (application number 15/629,424, publication number 20180064386) [Internet]; 2018. Available at: www.uspto.gov. Accessed August 31, 2020.
Associated Data
This section collects any data citations, data availability statements, or supplementary materials included in this article.