Abstract
Our goal is to address the need for driver-state detection using wearable and in-vehicle sensor measurements of driver physiology and health. To address this goal, we deployed in-vehicle systems, wearable sensors, and procedures capable of quantifying real-world driving behavior and performance in at-risk drivers with insulin-dependent type 1 diabetes mellitus (DM). We applied these methodologies over 4 weeks of continuous observation to quantify differences in real-world driver behavior profiles associated with physiologic changes in drivers with DM (N=19) and without DM (N=14). Results showed that DM driver behavior changed as a function of glycemic state, particularly hypoglycemia. DM drivers often drive during at-risk physiologic states, possibly due to unawareness of impairment, which in turn may relate to blunted physiologic responses (measurable heart rate) to hypoglycemia after repeated episodes of hypoglycemia. We found that this DM driver cohort has an elevated risk of crashes and citations, which our results suggest is linked to the DM driver’s own momentary physiology. Overall, our findings demonstrate a clear link between at-risk driver physiology and real-world driving. By discovering key relationships between naturalistic driving and parameters of contemporaneous physiologic changes, like glucose control, this study directly advances the goal of driver-state detection through wearable physiologic sensors as well as efforts to develop “gold standard” metrics of driver safety and an individualized approach to driver health and wellness.
Keywords: Safety [C1], human engineering [C2], diabetes, driver state detection, driver physiology, CGM, driver safety, driver behavior, naturalistic driving
1. Introduction
Our overarching collaborative safety research goal is to address the need for driver-state detection using wearable and in-vehicle sensor measurements of driver physiology and health. To address this goal, this novel pilot project deployed wearable sensors and in-vehicle instrumentation capable of quantifying the relationship of a driver’s physiologic state to real-world driver behavior and performance in at-risk drivers with type 1 insulin-dependent diabetes mellitus (DM). Using this research strategy, we demonstrate the feasibility of quantifying on-road risk in relationship to parameters of glucose control in drivers with DM. With this novel approach to naturalistic driving methodology, we discovered key relationships between parameters of real-world driving and contemporaneous physiologic changes, like glucose. Results show that driver risk in medical cohorts must be characterized relative to the individual driver’s contemporaneous physiologic state and not in relationship to the presence of disease alone. This study directly advances the goal of developing metrics for in-vehicle driver state detection to improve driver safety and develop individualized approaches to driver health and wellness in a variety of medical cohorts, including DM.
2. Background
Diabetes affects greater than 8.5% of adults globally, representing 422 million adults worldwide (1). This number is projected to increase to 642 million diagnosed adults worldwide by 2040 (2) and, considering estimates that 45.8% of diabetes cases are undiagnosed (3), the number affected by 2040 may be over one billion. This presents a problem of patient and public safety because drivers with DM have a significantly increased risk for vehicle crashes as compared to the general driver population (4). Hypoglycemia (low glucose) is a key factor for this increased risk, particularly in insulin-dependent DM (5,6). While insulin is essential for survival in many patients with DM, close control over hyperglycemia (high glucose), which reduces long-term complications of diabetes (e.g., retinopathy, neuropathy, renal disease, and cerebrovascular disease), can increase the risk of hypoglycemia.
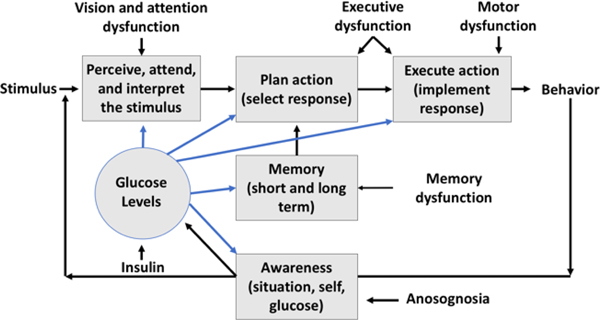
Hypoglycemia and patterns of poor glucose control can impair the cognitive abilities (attention, memory, and decision-making) needed for safe performance in complex, high-risk tasks like automobile driving (7,8). These impairments can reduce driver performance and increase the likelihood of driver safety errors that may lead to a crash (Figure 1). Cognitive impairments from hypoglycemia (particularly attention and executive dysfunction) can persist for hours after glucose levels return to normal (9). Consequently, real-time glucose levels alone may not be sufficient for predictions of safe or at-risk driving in DM.
Fig. 1.
The risk of driver errors depends on arousal and attention, perception, response selection and implementation (which depends on memory, decision-making and other executive functions), emotion, motor abilities, and awareness of behavior and internal status. The driver’s behavior is safe or unsafe due to errors at one or more stages in the driving task. Glucose levels affect processing at several stages.
In drivers with DM, these impairments include self-awareness of physiologic status (10). Self-awareness of internal state (an executive function) is critical to a driver’s ability to mitigate risk. In normal functioning, the body releases epinephrine in response to hypoglycemia, producing autonomic effects that include increased heart rate. These autonomic effects provide internal cues to a DM driver that he or she is impaired. Affected DM drivers may be unable to recognize their hypoglycemic status and mitigate risk appropriately.
Despite this problem of public and patient safety, the degree of glucose control needed to produce safe and stable real-world driving performance in DM drivers is unknown. To mitigate crash risk in diabetes, we must determine the degree of effective glucose control for individuals to reach a degree of improvement that would permit safe driving. A single hypoglycemic episode affects surrogate measures of driver risk such as cognitive performance (11), vigilance scores, and simulated driving performance, but the effects on real-world driving behavior are poorly understood. Better understanding of how these factors influence real-world driving is essential for mitigating vehicle crashes in drivers with diabetes. Solutions to this patient safety and public health problem can be derived by combining technological advances which permit the direct assessment of real-world driving behavior with in-the-field physiologic measures and continuous glucose monitoring (CGM).
3. Methods
This project deployed in-vehicle sensor systems, wearable sensors, and procedures for quantifying real-world driving behavior in at-risk drivers with DM to determine the level and patterns of glucose control needed to produce meaningful improvements in driving performance. We measured driver glycemic state in DM drivers using CGM sensor technology. DM and comparison drivers were continuously monitored over 4 weeks using in-vehicle sensor packages. All drivers wore heart rate and activity monitoring sensors throughout study participation and gave informed consent to study participation according to the University of Nebraska Medical Center’s Institutional Review Board’s protocols.
3.1. Inclusion and Exclusion Criteria
This study enrolled 36 participants, including 20 drivers with insulin-dependent type 1 DM and 16 comparison drivers. Two comparison participants were excluded due to laboratory evidence of DM, heretofore undiagnosed. One DM participant was excluded due to vehicle incompatibility with the study’s driving instrumentation. Analyzable data were obtained from 19 DM drivers and 14 comparison drivers.
All participants were legally licensed, experienced, and active drivers between 21–59 years of age (μ = 33.2 years). At the first study visit, participants completed a full medical history and physical examination. Major confounding medical conditions (e.g., peripheral nerve, eye, renal, neurological, and major psychiatric diseases) and medication use (e.g., narcotics, sedating antihistamines, and major psychoactive medication) were excluded. Blood labs were obtained to determine basic metabolic function and presence of DM (DM drivers, <12% HbA1c; comparison drivers, <5.7% HbAlc). DM drivers had received a diagnosis of type 1 DM, used insulin at-least daily, and had self-reported at-least biweekly episodes of hypoglycemia. Comparison drivers had no evidence of DM based on medical history, physical examination, and blood lab results. All participants had safe vision for driving per Nebraska Department of Motor Vehicle (DMV) standards (near and far visual acuity of <20/40 OU).
3.2. Driving Procedures
Procedures for driving data collection included 1) in-vehicle sensor instrumentation installed in participant’s own vehicle and 2) obtainment of state DMV records. Driver behavior was remotely and continuously recorded from on- to off-ignition in the participant’s own vehicle via “Black Box” vehicle sensor instrumentation packages that collected video, accelerometer, GPS, and vehicle sensor (OBD) data at a rate of every second. State DMV crash and citation records were obtained for each participant to quantify the individual’s driver safety in the 5 years prior to study enrollment. All driving data were post-processed to ensure reliable sensor values.
3.3. Physiologic Monitoring Procedures
DM drivers wore CGMs continuously throughout study participation. CGM sensors provide continuous data streams of real-world glucose levels (12), which are sampled every 5 minutes and can directly link a DM driver’s glucose levels to time synchronized driving data. The Dexcom G4 PLATINUM Professional CGM used in this study is FDA approved for the detection of hypo- and hyperglycemia. Participant compliance with device use and data quality met FDA guidelines for safety and effectiveness (13). On average, 5.5% (range: 1.7–10.2%) of CGM data was missing, meeting FDA guidelines that devices must be missing <25% data. CGMs require twice daily calibration by participants for accurate glucose estimation. Calibration is completed when participants enter self-sampled blood glucose readings from their blood glucose meter. Participants complied with calibration procedures and calibrated their CGM on average 2.1 (range: 0–9) times daily. The percent difference between self-sampled blood glucose readings and CGM data was <12.6% for 95% of data, meeting FDA guidelines that at least 77% of data must have a difference of <15%. For all data, the difference between self-sampled blood glucose and CGM readings averaged 4.29% (range: 2.8%−6.6%).
All CGM data were post-processed to inspect proper sensor function and remove potentially spurious CGM values. Physiologically impossible glucose levels were removed if they changed at a rate of greater than 25% within a 15 timespan. This check removed, on average, 2.1% of data per participant. Glucose levels were categorized as hypoglycemic (<70 mg/dL), euglycemic/normal (70–180 mg/dL), and hyperglycemic (>180 mg/dL). Severely hypoglycemic (<56 mg/dL) and hyperglycemic (>300 mg/dL) glucose levels, associated with greater impairment, were also identified. CGMs were “blinded”, so that glucose values were not displayed to the DM drivers and could not be used for real-time feedback and treatment. CGM data were aligned with driving data based on time-stamp. All drivers wore wristwatch-like heart rate and activity monitoring sensors. Heart rate and activity data were collected continuously every minute.
3.4. Hypotheses
We used the results to test the hypotheses that drivers with DM 1) expose themselves to driving during at-risk physiologic states, 2) show changes in at-risk driving behavior as a function of their glucose fluctuations, and 3) show, relative to comparison drivers, impairments in driving behavior as a function of disease status (independently of real-time glucose levels). We also explored other physiologic parameters, like heart rate, that may contribute to a driver’s awareness of impairment and subsequent exposure to risk.
4. Results
This project collected critical information on the relationship of driver behavior to physiology (glucose and heart rate) across a total of 848 driver days, 21,232 miles driven, and 3,687 drives. We discuss several findings.
4.1. Exposure to Risk in DM Drivers
Across the study, DM drivers showed almost daily periods of persistent exposure to hypoglycemia. Periods of exposure to hypoglycemia typically lasted 86 minutes, and 66% of all hypoglycemic episodes included severe hypoglycemia (<56 mg/dL). Reoccurring hypoglycemia increases DM drivers’ exposure to risk and may reduce ability to recognize their own impairment to mitigate risk.
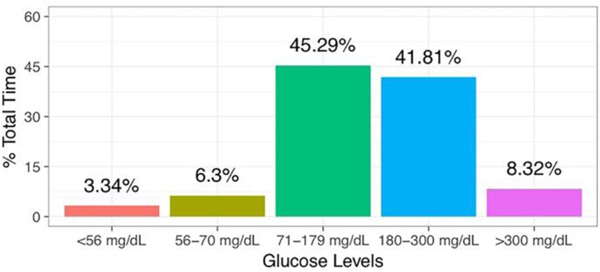
Severe and recurrent hypoglycemia can blunt a driver’s physiologic responses to hypoglycemia. This reduces available internal cues (such as measurable increases in heart rate), thereby lessening the driver’s ability to recognize and mitigate risk (14). Overall, DM drivers had at-risk glucose levels (<70 mg/dL; >300mg/dL) 17.96% of study time (Figure 2).
Fig. 2.
Frequency of DM Driver Exposure to Glucose Levels throughout Study Participation.
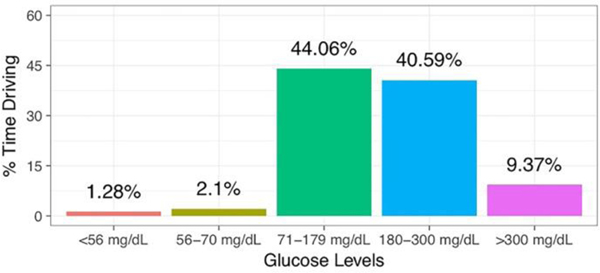
Drivers with DM drove while their glucose levels were abnormal, exposing themselves to real-world, on-road risk. DM drivers were hypoglycemic (<70 mg/dL) 3.38% of driving time. They were severely hypoglycemic 37.9% of this time (1.28% of total driving time) (Figure 3). Severe hyperglycemia (>300 mg/dL), which is also linked to impairment, was likewise common (9.37% of time driving). The notable prevalence of at-risk glucose levels during driving in DM drivers clearly demonstrates exposure to risk and reflects insufficient self-restriction. Overall, DM drivers drove during at-risk glycemic states 12.75% of driving time.
Fig. 3.
Frequency of DM Driving at Varying Glucose Levels
4.2. Linking Abnormal Physiology to At-Risk Driving in DM
We tested the hypothesis that DM drivers show changes in on-road risk as a function of their contemporaneous glycemic state. To test this hypothesis, we modeled patterns of vehicle acceleration behavior as a function of the DM driver’s glycemic status and in comparison to drivers without DM. DM drivers’ behavior and performance were assessed both in relation to momentary glucose levels and to their predominant glycemic state across drives. Glycemic state was categorized from each driver’s predominant glucose levels during a given drive: 1) hypoglycemic (<70 mg/dL), 2) euglycemic to moderately hyperglycemic (70–300 mg/dL), and 3) severely hyperglycemic (>300 mg/dL). We predicted that at-risk DM driving behavior would increase during at-risk hypoglycemic and severely hyperglycemic states.
Profiles of vehicle acceleration behavior can index at-risk driving behaviors, including erratic and risky driving (near-misses, rapid lane changes, hard braking, and swerving) (15,16). We defined vehicle acceleration behavior relative to 1) acceleration variability and 2) large acceleration events (>0.35 g). High acceleration variability is linked to at-risk driving behaviors like swerving and hard braking or accelerating (15,16). Reduced acceleration variability is linked to driver distraction and less brake/accelerator pedal or steering wheel use, which may indicate reduced driver responsiveness to safety critical changes in their driving environment (e.g., road curvature, traffic speed transitions) (17).
To relate glucose data to Black Box data, we aggregated Black Box vehicle sensor data within 5 minute periods to align with CGM sampling rates. Acceleration variability was calculated as variance of the absolute maximum of lateral and longitudinal vehicle acceleration. Acceleration events were normed per minute of drive time to account for increased acceleration events in longer drives. Vehicle speed data, collected across OBD and GPS sensors, were modeled to provide a proxy to driving environment and risk (e.g., higher speed roadways may carry higher risk). Modeling vehicle speed data also permitted us to control for increases in acceleration events due to higher speeds (main effect).
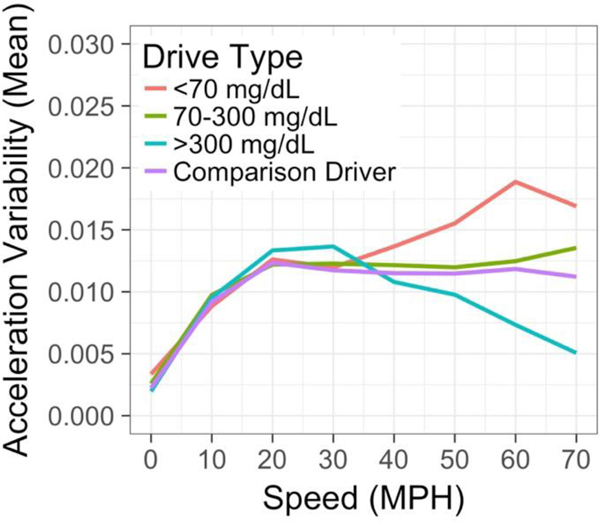
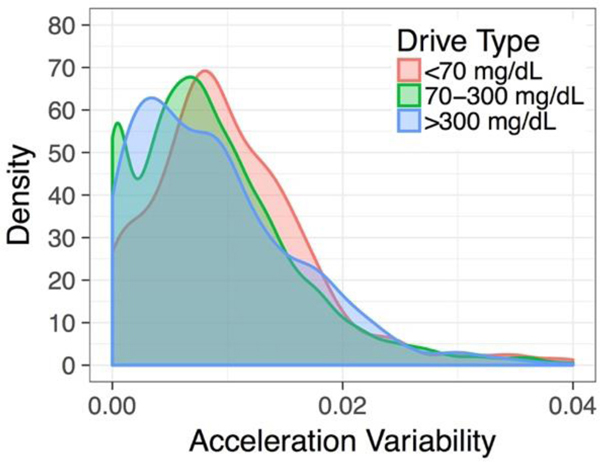
We predicted that DM drivers who had at-risk glycemic states (hypoglycemia and severe hyperglycemia) would show greater changes in at-risk vehicle acceleration events compared to drivers without DM and to the individual DM drivers’ own driving during normal (eu)glycemia. DM driver acceleration behavior, modeled via a mixed effects beta regression model, was significantly linked to the DM drivers’ in-vehicle, glycemic status (Figure 4). During hypoglycemia and severe hyperglycemia, DM drivers showed significantly different acceleration profiles relative to 1) comparison drivers and 2) DM drivers who had normal glycemia. Interestingly, hypoglycemia and severe hyperglycemia affected driver behavior differently. Hypoglycemic DM drivers tended to show increased vehicle acceleration variability, suggesting that hypoglycemia-related cognitive impairment is linked to at-risk driver behaviors like swerving and hard braking (15,16). Severely hyperglycemic DM drivers had reduced vehicle acceleration variability, suggesting less use of vehicle brake and accelerator pedals, reduced steering adjustments, and reduced responsiveness to changes in the driving environment (17). A reviewer asked whether Auto Cruise use may explain reduced acceleration variability at higher speeds. While we did not directly evaluate Auto Cruise, its use would be expected to reduce acceleration variability at higher speeds regardless of driver glycemic status. The effect of driver glycemic status on vehicle acceleration variability merits further investigation and suggests that high and low glucose levels may produce differing mechanisms of impairment in DM drivers. Further analysis would be needed to determine the real-world safety implications of these differing patterns of behavior.
Fig. 4.
Vehicle Acceleration Variability in DM Drivers with Varying Glycemic States and Comparison Drivers. DM drivers showed significant changes in vehicle acceleration variability relative to comparison drivers. These changes increased during at-risk glycemic states and during high speed driving.
DM drivers who had normal glycemia showed small, but measurable, changes in vehicle acceleration behavior compared to drivers without DM (β = 0.14, SE = 0.04, p = <0.001). It is unclear to what extent these small differences might translate to real-world adverse outcomes. DM drivers exhibited greater degrees of at-risk behaviors on high-speed roadways (β = 0.01, SE = <0.01, p = <0.001), after accounting for the main effect of speed. This evidence suggests that safety relevant behavior changes linked to at-risk physiology must be considered in the context of the driving environment, particularly ambient speed.
We also modeled driver behavior changes as function of glycemic state within individual DM drivers (Figure 5). This allowed us to test if the presence of at-risk physiology, within an individual, increased risk relative to when the DM driver had normal glucose levels. Models of individual DM drivers mirrored previous results (as in Figure 4). DM drivers showed greater at-risk vehicle acceleration profiles when glucose levels were abnormal (<70 mg/dL: β = −0.38, SE = 0.07, p = <0.0001; >300 mg/dL: β = −0.17, SE = 0.05, p = <0.001), relative to when they drove with normal glucose levels. This supports our hypothesis that DM driver behavior changes, within an individual, across his or her own changing physiologic status.
Fig. 5.
Changes in Individual DM Driver’s Acceleration Variability as a Function of his or her own Glycemic State. DM drivers showed significant changes in vehicle acceleration behavior relative to their own driving at changing glycemic states.
We tested the effects of momentary glucose levels on DM driver behavior. We predicted that DM drivers would show higher rates of acceleration events as their glucose levels fell. This model tested the hypothesis that DM driver behavior changes as a function of the driver’s overall state and contemporaneous physiologic status.
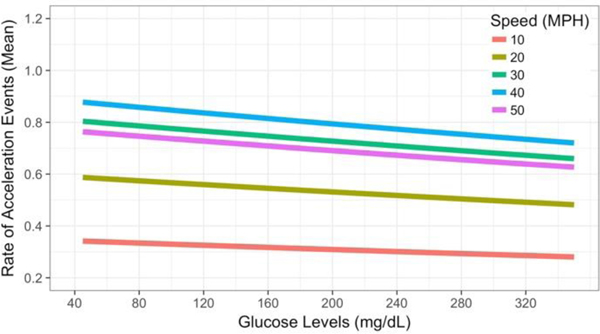
DM driver behavior changed in real-time across the driver’s continuously changing glucose levels (Figure 6). As the DM driver’s glucose levels crossed into hypoglycemia, rates of at-risk acceleration events increased (β = < −0.001, SE = <0.001, p = 0.05). This result significantly links the DM driver’s real-time glucose levels, especially hypoglycemic levels, to changes in the individual DM driver’s at-risk behavior. Speed data mirrored the previous model’s result (Figure 4), showing increased acceleration events during higher speed driving (after accounting for the main effect of speed) and underscoring the importance of contextual factors linked to speed, like roadway type, in evaluating DM driver risk. A plot of the estimates for acceleration event rates at each glucose level indicates that acceleration events rates peak around 40 mph (Figure 6).
Fig. 6.
Acceleration Event Rates as a Function of the DM Driver’s In-Vehicle Glucose Levels and Vehicle Speed. Acceleration event rates significantly increased as the DM driver’s glucose levels fell. Event rates further increased during higher speed driving.
These novel results support a dynamic model of DM driver safety. At-risk DM driver behavior changes in real-time relative to the driver’s own physiology, particularly with at-risk glucose levels. Findings suggest individual DM driver risk depends on the driver’s overall physiologic state and dynamic momentary physiology. Driver risk likely also depends on contextual factors like roadway type and environment such as ambient speed. These contextual factors should be considered when indexing risk relative to the driver’s physiologic status.
4.3. Linking Disease to At-Risk Driving
We tested the hypothesis the DM drivers would show safety relevant changes in driver behavior as a function of disease and independently of their physiologic status. No significant differences were observed in rate models of vehicle acceleration events in DM and comparison drivers (p = 0.25). Models of acceleration variability (Figure 4) suggested that DM drivers differ slightly from comparison drivers even when their glucose levels are normal, a small effect of uncertain real-world safety significance. Further investigation is needed to identify the degree to which factors besides real-time physiology affect DM driver safety. However, results suggest that a driver’s diagnosis is insufficient to predict driver risk; the driver’s real-time physiologic status must be considered in models of driver risk-assessment.
State DMV records and violations, considered by some to be a “gold standard” of driver safety risk, showed elevated risk in DM drivers compared to drivers without DM. DMV records showed 3 crashes (2 at fault) and 13 citations. DM drivers accounted for all crashes and 85% of all citations in this study. Considering the results presented above, we suspect this elevated risk will be found to depend on exposure to at-risk glycemic states, not DM diagnosis alone. This apparent elevated risk in DM can be modeled relative to the driver’s real-time physiology and complications of diabetes in future studies.
4.4. Linking Vehicle Sensor Data to Driver Safety
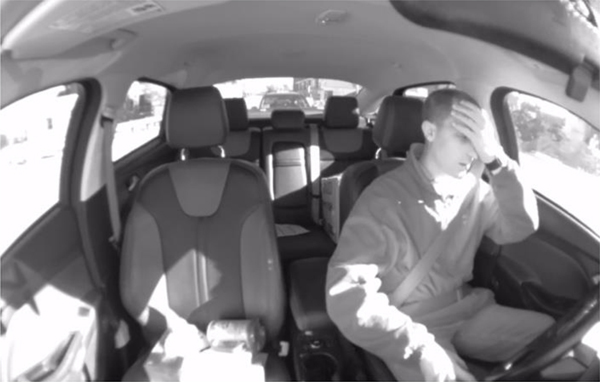
We conducted exploratory reviews of Black Box video data to provide preliminary visual confirmation of linkages between vehicle sensor based metrics and real-world driver safety. Video clips were flagged where 1) the driver was hypoglycemic and 2) high acceleration events (>0.35g) were seen. The review identified DM drivers who were severely hypoglycemic (<40 mg/dL) and likely impaired while driving (Figure 7).
Fig. 7.
A Severely Hypoglycemic (<40 mg/dL) DM Driver Driving while Impaired and Exhibiting Visible Signs of Hypoglycemia (Sweating).
Review of these clips by video analysts documented multiple safety critical events in the hypoglycemic DM driver’s video clips, including driver vehicle control, decision-making, and judgment impairments. These clips included near-misses, poor execution of turning maneuvers with the driver temporarily running off the roadway (vehicle control), and texting and eating while driving, including operating the steering wheel with the driver’s legs to facilitate non-driving activities.
The large volume of naturalistic driver video data collected in this project merits a more systematic review to identify safety critical events. This will benefit from the application of new analysis techniques, like computer vision algorithms, to quantify the incidence of the safety errors in relationship to driver physiology. Preliminary video review shows promise for linking unsafe driving with the driver’s in-vehicle glycemic state and vehicle sensor data.
4.5. Abnormal Physiologic Cues to Hypoglycemia in DM Drivers
Self-awareness of impairment is critical to an individual driver’s ability to mitigate risk. DM drivers in this study are at-risk for reduced awareness of impairment due to frequent exposure to hypoglycemia (Figure 2) (14). Increased heart rate, the body’s typical response to hypoglycemia, provides an internal cue to DM individuals that they may be impaired. With repeated exposure to hypoglycemia, this heart rate response can become blunted, resulting in reduced awareness of impairment (10). To assess the likelihood that this population of DM drivers may have reduced awareness of hypoglycemia, we assessed individual profiles of heart rate response to hypoglycemia.
We identified periods of persistent hypoglycemia (>15 minutes of <70 mg/dL glucose levels) and correlated heart rate and glucose levels within each of those periods. Typical autonomic function was classified if glucose levels and heart rate showed a negative correlation (increasing heart rate with decreasing glucose levels). Heart rate data were summarized every 5-minutes to align with CGM data. We predicted that DM drivers would show blunted autonomic responses to hypoglycemia across the study, indicating risk for unawareness of hypoglycemia.
We found considerable variability in individual DM driver heart rate responses to hypoglycemia. DM individuals did not show consistent heart rate increases during hypoglycemia. Their heart rate increased in hypoglycemia on average only 55.28% (range: 41.67% - 90%) of the time. DM drivers lacked consistent physiologic cues to signal them of their impairment, which may underpin DM driver tendency to drive impaired (Figure 3).
5. Conclusion
This proof-of-concept study provides unique evidence on the relationship of driver physiology to real-world risk in DM and directly advances our overarching goal of driver-state detection through wearable physiologic sensors. The findings support our a priori hypothesis that risk in insulin-dependent type 1 DM drivers changes as a function of their real-time physiology. We linked patterns of glucose control, including glycemic state and momentary glucose levels, to at-risk patterns of vehicle acceleration behavior that may indicate real-world safety risk. Study results support the idea that real-world risk must be considered in relationship to the driver’s physiologic state (particularly hypoglycemia in DM), and not just the presence or absence of disease.
We discovered that changes in real-world driving performance are difficult to predict independently of the driver’s physiologic state. Future analyses are needed to determine how the driver’s physiologic status prior to (and not just during) driving affects their current driving behavior. In DM drivers, poor glucose control produces functional impairments that lead to at-risk behaviors both in-the-moment and, potentially, downstream.
Changes in at-risk driver behavior likely vary in response to multiple parameters. These include the driver’s physiology, cognitive status, disease status, and the internal awareness of impairment (which likely varies with availability of physiologic cues like heart rate). More data are needed to examine these preliminary findings and to determine their robustness and generalizability.
Our preliminary data suggest that DM drivers are affected by multiple parameters of impaired physiology, including glucose and heart rate. DM drivers with repeated hypoglycemic episodes may lack normal autonomic responses to cue them to their own internal hypoglycemic state, which could reduce awareness of impairment. We hypothesize that driver awareness of impairment, like physiologic status, is not a stable behavioral property, but fluctuates in real-time and may modulate real-world risk. These mechanisms provide a fruitful opportunity for studies linking driver physiologic status and driving safety.
The results clearly show that at-risk driver behavior and performance can be successfully measured in individual drivers with wearable and in-vehicle sensor technology during continuous real-world driving. This study provides a novel platform for the study of safety-relevant driver behavior and performance over extended time-frames and in operational settings. This methodology, developed and applied as a probe of vulnerable DM drivers, may be applied to other medical conditions that affect real-time physiology and functions needed for safe vehicle operation.
Overall, the findings show several potential venues for safety intervention, including Advanced Driver Assistance Systems and algorithms that can sense and respond to changes in driver state to assist at-risk drivers with conditions such as DM (type 1 and type 2) and other prevalent disorders. Ultimately, the driver’s vehicle can develop a database of individual driver behavior and performance and health metrics, make momentary assessments in the field, with feedback of meaningful metrics and advice to the driver, healthcare providers and vehicle designers, in line with “my car, the doctor”.
This paper is written on a proceeding presented at JSAE FAST-zero’17 Meeting. This project was supported by Toyota Collaborative Safety Research Center and the University of Nebraska Medical Center’s Mind & Brain Health Labs. We thank our research team for their diligence and commitment in coordinating this project. We acknowledge and thank the University of Nebraska at Omaha’s Biomechanics department for instrumenting our study vehicles.
References
- (1).Global Report on Diabetes, World Health Organization. Retrieved from http://apps.who.int/iris/bitstream/10665/204871/1/9789241565257_eng.pdf?ua=1 (Accessed 2016.12.22).
- (2).International Diabetes Federation. Retrieved from http://www.diabetesatlas.org (Accessed 2017.04.12).
- (3).Beagley J, Guariguata L, Weil C, & Motala A. Global estimates of undiagnosed diabetes in adults. Diabetes Research and Clinical Practice, Vol.103, No.2, pp.150–160 (2014). [DOI] [PubMed] [Google Scholar]
- (4).Tregear SJ, Rizzo M, Tiller M, Schoelles K, Hegmann K, Greenber M, … Anderson G. Diabetes and motor vehicle crashes: A systematic evidence-based review and meta-analysis. Proceedings of the Fourth International Driving Symposium on Human Factors in Driving Assessment, Training, and Vehicle Design, pp.343–350 (2007). [Google Scholar]
- (5).Cox DJ, Ford D, Gonder-Frederick L, Clarke W, Mazze R, Weinger K, & Ritterband L. Driving mishaps among individuals with type I diabetes. Diabetes Care, Vol.32, pp.2177–2180 (2009). [DOI] [PMC free article] [PubMed] [Google Scholar]
- (6).Skurtveit S, Strom H, Skrivarhaug T, Morland J, Bramness JG, & Engeland A. Road traffic accident risk in patients with diabetes mellitus receiving blood glucose-lowering drugs. Diabetic Medicine, Vol.26, pp.404–408 (2009). [DOI] [PubMed] [Google Scholar]
- (7).Rizzo M. Impaired driving from medical conditions: A 70-year-old man trying to decide if he should continue driving. Journal of the American Medical Association, Vol.305, No.10, pp.1018–1026 (2011). [DOI] [PMC free article] [PubMed] [Google Scholar]
- (8).Brands A, Biessels G, de Haan E, Kappelle L, & Kessels R. The effects of type 1 diabetes on cognitive performance. Diabetes Care, Vol.28, No.3, pp.726–735 (2005). [DOI] [PubMed] [Google Scholar]
- (9).Warren R. & Frier B. Hypoglycemia and cognitive function. Diabetes, Obesity and Metabolism, Vol.7, pp.493–503 (2005). [DOI] [PubMed] [Google Scholar]
- (10).Gerich J, Mokan M, Veneman T, Korytkowski M, & Mitrakou A. Hypoglycemia unawareness. Endocrine Reviews, Vol.12, No.4, pp.356–371 (1991). [DOI] [PubMed] [Google Scholar]
- (11).Graveling A, Deary I, & Frier B. Acute hypoglycemia impairs executive function in adults with and without type 1 diabetes. Diabetes Care, Vol.36, pp.3240–3246 (2013). [DOI] [PMC free article] [PubMed] [Google Scholar]
- (12).Klonoff D. Continuous glucose monitoring. Diabetes Care, Vol.28, No.5, pp.1231–1239 (2005). [DOI] [PubMed] [Google Scholar]
- (13).PMA P120005/S018: FDA Summary of safety and effectiveness data for Dexcom G4 PLATINUM continuous glucose monitoring system. Food and Drug Administration (2014). [Google Scholar]
- (14).Cryer PE Diverse causes of hypoglycemia-associated autonomic failure in diabetes. New England Journal of Medicine, Vol.350, pp.2272–2279 (2004). [DOI] [PubMed] [Google Scholar]
- (15).Aksan N, Schall M, Anderson S, Dawson J, Tippin J, & Rizzo M. Can intermittent video sampling capture individual differences in naturalistic driving? Proceedings of the Seventh International Driving Symposium on Human Factors in Driving Assessment, Training and Vehicle Design, pp.135–141 (2013). [DOI] [PMC free article] [PubMed] [Google Scholar]
- (16).McGehee DV, Raby M, Carney C, Lee JD, & Reyes ML Extending parental mentoring using an event-triggered video intervention in rural teen drivers. Journal of Safety Research, Vol.38, pp.215–227 (2007). [DOI] [PubMed] [Google Scholar]
- (17).Thompson KR, Johnson AM, Emerson JL, Dawson JD, Boer ER, & Rizzo M. Distracted driving in elderly and middle-aged drivers. Accident Analysis & Prevention, Vol.45, pp.711–717 (2012). [DOI] [PMC free article] [PubMed] [Google Scholar]


