

Abstract
Precise tongue control is necessary for drinking, eating and vocalizing1–3. However, because tongue movements are fast and difficult to resolve, neural control of lingual kinematics remains poorly understood. Here we combine kilohertz-frame-rate imaging and a deep-learning-based neural network to resolve 3D tongue kinematics in mice drinking from a water spout. Successful licks required corrective submovements that—similar to online corrections during primate reaches4–11—occurred after the tongue missed unseen, distant or displaced targets. Photoinhibition of anterolateral motor cortex impaired corrections, which resulted in hypometric licks that missed the spout. Neural activity in anterolateral motor cortex reflected upcoming, ongoing and past corrective submovements, as well as errors in predicted spout contact. Although less than a tenth of a second in duration, a single mouse lick exhibits the hallmarks of online motor control associated with a primate reach, including cortex-dependent corrections after misses.
Accurate goal-directed behaviour requires the constant monitoring and correction of ongoing movements. For example, when primates reach for an unseen, uncertain or displaced target, errors are estimated and compensated for in real time, which results in corrective submovements (CSMs) that redirect the hand to its target4–11.
Many animals—including humans and rodents—have prehensile tongues that reach out of the oral cavity to contact objects such as food, water and conspecifics1. Natural behaviours, such as licking, eating, grooming and speaking, require fast and accurate tongue movements1,2, but the mechanisms of lingual control remain poorly understood. Even in tractable model systems such as rodents, in which licking is used to study movement initiation, planning and decision-making, licks are usually measured as a binary register of whether or not a tongue contacts a spout or transects an infrared beam12–17, or with 2D tracking18,19. It remains unclear how a tongue reaches an unseen target such as a water spout.
Licks exhibit CSMs
To precisely resolve 3D tongue kinematics, we imaged the tongue at 1 kHz in two planes and trained two deep artificial neural networks20 to identify and segment the tongue from side and bottom views (Fig. 1a–c, Methods). Using hull reconstruction to build a 3D model of the tongue21, we estimated the tongue tip in each frame to achieve a millisecond-time-scale resolution of the lick trajectory (Fig. 1d, Extended Data Fig. 1, Supplementary Video 1, Methods). Mice were trained to withhold licking for at least 1 s to earn an auditory cue, and then to lick the spout within 1.3 s from the cue to earn a water reward (Fig. 1a, Methods). Cues caused bouts of licking, as previously observed in head-fixed mouse setups in which the spout could not be directly seen12,18 (Fig. 1b).
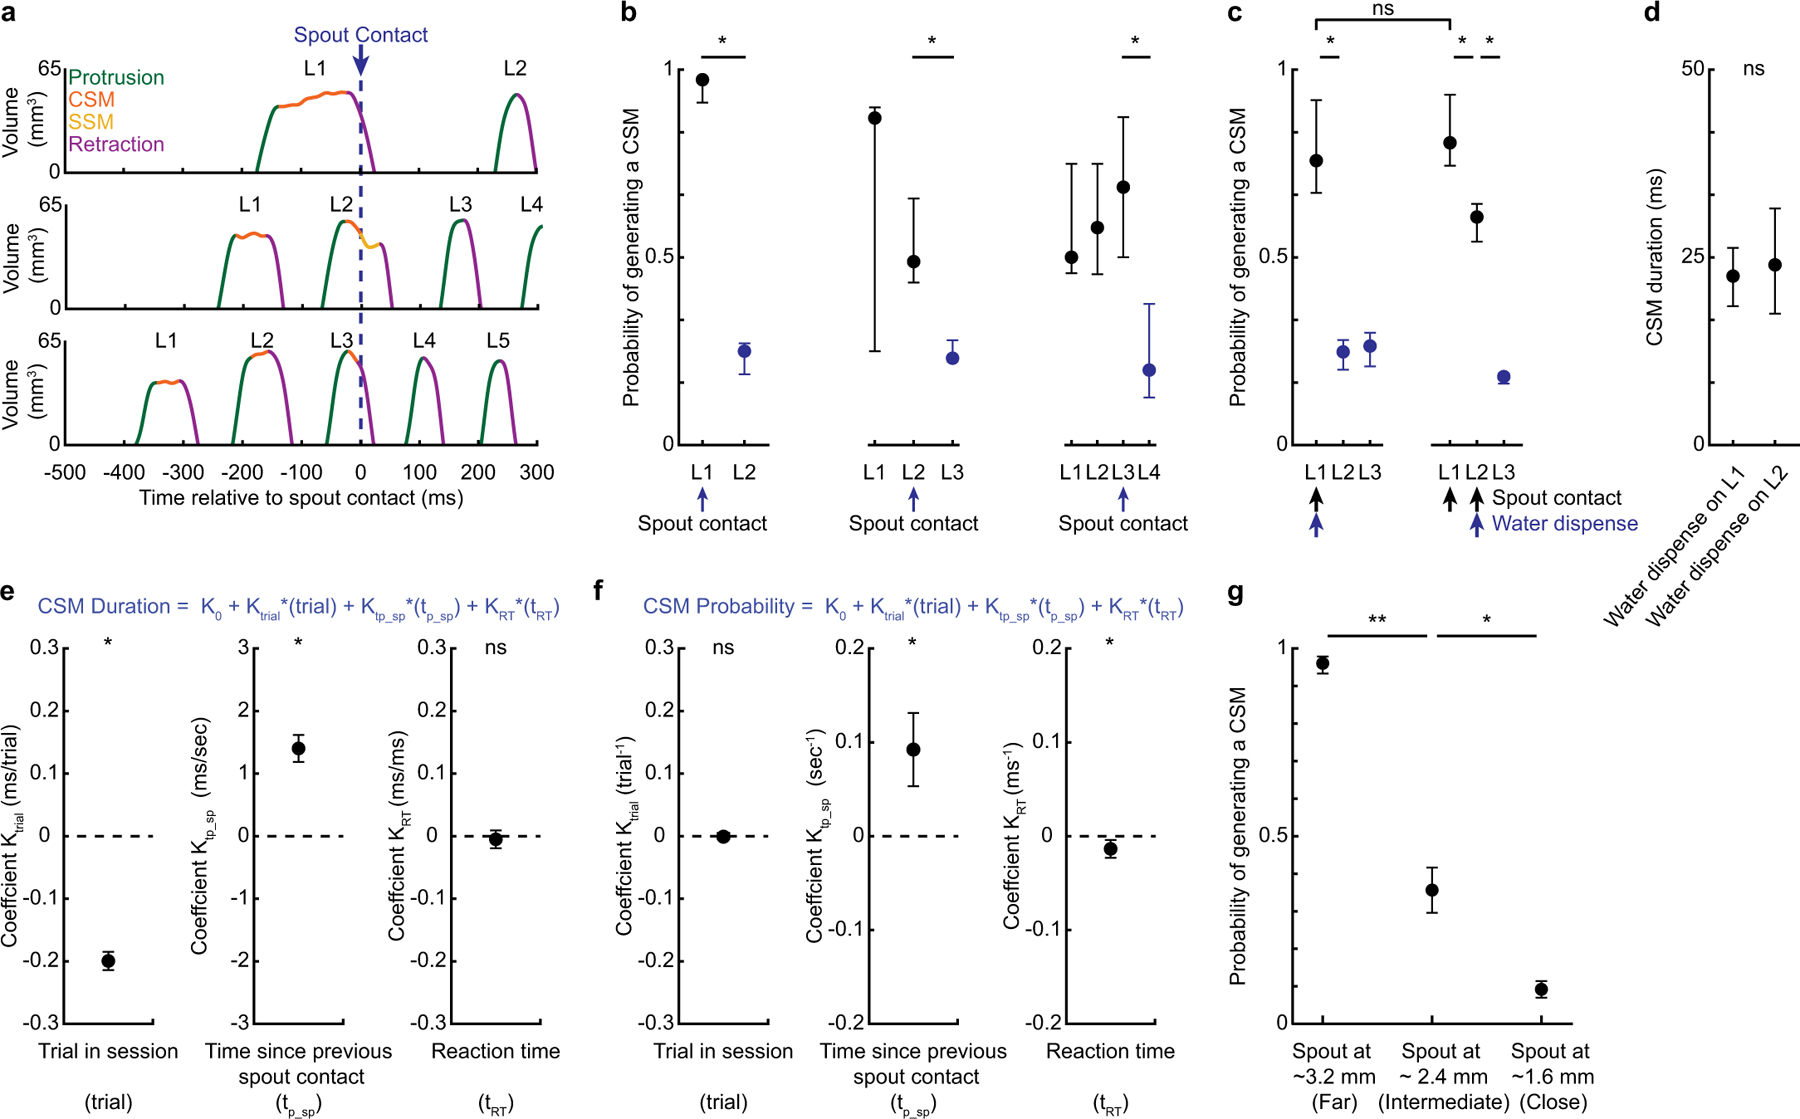
Fig. 1 |. CSMs within licks are important for spout contact.

a, Left, the tongue was filmed at 1-kHz frame rate from the side and bottom views. Right, spout contacts from a single trial above a spout contact raster from 400 trials in a session. b, Left, distributions of inter-spout contact intervals (top) and inter-lick protrusion intervals (bottom) for a single mouse. Right, median ± interquartile range (IQR) values across 17 mice. c, Example frames from side and bottom views across a single lick cycle. Each row shows the raw image above the image overlaid with the U-NET-labelled tongue mask. Scale bars, 2 mm. d, Tongue tip positions, computed from a 3D tongue model (Extended Data Fig. 1), were estimated in each frame (left), resulting in millisecond-timescale tracking of the tongue tip in two planes (right). AP, anterior–posterior; DV, dorsal–ventral; ML, medial–lateral. Scale bar, 1 mm; intervals between two blue circles, 1 ms. e, Three-dimensional trajectories (in mm) of a cue-evoked (left) and a water-retrieval (right) lick. Protrusion, CSM, spout submovement (SSM) and retraction phases of the lick are labelled in green, orange, yellow and purple, respectively; black crosses indicate moment of spout contact. f, Tip speed (top), tongue volume (middle) and absolute value of rate of tongue volume change (bottom) for the cue-evoked (left panels) and retrieval (right panels) licks shown in e. Protrusion offsets and retraction onsets were defined as the first and last minima in the rate of volume change (vertical dotted lines). The cue-evoked lick contained CSMs and SSMs between protrusion offset and retraction onset, whereas retrieval licks exhibited a single minimum in rate of volume change (marking the transition from protrusion to retraction).
We defined ‘cue-evoked licks’ as licks that initiated before the first spout contact and ‘water-retrieval licks’ as licks that initiated after the first tongue-spout contact in a bout17 (Fig. 1a, e, f). Water-retrieval licks exhibited highly stereotyped kinematics, and usually comprised a protrusion that was immediately followed by a retraction, with no fine-scale submovements in between (Fig. 1e, f, Extended Data Fig. 2, Supplementary Video 1, Table 1). By contrast, the first cue-evoked lick of each bout (which we designate L1) exhibited complex trajectories with longer durations, more acceleration peaks and more trial-to-trial variability (Fig. 1e, f, Extended Data Fig. 2, Supplementary Table 1). Close examination of cue-evoked lick trajectories revealed that the initial tongue protrusion almost never reached the spout (Extended Data Fig. 3g; the protrusion offset was defined as the first minimum in the rate of tongue volume expansion (Methods)). After the protrusion, the mouse initiated a series of fine-scale tongue submovements before retracting the tongue. The positions of the tongue tip at the moment of spout contact and at retraction onset were tightly clustered beneath the spout (Extended Data Fig. 3). These within-lick submovements, which were too fast to be seen in real time, were associated with fluctuations in tongue volume and tip speed that were clearly visible in slow motion (Supplementary Video 1). We defined the submovements that occurred before contact with the spout as CSMs and the submovements that occurred after spout contact and before retraction as ‘spout contact submovements’.
When primates reach for unseen or uncertain targets, CSMs that are initiated after an initial miss ensure end-point accuracy, and the number of distinct acceleration peaks in the reach trajectory is correlated with latency to target contact4,8. Similarly, the number of acceleration peaks per CSM strongly predicted cue-to-spout contact latencies (Extended Data Fig. 3h, i).
To test whether CSMs were aimed or were simply random or noisy ‘wiggles’ of the tongue, we studied their kinematics in sessions in which spouts were fixed at left or right positions (Methods). Both protrusions and CSMs were directionally biased towards the remembered spout locations (Extended Data Figs. 4, 5, Supplementary Tables 2, 3). Together these data show that previously unresolved tongue movements within a lick are controlled and are important for spout contact.
We next wondered why cue-evoked licks contained prominent CSMs. In primate reaching, uncertainty in target location contributes to errors and CSMs; a major source of uncertainty is the amount of time elapsed since the target was seen, as in memory-guided reach tasks22–25. As the spout was unseen in our task, each moment of tongue-spout contact could analogously clarify its precise position in space5,6,25. This idea makes two specific predictions. First, the initial spout contact in a bout should reduce the need for CSMs on the immediately ensuing licks. Second, long periods of time without spout contact (for example, during inter-trial intervals) should increase the need for CSMs on the first lick of a subsequent trial. To test the first prediction, we examined occasional trials in which the first one or two licks entirely missed the spout, which enabled us to investigate how the first contact in a bout affects the next lick. All licks that preceded the first contact exhibited pronounced CSMs, whereas licks that followed the first contact did not—independent of which lick in a bout made first contact (Extended Data Fig. 6a, b, Supplementary Video 2). Thus, the first spout contact in a bout reduced the need for CSMs on ensuing licks. To test the second prediction, we investigated whether the accumulation of target uncertainty over the inter-trial interval contributed to CSMs. Consistent with this idea, both the probability and duration of CSMs on the first lick in a bout were significantly correlated with the time since the last spout contact (Extended Data Fig. 6e, f, Supplementary Table 5, Methods). Finally, because water-tongue contact in decerebrate rodents can induce rhythmic licking26, we sought to disambiguate how spout versus water contact affects subsequent lick kinematics. To address this, in some sessions we dispensed water on the second (and not the first) spout contact of a bout and observed that spout contact alone reduced CSM probability in ensuing licks (Extended Data Fig. 6c, d). Finally, CSMs depended on target distance, as has also previously been observed in primate reach tasks7. Cue-evoked licks to more distant spouts required more CSMs (Extended Data Fig. 6g). Altogether, these data suggest that CSMs are prominent when the target location is uncertain, and that the first spout contact in a bout reduces target uncertainty in a way that updates the plan of the next lick. Notably, any update to the motor plan of an ensuing lick must occur in the approximately 0.1-s interval between the first spout contact and the ensuing protrusion onset (latency between spout contact and subsequent protrusion of 94.5 ms (interquartile range (IQR) of 87.5–109.5), n = 17 mice).
Anterolateral motor cortex inactivation impairs CSMs
To test cortical roles in lingual kinematics, we used Vgat-ChR2-EYFP mice to photoinhibit anterolateral motor cortex (ALM) or posterior medial motor cortex (PMM), which are two non-overlapping regions that have functional projections to brainstem lingual circuits12,27,28 (Fig. 2a, Extended Data Fig. 7, Methods). Photoinhibition was initiated at randomly interleaved cue onsets and lasted 750 ms. Inhibition of ALM, but not PMM, impaired spout contact (Fig. 2b, Extended Data Fig. 8a–c, Supplementary Tables 7, 8), consistent with previous studies13,19,29.
Fig. 2 |. ALM inactivation impairs CSMs.

a, ALM or PMM was bilaterally photoinactivated in 15% of randomly interleaved trials. b, Cumulative probability of tongue–spout contact during control and ALM-inactivated trials. PMM inactivation had no effect (Extended Data Fig. 8). Right, probability of spout contact within a trial (n = 20 mice). c, Left, data plotted as in b for protrusions. d, Left, protrusion probability during ALM inactivation as a function of reaction time (RT) on ALM-intact trials (n = 20 mice). P = e(a × (RT – b)); a = −0.027; b = 82. Right, latency from cue onset to tongue protrusion onset in control (black) and ALM-inactivated (blue) trials (n = 20 animals). e, Six complete tongue tip trajectories from side and bottom views during cue-evoked licks on control trials. A single lick is shown in bold for visibility. f, Protrusion (green), CSM (orange), SSM (yellow) and retraction (purple) phases of the trajectories from e are separately plotted. g, Three-dimensional trajectory of the bold lick shown in e, f, with lick phases colour-coded as in f. The ‘x’ symbol denotes spout contact. h–j, Data plotted as in e–g, for cue-evoked licks on ALM-inactivated trials. The ‘x’ symbols in i denote the absence of CSMs and/or SSMs. k, Tip-speed profiles for the licks from e, h. l–p, Effect of ALM photoinactivation on L1 spout contact (l), L1 CSMs (m), and the duration (n), peak speed (o) and path length (p) of distinct lick phases on L1s. Data in m–p are from trials in which L1 protrusions existed during control (black) and ALM-inactivated (blue) trials with a minimum of 10 data points for each lick phase (n = 12 mice). Data in b, d, l–p are median ± IQR. *P < 0.05, **P < 0.01, ***P < 0.001, two-sided paired Wilcoxon signed-rank test; NS, not significant. All data are from sessions with the spout at 3.2 mm. Exact statistics are provided in Supplementary Table 7. Scale bars, 1 mm (e, h).
We analysed tongue kinematics on ALM-inactivated trials to examine why spout contact was impaired. ALM inactivation reduced the probability of tongue protrusion in a way that was strongly associated with reaction time. Mice with shorter reaction times exhibited substantially smaller impairments in protrusion during ALM photoinhibition (Fig. 2c, d). Cue-evoked licks produced during ALM inactivation were still significantly less likely to make spout contact (Fig. 2b, c, l, Supplementary Table 7, Supplementary Video 3), which shows that impaired initiation of licks did not fully explain the deficits in spout contact associated with ALM inactivation.
We considered why cue-evoked licks during ALM inactivation did not make spout contact even on trials in which protrusion occurred. During ALM photoinhibition, cued licks exhibited significantly shorter durations, reduced speeds, reduced path lengths and fewer acceleration peaks (Fig. 2e–p, Extended Data Fig. 8d, e, Supplementary Table 7). Licks that were initiated during ALM photoinhibition were also more stereotyped, which we quantified as a significant reduction in the entropy of lick kinematics (Methods, Supplementary Table 7). Critically, in ALM-inactivated trials, mice usually did not produce CSMs and instead immediately retracted the tongue after missed protrusions (Fig. 2m). In the rare cases in which spout contact occurred during ALM photoinhibition, subsequent water-retrieval licks occurred despite ongoing ALM inactivation (Extended Data Fig. 8f–h, Supplementary Table 9). Thus, when ALM was inactivated, cued licks lacked the CSMs that facilitate spout contact. Within-reach CSMs in primates also rely on cortical activity30,31.
The sparing of tongue protrusions during ALM inactivation led us to hypothesize that protrusions aimed to left or right spouts may not depend on ALM, and that ALM inactivation would have a minor effect on performance at very-near spout locations, where CSMs are less important for contact. Experiments confirmed these predictions (Extended Data Figs. 3, 8i–k, Supplementary Videos 4, 5). These data suggest ALM activity is not always important for cued lick initiation or aiming, but is important when corrections are necessary.
Correction-associated activity in ALM
We next recorded ALM activity in sessions with an intermediate spout distance (Fig. 3, Extended Data Fig. 6g) and compared the discharge of single neurons in trials that lacked or contained CSMs on L1 (325 neurons, 19 sessions and 4 mice). Many ALM neurons exhibited neural correlates of upcoming CSMs before licks were initiated, and even before cues (38 out of 325 neurons before the cue, and 45 out of 325 neurons after the cue and before protrusion) (Fig. 3a, Methods, Supplementary Table 11). Such preparatory activity may reflect the relationship between CSM generation and target uncertainty associated with the inter-trial interval (Extended Data Fig. 6e, f). ALM activity also reflected ongoing and past CSMs, which suggests additional roles in CSM execution and monitoring (67 out of 325 neurons) (Fig. 3a, Supplementary Table 11). We quantified the strength of these correlations and determined that CSM-containing licks could be classified on the basis of single-neuronal activity from single trials (Methods, Supplementary Table 11).
Fig. 3 |. ALM activity reflects upcoming, ongoing and past CSMs.

a, Spike rasters (top row) and corresponding rate histograms (second row) for three example ALM neurons. Red and blue ticks, go cue and spout contact, respectively; grey and orange shading, licks and CSMs, respectively. The bracket above each raster indicates the window that was assessed for significant differences in rate histograms between trials with (orange) and without (black) CSMs on L1. Shading represents the bootstrapped s.e.m. across trials (Methods). Third row, CSM selectivity, defined as the normalized difference in firing rate from trials with and without CSMs on L1. Shading represents the bootstrapped IQR for selectivity (Methods). Maximum-likelihood-based single-trial classification accuracy for each example neuron is reported in the inset (Methods). Bottom row, ALM-population CSM selectivity for neurons with CSM selectivity before the cue (left), before L1 (middle) and after L1 (right). Only neurons with significant selectivity are shown (n = 38 out of 325 for pre-cue; n = 45 out of 325 for pre-L1 and n = 67 out of 325 for post-L1). Because each neuron was normalized to its own peak selectivity in the entire trial, the peak selectivity might not lie in the window of interest. b, Pulses of photoinhibition of 150-ms duration were applied 50 ms before the median time of L1 onset on randomly interleaved trials. c, Tongue volume profiles for a control bout and a bout with pulsed photoinhibition during L1 (blue line at L1 indicates laser on), resulting in a hypometric L1 that missed the spout. Scale bar, 10 mm3. d–h, Effect of pulsed photoinhibition during L1 on L1 spout contact (d), L1 CSM generation (e), and duration (f), speed (g) and path length (h) of L1 lick phases. Data are median ± IQR. *P < 0.05, **P < 0.01, ***P < 0.001, two-sided paired Wilcoxon signed-rank test; n = 12 mice. Exact statistics are provided in Supplementary Table 12.
To test when ALM activity mattered for the initiation and control of CSMs, we briefly photoinhibited ALM for 150 ms, starting 50 ms before the median time of the onset of the L1 protrusion (Methods). By design, this intervention left activity in the interval between the cue and protrusion onset intact and specifically disrupted activity during L1 and CSM execution (Fig. 3b, c). The L1s produced during pulsed inhibition exhibited hypometric protrusions that were sometimes followed by CSMs that usually missed the spout (Fig. 3d–h, Supplementary Table 12, Supplementary Video 6). Together with the inactivation experiments in Fig. 2, these results suggest a role of ALM activity in ongoing licks but also show that protrusions and CSMs can be initiated during ALM inactivation, provided that ALM activity is intact in the interval between the cue and protrusion onset. Thus, under some conditions, circuits outside ALM can produce CSMs, but ALM activity is still necessary for these CSMs to reliably contact the spout.
ALM-guided contact with displaced spouts
In reach tasks in primates, CSMs occur in conditions in which the animal can predict the need for corrections in advance—such as when a target is uncertain, unseen or far away4–8—and also in conditions in which the requirement for CSMs arises on-the-fly, such as in ‘double-step’ experiments when a target unexpectedly jumps mid-reach9–11,30,32–36. To clarify the roles of the cortex in planning versus executing corrections online, we adapted the double-step paradigm to a lick task. Notably, in contrast to primate experiments in which animals use visual feedback to detect and correct for target displacement during reaching, our task required corrections to be driven by the absence of a predicted mechanosensory event (the tongue–spout contact). To do this, we detected the offset of tongue–spout contact on L1 in real time and rapidly retracted the spout so that by the onset of the second lick (L2) the spout was at least 1 mm farther away18,19 (Methods). This task tests whether mice can implement both within-lick and across-lick corrections. First, to make L2 contact, the tongue might detect a miss and immediately extend substantially farther than usual. To make contact on the third lick (L3), the mouse might use the information about L2 outcome to increase the path length of L3. Finally, following spout misses, mice may prematurely terminate the lick bout. With ALM intact, mice exhibited high rates of contact and produced all types of online correction (Fig. 4, Supplementary Tables 13, 14, Supplementary Video 7). Both L2s and L3s on double-step trials exhibited increased durations, path lengths and CSMs (Fig. 4f–i). Importantly, on double-step trials CSMs were initiated, on average, 17 ms after the predicted spout contact would have occurred (median CSM onset relative to L2 protrusion onset on double step of 32 ms (IQR of 26–37); median L2 spout-contact time relative to L2 protrusion onset on control of 15 ms (IQR of 11–21)), providing an estimate of duration of the sensorimotor feedback loop that subserves within-lick corrections. Mice also produced fewer licks per bout on double-step trials (Fig. 4j). Mice thus produced within- and across-lick adjustments by modifying lick amplitudes to reach farther towards an unexpectedly displaced spout, by producing CSMs and by prematurely terminating bouts.
Fig. 4 |. ALM activity is necessary for online corrections and is associated with double-step performance.

a, Top, still frames from time steps 1 to 5 (t1–t5) of a double-step trial. Spout contacts (middle) and tongue volumes (bottom) from double-step trials with ALM intact (left) or inactivated (right). Note the timing of still frames t1–t5 between cue and L2 onset. Scale bar, 2 mm. b–d, L2 (left panels) and L3 (right panels) tongue tip trajectories during control (b) (no double-step and no photoinhibition) and double-step trials with ALM intact (c) or inactivated (d). Scale bar, 1 mm. e, Tongue tip speed profiles from c, d (black, control; blue, ALM inactivated). f–j, Effect of double step and ALM inactivation on L2 and L3 spout contact (f), CSM probability (g), lick duration (h), lick path length (i) and number of licks per bout ( j). *P < 0.05; **P < 0.01 for a two-sided paired Wilcoxon signed rank test; n = 7 mice. AU, arbitrary units. k, Top, three principal components (PCs) of ALM population activity during control and double-step trials. Bottom, the Euclidean distance in population firing rate between control and double-step trials. Blue and yellow are bootstrapped median ± IQR of spout contact and neural activity divergence, respectively. l, Example tongue volumes, rasters, rate histogram and double-step selectivity for two example ALM neurons suppressed (left) or activated (right) by double step. Scale bar, 10 mm3. Bottom, population selectivity for neurons significantly activated (143 out of 465) or suppressed (110 out of 465) by double step (Methods). m–p, Example neurons selective for premature bout termination following L2 (n = 107 out of 349 neurons) (m), L2 spout misses resulting in bout continuation (n = 83 out of 448 neurons) (n), CSMs on L2 misses (n = 14 out of 103 neurons) (o) and spout location on L2 contacts (n = 50 out of 419 neurons) (p). Histograms are bootstrapped mean ± s.e.m. Exact statistics are in Supplementary Tables 13, 14.
To test the necessity of ALM activity in these corrections, we photoinhibited ALM for 750 ms immediately after L1 spout-contact offset on a randomly interleaved subset of double-step trials (Methods). ALM inactivation impaired all types of online corrections, impairing L2 and L3 contact and significantly reducing L2 and L3 durations, path lengths and CSMs (Fig. 4e–i, Supplementary Tables 13, 14, Supplementary Video 8). ALM photoinhibition also significantly prolonged lick bouts—as if the mouse did not even detect spout misses (Fig. 4j, Supplementary Tables 13, 14).
ALM activity in double-step experiments
Photoinhibition of ALM impaired on-the-fly corrections produced both within and across licks. To test whether ALM exhibits signals associated with spout misses and/or corrections, we recorded ALM activity in double-step sessions (n = 465 neurons, n = 28 sessions and n = 4 mice). Many neurons discharged significantly differently in control versus double-step conditions, and differences could be detected on single trials (184 out of 465 neurons) (Fig. 4l, Supplementary Table 15, Methods). Principal component analysis placed an upper bound on when population activity on double-step trials diverged from control trials, and revealed significant divergence within L2 (time of activity divergence of 60 ± 10 ms after onset of L2 protrusion, and duration of L2 on double-step trials of 66 ms (IQR of 57–81)) (Fig. 4k).
A closer examination of single-neuronal discharge revealed several signals that are important for double-step performance. First, if ALM participates in detecting spout misses, then some neurons should discharge differently in licks that contain or lack contact. Indeed, many neurons exhibited activity associated with spout misses that were followed by premature bout terminations19 (137 out of 349 neurons) (Fig. 4m) as well as spout misses that were followed by subsequent licks (84 out of 448 neurons) (Fig. 4n). Second, if ALM has a role in within-lick corrections, then some neurons should exhibit discharge that is specifically associated with CSMs. To focus on this, we examined double-step trials in which the L2 missed and CSMs either existed or not, and observed neurons that discharged differently on the licks that contained or lacked CSMs (10 out of 103 neurons) (Fig. 4o). Third, if ALM participates in updating a plan for L3 after the outcome of L2, then ALM should contain information about whether the spout was contacted near (on control trials) or far (on double-step trials). To investigate whether ALM exhibits neural correlates of spout location on L2, we compared trials in which contact occurred near or far, and found that—in 50 out of 419 neurons—tongue–spout contact at far locations resulted in significantly different discharge than tongue–spout contact at near locations, even though both contacts were identically rewarded (Fig. 4p). The existence of this spout-position-dependent discharge during L2 suggests that ALM can integrate the mechanosensory event of contact with proprioceptive information about tongue posture at the moment of contact. To our knowledge, it remains unknown whether the motor cortex in any other species exhibits such position-at-contact signals that are unrelated to reward or visual feedback, but such signals are probably important for mechanosensory-driven corrections37. Finally, similar error and correction-related activities were observed on L3 (Extended Data Fig. 9). Together, these data show that ALM contains signals that are important for double-step performance, including the detection of spout misses, the production of CSMs and bout termination after misses, and the location of the spout estimated at moment of contact.
Discussion
High-speed videography has revealed aspects of tongue control in bats, hummingbirds, chameleons, cats and bees38–42. Here we discovered that licking in mice cannot be explained by brainstem central-pattern generators relying on cortical ‘go’ signals and subsequently functioning in an open loop12,43. Instead, licks exhibit complex trajectories with hallmarks of online motor control that have previously been observed in reach tasks, including motor-cortex-dependent CSMs that facilitate target contact (Supplementary Discussion).
Comparative approaches distinguish general principles from behaviour-, effector- and species-specific solutions to motor control problems. Our discovery that the mouse tongue (a muscular hydrostat with no joints) and the primate limb adhere to common control principles suggests canonical roles of the cortex in error corrections that are important for the accuracy of ongoing movements, including the lingual trajectories that are important for coherent speech2.
Methods
Mice and surgery
All experiments were carried out in accordance with NIH guidelines and were approved by the Cornell Institutional Animal Care and Use Committee. Twenty-six Vgat-ChR2-EYFP ( Jackson Laboratory, JAX stock no. 014548) and four C57/B6J ( Jackson laboratory, JAX stock no. 000664) male mice of over 16 weeks of age were individually housed under a 12-h light/dark cycle for the duration of the study, and were tested during the dark phase. On days on which mice were not being trained or tested, mice received 1 ml of water. Mice were trained and tested in experimental sessions that lasted 0.5 h to 1 h. If the mice did not receive at least 1 ml of water during the behavioural session, their water was supplemented to meet the 1 ml per day requirement.
Mice were deeply anaesthetized with isoflurane (5%). Fur was trimmed, and mice were placed in a stereotaxic frame (Kopf Instruments). A heating pad was used to prevent hypothermia. Isoflurane was delivered at 1–3% throughout surgery; this level was adjusted to maintain a constant surgical plane. Ophthalmic ointment was used to protect the eyes. Buprenorphine (0.05 mg kg−1, subcutaneous) was given before the start of surgery. A mixture of 0.5% lidocaine and 0.25% bupivacaine (100 μl) was injected subdermally along the incision line. The scalp was disinfected with betadine and alcohol. The scalp was then removed with surgical scissors to expose the skull, which was thoroughly cleaned.
For optogenetic experiments, four craniotomies were made over ALM (2.5 AP ± 1.5 ML) and PMM (0.5 AP ± 1.5 ML). A 400-μm optical fibre embedded in a 1.25-mm metal ferrule (Thorlabs) was then implanted bilaterally above these areas and held in place with a layer of Metabond (Parkell). Mice were then implanted with a custom-modified RIVETS headplate for head restraint during the behavioural sessions. Another layer of Metabond was applied to firmly hold the implants in place, and the surrounding skin was sutured.
For acute electrophysiology experiments, a craniotomy was made over visual cortex (−3.5 AP ± 3 ML), along with two fiducials that were made bilaterally over ALM and marked with black ink. A ground screw (W.W. Grainger) soldered to a gold pin (A-M Systems) was then screwed into the craniotomy and a headplate was secured to the skull. The skull was then covered with a thin layer of clear Metabond. Post-operative enrofloxacin (5 mg kg−1), carprofen (5 mg kg−1) and lactated ringers (500 μl) were administered subcutaneously.
Behaviour
To simultaneously image two orthogonal views of the orofacial movements of the mouse, we placed a mirror (Thorlabs ME1S-P01 1′′) angled at 45° below the mouth of the mouse. We used a Phantom VEO 410L camera with a Nikon 105-mm f/2.8D AF Micro-Nikkor lens to acquire videos with a resolution of 192 × 400 pixels at 1,000 fps. Custom Lab-VIEW code for behavioural training was run on a training system built using a National Instruments sbRIO-9636 FPGA. Details regarding the behavioural rig, including parts list, diagrams and instructions, can be found a https://github.com/GoldbergLab/Bollu-Ito-et-al-2020. In brief, behaviour rigs consisted of custom 3D-printed clamps that were used for head fixation, an audio system for generating cues (Med Associates) and a blue LED that served as a masking light for optogenetics. A 0.072-inch stainless steel lick port was used to record spout contacts using a capacitive sensor (Atmel) and deliver water rewards via a sole-noid valve (The Lee Company). We used a custom circuit ( Janelia Farms, HHMI), which measures the metal-to-water junction potential caused by the tongue contacting a metal lick port to detect spout contact onsets in place of the capacitive lick sensors during electrophysiology experiments to reduce noise44. For double-step experiments, lick ports were mounted on a carriage on a guide rail (McMaster-Carr) and attached to a servomotor (Faulhaber) which was used to retract the spout by a pre-calibrated distance (1 mm or 4 mm) at L1 spout-contact offset.
Behavioural training
Five days after surgery and post-operative recovery, mice were started on water restriction. Mice were restricted to 1 ml of water per day and their body weight was recorded daily. The behavioural training began after mice reached a steady state of body mass of 80% their original body weight with water restriction. Mice typically reached the steady state body weight in 5–6 days. In the first behavioural sessions, mice were head-restrained and water (3 μl per dispense) was delivered paired with an auditory cue (3.5 kHz). The spout was placed directly ahead of the mouse, approximately 1.6 mm from the incisors of the mouse. The auditory cues had an inter-trial interval with an exponential distribution, which provided a flat hazard rate such that the probability of a cue was not altered over the duration of the trial. After the mice learned to reliably lick the spout following the auditory cue, we imposed a 1-s no-spout-contact window before the onset of the auditory cue. If the mouse made spout contact within this window, the inter-trial interval was extended by an interval randomly drawn from the exponential distribution. This discouraged the mice from spontaneously licking the spout and ensured that the licking we observed was only in response to the auditory cue. Water delivery in subsequent sessions was made contingent on spout contact within 1.3 s of the auditory cue. Mice were considered to have reached criterion once performance reached >95% in the task and the proportion of trials with premature licking was less than around 10%, with little (if any) licking during the inter-trial interval. Once trained with the spout at 1.6 mm, photoinhibition experiments were completed if required (Extended Data Fig. 10), and the spout was moved back to 3.2 mm from the incisors of the mouse. Mice were trained with the spout at 3.2 mm for 1 or 2 sessions, then inactivation experiments were performed either at cue-onset or 50 ms before the median time of L1 protrusion onset calculated from the previous session. The spout was then placed approximately 60° from midline to the left or right of the mouse (counter-balanced) at a distance of 3.2 mm. Mice were trained in this first direction for several weeks (typically 14 days) before inactivation experiments were performed. This procedure was repeated for the remaining direction.
Photoinhibition
We used laser diode light sources (LDFLS_450–450, Doric Life Sciences), attached to an optical rotary joint (FRJ_1×2i_FC-2FC_0.22, Doric Life Sciences) and delivered light to the implanted cannulas using 400-μm, 0.43-NA lightly armoured metal-jacket patch cords. The light sources were set to analogue input mode and driven with a square (10 mW) or sinusoidal pulse (40 Hz and 10 mW peak). For inactivation performed at cue onset, the duration of inactivation was 750 ms with a 100-ms ramp-down. For inactivation performed at L1 protrusion onset, we imaged the tongue as mice were performing the task one day before inactivation. We then calculated the median L1 protrusion onset time individually for each mouse, and inactivated ALM for 150 ms with a 100-ms linear ramp-down starting at 50 ms before the median L1 protrusion time. For double-step experiments, inactivation (750-ms duration with a 100-ms ramp down) was initiated at the moment of L1 spout contact offset detected in real time.
Electrophysiology
Extracellular recordings were made acutely using 64-channel silicon probes (ASSY-77 H2, Cambridge Neurotech). The 64-channel voltage signals were amplified, filtered and digitized (16 bit) on a headstage (Intan Technologies), recorded on a 512-channel Intan RHD2000 recording controller (sampled at 20 kHz), and stored for offline analysis. At 12–24 h before recording, a small (1.5-mm diameter) craniotomy was made unilaterally over ALM centred on the fiducial. The probes were targeted stereotaxically to ALM, lowered to a depth of 1,000–1,100 μm. Recording depth from the pial surface was inferred from micromanipulator readings. To minimize brain movement, 1.8% low-melt agarose (A9793–50G, Sigma Aldrich) in 1× phosphate-buffered saline (Corning) was pipetted in the craniotomy following probe insertion. Three to seven recordings were made from each craniotomy. After each recording session, the craniotomy was filled with silicone gel (Kwik-Cast, World Precision Instruments). Carprofen (0.05 mg kg−1) was given daily to reduce inflammation.
Artificial deep neural network for segmentation
We used an implementation of a semantic segmentation neural network (U-NET) to identify and segment the tongues from high-speed videography (Extended Data Fig. 1a, b). The network was implemented in Keras with a tensorflow 1.12.0 backend. U-NET uses a contracting path that is thought to identify context (that is, ‘is the tongue present in this image?’) and a symmetric expanding path that precisely localizes the relevant object (that is, ‘where is the tongue present in the image?’).
U-NET architecture.
The contracting path of the network was constructed as a series of five repeating modules. Each module was an application of two 3 × 3 convolutions, with each convolution followed by a ReLU and 2 × 2 maximum pooling operation with stride 2 for down-sampling. At each down-sampling, the number of feature channels was doubled. The number of channels for the first module was 2 (and thus for the remaining modules 4, 8, 16 and 32 channels). A dropout of 0.7 was added at the output of module 4 and 5. The expanding path of the network was symmetric to the contracting path, with four repeating modules. Each module had: first, a 3 × 3 convolution with half the number of channels from the previous module. Second, an up-sampling step that doubled the frame size. Third, a concatenation step that merged the output of the current module with that of the symmetric module from the contracting path. And finally, two 3 × 3 convolutions, with each convolution followed by a ReLU. The last layer of the network was a 1 × 1 convolution layer that followed the last layer of the expanding path. This network had a sigmoid activation function and gave the probability of an individual pixel being a part of the tongue.
Network training.
The network was trained on 3,668 frames pseudo randomly selected from a dataset of 25,258,017 frames from 12 mice across all their sessions. The training set was balanced such that half of the 3,668 frames contained visible portions of the tongue. The frames were then manually annotated with both the side view and the bottom view using a custom GUI. Separate networks were trained for the side and bottom views. The networks were trained with a batch size of 256 images, using the ‘adam’ optimizer and a binary cross entropy loss function. The networks were trained until the loss function reached an asymptotic value of 0.0047 for the side-view network and 0.0023 for the bottom-view network, with a validation accuracy of 0.9979 and 0.9991, respectively. Both networks reached asymptotic performance within 4,000 epochs. To find the ideal architecture, we performed hyperparameter optimization with the scale of the network and the dropout rate as the two axes. We found that there was no statistical difference in the binary cross entropy loss between the largest (first bank = 256 layers) and the smallest (first bank = 2 layers) networks we tested. There was also no statistical difference in the loss for the dropout rates we adopted. For our purpose, we chose the networks with the least loss that consistently converged.
Extracting 3D tongue kinematics
To obtain the full 3D kinematics of the tongue tip during a lick bout, we performed a visual hull reconstruction using two orthogonal views (bottom and right side) of the tongue filmed using high-speed videography. This hull reconstruction procedure is contingent upon crisp 2D silhouettes of the tongue from both the bottom and side views, which were obtained by U-NET segmentation. We next constructed a 3D voxel representation of the tongue by identifying voxels that map onto the tongue silhouette when projected back into the 2D image space. Intuitively, this can be thought of as placing the bottom and side view images on adjacent faces of a cube, projecting the silhouettes in towards the centre of the cube, and identifying the 3D intersection of these projections (Extended Data Fig. 1c). For trials in which the side view of the tongue tip is occluded by the lick spout, we estimate the shape of the occluded tongue region by fitting a cubic spline to the boundary of the side silhouette and extrapolating the boundary spline into the occluded region.
We obtained 3D coordinates of the tongue centroid, and then defined the tongue tip as the position on the tongue that is farthest from the centroid in the direction of the lick, which we located using a two-step search process (Extended Data Fig. 1d). In the first step, we defined an initial search vector, which points forward (anterior) and down (ventral) from the tongue centroid. This initial search vector was used across all videos. Using this initial search vector, we identified voxels in the tongue hull that satisfied the search criteria of (1) the vector connecting the voxel to the centroid made an angle of less than 45° with the initial search vector and (2) the distance from the centroid to the voxel was ≥75% of all voxel-to-centroid distances. We took the collection of voxels that satisfy these criteria (which we called candidate voxels), and calculated their mean location. The unit vector between the tongue centroid and the mean location of the candidate voxels was then used as the search vector for the second step of the search process, as it pointed in the rough direction of tongue tip. The second step of the search process followed a similar pattern to refine the search. Using the refined search vector from step one, we performed a search for voxels that were (1) within a given angular range (15°) of the search vector and (2) were located on the boundary of the tongue hull. The average location of this second set of candidate voxels was defined to be the tongue tip (Extended Data Fig. 1e). The resultant 3D kinematics for the tongue tip were filtered using an 8-pole, 50-Hz low-pass filter. We confirmed key findings of our paper, including the presence of CSMs on cue-evoked licks and their reduction during retrieval licks or ALM inactivation, with a different tracking method using the centroid of the 3D hull reconstruction (Extended Data Fig. 10).
Trajectory analysis
Tongue volume was determined from the convex hull reconstruction from the segmented images (as described in ‘Extracting 3D tongue kinematics’). Tongue tip trajectories were segmented into three distinct phases on the basis of the rate of volume change of the tongue. The protrusion phase was defined as the time from when the tongue was detected up to the first minimum in the rate of volume expansion of the tongue. The retraction phase was defined as the time from the last minima of the rate of volume expansion of the tongue until the tongue was back in the mouth of the mouse. We further defined the movements before spout contact and after protrusion as CSMs and the submovement after spout contact and before retraction as SSMs.
Instantaneous speed was calculated as a one-sample difference of the position vector and path length was calculated as the cumulative sum of the one-sample difference of the position vector over the entire trajectory. Acceleration was calculated as the one-sample difference of the instantaneous speed. Peaks were identified using the findpeaks function in MATLAB. Lateral displacement was defined as the distance of the tip position from the midline of the mouse. The midline of the mouse was defined as the line that passes through the point equidistant between the nostrils of the mouse and the midpoint of the incisors of the mouse. Entropy for the kinematic parameters was calculated as −ΣPi * log(Pi), in which Pi is the probability of the kinematic parameter being in bin i. We used bin sizes of 5 ms, 100 μm and 5 mm s−1 for durations, path lengths and peak speeds, respectively.
Direction bias was estimated as the dot product of the initial CSM direction vector and either the target direction vector or the simulated off-target direction vector. The CSM direction vector was defined as the direction vector from the location of the tongue tip at the onset of the CSM to the location of the tongue tip at the first speed minimum. The target direction vector was defined as the direction vector from the location of the tongue tip at the onset of the CSM to the median location of the tongue tip at retraction onset in that session. Similarly, the simulated off-target direction vector was defined as the direction vector from the location of the tongue tip at the onset of the CSM to the simulated target locations in that session.
Because targets were changed across sessions and not within sessions, and not all mice were trained in all directions, the simulated off-target locations were defined as follows. For the left sessions, the centre or straight simulated target had the same AP location and was on the midline. The right simulated target had the same AP location as the target, and symmetrical ML location from the midline. For example, if the left target was at +4 mm AP and +1.2 mm ML, the right simulated target would be at +4 mm AP and −1.2 mm ML and the centre straight target would be at +4 mm AP and 0 ML. The right sessions were symmetrical to the left sessions. For the centre sessions, both the right and left simulated targets had the same AP location, and ML was ± 1.2 mm.
Electrophysiology analysis
Extracellular voltage traces were first notch-filtered at 60 Hz. The data were then spike-sorted automatically with Kilosort2 (https://github.com/cortex-lab/Kilosort), and curated manually with Phy2 (https://github.com/cortex-lab/phy). During manual curation, units containing low-amplitude spikes and/or non-physiological or inconsistent waveform shape were discarded and not included in further analyses. Neurons with fewer than 10 trials in any of the conditions tested were excluded for all analyses performed below.
To determine whether the firing rate of a neuron was significantly correlated to L1 CSMs (Fig. 3), we assessed the difference in firing rate between L1 CSM-containing and L1 CSM-lacking trials in three epochs: before the cue onset, before the onset of the lick protrusion and after the onset of lick protrusion. To identify pre-cue L1 CSM-responsive neurons, we aligned the recordings to cue onset and assessed significance in spike counts across the trial types in the time period from 500 ms before cue onset to cue onset (Wilcoxon rank-sum test, P < 0.05). To identify peri-L1 CSM-responsive neurons, we aligned the data to L1 protrusion onset and assessed significance −100 ms to 0 ms relative to protrusion onset (pre-protrusion onset responsive) or 0 ms to 200 ms relative to L1 protrusion onset (post-protrusion onset responsive). To assess significance for firing rate differences in peri-L1 responsive neurons, and in all subsequent analysis, we performed a ‘shuffle test’. The difference in peristimulus firing-rate histograms (PSTHs) in the two conditions was compared to the distribution of differences in PSTHs generated by randomly assigning trials to the two conditions 1,000 times. The neuron was deemed significantly modulated if the difference was in the <2.5 percentile or >97.5 percentile of the shuffled data.
Neurons significantly modulated by L1 CSMs in any of the three epochs defined above were classified as ‘selective’ within their respective epoch, and further assessed for trial-type selectivity28. PSTHs were constructed with 10-ms bins and smoothed with a 3-bin moving average. Selectivity at each time bin was defined as the absolute spike rate difference between trial types, normalized by peak selectivity. The standard error for the PSTHs and the IQR for the selectivity were generated by performing a bootstrap analysis. For each condition (for example, CSM and no CSM), we resampled the trials recorded for that condition. We selected a new set of trials (randomly, with replacement) of the same size as our original set. We then calculated PSTHs and selectivity histograms from this resampled dataset. We performed this resampling 1,000 times to get an estimate for the variability of the PSTHs and selectivity. Selectivity heat maps for each condition (Figs. 3, 4, Extended Data Fig. 9) were generated by calculating selectivity histograms (as described above) for all neurons significantly modulated within each epoch, and were sorted in descending order by median selectivity within the epoch.
To determine the trial-by-trial coupling of neurons to behaviour, we used a maximum-likelihood estimation framework45. In brief, we leave out one trial and calculate the mean spikes in the window of interest for the two conditions. Then, assuming Poisson firing statistics, we estimated the likelihood of the left-out trial belonging to either condition. The likelihood is given by:
in which x is the number of spikes in selected window of the current trial, λ1 = mean number of spikes in window during condition 1, λ2 = mean number of spikes in window during condition 2, p(λ1) is the likelihood of x belonging to condition 1 and p(λ2) is the likelihood of x belonging to condition 2
The trial was classified to the condition that had the maximum likelihood. This was repeated for all the trials for a neuron. We then calculated the true positive rate (TPR) (true positives/(true positives + false negatives)) and the true negative rate (TNR) (true negatives/(true negatives + false positives)) for the classification, and using these we calculated the balanced accuracy (BA) ((TPR + TNR)/2).
To generate confidence intervals for the balanced accuracy, we performed a bootstrap analysis. In this bootstrapping, the trials for classification were randomly drawn with replacement and the balanced accuracy was calculated on the bootstrapped data set as described above.
The effect size for the firing rate modulation of the neurons was calculated as:
in which FR1 is the mean firing rate in condition 1 and FR2 is the mean firing rate in condition 2
To test for neuronal correlates of double-step trials (Fig. 4l), we assessed the difference in firing rate between double-step and control trials. Data were aligned to L2 protrusion onset and tested for significance from 0 to 400 ms relative to L2 protrusion onset. To classify whether a neuron was activated or suppressed in response to double-step trials, we calculated the median difference in selectivity of each neuron within the epoch relative to control trials. Neurons were classified as activated if this difference was greater than 0, and suppressed if this difference was less than 0.
To test for neuronal correlates of premature bout termination (Fig. 4m), we quantified the difference in firing rate between trials in which bouts were terminated and trials in which bouts continued. A bout was considered to be terminated if there were no licks after L2, and considered to be continued if there was at least one lick after L2. Data were aligned to L2 protrusion onset, and tested for significance from 0 to 150 ms relative to L2 protrusion onset.
To test for neuronal correlates of L2 spout misses (Fig. 4n), we compared the difference in firing rate between trials in which L2 made spout contact with trials in which L2 did not make spout contact. To control for termination signals, we only included trials in which there was at least one lick after L2. Data were aligned to L2 protrusion onset, and tested for significance from 0 to 150 ms relative to L2 protrusion onset.
To test for neuronal correlates of L2 spout position (Fig. 4p), we assessed the difference in firing rate between trials in which L2 made spout contact on double step (spout far) relative to control (spout near) trials. To control for termination signals, we only included trials in which there was at least one lick after L2. Data were aligned to L2 spout contact onset, and tested for significance from 0 to 100 ms relative to L2 spout contact onset. For clarity and consistency, panels in Fig. 4 were plotted aligned to L2 protrusion onset.
Finally, to test for neuronal correlates of L2 CSMs (Fig. 4o), we compared the difference in firing rate between trials in which L2 contained CSMs with trials in which L2 lacked CSMs. To control for termination signals, we only included trials in which there was at least one lick after L2. Additionally, to control for spout contact signals and spout contact position signals, we only included double-step trials in which L2 missed the spout. Data were aligned to L2 protrusion onset, and tested for significance from −50 to 100 ms relative to L2 protrusion onset. All analyses for L2 were repeated for L3 (Extended Data Fig. 9).
To determine when ALM activity on double-step trials diverged from control trials (Fig. 4k), we first used principal components analysis (PCA) to reduce the dimensionality of our data as previously described10,11,46. As dimensionality reduction methods can be biased by high firing-rate units, we normalized the firing rate of each neuron by the maximum s.d. for each unit across all trials and all conditions10,11. Data were aligned to L2 protrusion onset, and PSTHs were generated in 10-ms bins as described. We then ran PCA on this data and projected the condition-averaged (double step and control) responses onto the top 8 dimensions of this space, which explained >95% of the neural variance in our dataset. We plotted the trajectories from each condition in the first three dimensions of this space (Fig. 4k). To estimate the neural distance between trajectories and variability of this distance, we performed a bootstrap analysis. For each condition (double step and control), we resampled trials with replacement for that condition of equal size to the original dataset. We then computed PSTHs with this resample dataset, projected the data onto the top eight principal components, and calculated the Euclidean distance between these trajectories. This procedure was repeated 1,000 times to yield the bootstrapped mean neural distance between trajectories and an estimate of the variability in the distance between neural trajectories. The time of divergence between neural trajectories was then defined as the median time that the neural distance exceeded two s.d. above the mean baseline activity (−400 to 0 ms before L2 protrusion onset) across bootstraps.
Electrophysiological validation of photoinhibition
To validate the photoinhibition (Extended Data Fig. 7), we performed acute extracellular neural recordings in awake Vgat-ChR2-EYFP mice (2 mice and 2 sessions) while simultaneously performing photoinhibition with laser powers identical to those used in the behavioural tests (40-Hz sinusoidal wave at 10 mW). Photoinhibition was delivered for 1.1 s with an exponentially distributed time interval (rate parameter of 3 s) between inactivation.
Statistical analyses of tongue kinematics
Statistical analyses were performed using standard tests in MATLAB, including one-sided t-tests, two-sample t-tests, Wilcoxon rank-sum tests and Wilcoxon signed-rank tests. Correlation was tested by applying the F-test statistic to a linear fit. A χ2 goodness-of-fit test was performed to determine whether a distribution was uniform. For measures of central tendency, we used medians and IQR as these measures do not assume normality of distributions. They are represented as medians (IQR). For example, a duration measure of 18 ms (16–22), represents a median of 18 ms with interquartile range from 16 ms to 22 ms. For all estimates of kinematic parameters, mice were only included if they had at least five data points in each condition.
We generated linear mixed effects models to test whether the probability (CSM_pres) or the duration (CSM_dur) of the CSMs in the first cue-evoked lick could be predicted by time since last spout contact (prev_spc), trial number in the session (trial_num) or the RT. (Extended Data Fig. 6e, f). For modelling the probability of CSMs we used the formulation: CSM_present ~ 1 + prev_spc + trial_num + RT + (1|MouseID) + (RT|MouseID), with CSM_present as a binomial distribution and a logit link function. For modelling the duration of CSMs we used the formulation: CSM_durations ~ 1 + prev_spc + trial_num + RT + (1|MouseID) + (RT|MouseID) with CSM_durations as a normal distribution and an identity link function.
Sample sizes used in this study are comparable to or exceed the typical sample sizes used in the field. No statistical methods were used to determine sample size. Mice were randomly assigned to experimental groups. The investigators were not blinded to allocation during experiments and outcome assessment. Trial types were pseudo-randomly determined by a computer program in real time. During spike sorting, experimenters were blind to trial type and conditions. Statistical tests for behavioural and electrophysiological analysis are described above, and in ‘Trajectory analysis’ and ‘Electrophysiology analysis’.
Reporting summary
Further information on research design is available in the Nature Research Reporting Summary linked to this paper.
Data availability
The data that support the findings of this study are available from the corresponding author upon reasonable request.
Code availability
The acquisition and behavioural software code that support the findings of this study are available at https://github.com/GoldbergLab/Bollu-Ito-et-al-2021.
Extended Data
Extended Data Fig. 1 |. Method for extracting 3D tongue tip kinematics.

a, Architecture of the artificial neural network (U-NET) used to segment the tongue from the background image. U-NET has characteristic symmetrical contraction and expansion paths that simultaneously capture localization and image context. Each box corresponds to a multi-channel feature map and numbers above each layer indicate the number of channels; colour-coded arrows indicate sequential processing steps. b, Pipeline for tongue segmentation. Left to right, top, side view of the tongue as the input image to U-NET, the identified tongue mask and the mask plus the input image. Bottom, process is repeated separately for the bottom view of the tongue. c, An example of the process used to generate a 3D voxel hull from the two views of the mouse tongue. The walls of the diagrams are stills taken from the high-speed video, with the segmented tongue mask highlighted in red. The final hull (rightmost diagram) is obtained by intersecting the projections of the side- and bottom-view tongue masks. d, A 2D illustration of the tip coordinate search. With the voxels (grey circle) and centroid (black circle) identified, the first search step is performed, in which candidate voxels (blue) are found via the intersection of voxels satisfying the two search criteria (yellow)—namely, thresholds on the maximum angle made with an initial search vector (blue arrow) and the minimum distance from the tongue centroid. These first candidate voxels are then used to generate a refined search vector (red arrow, second row) for the second step of the search. Using this refined search vector, a similar set of angle and distance thresholds are applied to determine a refined set of candidate voxels, which are then averaged to determine the tip location. e, Example of the tip search process with real data in 3D. The grey object is the 3D tongue hull, with the centroid labelled by a black circle. The first search step identifies a set of candidate voxels (blue) that are used to generate a refined search vector for the second search step (red). Using the second-step candidate voxels, the tongue tip location is estimated (green ‘x’). f, Average power spectral density plot of tongue tip trajectories from five representative mice. More than 90% of power was at frequencies less than 50 Hz. g, Two time-points of a single lick (left and right) are shown with tongue tip estimated with key points (red) and with volume reconstruction (blue). Though key-point tracking appears to work well from the side view, it fails in the bottom view as the true tongue tip does not always lie at the edge of the image of the tongue as seen from the bottom. This is because in most licks the tongue exhibits a ‘c’ shape at full extension. In these frames the tip is mislabelled by key points in the bottom view. Importantly, the error cannot be accounted for systematically because it varies dynamically within a lick according to the convexity of the tongue.
Extended Data Fig. 2 |. Water retrieval and cue-evoked licks exhibit distinct kinematics.

a–c, Water-retrieval licks, defined as those initiated after spout contact. a, Six overlaid tongue tip trajectories during retrieval licks. A single lick is bold for clarity. b, Protrusion, CSM, SSM and retraction phases of the trajectories from a are separately plotted. The ‘x’ symbols denote the absence of CSMs and/or SSMs. c, Three-dimensional trajectory of the highlighted lick shown in a, with protrusion (green) and retraction (purple) lick phases indicated. d–f, Data plotted as in a–c for cue-evoked licks. Note the prominent CSMs. g, Tongue tip speed profiles for retrieval (blue) and cue-evoked (black) trajectories shown in a, d. h–k, Probability of CSMs (h) and durations (i), peak speeds ( j) and path lengths (k) of distinct lick phases during cue-evoked (black) and retrieval (blue) licks. l, m, Kinematics (l) and entropy (m) of lick durations, path lengths, peak speeds and number of acceleration peaks. Data are median ± IQR. *P < 0.05, **P < 0.01, ***P < 0.001, two-sided paired Wilcoxon signed rank test; all data from sessions with spout at 3.2 mm. n = 17 mice. Exact statistics are in Supplementary Table 1.
Extended Data Fig. 3 |. Individual mice exhibit stereotyped tongue tip positions at retraction onset and spout contact.

a, Side and bottom views of the tongue at the moment of retraction onset from a representative lick. b, Scatter plots of tongue tip positions at retraction onset for side (top) and bottom (bottom) views during successful cue-evoked licks from a single session. Probability distributions are projected along the axes at top and right (bin size, 120 μm). Right, 2D standard deviations of tongue tip positions at retraction onset for nine representative mice (each mouse independently colour-coded). Each mouse exhibits a ‘preferred’ target location for retraction onset. Similarly, tongue CSMs terminated at precisely clustered tongue tip positions beneath the spout in a way that was unique for each mouse. c, Tongue tip positions at moment of retraction onset plotted as in b for retrieval licks. d–f, Data plotted as in a–c for tongue tip positions at the moment of spout contact, for the same nine mice. g, Probability of spout contact as a function of the distinct lick phases for cue-evoked and water-retrieval licks (blue and black, respectively, median ± IQR, n = 17 mice). h, i, The number of acceleration peaks per lick predicts latency to spout contact. h, The latency to spout contact relative to protrusion onset is plotted against the number of acceleration peaks per lick from a single spout-far session. Red line, linear fit. i, Box plot showing r2 for linear fits across 17 mice (red line, median; box edges, IQR; whiskers, 95% confidence interval).
Extended Data Fig. 4 |. Tongue protrusions remain aimed during ALM inactivation.

a, Left, Five example tongue protrusions (from bottom view) from a single session with the spout placed to the left (blue, ALM inactivated; black, ALM intact). Green ellipse denotes 95% confidence interval of the tongue tip location at the moment of retraction onset. Centre, scatter plot of tongue tip positions at tongue protrusion offsets. Probability distributions of ALM intact (black) and inactivated (blue) dots are projected along the axes at top and right (bin size, 120 μm). Green line, midline. b, c, Data plotted in a for sessions with centred (b) and right (c) spout placements. d, Left, the lateral placement of the tongue tip at the moment of protrusion offset is plotted across left, straight and right sessions (black, laser off; blue, ALM inactivated). Right, the average difference in lateral displacement between ALM-intact and ALM-inactivated trials. Data in d are median ± IQR across n = 13, 15 and 12 mice for spout left, centre and right, respectively; *P < 0.05 for a one sample two-sided Wilcoxon signed rank test. Exact statistics are in Supplementary Table 2.
Extended Data Fig. 5 |. CSMs are directionally biased towards remembered spout locations.

a–e, CSM kinematics for spout-left sessions. a, Time-dependent velocity vector for the protrusion (green) and CSM (orange) phase of a single cue-evoked lick. The origin of each vector is the tongue tip position at 5-ms intervals of the lick, the amplitude is the speed and the arrow points in the direction of motion. Inset, polar plot with direction distribution of all CSMs produced in a single spout-left session. Dashed circle, the null distribution of unbiased CSM directions. b, Scatter plot of CSM directions plotted against protrusion directions for all cue-evoked licks in the session. c, Position-dependent average velocity vectors for all cue-evoked licks from a single session, colour-coded by highest likelihood lick phase to pass through the binned space (250-μm grid). Grey shading intensity of each bin is proportional to the probability of a tongue tip trajectory passing through the space. d, Scatter plot of tongue tip positions at protrusion offset (green) and retraction onset (orange), indicating CSM start and end points, respectively. Probability distributions of the CSM start and end points are projected along the axes at top and right, respectively (bin size, 120 μm). e, Example of a single CSM path and its speed profile (orange). The initial direction of the CSM (VCSM, black dotted line) was computed from the vector connecting the CSM starting point to its position at the first speed minimum (upward black triangle in speed and path plots). The dot products between this CSM direction vector and three additional vectors from CSM starting point to left, centre and right targets (dotted red, green, and blue lines, respectively) were computed to quantify the ‘direction bias’, the extent to which the initial direction of a given CSM was aimed at each of the three candidate targets (targets defined independently for each mouse and each session as its median tongue tip position at moment of retraction onset (Extended Data Fig. 3, Methods)). f, Left, cumulative distributions of directional biases for all CSMs produced in a single session to the three candidate targets (coloured as in b). CSMs were reliably aimed to the left target. Right, directional biases of CSMs to left, centre and right targets in spout-left sessions(n = 13 mice). g–l, CSM kinematics for spout-centre sessions, plotted as in a–f (n = 17 mice). m–r, CSM kinematics for spout-right sessions, plotted as in a–f (n = 12 mice). Data in f, l and r are median ± IQR.* P < 0.05, **P <0.01, two-sided Wilcoxon ranked-sum test. No corrections for multiple comparisons were made. Exact statistics are in Supplementary Table 3.
Extended Data Fig. 6 |. Uncertainty in spout position is associated with the need for corrections.
a–d, The first spout contact transforms the kinematics of subsequent licks in a bout. a, Tongue volumes as a function of time during three trials in which first spout contact (black dashed line) occurred on the first, second or third lick. Licks initiated before spout contact exhibited substantial CSMs, whereas those initiated after spout contact did not. b, CSM probability as a function of lick number in cases in which first spout contact happened on first, second or third licks (n = 17 mice). Spout contact reliably transformed the kinematics of subsequently initiated licks. Data in b from sessions in which water was dispensed on first spout contact. c, d, CSMs when water was dispensed on the second spout contact (n = 12 mice). c, In sessions in which water was dispensed on second contact, both spout contact on L1 and water dispensed on L2 contact reduced CSMs on ensuing licks. d, CSM duration on first cue-evoked licks (L1) did not depend on water dispensation on first contact. e, f, Mixed-effects models were used to predict the duration (e) and probability (f) of CSMs on first licks of a bout (Methods). CSM durations were significantly predicted by trial number in session and time since previous spout contact (tp_sp), but not reaction time (tRT). CSM probabilities were predicted by tp_sp and by tRT (n = 8 mice, 1,507 trials). g, CSM probability scales with spout distance. n = 17, 11 and 13 mice for spout at 3.2, 2.4 and 1.6 mm, respectively. Data in b–d, g are median ± IQR. *P < 0.05, **P < 0.01, two-sided Wilcoxon rank-sum test. Data in e, f are mean ± s.e.m. of the model estimates of the coefficients; **P < 0.01, ***P < 0.001, two-sided t-test. No corrections for multiple comparisons were made. Exact statistics are in Supplementary Tables 4–6.
Extended Data Fig. 7 |. Electrophysiological validation of photoinhibition in Vgat-ChR2-EYFP mice.

a, Voltage waveforms of putative pyramidal neuron (top) and interneuron (bottom) during one second illumination of 40-Hz sinusoidal wave at 10 mW, the same power and waveform generated in behavioural experiments. b, Spike rasters and corresponding rate histograms of the neurons from a. c, The z-scored firing rates of 71 ALM neurons before, during and after optogenetic activation of inhibitory interneurons in Vgat-ChR2-EYFP mice (n = 2 sessions, n = 2 mice) (Methods).
Extended Data Fig. 8 |. Effects of ALM and PMM inactivation on lick kinematics.

a–c, Inactivation of PMM does not affect task performance or lick kinematics. a, Cumulative probability of tongue–spout contact relative to cue onset during laser-off and PMM-photoinactivated trials. Right, probability of spout contact within a trial across mice (n = 9 mice). b, Data plotted as in a for tongue protrusions. c, Median durations, path lengths and peak speeds for lick phases with PMM intact (black) and PMM inactivated (blue), d, Effect of ALM photoinhibition on the duration, path length speed and number of acceleration peaks in cue-evoked licks. e, ALM photoinhibition reduced the variability of L1 kinematics. Data in d, e (n = 12 mice) are from trials in which L1 protrusions existed during control (black) and ALM-inactivated (blue) trials with a minimum of 10 data points for each lick phase. f–h, Effect of ALM photoinhibition on water-retrieval licks. ALM photoinhibition reduced the probabilities of spout contact (f) and CSM generation (g) (blue) (control trials in black). h, Median duration, path lengths and peak speeds of retrieval lick phases produced with ALM intact and inactivated. Data (n = 12 mice) of the first retrieval lick that followed cue-evoked licks that made contact during ALM photoinhibition. i–k, Proximal spout placement rescues ALM-inactivation-associated spout contact deficits. Cumulative probability of spout contact relative to cue onset for control (black) and ALM-inactivated (blue) trials in sessions in which the spout was 1.6 mm (i) and 3.2 mm (j) from the incisors. k, Median probability of spout contact across mice from spout-close and spout-far sessions (n = 13 mice). Data in a–h, k are median ± IQR. *P < 0.05, **P < 0.01, ***P < 0.001, two-sided paired Wilcoxon signed-rank test. Exact statistics are in Supplementary Tables 7–10.
Extended Data Fig. 9 |. Online corrections on L3 of double-step trials have neural correlates in ALM.

a, Tongue volumes, spike rasters and corresponding rate and double-step-selectivity histograms for two example ALM neurons (example neuron 1 (a) and example neuron 2 (f)). Neural activity aligned to L3 protrusion onset. Raster colour codes are as in Fig. 4. Bottom (k), ALM population double-step selectivity, defined as the normalized difference in firing rate from control and double-step trials (Methods). Only neurons with significant trial selectivity are shown (n = 234 out of 465 neurons). b–e, g–j, l–o, Data plotted as in a for the following conditions: premature bout termination following L3 (n = 147 out of 438 neurons) (b, g, l), L3 spout misses resulting in bout continuation (n = 85 out of 418 neurons) (c, h, m), CSMs on L3 misses (n = 10 out of 79 neurons) (d, i, n), and spout location on L3 contacts (n = 18 out of 167 neurons) (e, j, o). Histograms are bootstrapped mean ± s.e.m.
Extended Data Fig. 10 |. Centroid-based tracking confirms the presence of CSMs on cue-evoked licks and their reduction during retrieval licks and ALM inactivation.

a–c, The speed of the tongue centroid (Extended Data Fig. 1) plotted above the absolute values of rate of tongue volume change for an example cue-evoked lick with ALM intact (a), with ALM inactivated (b) and a retrieval lick (c). d–g, Data plotted as in Fig. 2m–p for the same mice and sessions but with lick phase kinematics computed from centroid-based tongue tracking, in which the first and last minima in centroid speeds defined protrusion offset and retraction onset. Data are median ± IQR, n = 12 mice, *P < 0.05, **P < 0.01, ***P < 0.001, two-sided paired Wilcoxon signed-rank test. No corrections for multiple comparisons were made. Exact statistics are in Supplementary Table 16.
Supplementary Material
Acknowledgements
We thank J. Fetcho, M. Warden, N. Hogan, C. Pandarinath and members of the laboratory of J.H.G. for comments on the manuscript, and B. Bari, A. Finkelstein, N. Prasad and J. Walker for technical advice. Funding to J.H.G. was provided by the NIH (grant no. DP2 HD087952), the Dystonia Medical Research Foundation, the Pew Charitable Trust, J. Sheng and the Klingenstein Neuroscience Foundation. Funding to B.S.I. was provided by the NSF Graduate Research Fellowship Program.
Footnotes
Online content
Any methods, additional references, Nature Research reporting summaries, source data, extended data, supplementary information, acknowledgements, peer review information; details of author contributions and competing interests; and statements of data and code availability are available at https://doi.org/10.1038/s41586-021-03561-9.
Competing interests The authors declare no competing interests.
Additional information
Supplementary information The online version contains supplementary material available at https://doi.org/10.1038/s41586-021-03561-9.
Peer review information Nature thanks the anonymous reviewer(s) for their contribution to the peer review of this work.
References
- 1.Kier WM & Smith KK Tongues, tentacles and trunks: the biomechanics of movement in muscular-hydrostats. Zool. J. Linn. Soc 83, 307–324 (1985). [Google Scholar]
- 2.Chartier J, Anumanchipalli GK, Johnson K & Chang EF Encoding of articulatory kinematic trajectories in human speech sensorimotor cortex. Neuron 98, 1042–1054. e1044 (2018). [DOI] [PMC free article] [PubMed] [Google Scholar]
- 3.Arce-McShane FI, Hatsopoulos NG, Lee JC, Ross CF & Sessle BJ Modulation dynamics in the orofacial sensorimotor cortex during motor skill acquisition. J. Neurosci 34, 5985–5997 (2014). [DOI] [PMC free article] [PubMed] [Google Scholar]
- 4.Meyer DE, Abrams RA, Kornblum S, Wright CE & Smith JE Optimality in human motor performance: ideal control of rapid aimed movements. Psychol. Rev. 95, 340–370 (1988). [DOI] [PubMed] [Google Scholar]
- 5.Spijkers WA & Lochner P Partial visual feedback and spatial end-point accuracy of discrete aiming movements. J. Mot. Behav 26, 283–295 (1994). [DOI] [PubMed] [Google Scholar]
- 6.Khan MA & Franks IM Online versus offline processing of visual feedback in the production of component submovements. J. Mot. Behav 35, 285–295 (2003). [DOI] [PubMed] [Google Scholar]
- 7.Gordon J, Ghilardi MF & Ghez C Accuracy of planar reaching movements. I. Independence of direction and extent variability. Exp. Brain Res. 99, 97–111 (1994). [DOI] [PubMed] [Google Scholar]
- 8.Ghez C, Gordon J, Ghilardi MF & Sainburg R in The Cognitive Neurosciences (ed. Gazzaniga MS) 549–564 (The MIT Press, 1995). [Google Scholar]
- 9.Dickey AS, Amit Y & Hatsopoulos NG Heterogeneous neural coding of corrective movements in motor cortex. Front. Neural Circuits 7, 51 (2013). [DOI] [PMC free article] [PubMed] [Google Scholar]
- 10.Ames KC, Ryu SI & Shenoy KV Neural dynamics of reaching following incorrect or absent motor preparation. Neuron 81, 438–451 (2014). [DOI] [PMC free article] [PubMed] [Google Scholar]
- 11.Ames KC, Ryu SI & Shenoy KV Simultaneous motor preparation and execution in a last-moment reach correction task. Nat. Commun 10, 2718 (2019). [DOI] [PMC free article] [PubMed] [Google Scholar]
- 12.Komiyama T et al. Learning-related fine-scale specificity imaged in motor cortex circuits of behaving mice. Nature 464, 1182–1186 (2010). [DOI] [PubMed] [Google Scholar]
- 13.Goard MJ, Pho GN, Woodson J & Sur M Distinct roles of visual, parietal, and frontal motor cortices in memory-guided sensorimotor decisions. eLife 5, e13764 (2016). [DOI] [PMC free article] [PubMed] [Google Scholar]
- 14.Welsh JP, Lang EJ, Suglhara I & Llinás R Dynamic organization of motor control within the olivocerebellar system. Nature 374, 453–457 (1995). [DOI] [PubMed] [Google Scholar]
- 15.Crochet S, Lee SH & Petersen CCH Neural circuits for goal-directed sensorimotor transformations. Trends Neurosci. 42, 66–77 (2019). [DOI] [PubMed] [Google Scholar]
- 16.Svoboda K & Li N Neural mechanisms of movement planning: motor cortex and beyond. Curr. Opin. Neurobiol 49, 33–41 (2018). [DOI] [PubMed] [Google Scholar]
- 17.Coddington LT & Dudman JT The timing of action determines reward prediction signals in identified midbrain dopamine neurons. Nat. Neurosci 21, 1563–1573 (2018). [DOI] [PMC free article] [PubMed] [Google Scholar]
- 18.Gaffield MA & Christie JM Movement rate is encoded and influenced by widespread, coherent activity of cerebellar molecular layer interneurons. J. Neurosci 37, 4751–4765 (2017). [DOI] [PMC free article] [PubMed] [Google Scholar]
- 19.Xu D et al. A functional cortical network for sensorimotor sequence generation Preprint at 10.1101/783050 (2019). [DOI] [Google Scholar]
- 20.Ronneberger O, Fischer P & Brox T U-net: convolutional networks for biomedical image segmentation. In International Conference on Medical Image Computing and Computer-Assisted Intervention (ed. Navab N et al. ) 234–241 (Springer, 2015). [Google Scholar]
- 21.Beatus T, Guckenheimer JM & Cohen I Controlling roll perturbations in fruit flies. J. R. Soc. Interface 12, 20150075 (2015). [DOI] [PMC free article] [PubMed] [Google Scholar]
- 22.Elliott D & Madalena J The influence of premovement visual information on manual aiming. Quat. J. Exp. Psychol 39, 541–559 (1987). [DOI] [PubMed] [Google Scholar]
- 23.McIntyre J, Stratta F & Lacquaniti F Viewer-centered frame of reference for pointing to memorized targets in three-dimensional space. J. Neurophysiol 78, 1601–1618 (1997). [DOI] [PubMed] [Google Scholar]
- 24.Heath M & Westwood DA Can a visual representation support the online control of memory-dependent reaching? Evidence from a variable spatial mapping paradigm. Motor Control 7, 349–365 (2003). [PubMed] [Google Scholar]
- 25.Westwood DA, Heath M & Roy EA No evidence for accurate visuomotor memory: systematic and variable error in memory-guided reaching. J. Mot. Behav 35, 127–133 (2003). [DOI] [PubMed] [Google Scholar]
- 26.Woods JW Behavior of chronic decerebrate rats. J. Neurophysiol 27, 635–644 (1964). [DOI] [PubMed] [Google Scholar]
- 27.McElvain LE et al. Circuits in the rodent brainstem that control whisking in concert with other orofacial motor actions. Neuroscience 368, 152–170 (2018). [DOI] [PMC free article] [PubMed] [Google Scholar]
- 28.Li N, Chen TW, Guo ZV, Gerfen CR & Svoboda K A motor cortex circuit for motor planning and movement. Nature 519, 51–56 (2015). [DOI] [PubMed] [Google Scholar]
- 29.Allen WE et al. Global representations of goal-directed behavior in distinct cell types of mouse neocortex. Neuron 94, 891–907.e6 (2017). [DOI] [PMC free article] [PubMed] [Google Scholar]
- 30.Desmurget M et al. Role of the posterior parietal cortex in updating reaching movements to a visual target. Nat. Neurosci. 2, 563–567 (1999). [DOI] [PubMed] [Google Scholar]
- 31.Rohrer B et al. Movement smoothness changes during stroke recovery. J. Neurosci 22, 8297–8304 (2002). [DOI] [PMC free article] [PubMed] [Google Scholar]
- 32.Megaw ED Possible modification to a rapid on-going programmed manual response. Brain Res 71, 425–441 (1974). [DOI] [PubMed] [Google Scholar]
- 33.Archambault PS, Ferrari-Toniolo S & Battaglia-Mayer A Online control of hand trajectory and evolution of motor intention in the parietofrontal system. J. Neurosci 31, 742–752 (2011). [DOI] [PMC free article] [PubMed] [Google Scholar]
- 34.Georgopoulos AP, Kalaska JF, Caminiti R & Massey JT Interruption of motor cortical discharge subserving aimed arm movements. Exp. Brain Res 49, 327–340 (1983). [DOI] [PubMed] [Google Scholar]
- 35.Goodale MA, Pelisson D & Prablanc C Large adjustments in visually guided reaching do not depend on vision of the hand or perception of target displacement. Nature 320, 748–750 (1986). [DOI] [PubMed] [Google Scholar]
- 36.Diedrichsen J, Hashambhoy Y, Rane T & Shadmehr R Neural correlates of reach errors. J. Neurosci 25, 9919–9931 (2005). [DOI] [PMC free article] [PubMed] [Google Scholar]
- 37.Pruszynski JA, Johansson RS & Flanagan JR A rapid tactile-motor reflex automatically guides reaching toward handheld objects. Curr. Biol 26, 788–792 (2016). [DOI] [PubMed] [Google Scholar]
- 38.Rico-Guevara A & Rubega MA The hummingbird tongue is a fluid trap, not a capillary tube. Proc. Natl Acad. Sci. USA 108, 9356–9360 (2011). [DOI] [PMC free article] [PubMed] [Google Scholar]
- 39.Harper CJ, Swartz SM & Brainerd EL Specialized bat tongue is a hemodynamic nectar mop. Proc. Natl Acad. Sci. USA 110, 8852–8857 (2013). [DOI] [PMC free article] [PubMed] [Google Scholar]
- 40.Reis PM, Jung S, Aristoff JM & Stocker R How cats lap: water uptake by Felis catus. Science 330, 1231–1234 (2010). [DOI] [PubMed] [Google Scholar]
- 41.de Groot JH & van Leeuwen JL Evidence for an elastic projection mechanism in the chameleon tongue. Proc. R. Soc. Lond. B 271, 761–770 (2004). [DOI] [PMC free article] [PubMed] [Google Scholar]
- 42.Wei J et al. Sucking or lapping: facultative feeding mechanisms in honeybees (Apis mellifera). Biol. Lett 16, 20200449 (2020). [DOI] [PMC free article] [PubMed] [Google Scholar]
- 43.Travers JB, Dinardo LA & Karimnamazi H Motor and premotor mechanisms of licking. Neurosci. Biobehav. Rev 21, 631–647 (1997). [DOI] [PubMed] [Google Scholar]
- 44.Hayar A, Bryant JL, Boughter JD & Heck DH A low-cost solution to measure mouse licking in an electrophysiological setup with a standard analog-to-digital converter. J. Neurosci. Methods 153, 203–207 (2006). [DOI] [PMC free article] [PubMed] [Google Scholar]
- 45.Dayan P & Abbott LF Theoretical neuroscience: computational and mathematical modeling of neural systems. J. Cogn. Neurosci 15, 154–155 (2003). [Google Scholar]
- 46.Sauerbrei BA et al. Cortical pattern generation during dexterous movement is input-driven. Nature 577, 386–391 (2020). [DOI] [PMC free article] [PubMed] [Google Scholar]
Associated Data
This section collects any data citations, data availability statements, or supplementary materials included in this article.
Supplementary Materials
Data Availability Statement
The data that support the findings of this study are available from the corresponding author upon reasonable request.