

Abstract
Objective:
The current study aims to investigate functional brain network representations during the early period of epileptogenesis.
Methods:
18 rats with the intrahippocampal kainate model of mTLE were used for this experiment. fMRI measurements were made one week after status, followed by 2–4 month electrophysiological and video monitoring. Animals were identified as having (1) developed epilepsy (E+, n=9); or (2) not developed epilepsy (E−, n=6). 9 additional animals served as controls. Graph theory analysis was performed on the fMRI data to quantify the functional brain networks in all animals prior to the development of epilepsy. Spectrum clustering with the network features was performed to estimate their predictability in epileptogenesis.
Results:
Our data indicated that E+ animals showed an overall increase in functional connectivity strength compared to E− and control animals. Global network features and small-worldness of E− rats were similar to controls, while E+ rats demonstrated an increased small-worldness, including increased reorganization degree, clustering coefficient, and global efficiency, with reduced shortest pathlength. A notable classification of the combined brain network parameters were found in E+ and E− animals. For the local network parameters, the E− rats showed increased hubs in sensorimotor cortex, and decreased hubness in hippocampus. The E+ rats showed a complete loss of hippocampal hubs, and the appearance of new hubs in the prefrontal cortex. We also observed that lesion severity was not related to epileptogenesis.
Significance:
Our data provide a view of the reorganization of topographical functional brain networks in the early period of epileptogenesis and how it can significantly predict the development of epilepsy. The differences from E− animals offer a potential means for applying non-invasive neuroimaging tools for the early prediction of epilepsy.
Keywords: epileptogenesis, self-cured, fMRI, brain networks, graph theory
1. Introduction
Mesial temporal lobe epilepsy (mTLE) is the most prevalent type of focal epilepsy in adults, and its main underlying pathophysiological substrate is hippocampal sclerosis (mTLE-HS)1–3. Temporal lobe epilepsies are widely acknowledged as neuronal network disorders mediated by disruptions in connectivity and network topology4, 5. Advances in neuroimaging and electrophysiology have been leveraged in brain connectivity studies, elucidating the wide-ranging influence of focal lesions on extratemporal areas beyond the lesion site, such as across structurally and functionally connected regions 6, 7. Of particular importance was the discovery of alterations to the “default mode” or “resting-state” network, both in clinical patients and in animal models of TLE 8–10.
Alteration of large-scale brain networks is evident in the latent and chronic period of epilepsy. Studies of epileptogenesis during the latent period of epilepsy have revealed the underlying mechanism of epileptogenic network formation and provide a target for future epilepsy prevention 11–13. Thanks to advanced neuroimaging techniques, such as magnetic resonance imaging (MRI), combined with graph theory analysis (GTA), detailed information on brain network changes have been shown to occur in both the acute and chronic models of epilepsy 14, 15. Like patients with mTLE, shifting of functional brain network patterns has been observed in different animal models of this disorder15–17. A significant increase in functional connectivity was observed in the kainic acid (KA)-induced temporal lobe epilepsy model 15. A wide-spread, hyposynchrony of brain network patterns has also been linked to the progression of epileptogenesis 17. A recent study indicated that a dynamic mechanism is responsible for altered resting-state functional brain networks in epilepsy: a shift of global and local excitability that supports the combination of hyper- and hypoconnectivity in the epileptic brain 18.
While animal studies have identified brain network abnormalities related to epilepsy 15–17, 19, our understanding of brain network changes in animals that do not develop epilepsy, or so-called “lesioned controls” is limited. Compared to the healthy brain, epileptogenic network formation is considered to be associated with a series of insult-related compensations, leading to a disease-related, maladaptive plasticity17. Herein we posit that without assessing brain network parameters in the early period after lesioning in all animals, regardless of a trajectory toward the development of epilepsy or not, that it is not possible to fully understand the whole spectrum of the epileptogenetic network, or which parameters might be predictive for epilepsy. In this study, we reasoned that by comparing the early network topology of lesioned rats that do not develop epilepsy to those that do, we will obtain network parameters reflective of changes in neural circuit architecture related solely to the presence of a lesion (similar parameter across the two groups), and those related to epilepsy (the difference in parameters between the two groups). We hypothesized that the network topography in animals that develop mTLE after intra-hippocampal KA-induced status20, 21 would be different from similarly treated animals that do not develop epilepsy. By combining rs-fMRI with graph theory analysis22, 23, we were able to access the topographical representation of functional brain networks during the latent period of epilepsy. Follow-up, long-term EEG and video monitoring classified the animal phenotype and enabled the assessment of the network expression concerning whether animals developed epilepsy (E+), or not (E−).
2. Materials and methods
2.1. Experimental protocols
A total of twenty-seven (n=27) male Sprague-Dawley rats (200–350 g) were used in this study, eighteen animals (n=18) of which received a hippocampal KA injection, while the others served as controls (n=9). Resting-state fMRI data were acquired at the UCLA Brain Mapping Center on a Bruker Biospin 7Tesla scanner from all animals at 10 days post-injection, a time period when epilepsy has not yet developed. Phenotyping for recurrent epileptic seizures was conducted by the follow-up 2–4 month video-EEG and behavioral observation, and resulted in E+/E− (n=9, 6, respectively). Three animals (n=3) did not finish the protocol due to lost head-caps and were excluded from the analysis. Detailed animal procedures are described in the supplementary material S1. All the animal procedures were reviewed and approved by the University of California, Los Angeles, Institutional Animal Care and Use Committee.
2.2. fMRI data preprocessing
Bruker raw data were first transformed and converted to a compressed NIFTI (Neuroimaging Informatics Technology Initiative) format. In the course of data processing, we first enlarged all image dimensions by 10 times to enable processing by tools designed for human brain analysis. Preprocessing of the rs-fMRI data, including slice timing correction, movement correction, co-registration, and smoothing, was performed using SPM12 (Statistical Parametric Mapping, http://www.fil.ion.ucl.ac.uk) and Data Processing Assistant for Resting-State fMRI (DPARSF)24, 25 in MATLAB 2018a. BOLD data were co-registered to the subject-specific, anatomical T2-weighted image, normalized to a rat brain template constructed from two original source (26 and https://www.nitrc.org/projects/dti_rat_atlas/) and edited manually with additional regions using a rodent atlas, as described previously 27 and resampled to 1.25 mm isotropic voxels. Finally, data smoothing was performed using a Gaussian kernel (full width at maximum = 0.6 mm), and all rs-fMRI data were band-pass filtered between 0.01 and 0.1 Hz to reduce the effects of low-frequency drift and high-frequency physiological noise 28, 29.
2.3. Functional network construction
To conduct network analysis, each brain region from the atlas was considered as a node in the brain network formation (Fig. 1c). The BOLD-fMRI time series from each atlas region were extracted. Their respective normalized Pearson correlation coefficients (Pearson’s r transformed to Fisher-Z data) for cross-correlation were computed to describe the connection probability between nodes 23, 30. Referring to prior studies31, 32, 40 nodes were further selected as the region-of-interest (ROI) (Fig.1d) in order to investigate the topographical organizations in brain functional networks associated with epileptogenesis. The detailed descriptions of the ROIs are presented in supplementary table S1.
Fig. 1.
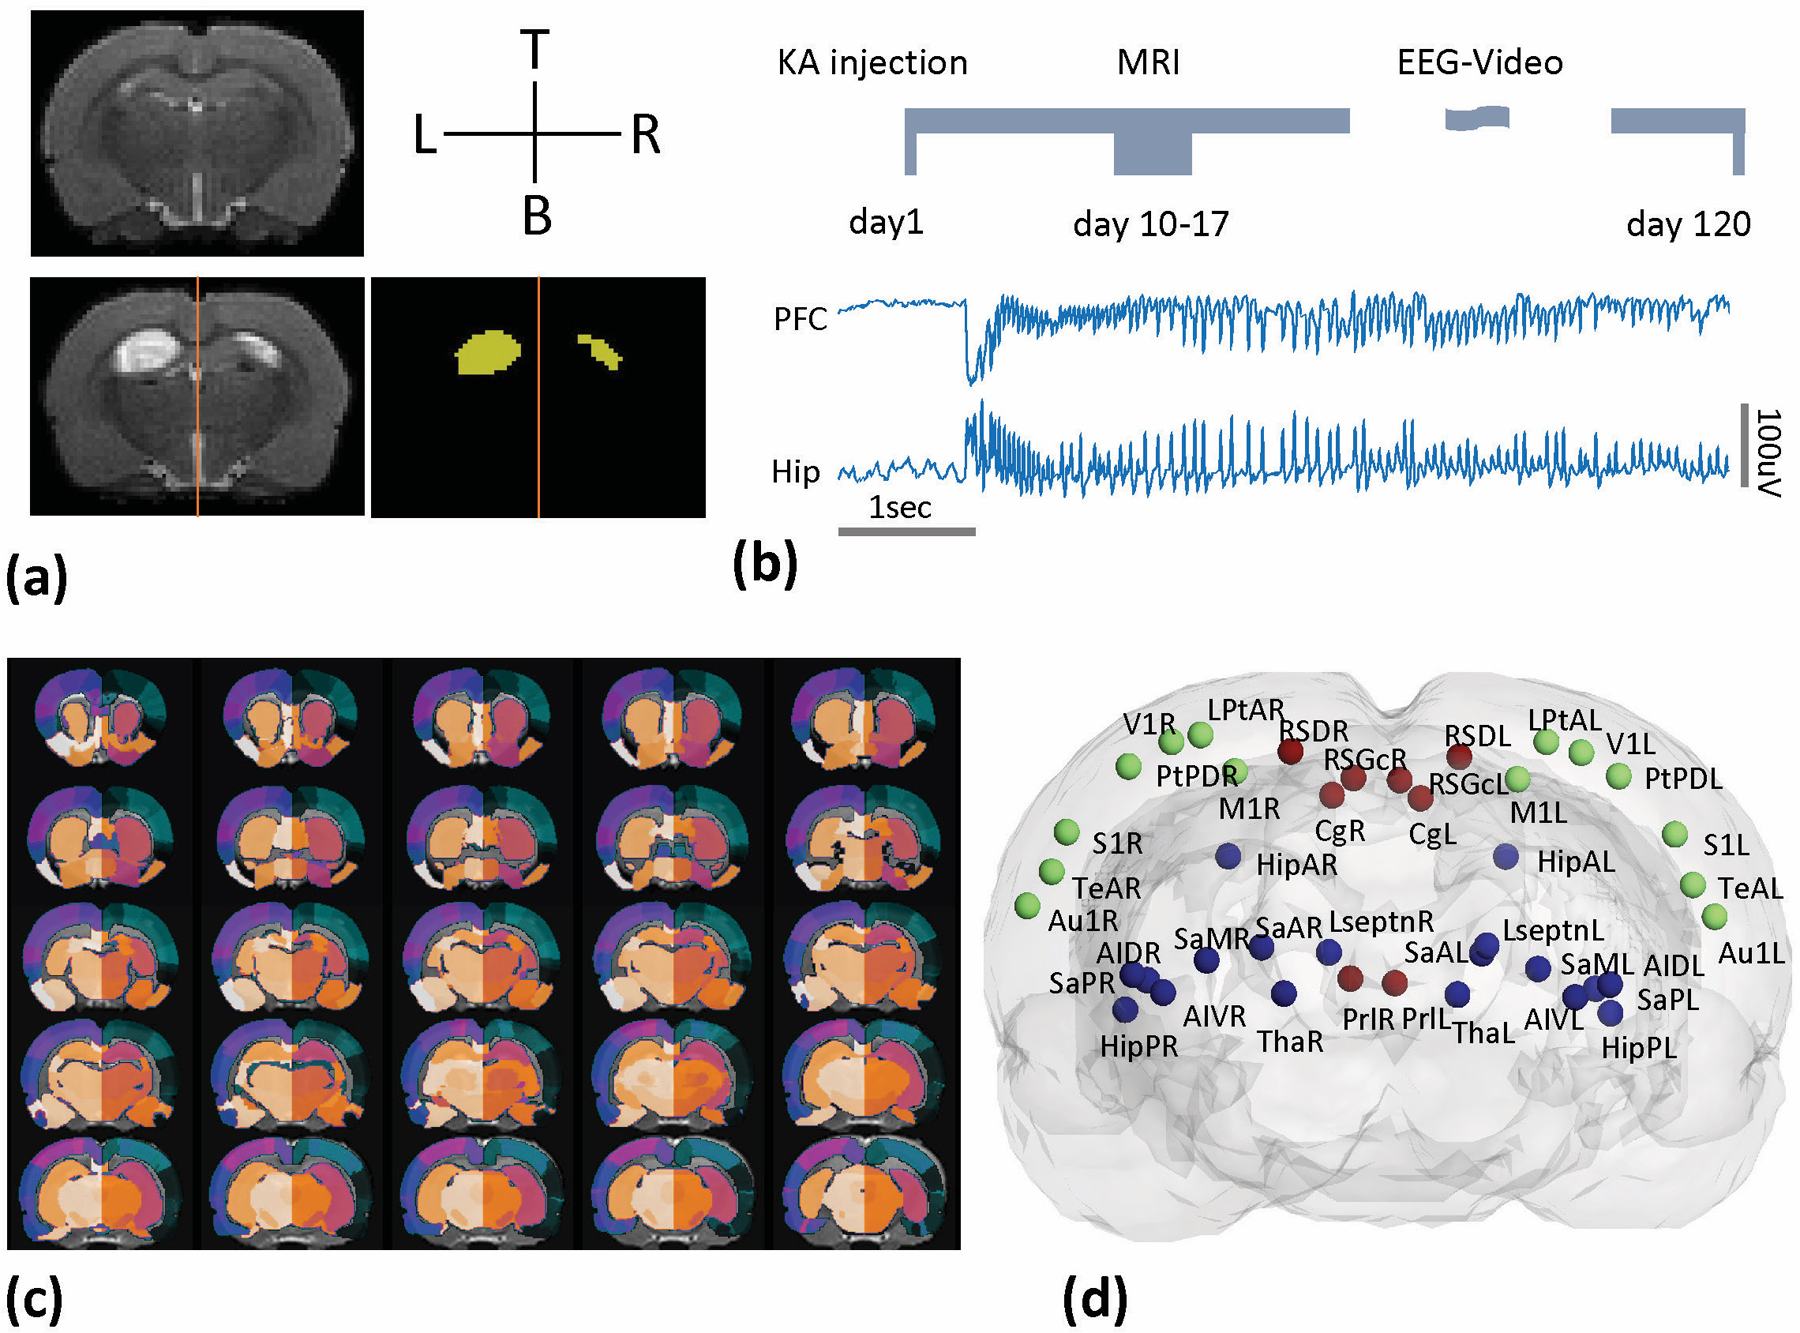
The experimental setup. (a) Representative structural MRI images (coronal, T2-weighted contrast) of control (upper left), experimental animals (bottom left) and the brain lesion extractions (bottom right). (b) The time-line of the experimental protocol and the illustration of electrophysiological data for animal group classification. (c) A 152-regions rat brain atlas was applied and (d) the 3D representation of the 40 ROIs selected in this study. The color of spheres represents manually defined brain areas: Frontal (red), Temporal (blue) and Parietal (green).
Different thresholds of cross-correlation coefficients can generate graphs of different connection density. A sparsity-based approach33 with 100 random simulated networks was applied to produce a sequence of weighted adjacency matrices. As a result, a total of 96 weighted, binary matrices from sparsity range 0.05 to 1.0 with an interval of 0.01 were computed in the graph formation23.
2.4. Graph Theory Analysis
The graphical network metrics of functional brain networks were computed based on global and local network characteristics34. The global network metrics include the (1) clustering coefficient (Cp); (2) characteristic path length (Lp); (3) normalized clustering coefficient (γ = Cp_real/Cp_random, where Cp_real is the clustering coefficient for the measured data and the Cp_random represents the clustering coefficient generated by the 100 random simulated networks under the same degree of freedom); (4) normalized shortest pathlength (λ = Lp_real/Lp_random, where Lp_real is the shortest pathlength for the measured data and Lp_random represents the shortest pathlength generated by the 100 random simulated networks under the same degree of freedom); (5) small worldness (σ = γ/λ); and (6) global efficiency (Eglob). A reorganization degree (RD) was computed for each global network parameter in order to estimate the variance of the global network differences between the experimental groups (E+, E−) and control groups across all sparsity range (i = 0.05 to 1). The equation is , where A is the network parameters from the baseline group and B is the network parameters from the targeted group. A total of six RD values, specifically for Cp, Lp, Eglob, γ, λ and σ, were computed for each subject.
To access the local brain network features, node degree (Ki) and local efficiency (Enod) were computed. These nodal metrics are well-accepted parameters that reflect local network hub properties. Nodes were designated as hub nodes if its nodal degree was greater than 1 standard deviation above the average nodal degree of all nodes examined in the brain.
2.5. Statistical analysis and machine learning
2.5.1. Estimation of brain lesion volume
The volume of the brain lesion in each brain was estimated based on a prior approach described by Turzo 2012 35. The skull and scalp were firstly stripped from the T2-weighted MRI data by an automatic brain extraction tool (36, 37, https://fsl.fmrib.ox.ac.uk/fsl/fslwiki/BET). A tissue-type segmentation algorithm (36, FSL-FAST https://fsl.fmrib.ox.ac.uk/fsl/fslwiki/FAST) was then applied on the skull-stripped T2 data to separate the lesioned tissues (Fig. 1a). The quantified brain lesion areas were further confirmed by two experts (Bragin & Li). The lesion areas were mapped to the left and right hippocampus to compute the relative lesion sizes (the number of hippocampus lesion voxels / the total number of hippocampus voxels × 100%). Since the lesion data were not normally distributed, a non-parametric test (Mann-Whitney, unpaired) was used to determine if there was a difference in the brain lesion size in the total, left, and right hippocampus between the E+ and E− groups.
2.5.2. Estimation the lesion effect on network alterations
As discussed by prior studies, the brain lesion estimated from the signal intensity change in T2-weighted images has low sensitivity and specificity in a posttraumatic epilepsy model to identify differences in non-epileptic and epileptic groups 38, 39. Based on this concern, we were interested to determine if there was any effect of the brain lesion on functional network topology. For the total network changes, a one-way analysis of variance (ANOVA) and post-hoc multiple comparison with Bonferroni correction was performed to estimate the group-level averaged connectivity strength (Cs). A group-level, linear regression analysis between the total brain lesion size and the mean brain connectivity strength (Fisher’s z-transformed correlation coefficient) was computed in both E+ and E− animals.
2.5.3. Network-based Statistical Analysis
Network-based statistical analysis was performed to estimate the functional brain network changes among all groups. For the global network analysis, we considered each network’s metrics (Cp, Lp, γ, λ, σ, and Eglob) as independent variable. Multiple t-tests were conducted to test for differences between: control vs. E+, control vs. E−, and E+ vs. E− and were corrected for multiple comparisons with the false discovery rate (FDR) test (Q = 5%). For the local network parameters, the network hubs were computed in a group-level manner34, and the same statistical analysis was performed for both nodal degree and betweenness centriality, using FDR correction for multiple regions (Q=5%). An additional bootstrapping estimation 40 with 1000 replacement was computed to further validate the stability of the hubness within each group. In the bootstrapping analysis, a 95% confidence interval was used to estimate group differences. For all statistical analyses, a p <.05 was used as the criterion to test for a significant difference.
2.5.4. Classification of E+ and E− group based on brain network features.
To further identify network features to discriminate between E+ and E− rats, a two-step strategy of a classification analysis was conducted. These steps included: (1) the estimation of feature importance. The functional brain network features for testing include the total connectivity strength (Cs), Cp, Lp, γ, λ, σ, and Eglob. Data were firstly extracted based on the Sparsity (S) = 0.3 as suggested by the 90% confidence interval (CI) of the correlation coefficient 41. These selected parameters were then normalized using the 2-norm approach. A feature selection technique based on the random forest algorithm 42, which involves a combination of multiple decision tree models, was implemented. (2) Unsupervised learning using spectral clustering to classify subjects into E− and E+ groups. One of the concerns were that there are only 15 data-points in each feature (9 rats from E+ group and 6 rats from E− group). The number of samples is insufficient for a supervised, linear classification estimation. To overcome this issue, an unsupervised nonlinear classification approach was chosen. In our data analysis, spectral clustering 43 was introduced to the group samples by projecting high-dimensional features (all 7 network features) into low-dimensional embeddings (two grouped features). The computation details can be found in the Supplementary S2.
3. Results
3.1. Brain lesions effect on the hippocampal areas
We observed that the relative hippocampal lesion size at 10 days after KA injection for all experimental animals was 12.59% ± 8.42% of the entire hippocampus (Table 1). Ten KA injection animals had unilateral brain lesions within the ipsilateral (left) hippocampus. Five rats showed bilateral brain lesions within the hippocampus. The lesion size in the E+ group trended towards higher values than the E− group (15.79%±2.71% vs. 7.80%±2.81%, t(13) = 1.89, p = 0.081), but this was not significantly different, in agreement with other groups 38, 39. For the E+ group, a significant difference was found in the lesion size between the ipsilateral and contralateral hippocampus (HipL: 17.4%±2.81% vs. HipR: 1.36% ±0.90%; p<0.001), and similar results were found in the E− group (HipL: 8.88%±2.82% vs. HipR: 1.04% ±0.83%; p=0.037). We found no correlation between the time of occurrence of the first seizure and the size or bilaterality of the brain lesions (R2 = 0.16, P>0.05). These results indicate that hippocampal lesion burden is not directly associated with the development of seizures.
Table 1.
Individual hippocampal lesion size measured at 10 days after KA injection
| Group | Subject | lesion area and size (%) |
1st Seizure (weeks) |
|
|---|---|---|---|---|
| HipL | HipR | |||
| E+ | S1 | 9.98 | 0.00 | 4 |
| S2 | 8.23 | 0.00 | 3 | |
| S3 | 29.09 | 0.00 | 5 | |
| S4 | 19.79 | 6.21 | 6 | |
| S5 | 22.46 | 0.00 | 3 | |
| S6 | 9.42 | 0.00 | 5 | |
| S7 | 26.28 | 0.00 | 5 | |
| S8 | 8.19 | 0.00 | 4 | |
| S9 | 23.13 | 6.05 | 5 | |
| Mean±Std | 17.4±2.81 | 1.36±0.90 | ||
| 15.79±2.71 | ||||
| E− | S10 | 3.21 | 0.70 | Not observed |
| S11 | 17.48 | 0.00 | Not observed | |
| S12 | 11.10 | 0.00 | Not observed | |
| S13 | 13.75 | 0.00 | Not observed | |
| S14 | 7.79 | 3.34 | Not observed | |
| S15 | 13.97 | 5.17 | Not observed | |
| Mean±Std | 8.88±2.82 | 1.04±0.83 | ||
| 7.80±2.81 | ||||
| Total | Mean±Std | 12.59±8.42 | ||
3.2. Difference in functional connectivity of three groups
To visually identify the topographical network changes, the average adjacency correlation matrix of the three groups was computed and displayed over the brain (Fig. 2a-f). The value of the matrix (Pearson’s r with Fisher’s Z-transform) represents the connection probability between each ROI.
Fig. 2.

(a-c) 3D topographical representations of the functional brain networks in control, E+, and E− groups. Colors of spheres represent clusters of brain areas: Frontal (red), Temporal (blue) and Parietal (green). Lines between spheres represent the significant connection between two specific brain areas. (d-f) The group averaged adjacency matrices for the three animal groups. The adjacency matrices were mapped by the z-transferred Pearson’s r value, where the red color indicates high connectivity strength, and blue color indicates the lowest connectivity. (g-i) Representative the standard deviation maps computed from the group data. Visual analysis revealed a noticeable increase in functional connectivity in the E+ group, while E− group preserved a similar connectivity pattern compared with the control group. All three groups showed a low standard deviation while the variations in the experimental groups (E+ and E−) are more obvious. (j & k) Histograms of connectivity strength across the whole brain in control, E+, and E− animals. There was a shift towards high connectivity in both experimental groups compared to control, and this was more prominent in the E + group. (l) Quantifications of the average connectivity strength across all brain nodes considered in control, E+, and E− group. A significant difference was found between control and E+.
Compared to the E− and control groups, we observed that brain connectivity strength increased in the E+ group (Fig. 2e vs. 2f), although this was variable, as indicated by the higher standard deviation (Fig. 2h vs 2i). Both KA-treated groups revealed a shift of the total connectivity strength toward higher values compared to controls, and this was more obvious in the E+ group than the E− group (Fig. 2j & 2k). Quantitative analysis indicated a significant increase in average functional connectivity strength calculated over the entire brain in both experimental groups compared with the control group (E+: 0.64±0.24, E−: 0.48±0.26, control:0.27±0.23; One-way ANOVA: F(2,21)=5.3, p=0.014). Further comparisons revealed significantly higher connectivity strength in the E+ group compared to control (control < E+, 95%CI = −0.66 to −0.083, p=0.01), while there was no statistically significant differences in the E− group (control vs. E−, 95%CI = −0.53 to 0.11, p=0.24) (Fig. 2i).
Using linear regression analysis we found no relationship between brain lesion size and connectivity strength within either the E+ group (F(1,7) = 0.37, p = 0.56, R2 = 0.049) or the E− group (F(1,4) = 0.003, p = 0.96, R2 = 0.0006, Supplementary Fig. 1). The absence of an association between lesion size and connectivity indicates that E+/E− group differences can be ascribed to the development of epilepsy rather than merely to the presence of damage due to the lesion.
3.3. Global network features between groups
Group-level differences in global network features for clustering coefficient (Cp), shortest path length (Lp), and global efficiency (Eglob) were found (Fig. 3a-c). Changes in the network parameters were estimated by group-level comparisons (for E+ vs. control, E− vs. control and E+ vs E−) at a range of different network sparsity thresholds. The largest Cp value was observed in the E+ group (Fig. 3a), which was significantly larger across the majority of the sparsity range examined (0.14 to 1) compared to the control group, and across the range 0.33 to 1 compared to E− group. Similar results were also found in the Eglob parameters (Fig 3c). The E+ group showed a significantly lower LP compared to control in all sparsity range (Fig 3b), but E− group showed short-range (0.13–0.18) significantly lower Lp compared to the control group. All three groups revealed a clear small-worldness feature showing γ (=Cpreal/Cprandom) larger than 1 and λ (= Lpreal/Lprandom)) equals approximately to 1. The small-worldness network feature describes an ideal combination of a larger clustering coefficient (network integration) and a roughly identical shortest path length between any of the two nodes in the network (segregation of a network). Group-level differences of λ, γ, and σ values were found (Fig. 3d-f). For λ, the shortest path relative to a random network, the E+ group were significantly smaller than the control and E− group (Fig 3d, 0.12<S<0.17 and 0.37<S<1). For γ, the clustering coefficient relative to a random network, the E+ group was significantly smaller than E− for the majority of the sparsity range examined (0.05<S<0.15 and 0.23<S<0.94, Fig 3e), indicating lower network integration. There are no differences between E+ vs control and E− vs control, except at very small sparsity values (S<0.1). The ratio of these network integration and segregation values was used to compute small-worldness (σ). The data indicates that the E+ group was significantly smaller than E− group within the sparsity range of 0.29 to 0.55 and 0.87 to 0.95, as well as being smaller than control group within S from 0.76 to 0.87 (Fig 3f), indicating a less optimal network architecture in rats that will subsequently develop epilepsy.
Fig. 3.
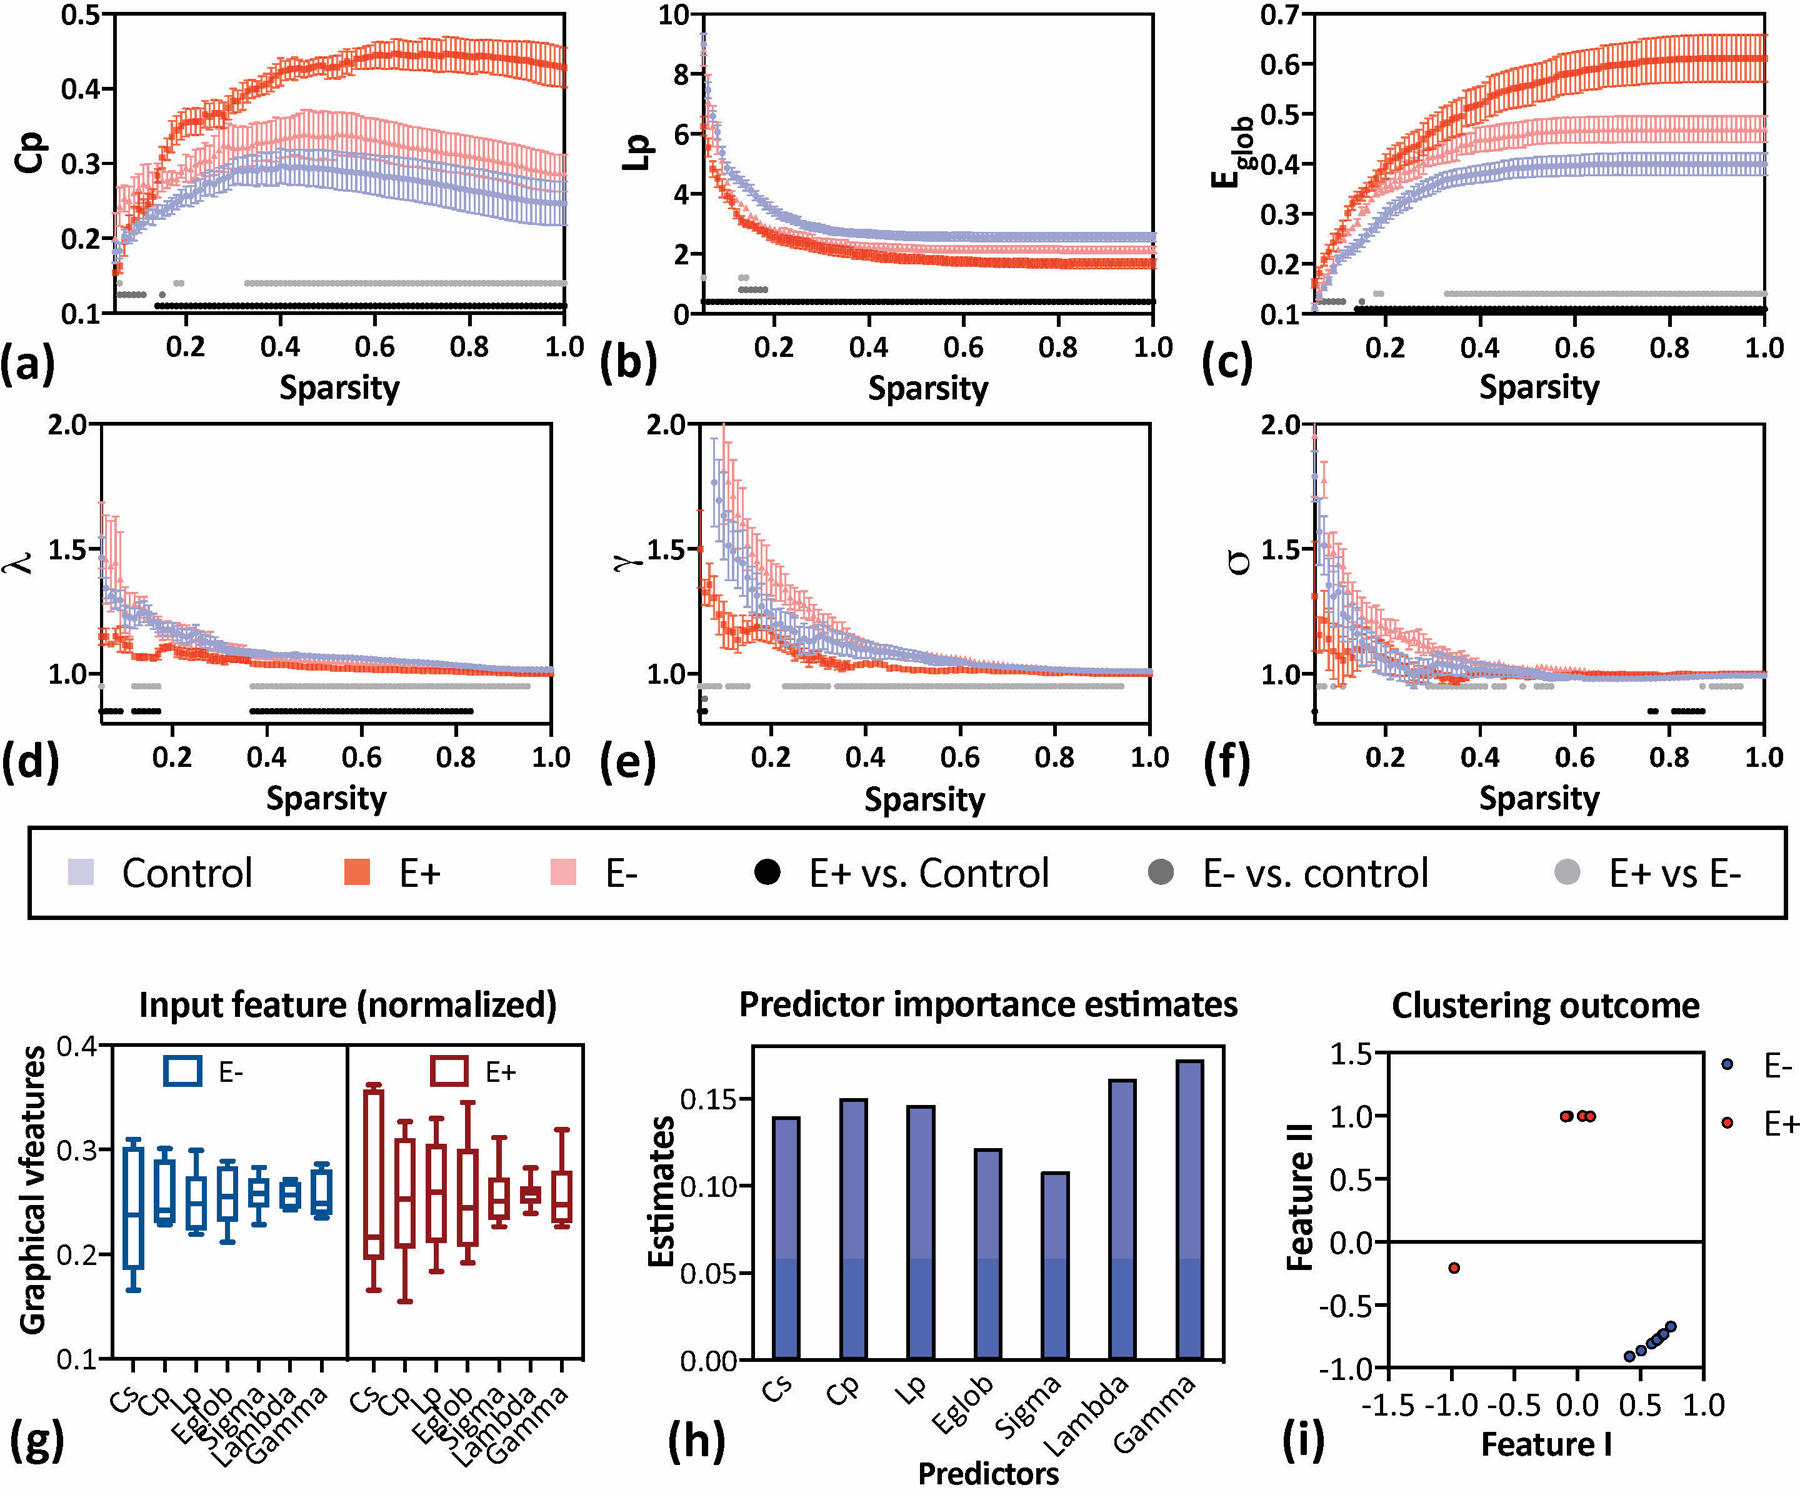
Global characteristics and small-worldness features of resting-state brain networks derived from graph theory analysis. Data are presented with mean and standard deviations for each graphic measurement along all sparsity values. (a-c) The sparsity-dependent clustering coefficient (Cp), the shortest path length (Lp), and global efficiency (Eglob) quantified from control (blue), E+ (red), and E− animals (pink). Significant differences resulting from post-hoc multi-comparisons are presented as grey/black dots along the sparsity range. Specifically, E+ animals have a larger Cp and Eglob over the majority of the sparsity range (0.14<S<1), while E− animals showed no difference to control. (d-f) The normalized characteristic path length (λ), the normalized clustering coefficient (γ), and small-worldness (σ), values quantified from the control (blue), E+ (red), and E− group (pink). Compared to the control group, the E+ group yielded the lowest small-worldness parameters over the entire sparsity range. In contrast, the E− group were not significantly different from the control group at any sparsity level. (g) The 7 selected brain network parameters used for classification. (h) The outcome of the estimation for predictor importance. Results indicated that all 7 parameters have nearly equal weights as predictors. (i) The outcome of the unsupervised learning through a spectral clustering approach. By applying a down-dimension estimation (metafeatures), the E+ and E− groups are clearly discriminated.
Differences in the global network were further evaluated using the reorganization degree between the experimental and the control groups (E+ vs. control; E− vs. control) (Table 2). Compared to the E− group, RD values were significantly larger for the E+ group in all graph metrics except γ, which yield a much stronger network reorganization.
Table 2.
Reorganization degree (RD)
| global characteristics | small-worldness features | |||||
|---|---|---|---|---|---|---|
| Cp | Lp | Eglob | λ | γ | σ | |
| E+ | 1.38±0.1 | 9.08±0.83 | 1.61±0.15 | 0.73±0.13 | 1.90±0.15 | 1.37±0.32 |
| E− | 0.42±0.15 | 4.49±0.12 | 0.62±0.01 | 0.29±0.3 | 1.39±0.68 | 0.84±0.27 |
| t=14.97, p<0.001 | t=9.15, p<0.001 | t=13.81, p<0.001 | t=3.94, p=0.01 | t=2.21, p=0.27 | t =3.33, p=0.032 | |
3.4. Classifications of E+ and E− group based on global network features
To explore the best fit to the network parameters that capture the differences between E− and E+ groups, a classification process were performed. Data from decision analysis (under a multiple decision tree model) showed no sign of a predominant network parameters; all of them were distributed relatively evenly (Figure 3h). Consequently, all of the network parameters, including Cs, Cp, Lp, γ, λ, σ, and Eglob, were considered as a combined input for step 2 - an unsupervised learning approach in the classification of E+ and E− animals. The outcome with spectrum clustering analysis in all seven features showed that two experimental groups have significantly different distributions, even when visualized within two dimensions (Figure 3i), demonstrating the fundamental different phenotypes of E+ and E− rats that can be obtained from lesioned rats before the development of epilepsy.
3.5. Local network features between groups.
In the current study, we specifically targeted 40 ROIs known to be associated with the occurrence of seizures 26, 32. We identified regional hubs using the nodal degree as our primary selection for the cross-group comparison. Local network efficiency was also computed as a secondary consideration of local network change within the experimental groups. For the hub morphological changes under the nodal degree (Fig. 4a-c), and comparing E+ and control groups, we identified an increase in hubness (ie. an enlargement of nodal degree) within the left cingulate cortex, right posterior striatum, and prelimbic cortex (Fig. 4b, pink arrows). However, there was a complete loss of nodal degree within the posterior hippocampus (Fig.4b, cyan arrows). By comparing the E− and control group, we found a significant increase in hubness within the right retrosplenial and primary motor cortices, but a decrease within the right posterior striatum (Fig.4c). With the experimental groups (E+ vs. E−), we found that prelimbic cortex, anterior and posterior striatum hubness was significantly higher in E+ animals but lower in the retrosplenial cortex and posterior hippocampus (Fig 4d). Similar comparisons were conducted for local efficiency (Fig. 4e-g), and the only difference was as a greater efficiency within the posterior hippocampus (Fig. 4g).
Fig. 4.

Topographical representations of local network metrics parameterized by nodal degree (Ki, a-c) and nodal efficiency (Enod, f-h) in control, E+ and E− groups. The spheres plotted in the 3D brain template indicated the brain areas that pass the threshold for hubness in Ki (upper plots) and Enod (bottom plots). The sphere size represents the hubness strength, the larger the size of sphere, the larger the hubness strength. Sphere colors represent clusters of brain areas: Frontal (red), Temporal (blue) and Parietal (green). For both hubness parameters, the prelimbic cortex (Prl) were found to be new hubs in the E+ rats (Fig 4b, 4g). In the E− group, we identified the primary motor cortex (M1) as new hubs compared to the control group (Fig 4c, 4h). It is also evident that in the E+ group, the ventral hippocampal area (HipP) was no longer considered to be a hub. (d) Regional group comparisons of the normalized nodal degree in E+ vs. control and E− vs. control. The red stars represent the brain areas are significantly larger in E+/E− group in comparison of control, and blue stars represent the significantly smaller. The “+” represent the comparison between E+ and E− group. Major differences between E+ vs E−, and E− vs control were showed in (Fig 4e, red arrow: increase; blue arrow: decrease). For the hubness changes under the parameters Enod (f-h), consistent results were observed except the HipPR hub (h, red square) in E− group.
The outcome stability was estimated through the “central tendency” distribution, a feature of the bootstrapping approach (Supplementary Figure S2). The group comparison was further computed on the hubness data (nodal degree). A 95% confidence interval (vertical lines in Figure S2) was used to test the hypothesis (H0: no group differences). Based on the outcome, we found that the bootstrapping analysis agreed with the results from the two-sample t-test (as summarized in Table 3 & Figure 4e), that the E+ group showed a significant increase of hubness in the striatum but decrease in prelimbic cortex and posterior hippocampus.
Table 3.
Summary of the group comparison based on the bootstrapping estimation using 95%CI.
| Cluster | Region | Results |
|---|---|---|
| Frontal | CgL | E+>Sham |
| Frontal | PrlL | E+>E−; E+>Sham |
| Frontal | PrlR | E+>E−; E+>Sham |
| Parietal | RSDR | E+<E−; E−>Sham |
| Parietal | M1R | E−>Sham; E−>E+ |
| Temporal | SaAR | E+>E−; Sham>E− |
| Temporal | SaPR | E+>E−; E+>Sham |
| Temporal | HipPL | E+<E−; E+<Sham |
| Temporal | HipPR | E+<E−; E+<Sham |
Furthermore, we specifically focused on quantifying the number of regions considered to be hubs to understand brain regional involvement within the early period of epileptogenesis (Supplementary Table S2). The number of hubs determined by Ki in the E+ group increased by 21.4% compared to the control group, and by 14.3% compared to the E− group. The number of hubs determined by Enod in the early E+ group decreased by 15.8% compared to the control group, and decreased by 10.5% compared to the E− group.
4. Discussion
This study characterizes the functional reorganization of the brain network in the early stage of epileptogenesis in the KA rat model. Using this animal model of mTLE and long-term behavioral/electrophysiological monitoring, we were able to subsequently classify the experimentally lesioned animals into those that develop epilepsy (E+) and those that do not (E−), and to compare their early time-point topographical network reorganization with uninjured controls. To our knowledge, this is the first study using resting-state fMRI to assess brain network reorganizations in E− animals. This provided an opportunity to distinguish network changes due solely to the lesion in E− rat, from those network features that are associated with the subsequent development of epileptogenesis in E+ rats. The major findings were: (1) global brain connectivity strength was preserved at control levels in E− rats while it increased in the E+ group. (2) Both experimental groups exhibited an increase in reorganization degree, but this was significantly higher in the E+ group compared to E−. In addition, while the majority of global network features in the E− group were either similar to control or trending in the opposite direction from the E+ group, the network in the E+ group was best described by increased clustering coefficient and global efficiency, and reduced shortest pathlength, resulting in a less optimal network topography through the small-worldness parameter. (3) Parameters of local network features in the E+ group were marked by a complete loss of the posterior hippocampal hubs and an increase in frontal areas, and an increase in the retrosplenial-sensorimotor areas in the E− group. (4) Although there was a difference in lesion size between the experimental groups, there was no association between lesion size and network reorganization within either group, indicating that the difference in network features between experimental groups is not simply attributable to the effect of lesion. Overall, the current study provides strong evidence of different functional brain network topography in response to the two opposite outcomes.
The intra-hippocampal KA injection mTLE model has been utilized in our group since 1999, and it has proved to be a reliable model of human HS-mTLE44–48. The mortality rate in the current study was 17%, and 67% developed epilepsy, both of which are close to what has been demonstrated in our previous study46. It remains unclear why the experimental protocol yields two outcomes (E− and E+). Looking into the lesion effect, 67% of the KA-treated rats presented with unilateral lesions, regardless of the outcome, and there were no significant group differences in total lesion size between the E− and E+ groups (p = 0.081). In addition, we also found no association between the brain lesion size and averaged brain network connection strength (Supplemental Fig. 1) in either groups of animals. As a result, lesion size is unlikely to be directly associated with the subsequent development of epilepsy, and that other factors such as reorganization of the network are more important.
One of the most prominent connectome patterns in the E+ group is the increase of global network connectivity. In line with previous studies, the connectivity changes were found to occur in the limbic areas and the prefrontal cortex15, 17, 49. An increase in connectivity strength from the epileptogenic zone to other brain areas has also been identified in patients with intractable epilepsy50. Further strengthening this association between connection strength and epilepsy is that the connectome patterns in the E− group were similar to uninjured controls (Fig. 2). Retaining higher functional connectivity is associated with poorer post-surgical outcome in the drug-refractory, focal epilepsy patient 51. The failure to preserve network connectivity at control-levels in the E+ rats may predict, indicate or occur as a consequence of epileptogenesis. Prolonged, repeated seizures/interictal spikes after KA injection are considered to be a cause of increased functional connectivity between limbic areas and other structures15. Using the same rodent model, our prior electrophysiological work has shown that the epileptogenic network involves not only the hippocampus, but also the extrahippocampal areas, such as prefrontal cortex, somatosensory cortex, and thalamus48. Moreover, no extrahippocampal areas were identified as abnormal in the E− group48, which has now been validated within the current neuroimaging study (Fig. 2). There were differences in the network integration and segregation (as embodied by small worldness) between the E+ and E− animals. Similar to the Gill et al., 2017, we observed higher network integration as indicated by a significantly higher clustering coefficient and global efficiency in the E+ groups when compared to the E− and control groups15. This finding suggested that the E+ group is marked by a hyper synchronized brain very early in the development of epilepsy and that this is associated with an unusually high information transfer efficiency.
Instead of the hypersynchrony brain network pattern, other studies have reported a suppression of connectivity in epileptogenesis in the intraperitoneal kainic acid (IPKA) rat model of TLE 16, 19. One possible reason for the differences could be the different routes of administration. The intra-hippocampal KA model results in more focal brain lesions than the IPKA model and has a more acute response than the intraperitoneal injection model20, 52. The focal lesion may result in a vast difference in the network compensation and lead to different maladaptive plasticity and local hyperexcitability. A neuroinformatic study with virtual brain simulations (VBS) and patients in drug-resistant focal epilepsy has indicated that the locally hyperexcitable node dynamics of the epileptogenic networks are associated with a wide-spread significant increase in brain connectivity18.
This exploratory study has demonstrated that a combination of seven network parameters can distinguish the difference between E+ and E− animals weeks prior to the development of epilepsy. We have shown that combining these analytics with a machine learning approach, we can provide some degree of confidence that rats can be accurately classified by group. The decision tree data indicated that it is not only one feature that discriminated between groups, but that all features share equal weight in predicting epileptogenesis by discriminating E+ from E− rats. In addition, based on the result of spectral clustering, it is clear that the linear combinations of network parameters is optimal, since the resulting distribution of the two rat group clusters are spatially discrete. This suggests that as the sample size increases, a linear classifier will be capable of more accurately predicting whether specific network parameters will separate E+ and E− rats more accurately, and thus further enhancing our ability to predict the development of epilepsy. We note, however, that there are caveats to using this approach. First, there are a limited number of data-points (n = 15). Although the resultant group differences are significant among these 15 samples, the effect of using a larger sample size that is more appropriate for this technique is unknown. Second, since the spectrum clustering method represents a linear combination of multiple features rather than specific ones, we cannot conclude from these data whether only one or a combination of functional brain network features play the most important role in the classification.
Our data for local network hubness showed notable changes such as the loss of hippocampal hubs (ventral area), and the appearance of prefrontal hubs (Prelimbic) in the E+ animals, but not the E− animals. The regional shift of hubs in E+ rats indicates a compensatory mechanism that preserves neurophysiological function in the presence of hyperexcitable pathologic epileptiform network activity18. One interesting finding is the noticeable opposite change in the nodal degree of the retrosplenial cortex (RSDR, Fig. 4) hub in the E+ (decrease, compared to control) and E− (increase, compared to control) group. An earlier study with the IPKA rat model showed that this node significantly decreased in connectivity during epileptogenesis 16. The role of retrosplenial cortex in the rat, similar to the posterior cingulate cortex in human, is that it regulates high-order functions such as spatial navigation and episodic memory53. A decrease connectivity in RSDR during epileptogenesis (E+) may result in, or be concurrent with epilepsy comorbidities, while the increased connectivity in the E− group may function to curtail the development of epilepsy. Unlike E+ rats, E− rats do not exhibit a significant change in hubness in the prelimbic cortex. Instead, the changes were found in striatal and sensorimotor areas.
In summary, the data show that the development of altered network topology occurs differently in lesioned rat that subsequently develop epilepsy compared to those that do not. Microscale alterations within local brain areas of rodent epilepsy models may provide significant insights into epileptogenic mechanisms. The robustness by which these alterations indicate developing epilepsy may be further enhanced when combined with lesioned-control rats, to ascribe the network changes solely to epilepsy, rather than simply to structural damage.
Supplementary Material
Acknowledgments
This study was supported by National Institutes of Health, USA (R01-NS065877, R01-NS033310, U54-NS100064 and RO1-NS091222), and University of North Texas Faculty Research Award (1600733).
Footnotes
DISCLOSURE
None of the authors has any conflict of interest to disclose. We confirm that we have read the Journal’s position on issues involved in ethical publication and affirm that this report is consistent with those guidelines.
Reference
- 1.Blumcke I. Neuropathology of focal epilepsies: a critical review. Epilepsy Behav 2009;15:34–39. [DOI] [PubMed] [Google Scholar]
- 2.Engel J Jr. Mesial temporal lobe epilepsy: what have we learned? Neuroscientist 2001;7:340–352. [DOI] [PubMed] [Google Scholar]
- 3.Thom M. Review: Hippocampal sclerosis in epilepsy: a neuropathology review. Neuropathol Appl Neurobiol 2014;40:520–543. [DOI] [PMC free article] [PubMed] [Google Scholar]
- 4.Ji GJ, Zhang Z, Zhang H, Wang J, Liu DQ, Zang YF, Liao W, Lu G. Disrupted causal connectivity in mesial temporal lobe epilepsy. PLoS One 2013;8:e63183. [DOI] [PMC free article] [PubMed] [Google Scholar]
- 5.Tracy JI, Doucet GE. Resting-state functional connectivity in epilepsy: growing relevance for clinical decision making. Curr Opin Neurol 2015;28:158–165. [DOI] [PubMed] [Google Scholar]
- 6.Kobayashi E, Bagshaw AP, Benar CG, Aghakhani Y, Andermann F, Dubeau F, Gotman J. Temporal and extratemporal. BOLD responses to temporal lobe interictal spikes Epilepsia 2006;47:343–354. [DOI] [PubMed] [Google Scholar]
- 7.Bartolomei F, Chauvel P, Wendling F. Epileptogenicity of brain structures in human temporal lobe epilepsy: a quantified study from intracerebral EEG. Brain 2008;131:1818–1830. [DOI] [PubMed] [Google Scholar]
- 8.Haneef Z, Lenartowicz A, Yeh HJ, Engel J Jr., Stern JM. Effect of lateralized temporal lobe epilepsy on the default mode network. Epilepsy Behav 2012;25:350–357. [DOI] [PMC free article] [PubMed] [Google Scholar]
- 9.Luo C, Li Q, Lai Y, Xia Y, Qin Y, Liao W, Li S, Zhou D, Yao D, Gong Q. Altered functional connectivity in default mode network in absence epilepsy: a resting-state fMRI study. Hum Brain Mapp 2011;32:438–449. [DOI] [PMC free article] [PubMed] [Google Scholar]
- 10.Laufs H, Hamandi K, Salek-Haddadi A, Kleinschmidt AK, Duncan JS, Lemieux L. Temporal lobe interictal epileptic discharges affect cerebral activity in “default mode” brain regions. Hum Brain Mapp 2007;28:1023–1032. [DOI] [PMC free article] [PubMed] [Google Scholar]
- 11.Reddy SD, Younus I, Sridhar V, Reddy DS. Neuroimaging Biomarkers of Experimental Epileptogenesis and Refractory Epilepsy. Int J Mol Sci 2019;20:220. [DOI] [PMC free article] [PubMed] [Google Scholar]
- 12.Stacey WCKMA, Gunnarsdottir KM, et al. Emerging roles of network analysis for epilepsy. Epilepsy research 2020;159:106255. [DOI] [PMC free article] [PubMed] [Google Scholar]
- 13.van Vliet EA, Dedeurwaerdere S, Cole AJ, Friedman A, Koepp MJ, Potschka H, Immonen R, Pitkanen A, Federico P. WONOEP appraisal: Imaging biomarkers in epilepsy. Epilepsia 2017;58:315–330. [DOI] [PubMed] [Google Scholar]
- 14.Sheybani L, Birot G, Contestabile A, Seeck M, Kiss JZ, Schaller K, Michel CM, Quairiaux C. Electrophysiological Evidence for the Development of a Self-Sustained Large-Scale Epileptic Network in the Kainate Mouse Model of Temporal Lobe Epilepsy. J Neurosci 2018;38:3776–3791. [DOI] [PMC free article] [PubMed] [Google Scholar]
- 15.Gill RS, Mirsattari SM, Leung LS. Resting state functional network disruptions in a kainic acid model of temporal lobe epilepsy. NeuroImage Clinical 2017;13:70–81. [DOI] [PMC free article] [PubMed] [Google Scholar]
- 16.Christiaen E, Goossens MG, Raedt R, Descamps B, Larsen LE, Craey E, Carrette E, Vonck K, Boon P, Vanhove C. Alterations in the functional brain network in a rat model of epileptogenesis: A longitudinal resting state fMRI study. Neuroimage 2019;202:116144. [DOI] [PubMed] [Google Scholar]
- 17.Bertoglio D, Jonckers E, Ali I, Verhoye M, Van der Linden A, Dedeurwaerdere S. In vivo measurement of brain network connectivity reflects progression and intrinsic disease severity in a model of temporal lobe epilepsy. Neurobiol Dis 2019;127:45–52. [DOI] [PubMed] [Google Scholar]
- 18.Courtiol J, Guye M, Bartolomei F, Petkoski S, Jirsa VK. Dynamical Mechanisms of Interictal Resting-State Functional Connectivity in Epilepsy. J Neurosci 2020;40:5572–5588. [DOI] [PMC free article] [PubMed] [Google Scholar]
- 19.Christiaen E, Goossens MG, Descamps B, Larsen LE, Boon P, Raedt R, Vanhove C. Dynamic functional connectivity and graph theory metrics in a rat model of temporal lobe epilepsy reveal a preference for brain states with a lower functional connectivity, segregation and integration. Neurobiol Dis 2020;139:104808. [DOI] [PubMed] [Google Scholar]
- 20.Chen N, Liu C, Yan N, Hu W, Zhang JG, Ge Y, Meng FG. A macaque model of mesial temporal lobe epilepsy induced by unilateral intrahippocampal injection of kainic Acid. PLoS One 2013;8:e72336. [DOI] [PMC free article] [PubMed] [Google Scholar]
- 21.Dugladze T, Vida I, Tort AB, Gross A, Otahal J, Heinemann U, Kopell NJ, Gloveli T. Impaired hippocampal rhythmogenesis in a mouse model of mesial temporal lobe epilepsy. Proc Natl Acad Sci U S A 2007;104:17530–17535. [DOI] [PMC free article] [PubMed] [Google Scholar]
- 22.He Y, Evans A. Graph theoretical modeling of brain connectivity. Curr Opin Neurol 2010;23:341–350. [DOI] [PubMed] [Google Scholar]
- 23.Bullmore ETSO. Complex brain networks: graph theoretical analysis of structural and functional systems Nature Reviews. Neuroscience 2009;10:186–198. [DOI] [PubMed] [Google Scholar]
- 24.Yan CG, Wang XD, Zuo XN, Zang YF. DPABI: Data Processing & Analysis for (Resting-State) Brain Imaging. Neuroinformatics 2016;14:339–351. [DOI] [PubMed] [Google Scholar]
- 25.Chaogan YYZ. DPARSF: a MATLAB toolbox for “pipeline” data analysis of resting-state fMRI Frontiers in Systems. Neuroscience 2010;4:13. [DOI] [PMC free article] [PubMed] [Google Scholar]
- 26.Valdeshernandez PASA, Nonaka H, et al. An in vivo MRI Template Set for Morphometry, Tissue Segmentation, and fMRI Localization in Rats. Frontiers in Neuroinformatics 2011;5:26. [DOI] [PMC free article] [PubMed] [Google Scholar]
- 27.Harris NG, Verley DR, Gutman BA, Sutton RL. Bi-directional changes in fractional anisotropy after experiment TBI: Disorganization and reorganization? Neuroimage 2016;133:129–143. [DOI] [PMC free article] [PubMed] [Google Scholar]
- 28.Biswal BBYFZ, Haughton VM, et al. Functional connectivity in the motor cortex of resting human brain using echo-planar MRI Magnetic. Resonance in Medicine 1995;34:537–541. [DOI] [PubMed] [Google Scholar]
- 29.Lowe MJMBJ, Sorenson JA, et al. . Functional connectivity in single and multislice echoplanar imaging using resting-state fluctuations. Neuroimage 1998;7:119–132. [DOI] [PubMed] [Google Scholar]
- 30.He Y, Chen ZJ, Evans AC. Small-world anatomical networks in the human brain revealed by cortical thickness from MRI. Cereb Cortex 2007;17:2407–2419. [DOI] [PubMed] [Google Scholar]
- 31.Valdes-Hernandez PA, Sumiyoshi A, Nonaka H, Haga R, Aubert-Vasquez E, Ogawa T, Iturria-Medina Y, Riera JJ, Kawashima R. An in vivo MRI Template Set for Morphometry, Tissue Segmentation, and fMRI Localization in Rats. Front Neuroinform 2011;5:26. [DOI] [PMC free article] [PubMed] [Google Scholar]
- 32.Xia M, Wang J, He Y. BrainNet Viewer: a network visualization tool for human brain connectomics. PLoS One 2013;8:e68910. [DOI] [PMC free article] [PubMed] [Google Scholar]
- 33.Niu H, Wang J, Zhao T, Shu N, He Y. Revealing topological organization of human brain functional networks with resting-state functional near infrared spectroscopy. PLoS One 2012;7:e45771. [DOI] [PMC free article] [PubMed] [Google Scholar]
- 34.He YEA. Graph theoretical modeling of brain connectivity. Current Opinion in Neurology 2010;23:341–350. [DOI] [PubMed] [Google Scholar]
- 35.Turtzo LC, Budde MD, Gold EM, Lewis BK, Janes L, Yarnell A, Grunberg NE, Watson W, Frank JA. The evolution of traumatic brain injury in a rat focal contusion model. NMR Biomed 2013;26:468–479. [DOI] [PMC free article] [PubMed] [Google Scholar]
- 36.Smith SM. Fast robust automated brain extractio. Human Brain Mapping 2002;17:143–155. [DOI] [PMC free article] [PubMed] [Google Scholar]
- 37.M. Jenkinson MP, and Smith S. BET2: MR-based estimation of brain, skull and scalp surfaces In Eleventh Annual Meeting of the Organization for. Human Brain Mapping 2005. [Google Scholar]
- 38.Immonen R, Smith G, Brady RD, Wright D, Johnston L, Harris NG, Manninen E, Salo R, Branch C, Duncan D, Cabeen R, Ndode-Ekane XE, Gomez CS, Casillas-Espinosa PM, Ali I, Shultz SR, Andrade P, Puhakka N, Staba RJ, O’Brien TJ, Toga AW, Pitkanen A, Grohn O. Harmonization of pipeline for preclinical multicenter MRI biomarker discovery in a rat model of post-traumatic epileptogenesis. Epilepsy Res 2019;150:46–57. [DOI] [PMC free article] [PubMed] [Google Scholar]
- 39.Shultz SRCL, Liu YR, et al. Can structural or functional changes following traumatic brain injury in the rat predict epileptic outcome? Epilepsia 2013;54:1240–1250. [DOI] [PMC free article] [PubMed] [Google Scholar]
- 40.Efron B, Tibshirani R. Bootstrap Methods for Standard Errors, Confidence Intervals, and Other Measures of Statistical Accuracy. Statist Sci 1986;1:54–75. [Google Scholar]
- 41.Liu Z, Ke L, Liu H, Huang W, Hu Z. Changes in topological organization of functional PET brain network with normal aging. PLoS One 2014;9:e88690. [DOI] [PMC free article] [PubMed] [Google Scholar]
- 42.Breiman L. Random Forests Machine Learning 2001;45:5–32. [Google Scholar]
- 43.von Luxburg U. A tutorial on spectral clustering. Statistics and Computing 2007;17:395–416. [Google Scholar]
- 44.Bragin A, Engel J Jr., Wilson CL, Fried I, Mathern GW. Hippocampal and entorhinal cortex high-frequency oscillations (100−-500 Hz) in human epileptic brain and in kainic acid--treated rats with chronic seizures. Epilepsia 1999;40:127–137. [DOI] [PubMed] [Google Scholar]
- 45.Bragin A, Wilson CL, Engel J Jr. Rate of interictal events and spontaneous seizures in epileptic rats after electrical stimulation of hippocampus and its afferents. Epilepsia 2002;43 Suppl 5:81–85. [DOI] [PubMed] [Google Scholar]
- 46.Bragin A, Azizyan A, Almajano J, Wilson CL, Engel J, Jr. Analysis of chronic seizure onsets after intrahippocampal kainic acid injection in freely moving rats. Epilepsia 2005;46:1592–1598. [DOI] [PubMed] [Google Scholar]
- 47.Bragin A, Wilson CL, Engel J Jr. Voltage depth profiles of high-frequency oscillations after kainic acid-induced status epilepticus. Epilepsia 2007;48 Suppl 5:35–40. [DOI] [PubMed] [Google Scholar]
- 48.Li L, Patel M, Almajano J, Engel J Jr., Bragin A. Extrahippocampal high-frequency oscillations during epileptogenesis. Epilepsia 2018;59:e51–e55. [DOI] [PMC free article] [PubMed] [Google Scholar]
- 49.Pirttimaki T, Salo RA, Shatillo A, Kettunen MI, Paasonen J, Sierra A, Jokivarsi K, Leinonen V, Andrade P, Quittek S, Pitkanen A, Grohn O. Implantable RF-coil with multiple electrodes for long-term EEG-fMRI monitoring in rodents. Journal of neuroscience methods 2016;274:154–163. [DOI] [PubMed] [Google Scholar]
- 50.Bandt SK, Besson P, Ridley B, Pizzo F, Carron R, Regis J, Bartolomei F, Ranjeva JP, Guye M. Connectivity strength, time lag structure and the epilepsy network in resting-state fMRI. NeuroImage Clinical 2019;24:102035. [DOI] [PMC free article] [PubMed] [Google Scholar]
- 51.Lagarde S, Roehri N, Lambert I, Trebuchon A, McGonigal A, Carron R, Scavarda D, Milh M, Pizzo F, Colombet B, Giusiano B, Medina Villalon S, Guye M, Benar CG, Bartolomei F. Interictal stereotactic-EEG functional connectivity in refractory focal epilepsies. Brain 2018;141:2966–2980. [DOI] [PubMed] [Google Scholar]
- 52.Antonucci F, Bozzi Y, Caleo M. Intrahippocampal infusion of botulinum neurotoxin E (BoNT/E) reduces spontaneous recurrent seizures in a mouse model of mesial temporal lobe epilepsy. Epilepsia 2009;50:963–966. [DOI] [PubMed] [Google Scholar]
- 53.Vann SD, Aggleton JP, Maguire EA. What does the retrosplenial cortex do? Nat Rev Neurosci 2009;10:792–802. [DOI] [PubMed] [Google Scholar]
Associated Data
This section collects any data citations, data availability statements, or supplementary materials included in this article.