

ABSTRACT
Gram-positive methicillin-resistant Staphylococcus aureus (MRSA) is an emerging cause of hospital-associated urinary tract infections (UTI), especially in catheterized individuals. Despite being rare, MRSA UTI are prone to potentially life-threatening exacerbations such as bacteremia that can be refractory to routine antibiotic therapy. To delineate the molecular mechanisms governing MRSA urinary pathogenesis, we exposed three S. aureus clinical isolates, including two MRSA strains, to human urine for 2 h and analyzed virulence characteristics and changes in gene expression. The in vitro virulence assays showed that human urine rapidly alters adherence to human bladder epithelial cells and fibronectin, hemolysis of sheep red blood cells (RBCs), and surface hydrophobicity in a staphylococcal strain-specific manner. In addition, transcriptome sequencing (RNA-Seq) analysis of uropathogenic strain MRSA-1369 revealed that 2-h-long exposure to human urine alters MRSA transcriptome by modifying expression of genes encoding enzymes catalyzing metabolic pathways, virulence factors, and transcriptional regulators. In summary, our results provide important insights into how human urine specifically and rapidly alters MRSA physiology and facilitates MRSA survival in the nutrient-limiting and hostile urinary microenvironment.
IMPORTANCE Methicillin-resistant Staphylococcus aureus (MRSA) is an uncommon cause of urinary tract infections (UTI) in the general population. However, it is important to understand MRSA pathophysiology in the urinary tract because isolation of MRSA in urine samples often precedes potentially life-threatening MRSA bacteremia. In this report, we describe how exposure to human urine alters MRSA global gene expression and virulence. We hypothesize that these alterations may aid MRSA in acclimating to the nutrient-limiting, immunologically hostile conditions within the urinary tract leading to MRSA UTI.
KEYWORDS: MRSA, RNA-Seq, Staphylococcus aureus, UTI, transcriptome analysis, urinary tract infection, virulence
INTRODUCTION
Gram-positive pathogen Staphylococcus aureus is an emerging cause of urinary tract infections (UTI) representing 1% of uncomplicated cases and 3% of complicated cases associated with the physical obstruction of the urinary tract (1). Urinary catheterization is the single most important predisposing factor for persistent S. aureus colonization of the urinary tract that substantially increases the risk of symptomatic UTI and potentially life-threatening, invasive sequelae such as bacteremia, endocarditis, and septic shock (2–4). In addition, up to 20% of S. aureus catheter-associated UTI (CAUTI) are caused by methicillin-resistant S. aureus (MRSA), which are resistant to routine antibiotic therapy (5). Hence, defining the complex interactions between host immune defenses and pathogen virulence effectors during the course of MRSA UTI is a clinically relevant research area despite relatively low prevalence of MRSA UTI.
Previous experiments have identified bacterial virulence factors central to the urinary pathogenesis of S. aureus. Examination of S. aureus isolated from catheterized patients has revealed that ∼80% of the clinical isolates form biofilm, a virulence characteristic associated with the presence of icaA and icaD genes encoding polysaccharide capsule (6). The trace metal nickel/cobalt transporter systems are implicated in the urinary fitness and virulence of S. aureus due to the involvement of nickel as a cofactor in urease enzyme activity (7, 8). MRSA infection is shown to exacerbate catheterization-induced bladder inflammation in a mouse model by inducing prolonged production of potent pro-inflammatory cytokines (interleukin 1-alpha [IL-1α], IL-1β, IL-6, IL-17, and tumor necrosis factor alpha [TNF-α]) and the recruitment of macrophages and neutrophils (9). It has also been observed that MRSA facilitates bladder colonization by inducing accumulation of host protein fibrinogen on urinary catheters, to which it adheres via surface adhesins, clumping factors A and B (ClfA, ClfB) (9). Collectively, these studies have identified virulence factors that afford survival advantage to MRSA inside the urinary tract and immune responses that defend the host. However, these studies were not designed to define the pleiotropic effects of urinary microenvironment on MRSA physiology, which is the main objective of our project.
To delineate complex mechanisms regulating the survival of uropathogens in the human urinary tract and their ability to cause UTI, the ideal experimental setup would be to examine bacterial transcriptome and proteome in real time through different stages of UTI in a human host. Given the obvious impracticability of this setup, we explored a more practical alternative and analyzed MRSA physiology in human urine (HU) in vitro. We used three S. aureus strains, including MRSA-1369 and PUTS-1, which are clinical isolates from urine (9), and USA300, which has emerged in the last 2 decades as the predominant community-associated MRSA strain in the United States (10). We used in vitro virulence assays to compare these strains exposed to HU with control in nutrient-rich culture medium. In addition, we used RNA sequencing (RNA-Seq) to compare global transcriptomic profiles of MRSA-1369 exposed for 2 h to HU or nutrient-rich tryptic soy broth (TSB). Our results reveal that in addition to myriad metabolic adaptations necessary for survival in nutrient-limiting conditions in urine, staphylococci in human urine also exhibit changes in virulence characteristics such as adherence to uroepithelial cells and extracellular matrix (ECM) protein fibronectin, hydrophobicity, and hemolysis. We present results from experiments where staphylococci were exposed to healthy female urine; however, in initial experiments, we confirmed that exposure to male or female urine affected MRSA-1369 adherence to human bladder epithelial cells and transcription of specific MRSA-1369 genes in a similar manner.
Overall, our study provides important insights into the effects of urinary microenvironment on MRSA physiology. However, we acknowledge important limitations that changes in mRNA transcripts do not guarantee corresponding changes in protein levels and that examination of MRSA virulence at early time points following in vitro exposure to HU provides a predictive snapshot into changes in MRSA physiology during initial phases of in vivo urinary tract colonization. The future research aimed at addressing these caveats will have to focus on examining transcriptomes and proteomes of both host and MRSA from bladder and kidney tissues at different time points after experimental induction of ascending UTI in a mouse model. In addition, identified correlations between human urine-mediated changes in virulence characteristics and the changes in gene expression must be confirmed in the future by comparing specific gene deletion mutants with the wild type (WT) in both in vitro and in vivo setups.
RESULTS
S. aureus strains grow in human urine.
We compared CFU in TSB control and in human urine (HU) at different time points up to 24 h to confirm that MRSA-1369, PUTS-1, and USA300 were not inhibited by human urine (Fig. 1). To minimize nutrient carryover from TSB to HU in our growth curve experiments, overnight cultures of S. aureus in TSB were washed with sterile phosphate-buffered saline (PBS) before inoculating ≤106 CFU/ml in fresh TSB, HU, or RPMI. MRSA-1369 and USA300 cultivated in HU grew more slowly than did respective controls in nutrient-rich TSB, although this change was not significant statistically. In contrast, PUTS-1 doubling time (DT) was similar in TSB control (DT = 30 ± 9 min) and in HU (DT = 28 ± 4 min). Compared to that of PUTS-1 in HU (DT = 28 ± 4 min), the DT of MRSA-1369 in HU (85 ± 47 min) was 3-fold higher, while that of USA300 (DT = 44 ± 11 min) was 1.6-fold higher, although these differences were also not statistically significant. These results are similar to those reported by Walker et al. (9).
FIG 1.
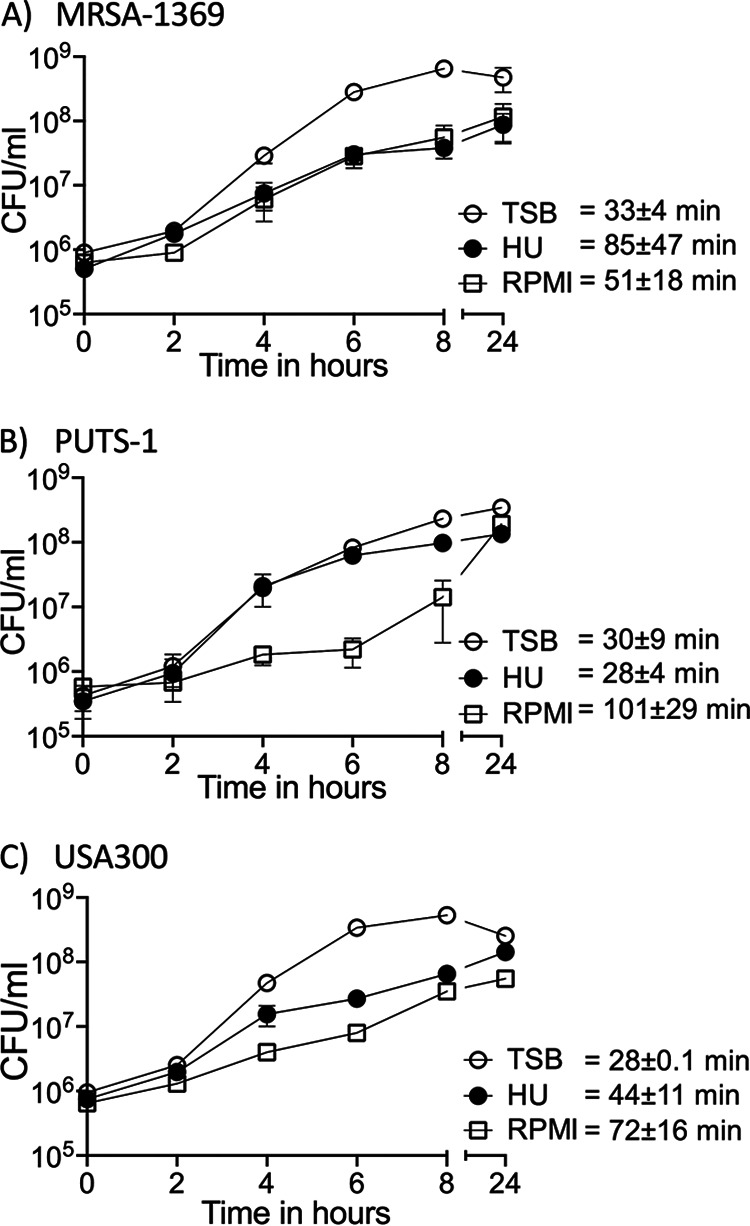
S. aureus strains are able to grow in human urine. (A) MRSA-1369, (B) PUTS-1, and (C) USA300 were cultivated in TSB, HU, or base RPMI. Bacterial growth was monitored by CFU enumeration over a period of 24 h. For each time point, average CFU/ml (two biological replicates) ± standard deviation (SD) is shown. Also shown is average doubling time ± SD for each strain in TSB, HU, or base RPMI.
We also examined growth of all strains in base RPMI, which was used as control medium in bladder epithelial cell adherence assay. Compared to that in TSB control, doubling time for RPMI cultures was 1.5-fold (P = 0.3) higher in MRSA-1369, 3.4-fold higher (P = 0.08) for PUTS-1, and 2.5-fold higher (P = 0.06) for USA300. In separate experiments, staphylococci cultivated in human urine for 24 h and then subcultured 1:100 in fresh HU showed robust growth for 24 h post-subculture, further confirming that nutrient carryover between TSB and HU did not aid bacterial growth (data not shown).
Effects of human urine on the virulence characteristics of S. aureus strains.
Staphylococci produce a large arsenal of virulence factors to facilitate their colonization, persistence, and dissemination within the host and for evasion of immune defenses. Hence, in the next set of experiments, we examined the effects of 2-h-long exposure to HU on staphylococcal virulence.
Bacterial adherence is the first crucial step in an infection, as it facilitates colonization and subsequent invasion across the mucosal barrier. We compared S. aureus strains in HU with the control for the ability to adhere to the 5637 human bladder epithelial cell line (Fig. 2) and to ECM proteins fibrinogen and fibronectin (Fig. 3). We observed that in comparison to preexposure to TSB (control), preexposure to HU for 2 h did not affect adherence of MRSA1369, PUTS-1, or USA300 to bladder epithelial cells (Fig. 2A to C). We then tested S. aureus bladder epithelial adherence in a more life-like simulated bladder microenvironment setup wherein 5637 cells were overlaid with either human urine or base RPMI as described previously (11). Here, log-phase cultures of staphylococci were washed in sterile PBS before simulated bladder microenvironment was infected in the presence of either RPMI or HU. HU significantly increased adherence of MRSA strains MRSA-1369 and USA300 to bladder epithelial cells (Fig. 2D and F). In contrast, percent adherence for PUTS-1 in HU was significantly reduced compared to the percent adherence of the RPMI control (Fig. 2E). Of note, urine from healthy male volunteers also significantly induced adherence of MRSA-1369 to 5637 bladder epithelial cells (data not shown). When preexposed to HU for 2 h, all three strains showed modest but statistically insignificant reduction in fibrinogen binding (Fig. 3A to C). In contrast, HU preexposure significantly reduced fibronectin binding by MRSA1369, PUTS-1, and USA300 (Fig. 3D to F). The amount of fibrinogen/fibronectin was chosen based on our previous publication examining staphylococcal binding to fibronectin using same in vitro binding assay protocol (12); Walker et al. have also shown that a similarly low concentration of fibrinogen (18.5 μg/ml) induces staphylococcal agglutination (13).
FIG 2.
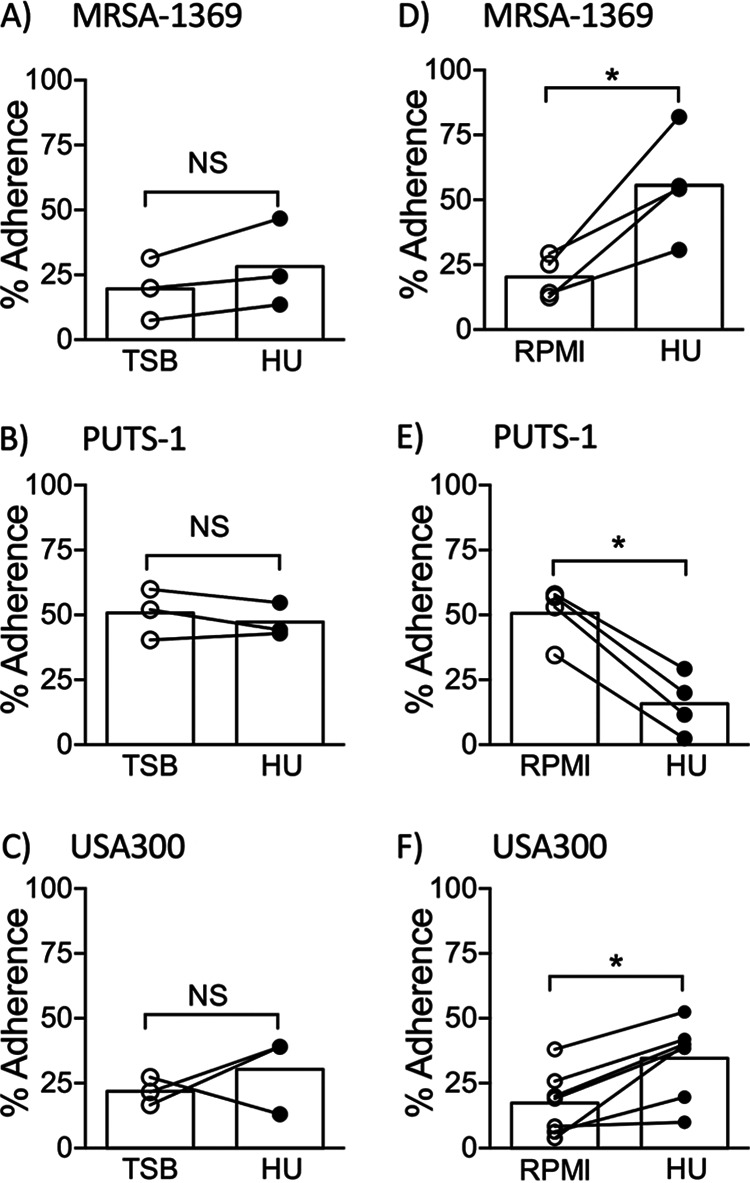
Human urine alters S. aureus adherence to human bladder epithelial cells in a strain-dependent manner. (A) MRSA-1369, (B) PUTS-1, and (C) USA300 preexposed to TSB or HU for 2 h were added to the monolayers of 5637 human bladder epithelial cell line. In separate experiments, (D) MRSA-1369, (E) PUTS-1, and (F) USA300 were added to 5637 monolayers overlaid with base RPMI (control) or HU. After 2-h-long incubation at 37°C, cell-adherent bacteria were enumerated. Percent adherence for biological replicates (each with two or more technical replicates) is reported as scatter diagram with mean shown as histogram. Statistical significance was determined by paired t test. For all figures, * refers to P < 0.05. NS, not significant.
FIG 3.
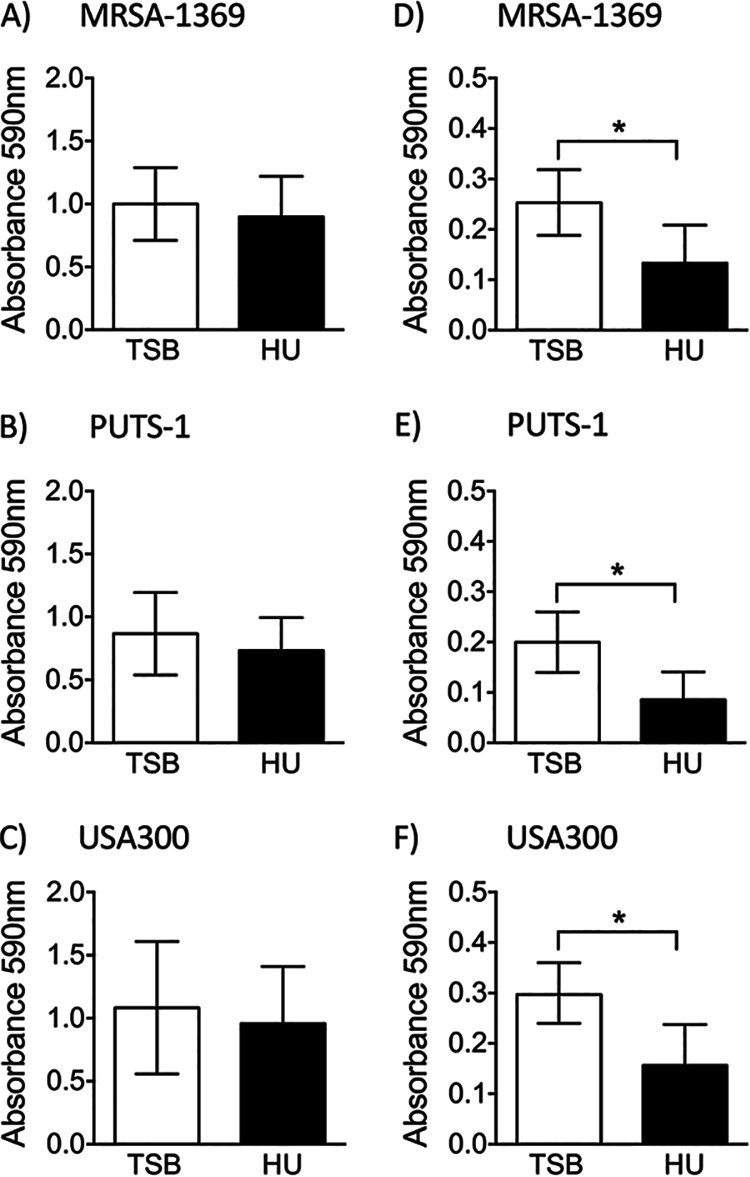
Human urine reduces staphylococcal adherence to ECM proteins. S. aureus strains preexposed to either TSB or HU for 2 h were incubated in plates coated with human fibrinogen (A to C) or human fibronectin (D to F). After vigorous washing, adherent bacteria were quantified by crystal violet staining and measurement of absorbance at 590 nm. Mean absorbance ± SD values were compared by paired t test.
Next, we used microbial adhesion to hydrocarbons test (MATH) (14) to analyze changes in staphylococcal surface hydrophobicity induced by HU. In this assay, TSB control and HU preexposed S. aureus strains were mixed with a hydrocarbon, hexadecane. At the end of 30 min incubation time, bacteria present in the aqueous phase were enumerated to estimate hydrophobicity. Significantly lower numbers of HU-exposed MRSA-1369 in comparison to those of the control were found in the aqueous phase, indicating that human urine increases hydrophobicity of MRSA-1369 (Fig. 4A). Reduction in surface hydrophobicity is an important immune evasion mechanism used by staphylococci to avoid killing by antimicrobial peptides (15); however, we did not observe corresponding changes in the killing of MRSA-1369 by human cathelicidin, LL37 (data not shown). Exposure to HU did not significantly alter surface hydrophobicity of either PUTS-1 (Fig. 4B) or USA300 (Fig. 4C).
FIG 4.

Effects of human urine on S. aureus hydrophobicity. Following preexposure to either TSB or human urine (HU), surface hydrophobicity was quantified for (A) MRSA-1369, (B) PUTS-1, and (C) USA300. Percent hydrophobicity (with average shown as histogram) is reported. Statistical significance was determined by paired t test.
S. aureus secretes numerous cytolytic toxins to target and kill mammalian cells by damaging their plasma membrane. The cytolytic activity contributes to pathogenesis by helping MRSA evade phagocyte-mediated killing (16). To visualize whether exposure to human urine alters staphylococcal cytolytic activity, we incubated 2-fold dilutions of S. aureus strains (starting from 108 CFU/ml) preexposed for 2 h to either HU or TSB control with sheep red blood cells (RBCs) at 37°C. After incubation, we quantified hemoglobin released in the supernatant spectrophotometrically. Both MRSA-1369 (Fig. 5A) and USA300 (Fig. 5C) preexposed to HU exhibited ∼1.5-fold higher hemolysis compared to that of TSB controls. In a striking contrast, control PUTS-1 exhibited very low hemolysis activity, which was not altered by preexposure to HU (Fig. 5B).
FIG 5.

Human urine induces lysis of sheep RBCs by S. aureus in a strain-dependent manner. Mid-log cultures of (A) MRSA-1369, (B) PUTS-1, and (C) USA300 were cultivated for 2 h in either TS broth (TSB) or human urine (HU). Two-fold dilutions of bacteria (from 108 CFU/ml to 1.25 × 10⁷ CFU/ml) were then incubated with sheep RBCs for 2 h at 37°C. Intact RBCs were centrifuged. The absorbance at 420 nm of supernatant was reported as percentage of total hemolysis (induced by Triton X-100 treatment). Average percent hemolysis (at least three biological replicates, each with at least two technical replicates) ± SD is reported. Statistical significance was determined by paired t test.
Staphylococcal cell wall homeostasis involves two competing processes, namely, cell wall synthesis governed by cell wall synthesizing enzymes (also known as penicillin-binding proteins) and autolysis regulated by murein hydrolases (also known as autolysins). S. aureus autolysis is upregulated in response to adverse physiological conditions, including exposure to cell wall inhibitor β lactam antibiotics (17). We did not observe significant changes in autolysis in any of the staphylococcal strains following 2-h-long cultivation in HU (data not shown).
Effects of human urine on the gene expression in S. aureus strains.
Using quantitative real-time PCR (qRT-PCR), we compared expression of select genes from MRSA-1369, PUTS-1, and USA300 following exposure to human urine for 2 h (Fig. 6). The genes selected for this analysis include virulence genes atl (encoding autolysin), clfAB (encoding clumping factor A and B), fib (encoding fibrinogen-binding protein), fnbA (encoding fibronectin-binding protein A), and hla (encoding hemolysin) and transcriptional regulators agrC (encoding accessory gene regulator) and sarA (encoding staphylococcal accessory regulator). Genes that were 2-fold up- or downregulated (marked by dotted lines in Fig. 6) were considered significant. As shown in Fig. 6A, HU altered in a strain-specific manner the expression of agrC, clfA, fib (≥2-fold altered in PUTS-1, unchanged in others), and hla (≥3-fold upregulated in MRSA-1369 and USA300, 2.3-fold upregulated in PUTS-1). In contrast, the expression of clfB and fnbA was downregulated by human urine to a similar extent in all three S. aureus strains (Fig. 6A). Similar to qRT-PCR results from female urine, exposure of MRSA-1369 to HU from male volunteers significantly suppressed expression of sarA, clfB, and fnbA while significantly inducing hla expression (data not shown).
FIG 6.
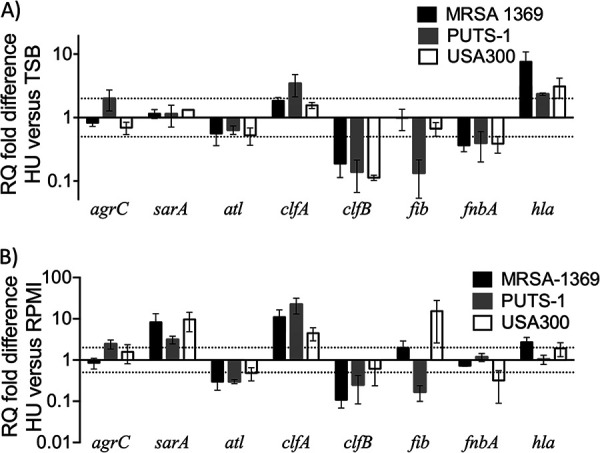
qRT-PCR results for S. aureus strains following cultivation in human urine. We used quantitative real-time PCR with normalization to 16S rRNA to determine mRNA transcript levels for specific virulence and associated genes (indicated on x axis) in MRSA-1369, PUTS-1, and USA300 following 2-h-long exposure to TSB or HU (A) or for MRSA-1369 exposed to RPMI and HU (B). RQ values were calculated by comparative threshold cycle (ΔΔCT) algorithm. RQ fold differences over transcript levels from TSB control (A) or RPMI control (B) are presented as the average of at least two biological replicates (each with three technical repeats) ± standard deviation. Dotted lines indicate 2-fold up- or down-regulation.
To delineate changes in gene expression during epithelial adherence experiment where we exposed staphylococci to HU or RPMI, we analyzed gene expression in staphylococci exposed for 2 h to HU relative to that in RPMI control (Fig. 6B). Relative to RPMI control, HU-exposed staphylococci showed ≥2-fold increased transcription of sarA, clfA, and hla (hla transcription unchanged in PUTS-1) and ≥2-fold decreased transcription of atl and clfB (Fig. 6B). In contrast, relative to that in RPMI control, fib was upregulated in HU-exposed USA300 and MRSA1369 and downregulated in HU-exposed PUTS-1 (Fig. 6B).
RNA-Seq and read mapping.
We used RNA-Seq to quantify differential gene expression by assessing variation across the transcriptome for MRSA-1369 cultivated in human urine versus that in TSB control. MRSA-1369 was selected for RNA-Seq analysis because it is a clinical isolate from a patient suffering from CAUTI (9). RNA was isolated from three independent biological replicates in each treatment. Whole-transcriptome sequencing with rRNA depletion resulted in an average of 25.2 million 150-bp paired-end reads per sample (range: 21.6 to 31.0 million reads). After adapter trimming and quality filtering, we retained an average of 96.1% of reads (95.4 to 97%) per library. Subsequently, an average of 24.1 million reads (20.6 to 30 million reads) per library were successfully mapped to the methicillin-resistant Staphylococcus aureus USA300 reference genome (GenBank accession number CP000255.1), with an average of only 1.5% of reads (0.9 to 2.8%) mapping to ribosomal genes. We mapped to the USA300 genome because both MRSA-1369 and USA300 belong to sequence type 8 (ST8). The libraries had an average estimated depth of coverage of 9,166-fold (7,842× to 11,384×), with only 1.7% of genes having fewer than 10 mapped reads (2,585/2,631 genes with sufficient sample size for determining differential expression). For comparisons of TSB versus HU, Euclidean distances between samples (Fig. S1 in the supplemental material) and principal-component analysis (Fig. S2) revealed that expression patterns in biological replicates of each treatment group were more similar to each other than they were to those in biological replicates of the contrasting treatment group. Detailed RNA-Seq data including normalized counts for triplicate samples, log2(fold change), and adjusted P values (Padj) are presented in Table S1. All instances of log2(fold change) are abbreviated as log2(FC) and presented as HU samples relative to the TSB control. Of these, 861 genes showed significant changes in gene expression (defined as |log2FC| > 1 and Padj ≤ 0.05). These are categorized into 461 significantly upregulated genes (Table S2) and 400 significantly downregulated genes (Table S3). RNA-Seq results were confirmed by qRT-PCR-based analysis of expression of a panel of 15 overlapping genes. Fold change was correlated across these genes with r2 equal to 0.68 (Fig. S3).
MRSA-1369 differential gene expression in human urine.
Healthy human urine is made of a low concentration of amino acids and short peptides, trace amounts of transition metals, and more than 2,500 metabolites (18, 19). To examine the metabolic adaptations in MRSA-1369 in response to the nutrient-limiting growth conditions in HU, we compared the expression of metabolic genes in TSB control and human urine-exposed MRSA-1369. We observed that 2-h-long exposure to glucose-free HU results in the elimination of catabolite repression marked by significant upregulation of the gene encoding catabolite control protein (ccpA) and activation of genes encoding enzymes involved in the catabolism of amino acids alanine (ald), glutamate (gudB), arginine (rocFD), histidine (hutHIUG), proline (putAP), and serine (sdaAA,AB) (Table 1). We also observed that the tricarboxylic acid (TCA) cycle (Gene Ontology [GO]: 0006099) was one of the significantly enriched GO terms (Fig. 7A). More specifically, in comparison to TSB control, MRSA-1369 in HU exhibited significantly increased expression of genes encoding enzymes in the tricarboxylic acid (TCA) cycle, such as succinate dehydrogenase (sdhCAB), succinyl-coA synthase (sucCD), 2-oxoglutarate dehydrogenase (sucBA), isocitrate dehydrogenase (icd), aconitate hydratase (acnA), citrate synthase (gltA), fumarate hydratase (fumC), and malate:quinone-oxidoreductase (mqo). Two-hour-long exposure to HU also increased transcription of genes encoding phosphoenolpyruvate carboxykinase (pckA), which catalyzes the first irreversible step in gluconeogenesis by converting oxaloacetate into phosphoenol pyruvate and pyruvate synthase (also known as pyruvate ferredoxin oxidoreductase), which catalyzes conversion of pyruvate into acetyl coenzyme A (acetyl-coA), the substrate for the TCA cycle (Table 2).
TABLE 1.
RNA-Seq results for genes involved in amino acid catabolism
| Gene ID | Gene symbol | log2(FC)a | GenBank annotation |
|---|---|---|---|
| SAUSA300_0008 | hutH | 2.44 | Histidine ammonia-lyase |
| SAUSA300_0184 | argB | −1.04 | Acetylglutamate kinase |
| SAUSA300_0860 | rocD | 3.94 | Ornithine aminotransferase |
| SAUSA300_0861 | gudB | 3.37 | NAD-specific glutamate dehydrogenase |
| SAUSA300_1331 | ald | −5.81 | Alanine dehydrogenase |
| SAUSA300_1655 | ald | 3.19 | Alanine dehydrogenase |
| SAUSA300_1682 | ccpA | 2.31 | Catabolite control protein A |
| SAUSA300_1711 | putA | 3.94 | Proline dehydrogenase |
| SAUSA300_1883 | putP | 1.25 | High affinity proline permease |
| SAUSA300_2114 | rocF | 3.86 | Arginase |
| SAUSA300_2277 | hutI | 4.74 | Imidazolonepropionase |
| SAUSA300_2278 | hutU | 5.07 | urocanate hydratase |
| SAUSA300_2281 | hutG | 1.36 | Formimidoylglutamase |
| SAUSA300_2469 | sdaAA | 2.10 | l-Serine dehydratase, iron-sulfur-dependent, alpha subunit |
| SAUSA300_2470 | sdaAB | 2.14 | l-Serine dehydratase, iron-sulfur-dependent, beta subunit |
| SAUSA300_2571 | argR | −2.03 | Arginine repressor |
Only values where absolute log2(fold change) is greater than 1 and P is less than 0.05 are shown. Positive values indicate greater expression in the human urine treatment, and negative values indicate greater expression in the TSB control.
FIG 7.

Enrichment analysis of RNA-Seq data. (A) Gene ontology (GO) terms significantly enriched for differentially expressed genes (DEG) at a P value of <0.01 are shown. For each GO category, the number of DEG (differentially expressed genes) is shown inside the histogram, while the number of total genes in each category is shown next to each histogram. MF, molecular function; BP, biological process. (B) KEGG pathways significantly enriched for DEG at a P value of <0.01 are shown. For each KEGG pathway, the number of DEG is shown inside the histogram while the total number of annotated genes is shown next to the histogram.
TABLE 2.
RNA-Seq results for genes encoding enzymes catalyzing glycolysis, gluconeogenesis, and TCA cycle
| Gene ID | Gene symbol | log2(FC)a | GenBank annotation | KEGG pathway categorizationb |
||
|---|---|---|---|---|---|---|
| Gly | Neo | TCA | ||||
| SAUSA300_0757 | pgk | −2.10 | Phosphoglycerate kinase | X | X | |
| SAUSA300_0759 | gpmI | −2.03 | 2,3-bisphosphoglycerate-independent phosphoglycerate mutase | X | X | |
| SAUSA300_0756 | gap | −1.97 | Glyceraldehyde-3-phosphate dehydrogenase, type I | X | X | |
| SAUSA300_0758 | tpiA | −1.95 | Triosephosphate isomerase | X | X | |
| SAUSA300_2079 | fba | −1.21 | Fructose bisphosphate aldolase | X | X | |
| SAUSA300_1644 | pyk | −1.01 | Pyruvate kinase | X | ||
| SAUSA300_1633 | gap | 4.42 | Glyceraldehyde-3-phosphate dehydrogenase, type I | X | X | |
| SAUSA300_1246 | acnA | 1.33 | Aconitate hydratase | X | ||
| SAUSA300_1183 | 1.52 | Pyruvate ferredoxin oxidoreductase, beta subunit | X | |||
| SAUSA300_1182 | 1.69 | Pyruvate ferredoxin oxidoreductase, alpha subunit | X | |||
| SAUSA300_2312 | mqo | 1.78 | Malate:quinone-oxidoreductase | X | ||
| SAUSA300_1046 | sdhC | 1.97 | Succinate dehydrogenase, cytochrome b-558 subunit | X | ||
| SAUSA300_1047 | sdhA | 2.16 | Succinate dehydrogenase, flavoprotein subunit | X | ||
| SAUSA300_1048 | sdhB | 2.29 | Succinate dehydrogenase, iron-sulfur protein | X | ||
| SAUSA300_1801 | fumC | 2.69 | Fumarate hydratase, class II | X | ||
| SAUSA300_2455 | 2.86 | Putative fructose-1,6-bisphosphatase | X | |||
| SAUSA300_1641 | gltA | 3.43 | Citrate synthase II | X | ||
| SAUSA300_1640 | Icd | 3.48 | Isocitrate dehydrogenase, NADP-dependent | X | ||
| SAUSA300_1306 | sucA | 3.53 | 2-Oxoglutarate dehydrogenase, E1 component | X | ||
| SAUSA300_1305 | sucB | 3.62 | 2-Oxoglutarate dehydrogenase, E2 component, dihydrolipoamide succinyltransferase | X | ||
| SAUSA300_1139 | sucD | 4.09 | Succinyl-coA synthetase, alpha subunit | X | ||
| SAUSA300_1731 | pckA | 4.19 | Phosphoenolpyruvate carboxykinase (ATP) | X | ||
| SAUSA300_1138 | sucC | 4.35 | Succinyl-coA synthetase, beta subunit | X | ||
Values where absolute log2(fold change) is greater than 1 and P is less than 0.05 are shown.
An “X” indicates that a gene belongs to a specific KEGG pathway: saa00010, glycolysis (Gly) and gluconeogenesis (Neo); saa00020, tricarboxylic cycle (TCA).
Given the status of MRSA as a major human pathogen, we were interested in analyzing RNA-Seq data to define the changes in virulence genes and associated regulators following 2-h-long cultivation in human urine. To achieve this objective, we focused on genes categorized into KEGG pathway defined as “Staphylococcus aureus infection” (saa05150) and on genes experimentally shown to play a role in MRSA infection (Table 3). In HU-exposed MRSA-1369, we observed significant downregulation of genes encoding surface proteins involved in colonization such as sasG/E and clumping factor B (clfB), cytolytic toxins Panton-Valentine leukocidin (lukF/S), seq superantigen, and eta protease. In contrast, HU significantly upregulated expression of genes encoding surface proteins clumping factor A (clfA), fibrinogen-binding protein (efb), and cytolytic α-hemolysin precursor (hla) and γ-hemolysin (hlgA/B/C). In addition, HU also significantly altered expression of transcriptional regulators such as codY, agr quorum sensing system (agrDCA), sarA family regulators (rot, sarA, mgrA), two-component systems saeS/R and lytR/S, stress-related gene ctsR, and heat shock protein-encoding genes clpPCB, dnaJ/K, grpE, and groL/ES (Table 3).
TABLE 3.
RNA-Seq results for virulence genes categorized into KEGG pathway saa05150 “Staphylococcus aureus infection” and important transcriptional regulators
| Gene ID | Gene symbol | log2(FC)a | GenBank annotation |
|---|---|---|---|
| MSCRMM colonization | |||
| SAUSA300_2435 | sasG_E | −1.25 | Cell wall surface anchor family protein |
| SAUSA300_2436 | sasG_E | −1.51 | Putative cell wall surface anchor family protein |
| SAUSA300_2565 | clfB | −1.08 | Clumping factor B |
| Surface protein-encoding | |||
| SAUSA300_0772 | clfA | 1.27 | Clumping factor A |
| SAUSA300_1055 | efb | 3.09 | Fibrinogen-binding protein |
| SAUSA300_1920 | chs | −1.33 | Chemotaxis-inhibiting protein CHIPS |
| SAUSA300_1101 | 1.24 | Putative fibronectin/fibrinogen-binding protein | |
| SAUSA300_1052 | efbC | 3.19 | Fibrinogen-binding protein |
| Antimicrobial activity | |||
| SAUSA300_0647 | vraF | −1.07 | CAMP transport system ATP-binding protein |
| SAUSA300_0835 | dltA | −1.40 | d-Alanine-activating enzyme/d-alanine-d-alanyl |
| Cytolytic toxins | |||
| SAUSA300_2365 | hlgA | 6.80 | γ-Hemolysin component A |
| SAUSA300_2366 | hlgC | 3.63 | γ-Hemolysin component C |
| SAUSA300_2367 | hlgB | 3.14 | γ-Hemolysin component B |
| SAUSA300_1058 | hla | 3.52 | α-Hemolysin precursor |
| Superantigens/superantigen-like protein-encoding | |||
| SAUSA300_0801 | seq | −1.04 | Staphylococcal enterotoxin Q |
| SAUSA300_1065 | eta | −1.52 | Exfoliative toxin A |
| Transcriptional regulator-encoding and two-component system-encoding | |||
| SAUSA300_0254 | lytS | −1.59 | Sensor histidine kinase |
| SAUSA300_0255 | lytR | −2.29 | Sensory transduction protein |
| SAUSA300_0507 | ctsR | 3.15 | Transcriptional regulator |
| SAUSA300_0605 | sarA | 1.51 | Staphylococcal accessory regulator A |
| SAUSA300_0672 | mgrA | −1.95 | Transcriptional regulator, MarR family |
| SAUSA300_0690 | saeS | 2.13 | Sensor histidine kinase |
| SAUSA300_0691 | saeR | 2.49 | DNA-binding response regulator |
| SAUSA300_1148 | codY | 1.45 | GTP-sensing transcriptional pleiotropic repressor |
| SAUSA300_1514 | fur | 1.26 | Ferric uptake regulation protein |
| SAUSA300_1542 | hrcA | 3.58 | Heat-inducible transcription repressor |
| SAUSA300_1708 | rot | 1.98 | Staphylococcal accessory regulator |
| SAUSA300_1990 | agrD | 1.09 | Accessory gene regulator protein D |
| SAUSA300_1991 | agrC | 1.02 | Accessory gene regulator protein C |
| SAUSA300_1992 | agrA | 1.05 | Accessory gene regulator protein A |
Only values where absolute log2(fold change) is greater than 1 and P is less than 0.05 are shown. Positive values indicate greater expression in the human urine treatment, and negative values indicate greater expression in the TSB control.
Human urine induced significantly higher expression of MRSA-1369 genes in pathways for acquisition and export of transition metals iron, nickel, and zinc, which are essential nutrients. The expression of genes encoding zinc transporters znuB/C and SAUSA300_2315, cobalt-nickel transporters cntFDCB, opp1A, and oligopeptide transporters oppBCDFAA was upregulated in MRSA-1369 exposed to HU for 2 h (Table 4). As shown in Table 5, HU also induced upregulation of sbnABCDEFGHI and sirA/B involved in the production and import of siderophore staphyloferrin B, respectively, fhuC/B involved in siderophore transport, isdCDEF, srtB from iron surface determinant isd heme acquisition system, sstABCD from catechol/catecholamine iron transporter system, and htsCBA importer of staphyloferrin A (20, 21). Beyond our targeted hypotheses above, RNA-seq analysis of HU-exposed replicates also revealed significant enrichment of 10 GO categories (Fig. 7A) and 12 KEGG pathways (Fig. 7B).
TABLE 4.
RNA-Seq results for genes categorized into KEGG pathway saa02010 “ABC transporters”
| Gene ID | Gene symbol | log2(FC)a | GenBank annotation |
|---|---|---|---|
| Mineral and organic iron transport | |||
| SAUSA300_0219 | −1.345 | Putative iron compound A C transporter, iron compound-binding protein | |
| SAUSA300_0999 | potA | 2.17 | Spermidine/putrescine ABC transporter, ATP-binding protein |
| SAUSA300_1000 | potB | 2.48 | Spermidine/putrescine ABC transporter, permease protein |
| SAUSA300_1001 | potC | 1.92 | Spermidine/putrescine ABC transporter, permease protein |
| SAUSA300_1002 | potD | 1.05 | Spermidine/putrescine ABC transporter, spermidine/putrescine-binding protein |
| Oligosaccharide, polyol, and lipid transport | |||
| SAUSA300_0209 | 1.78 | Putative maltose ABC transporter, maltose-binding protein | |
| SAUSA300_0210 | 1.89 | Maltose ABC transporter, permease protein | |
| SAUSA300_0211 | 1.73 | Maltose ABC transporter, permease protein | |
| SAUSA300_0263 | rbsD | 1.99 | Ribose permease |
| Phosphate and amino acid transport | |||
| SAUSA300_1280 | pstB | 1.21 | Phosphate ABC transporter, ATP-binding protein |
| Cysteine transport | |||
| SAUSA300_2357 | −1.24 | ABC transporter, ATP-binding protein | |
| SAUSA300_2358 | −1.11 | ABC transporter, permease protein | |
| SAUSA300_2359 | −1.19 | Amino acid ABC transporter, amino acid-binding protein | |
| Oligopeptide transport | |||
| SAUSA300_0887 | oppB | 1.11 | Oligopeptide ABC transporter, permease protein |
| SAUSA300_0888 | oppC | 1.25 | Oligopeptide ABC transporter, permease protein |
| SAUSA300_0889 | oppD | 1.36 | Oligopeptide ABC transporter, ATP-binding protein |
| SAUSA300_0890 | oppF | 1.42 | Oligopeptide ABC transporter, ATP-binding protein |
| SAUSA300_0891 | oppA | 1.41 | Oligopeptide ABC transporter, substrate-binding protein |
| SAUSA300_0892 | oppA | 1.20 | Oligopeptide ABC transporter, oligopeptide-binding protein |
| Nickel transport | |||
| SAUSA300_2407 | cntF/nikE | 1.70 | Oligopeptide ABC transporter, ATP-binding protein |
| SAUSA300_2408 | cntD/nikD | 1.90 | Oligopeptide ABC transporter, ATP-binding protein |
| SAUSA300_2409 | cntC/nikC | 1.89 | Oligopeptide ABC transporter, permease protein |
| SAUSA300_2410 | cntB/nikB | 2.80 | Oligopeptide ABC transporter, permease protein |
| SAUSA300_2411 | opp-1A/nikA | 2.99 | Oligopeptide permease, peptide-binding protein |
| Iron siderophore transport | |||
| SAUSA300_2134 | 1.49 | Iron compound ABC transporter, permease protein | |
| SAUSA300_2135 | 1.70 | Iron compound ABC transporter, permease protein | |
| SAUSA300_2136 | 2.86 | Iron compound ABC transporter, iron compound-binding protein | |
| Zinc transport | |||
| SAUSA300_1515 | 1.47 | ABC transporter, permease protein | |
| SAUSA300_1516 | 1.76 | ABC transporter, ATP-binding protein | |
| SAUSA300_2351 | 1.94 | Zn-binding lipoprotein adca-like protein | |
| Biotin transport | |||
| SAUSA300_0977 | −2.49 | Cobalt transport family protein | |
| Unclassified | |||
| SAUSA300_1760 | epiG | 2.18 | Lantibiotic epidermin immunity protein F |
| SAUSA300_1761 | epiE | 1.76 | Lantibiotic epidermin immunity protein F |
| SAUSA300_1762 | epiF | 1.39 | Lantibiotic epidermin immunity protein F |
| SAUSA300_2465 | −1.41 | ABC transporter, ATP-binding protein | |
| SAUSA300_0647 | −1.07 | ABC transporter, ATP-binding protein | |
| SAUSA300_0672 | −1.95 | Transcriptional regulator, MarR family |
aOnly values where absolute log2(fold change) is greater than 1 and P is less than 0.05 are shown. Positive values indicate greater expression in the human urine treatment, and negative values indicate greater expression in the TSB control.
TABLE 5.
RNA-Seq results for genes involved in iron transport
| Gene ID | Gene symbol | log2(FC)a | GenBank annotation |
|---|---|---|---|
| SAUSA300_0633 | fhuA | 1.83 | Ferrichrome transport ATP-binding protein FhuA |
| SAUSA300_0634 | fhuB | 1.08 | Ferrichrome transport permease protein FhuB |
| SAUSA300_0116 | sirB | 1.84 | Iron compound ABC transporter, permease protein SirB |
| SAUSA300_0117 | sirA | 2.30 | Iron compound ABC transporter, iron compound-binding protein SirA |
| SAUSA300_0118 | sbnA | 2.64 | Pyridoxal-phosphate dependent enzyme superfamily |
| SAUSA300_0119 | sbnB | 2.29 | Ornithine cyclodeaminase |
| SAUSA300_0120 | sbnC | 2.16 | Siderophore biosynthesis protein, IucC family |
| SAUSA300_0121 | sbnD | 1.90 | Putative drug transporter |
| SAUSA300_0122 | sbnE | 1.54 | Siderophore biosynthesis protein, IucA/IucC family |
| SAUSA300_0123 | sbnF | 1.37 | Siderophore biosynthesis protein, IucC family |
| SAUSA300_0124 | sbnG | 1.42 | HPCH/HPAI aldolase family protein |
| SAUSA300_0125 | Sbnh | 1.27 | Pyridoxal-dependent decarboxylase |
| SAUSA300_0126 | sbnI | 1.03 | Conserved hypothetical protein |
| SAUSA300_0718 | sstA | 2.45 | Iron compound ABC transporter, permease |
| SAUSA300_0719 | sstB | 2.52 | Iron compound ABC transporter, permease protein |
| SAUSA300_0720 | sstC | 2.88 | Putative iron compound ABC transporter, ATP-binding protein |
| SAUSA300_0721 | sstD | 3.77 | Transferrin receptor |
| SAUSA300_1030 | isdC | 2.59 | Iron transport associated domain protein |
| SAUSA300_1031 | isdD | 2.01 | Conserved hypothetical protein |
| SAUSA300_1032 | isdE | 2.31 | Putative iron compound ABC transporter, iron compound-binding protein |
| SAUSA300_1033 | isdF | 1.39 | Iron/heme permease |
| SAUSA300_1034 | srtB | 1.64 | Sortase B |
| SAUSA300_1035 | isdG | 1.11 | Conserved hypothetical protein |
| SAUSA300_2134 | htsC | 1.49 | Iron compound ABC transporter, permease protein |
| SAUSA300_2135 | htsB | 1.70 | Iron compound ABC transporter, permease protein |
| SAUSA300_2136 | htsA | 2.86 | Iron compound ABC transporter, iron compound-binding protein |
Only values where absolute log2(fold change) is greater than 1 and P is less than 0.05 are shown. Positive values indicate greater expression in the human urine treatment, and negative values indicate greater expression in the TSB control.
DISCUSSION
An overarching objective of our research is to delineate the effects of the growth-limiting, hostile microenvironment of the urinary tract on the physiology of various bacterial pathogens. Here, we examined virulence characteristics and gene expression of various S. aureus strains using healthy female urine as a culture medium to mimic conditions encountered during the colonization of human urinary tract. The specific strains analyzed in this study include two urinary isolates, MRSA-1369 and PUTS-1, and a prototypical MRSA strain, USA300, all of which were able to grow in HU as previously reported (9), although based on the comparison of doubling times for each strain, PUTS-1 growth in HU is faster than the growth of either MRSA-1369 or USA300 in HU. Given that PUTS-1 is a clinical isolate from a woman with asymptomatic bacteriuria, our results match previous reports that asymptomatic bacteriuria strains of uropathogenic Escherichia coli and Streptococcus agalactiae exhibit rapid growth in human urine compared to that of those causing cystitis (22, 23). Our observations further suggest that the induction of specific virulence characteristics by human urine is strain dependent. In addition, we also compared the global transcriptome profiles of uropathogenic strain MRSA-1369 exposed in vitro to either human urine or nutrient-rich culture medium TSB (control). The RNA-Seq observations constitute the first step in defining molecular basis for results from virulence assays as discussed below.
S. aureus strains infecting humans secrete numerous cytolytic exotoxins, such as α-hemolysin and leukotoxins, as well as cytolytic peptides called phenol soluble modulins, which play an important role in staphylococcal pathogenesis by facilitating tissue damage, immune evasion, and dissemination (16). We observed upregulation of hla encoding α-hemolysin and hlgACB cluster encoding γ-hemolysin, both of which are known to target a broad range of host cells, including red blood cells (24, 25). The hla gene is expressed by most clinical isolates of MRSA, and its expression level is correlated with the disease severity (26). Moreover, α-hemolysin is known to be essential for MRSA virulence in animal models of skin and soft tissue infections (SSTI), pneumonia, and bacteremia (24). The γ-hemolysin belongs to the leukotoxin family of cytolysins, which are made of two different protein components that assemble to form β barrel pores in the host plasma membrane. The γ-hemolysin is highly prevalent in S. aureus clinical isolates from human nose and blood (25). While hlgACB genes are upregulated in human blood, the contribution of γ-hemolysin to staphylococcal virulence is modest, as shown by the results from infection experiments comparing WT MRSA with ΔhlgACB mutant defective in γ-hemolysin production in animal models of eye infection (27), bacteremia (28), and septic arthritis (29). The increased expression of hla and hlgACB in HU and corresponding increase in hemolytic activity suggest that either one or both toxins may play an important role in the urinary pathogenesis of MRSA-1369. It will be worthwhile for the future research to compare uropathogenesis of MRSA-1369 WT and hla knockout (KO) strains in a mouse model. Equally interesting will be experiments examining whether the absence of hemolytic activity in PUTS-1 can be explained by the inactivation of one or more cytolytic toxin genes and whether comparatively rapid growth of PUTS-1 in HU compensates for the lack of hemolysis offering it a competitive advantage in asymptomatic colonization of the urinary tract.
Multiple nonspecific and specific mechanisms of adherence facilitate early steps of staphylococcal colonization of host tissue by promoting bacterial attachment to host cells and extracellular matrix proteins. Nonspecific mechanisms include changes in surface charge and hydrophobicity, while specific mechanisms include number of cell wall anchored adhesins (MSCRAMMs; microbial surface components recognizing adhesive matrix molecules), which specifically adhere to ECM proteins collagen, fibrinogen, and fibronectin (30). Adherence to bladder epithelium is the first important step in urinary pathogenesis, as it prevents removal of uropathogens by the gush of urine. HU specifically induced adherence to human bladder epithelial cells by MRSA-1369 and USA300. The hydrophobicity was significantly higher in MRSA-1369 cultivated in human urine. Based on gene expression data, the increased adherence in MRSA strains cultivated in HU could potentially be mediated by the product of one or more of the surface adhesin genes clfA, efb, efbC, and SAUSA300_1101. In contrast, binding to fibronectin was reduced in all three staphylococcal strains. This matches with gene expression results (qRT-PCR and RNA-Seq) showing that the expression of genes encoding principal fibronectin adhesins, fibronectin-binding protein (fnbAB), was downregulated in HU (relative to that in TSB) in MRSA-1369, PUTS-1, and USA300.
Clumping factor A and B (ClfA, ClfB) are important mediators of MRSA binding to fibrinogen (31). MRSA adherence to fibrinogen is implicated in the pathogenesis of CAUTI, as MRSA infection is shown to increase fibrinogen deposition on catheters and because ΔclfB deletion mutant in MRSA-1369 shows reduced bacterial burden on catheter implant in a mouse model of CAUTI (9). Interestingly, deletion of clfA (ΔclfA) does not affect bacterial burden on catheter implant compared to that of WT MRSA-1369 (9). Previous publications have used 100 μg/ml fibrinogen to assess binding by Gram-positive S. aureus and enterococci (9, 32); exposure of S. aureus clinical isolates to human plasma containing 400 μg/ml fibrinogen was also shown to significantly augment expression of MSCRAMM genes (33). However, 2-h-long, in vitro exposure to HU supplemented with either 20 or 100 μg/ml human fibrinogen did not significantly affect MRSA-1369 gene expression relative to HU alone (data not shown). This apparent discrepancy can be attributed to the presence of other host proteins in addition to fibrinogen in plasma. It is also worth noting that 2 h may not be a long enough exposure time for HU supplemented with 20 or 100 μg/ml fibrinogen to induce discernible changes in staphylococcal gene expression. In the light of this information, how our observations that HU (relative to both TSB and RPMI) mediates upregulation of clfA and downregulation of clfB expression may shape MRSA uropathogenesis warrants further evaluation at various early and late time points in a mouse model.
Urine is a nutrient-poor culture medium that is primarily made of urea, inorganic salts, creatinine, organic acids, small quantities of amino acids, trace amounts of transition metals, and other water-soluble waste products from blood. To colonize glucose-free urinary tract, S. aureus must switch to catabolism of amino acids via tricarboxylic acid (TCA) cycle to provide substrates for gluconeogenesis. In our experiments, staphylococci were cultured in standard TSB containing 14 mM glucose to obtain an inoculum high enough for discernible changes in virulence following various experimental exposures. Subculture of staphylococci from TSB to glucose-free HU marks a drop in glucose availability that is steeper than the drop in glucose observed in real-life as S. aureus switches from being a commensal in the nasopharynx (with reported average glucose level of 400 μM [34]) to a pathogen infecting glucose-free urinary tract. Nevertheless, the elimination of catabolite repression resulting in the increased production of enzymes catalyzing amino acid catabolism, TCA cycle, and gluconeogenesis and oligopeptide transporters (oppBCDFAA) when MRSA-1369 was cultivated in HU implicates these central metabolic pathways in MRSA uropathogenesis. This is similar to previous reports showing that UPEC mutants ablated in oligopeptide and dipeptide transport as well as mutants lacking enzymes catalyzing TCA cycle or gluconeogenesis exhibit fitness defects in the mouse model of ascending UTI (35).
In addition, our results also implicate transporter systems for nickel, iron, and zinc in MRSA uropathogenesis. Both bacterial pathogens and their eukaryotic hosts require transition metals for survival; hosts exert a tight control over metal homeostasis as a defense mechanism against infections, while bacteria produce acquisition (iron siderophores) and export systems to chelate metals from the host. HU contains trace quantities of iron (0.089 μM/mM creatinine), nickel (0.0080 μM/mM creatinine), cobalt (0.0014 μM/mM creatinine), and zinc (0.46 μM/mM creatinine) (19). Thus, rapid upregulation of nickel, iron, and zinc transporter systems following 2-h-long exposure to HU, as shown by RNA-Seq analysis, may afford survival advantage to MRSA in the urinary tract
Most research has been focused on revealing the interactions between host immunity and MRSA virulence in the context of predominant MRSA infections of skin, soft tissue, and lungs. In contrast, MRSA-host interactions within the urinary environment are largely unexplored. To survive in the urinary niches, MRSA must rapidly adapt to unique challenges in the form of nutrient unavailability, mobilization of immune defenses, acidic pH, osmolarity, and shear stress due to urine flow. In this report, we have correlated alterations in virulence characteristics visualized by in vitro assays with changes in the expression of specific genes, which we acknowledge is only the first step in understanding MRSA physiology in the urinary tract. In the future, such correlations should be confirmed by comparing deletion mutants targeting specific genes with WT MRSA by in vitro virulence assays and in a mouse model of ascending UTI. Also warranted are studies examining the physiology of host as well as pathogen in the context of MRSA-infected urinary tract.
MATERIALS AND METHODS
Bacterial strains and culture conditions.
Staphylococcus aureus strains used in this study are MRSA-1369, PUTS-1, and USA300 (Table 6) (9, 36). MRSA-1369 and PUTS-1 were generously gifted by Scott J. Hultgren and Jennifer N. Walker (Washington University School of Medicine in St. Louis). On the day of experiment, overnight cultures in tryptic soy broth (TSB with standard, 14 mM glucose) at 37°C and shaking at 200 rpm were diluted 1:10 and grown to optical density at 600 nm (OD600) of 0.6. These are referred to as mid-log cultures.
TABLE 6.
Strains used in this study
Urine from healthy male and female volunteers (protocol approved by UL Lafayette IRB) was collected after informed consent was obtained from each volunteer. Urine was immediately filter-sterilized using a 0.22-μm filter and stored in 1.5-ml aliquots at –80°C. At the time of experiments, urine aliquots from three to five different donors were warmed to 37°C and mixed. Mid-log cultures were exposed to TSB (control), HU, base RPMI, or HU supplemented with 20 μg/ml or 100 μg/ml fibrinogen for 2 h at 37°C. HU refers to female urine.
After exposure, bacteria were centrifuged, washed in Dulbecco’s phosphate-buffered saline (D-PBS), and used in various in vitro virulence assays and for RNA extractions as specified below. To enumerate the CFU/ml, we plated serial, 10-fold dilutions of bacteria on tryptic soy agar or CHROMagar.
Growth curve.
S. aureus strains were inoculated at <106 CFU/ml in TSB, HU, or base RPMI at 37°C without shaking. CFU were enumerated by dilution plating at 0, 2, 4, 6, 8, and 24 h time points. For calculating doubling time (DT), CFU/ml values from 2 h and 4 h were used in the formula
In vitro adherence assay.
The confluent monolayers of 5637 human bladder epithelial cell line (ATCC HTB-9) in 6-well cell culture plates were weaned (grown in base medium without fetal bovine serum [FBS]) overnight before infection in two different experimental setups. In setup 1, staphylococci were exposed to TSB or HU for 2 h, washed, and then resuspended in base RPMI before infecting 5637 monolayers. In setup 2, monolayers overlaid with base RPMI (control) or HU were infected with mid-log-phase staphylococcal strains in TSB. We had previously described setup 2 as simulated bladder microenvironment (11). In both setups, MOI (multiplicity of infection) was set to 10. Plates were centrifuged to facilitate contact between MRSA and bladder cells. After incubation at 37°C for 2 h and 5% CO2, supernatant was collected to determine nonadherent CFU by dilution plating. Monolayers were then washed 3 times with sterile PBS (containing Ca++/Mg++) to remove nonadherent bacteria. Adherent bacteria collected in sterile PBS containing 0.1% Triton X-100 were enumerated by dilution plating (37). Percent adherence was calculated as [adherent CFU/(adherent CFU + supernatant CFU)] × 100.
Fibrinogen- and fibronectin-binding assay.
Assays to determine binding of MRSA to human ECM proteins fibrinogen or fibronectin were performed as described previously (12). In brief, a 96-well microtiter plate was coated overnight with 2-fold dilutions (20, 10, 5, 2.5, and 1.25 μg/ml) of 100 μl of human fibrinogen or fibronectin at 4°C. The wells were washed three times with 0.05% Tween 20 in sterile PBS and then blocked with 100 μl of 1% bovine serum albumin solution for 1 h at 37°C. The wells were washed again and 100 μl of MRSA (preexposed to HU or TSB control, adjusted to OD600 of 0.45) was added to at least duplicate wells. After incubation for 2 h at 37°C, nonadherent bacteria were removed by washing. The adherent bacteria were fixed with 100 μl of 25% formaldehyde for 30 min and stained with 100 μl of 1% crystal violet for 15 min at room temperature. After being washed with water and dried (37°C, 2 h) crystal violet was extracted with 70%-10% ethanol-methanol mixture. The absorbance was measured at 590 nm. Results for 20 μg/ml fibrinogen or fibronectin are shown.
Hydrophobicity test.
Hydrophobicity was determined using MATH (microbial adhesion to hydrocarbon) assay, wherein S. aureus strains preexposed for 2 h to HU or TSB were centrifuged, resuspended in sterile D-PBS, and adjusted to OD600 of 0.6. One ml of each bacterial suspension was mixed with 125 μl hexadecane by vortexing for 1 min and incubated at room temperature for 30 min (38). The CFU/ml before addition of hexadecane (Ci) and CFU/ml in the aqueous phase (Caq) after incubation with hexadecane were enumerated by dilution plating.
Antimicrobial peptide resistance assay.
To determine the sensitivity of bacteria to human antimicrobial peptide (AMP) cathelicidin LL-37, S. aureus strains preexposed for 2 h to TSB or HU were washed and resuspended in sterile D-PBS supplemented with 20% TSB either without or with 50 μM LL-37 for 1 h. Bacteria were enumerated by dilution plating.
Hemolysis assay.
Staphylococcal strains preexposed to TSB (control) or HU were used to generate 2-fold serial dilutions starting from 108 CFU/ml. Dilutions were mixed with equal volume of 1% sheep erythrocytes in PBS in 96-well conical bottom plate and incubated at 37°C. After 2 h, unlysed RBCs were pelleted at 3,000 rpm for 10 min and 100 μl supernatant was transferred to a fresh plate. Absorbance at 420 nm (A420) was measured to estimate hemoglobin release (11). A420 readings for RBCs treated with PBS or 0.1% Triton X-100 were used to define baseline (ANC) and 100% hemolysis (APC), respectively.
Autolysis assay.
Staphylococci preexposed to TSB or HU were resuspended in 0.2% Triton X-100 in sterile PBS and incubated at 37°C without shaking (39). We measured initial OD600 (ODi) at the beginning of the experiment and then at 1-h intervals for 4 h (ODt).
RNA extraction and quantitative real-time PCR (qRT-PCR).
S. aureus strains in the mid-log phase of growth were exposed in TSB, HU, base RPMI, or HU supplemented with 20 or 100 μg/ml fibrinogen for 2 h at 37°C. Bacterial RNA was extracted using Ambion Ribopure kit (Thermofisher) and quantified using Synergy HTX multi-mode microplate reader (Biotek). Next, 1 μg RNA was reverse transcribed using the high-capacity cDNA reverse transcription kit (Applied Biosystems). qRT-PCR was carried out using SYBR green master mix (Applied Biosystems) in a StepOne Plus thermal cycler (Applied Biosystems). We used 16S rRNA as housekeeping gene. Relative quantification (RQ) values were calculated by comparing ΔΔCT values of HU-exposed staphylococci with those of TSB control. The primers used for qRT-PCR are listed in Table 7.
TABLE 7.
Sequences of primers used for qRT-PCR in this study
| Primer | Sequence |
|---|---|
| 16S_F | GCG CTG CAT TAG CTA GTT GGT |
| 16S_R | TGG CCG ATC ACC CTC TCA |
| agrC_F | CCA GCT ATA ATT AGT GGT ATT AAG TAC AGT AAA CT |
| agrC_R | AGG ACG CGC TAT CAA ACA TTT T |
| ahpC_F | GCA TGA CCA TTC AGA TGC AA |
| ahpC_R | CCA ATT CCG TCA GCG TTA AT |
| atl_F | TTT GGT TTC CAG AGC CAG AC |
| atl_R | TTG GGT TAA AGA AGG CGA TG |
| clfA_F | TTT CAA CAA CGC AAG ATA |
| clfA_R | GCT ACT GCC GCT AAA CTA |
| clfB_F | TTT GGG ATA GGC AAT CAT CA |
| clfB_R | TCA TTT GTT GAA GCT GGC TC |
| fib_F | GCG AAG GAT ACG GTC CAA GAG A |
| fib_R | CAA TTC GCT CTT GTA AGA CCA TT |
| fnbA_F | CCA GGT GGT GGT CAG GTT AC |
| fnbA_R | TGT GCT TGA CCA TGC TCT TC |
| hla_F | AGA AAA TGG CAT GCA CAA AAA |
| hla_R | TAT CAG TTG GGC TCT CTA AAA |
| icaA_F | CGC ACT CAA AGG CAT T |
| icaA_R | CCA GCA AGT GTC TGA CTT CG |
| rot_F | TCG CTT TCA ATC TCG CTG AA |
| rot_R | CGA CAC TGT ATT TGG AAT TTT GCA |
| saeS_F | AAT CCA GAA CCA CCC GTT TT |
| saeS_R | ACG CCA CTT GAG CGT ATT TT |
| sarA_F | GCA CAA CAA CGT AAA AAA ATC GAA |
| sarA_R | TTC GTT GTT TGC TTC AGT GAT TC |
| sod_F | CCA ATG TAG TCA GGG CGT TT |
| sod_R | GTT CAG GTT GGG CTT GGT TA |
Statistical analysis.
Data from multiple replicates for each experiment are pooled together. Graphing and statistical analyses were done using GraphPad Prism 9 software. Results are expressed as the means ± standard deviation from data collected from two or more biological replicates each with two or more technical replicates. The data were compared using Student’s t test as indicated. The difference between groups is considered significant if P is less than or equal to 0.05.
RNA-Seq data analysis.
RNA for RNA-Seq was extracted as above. All library construction and initial analysis of differential expression were done by GENEWIZ (NJ, USA). Library construction included DNase treatment (TURBO DNase, ThermoFisher Scientific) and rDNA depletion (QIAseq FastSelect, Qiagen) followed by RNA fragmentation and random priming. cDNA synthesis (NEBNext Ultra II, New England Biolabs) was followed by end repair, 5′ phosphorylation, and dA-tailing. Libraries were sequenced on a partial lane of Illumina HiSeq 4000 with 150 bp paired-end sequencing. Quality of sequence data was assessed using FastQC. All reads were quality filtered and trimmed using Trimmomatic version 0.36 with default settings (40). Reads were mapped to Staphylococcus aureus subsp. aureus USA300_FPR3757 genome using Bowtie2 version 2.2.6 (41), and hit count for individual genes was generated using the featurecounts command in the Rsubread package version 1.5.2 (42). Genes with fewer than 10 reads were dropped from the analysis for differential expression. Differential expression for each gene was assessed using Wald tests implemented in DESeq2 (43). Genes with an adjusted P value of <0.05 and absolute log2(FC) of >1 were categorized as differentially expressed genes.
GO enrichment analyses were conducted using the goseq version 1.42.0 package in R (44). Gene ontology (GO) terms and gene lengths were extracted for each gene in the Staphylococcus aureus subsp. aureus USA300_FPR3757 from the UniProt website (45). We determined whether DEGs between treatments were significantly overrepresented within molecular function, biological process, and cellular component GO terms using a Wallenius approximation and accounting for gene length bias using a probability weight function. Because of the inherent difficulties with multiple testing and correcting for multiple testing in GO analyses, we simply consider any term with P of <0.01 statistically significant. KEGG pathway enrichment analyses were conducted using the KEGGREST Bioconductor package version 1.30.1 (46) and a custom script (available upon request). KEGGREST was used to download lists of pathways and genes within pathways from the KEGG website for Staphylococcus aureus subsp. aureus USA300_FPR3757 (organism code saa). We assessed whether DEGs are overrepresented in certain pathways by using a Wilcoxon rank-sum test to determine whether adjusted P values for differential expression of genes within a focal pathway are lower than the adjusted P values for differential expression of genes that are not within the pathway.
Data availability.
The raw Illumina reads have been deposited in NCBI’s BioProject database under accession number PRJNA715655.
ACKNOWLEDGMENTS
We thank members of the Kulkarni lab for scientific discussions and comments during the course of this project and the writing of this manuscript.
This work was supported by the Louisiana Board of Regents award LEQSF(2017-20)-RD-A-21 (to R.K.), the University of Louisiana at Lafayette, Dean's Startup Fund (to R.K.), the UL Lafayette Undergraduate research mini grant (to R.K.), and the National Science Foundation award OIA-1920858 (to N.J.K.).
Footnotes
Supplemental material is available online only.
Contributor Information
Ritwij Kulkarni, Email: ritwij.kulkarni@louisiana.edu.
Charles M. Dozois, INRS—Institut Armand-Frappier
REFERENCES
- 1.Medina M, Castillo-Pino E. 2019. An introduction to the epidemiology and burden of urinary tract infections. Ther Adv Urol 11:1756287219832172. doi: 10.1177/1756287219832172. [DOI] [PMC free article] [PubMed] [Google Scholar]
- 2.Bishara J, Goldberg E, Leibovici L, Samra Z, Shaked H, Mansur N, Paul M. 2012. Healthcare-associated vs. hospital-acquired Staphylococcus aureus bacteremia. Int J Infect Dis 16:e457–e463. doi: 10.1016/j.ijid.2012.02.009. [DOI] [PubMed] [Google Scholar]
- 3.Stokes W, Parkins MD, Parfitt ECT, Ruiz JC, Mugford G, Gregson DB. 2019. Incidence and outcomes of Staphylococcus aureus bacteriuria: a population-based study. Clin Infect Dis 69:963–969. doi: 10.1093/cid/ciy1000. [DOI] [PubMed] [Google Scholar]
- 4.Muder RR, Brennen C, Rihs JD, Wagener MM, Obman A, Stout JE, Yu VL. 2006. Isolation of Staphylococcus aureus from the urinary tract: association of isolation with symptomatic urinary tract infection and subsequent staphylococcal bacteremia. Clin Infect Dis 42:46–50. doi: 10.1086/498518. [DOI] [PubMed] [Google Scholar]
- 5.Karakonstantis S, Kalemaki D. 2018. Evaluation and management of Staphylococcus aureus bacteriuria: an updated review. Infection 46:293–301. doi: 10.1007/s15010-017-1100-6. [DOI] [PubMed] [Google Scholar]
- 6.Gad GF, El-Feky MA, El-Rehewy MS, Hassan MA, Abolella H, El-Baky RM. 2009. Detection of icaA, icaD genes and biofilm production by Staphylococcus aureus and Staphylococcus epidermidis isolated from urinary tract catheterized patients. J Infect Dev Ctries 3:342–351. doi: 10.3855/jidc.241. [DOI] [PubMed] [Google Scholar]
- 7.Remy L, Carriere M, Derre-Bobillot A, Martini C, Sanguinetti M, Borezee-Durant E. 2013. The Staphylococcus aureus Opp1 ABC transporter imports nickel and cobalt in zinc-depleted conditions and contributes to virulence. Mol Microbiol 87:730–743. doi: 10.1111/mmi.12126. [DOI] [PubMed] [Google Scholar]
- 8.Hiron A, Posteraro B, Carriere M, Remy L, Delporte C, La Sorda M, Sanguinetti M, Juillard V, Borezee-Durant E. 2010. A nickel ABC-transporter of Staphylococcus aureus is involved in urinary tract infection. Mol Microbiol 77:1246–1260. doi: 10.1111/j.1365-2958.2010.07287.x. [DOI] [PubMed] [Google Scholar]
- 9.Walker JN, Flores-Mireles AL, Pinkner CL, Schreiber HLt, Joens MS, Park AM, Potretzke AM, Bauman TM, Pinkner JS, Fitzpatrick JAJ, Desai A, Caparon MG, Hultgren SJ. 2017. Catheterization alters bladder ecology to potentiate Staphylococcus aureus infection of the urinary tract. Proc Natl Acad Sci U S A 114:E8721–E8730. doi: 10.1073/pnas.1707572114. [DOI] [PMC free article] [PubMed] [Google Scholar]
- 10.Carrel M, Perencevich EN, David MZ. 2015. USA300 methicillin-resistant Staphylococcus aureus, United States, 2000-2013. Emerg Infect Dis 21:1973–1980. doi: 10.3201/eid2111.150452. [DOI] [PMC free article] [PubMed] [Google Scholar]
- 11.John PP, Baker BC, Paudel S, Nassour L, Cagle H, Kulkarni R. 2020. Exposure to moderate glycosuria induces virulence of group B streptococcus. J Infect Dis doi: 10.1093/infdis/jiaa443. [DOI] [PubMed] [Google Scholar]
- 12.Kulkarni R, Antala S, Wang A, Amaral FE, Rampersaud R, Larussa SJ, Planet PJ, Ratner AJ. 2012. Cigarette smoke increases Staphylococcus aureus biofilm formation via oxidative stress. Infect Immun 80:3804–3811. doi: 10.1128/IAI.00689-12. [DOI] [PMC free article] [PubMed] [Google Scholar]
- 13.Walker JN, Crosby HA, Spaulding AR, Salgado-Pabon W, Malone CL, Rosenthal CB, Schlievert PM, Boyd JM, Horswill AR. 2013. The Staphylococcus aureus ArlRS two-component system is a novel regulator of agglutination and pathogenesis. PLoS Pathog 9:e1003819. doi: 10.1371/journal.ppat.1003819. [DOI] [PMC free article] [PubMed] [Google Scholar]
- 14.Rosenberg M, Gutnick D, Rosenberg E. 1980. Adherence of bacteria to hydrocarbons - a simple method for measuring cell-surface hydrophobicity. FEMS Microbiology Lett 9:29–33. doi: 10.1111/j.1574-6968.1980.tb05599.x. [DOI] [Google Scholar]
- 15.Clarke SR, Mohamed R, Bian L, Routh AF, Kokai-Kun JF, Mond JJ, Tarkowski A, Foster SJ. 2007. The Staphylococcus aureus surface protein IsdA mediates resistance to innate defenses of human skin. Cell Host Microbe 1:199–212. doi: 10.1016/j.chom.2007.04.005. [DOI] [PubMed] [Google Scholar]
- 16.Otto M. 2013. Community-associated MRSA: what makes them special? Int J Med Microbiol 303:324–330. doi: 10.1016/j.ijmm.2013.02.007. [DOI] [PMC free article] [PubMed] [Google Scholar]
- 17.Lopez R, Ronda-Lain C, Tapia A, Waks SB, Tomasz A. 1976. Suppression of the lytic and bactericidal effects of cell wallinhibitory antibiotics. Antimicrob Agents Chemother 10:697–706. doi: 10.1128/AAC.10.4.697. [DOI] [PMC free article] [PubMed] [Google Scholar]
- 18.Brooks T, Keevil CW. 1997. A simple artificial urine for the growth of urinary pathogens. Lett Appl Microbiol 24:203–206. doi: 10.1046/j.1472-765x.1997.00378.x. [DOI] [PubMed] [Google Scholar]
- 19.Bouatra S, Aziat F, Mandal R, Guo AC, Wilson MR, Knox C, Bjorndahl TC, Krishnamurthy R, Saleem F, Liu P, Dame ZT, Poelzer J, Huynh J, Yallou FS, Psychogios N, Dong E, Bogumil R, Roehring C, Wishart DS. 2013. The human urine metabolome. PLoS One 8:e73076. doi: 10.1371/journal.pone.0073076. [DOI] [PMC free article] [PubMed] [Google Scholar]
- 20.Stauff DL, Skaar EP. 2009. The heme sensor system of Staphylococcus aureus. Contrib Microbiol 16:120–135. doi: 10.1159/000219376. [DOI] [PMC free article] [PubMed] [Google Scholar]
- 21.Hammer ND, Skaar EP. 2011. Molecular mechanisms of Staphylococcus aureus iron acquisition. Annu Rev Microbiol 65:129–147. doi: 10.1146/annurev-micro-090110-102851. [DOI] [PMC free article] [PubMed] [Google Scholar]
- 22.Roos V, Ulett GC, Schembri MA, Klemm P. 2006. The asymptomatic bacteriuria Escherichia coli strain 83972 outcompetes uropathogenic E. coli strains in human urine. Infect Immun 74:615–624. doi: 10.1128/IAI.74.1.615-624.2006. [DOI] [PMC free article] [PubMed] [Google Scholar]
- 23.Ipe DS, Ben Zakour NL, Sullivan MJ, Beatson SA, Ulett KB, Benjamin WH, Jr, Davies MR, Dando SJ, King NP, Cripps AW, Schembri MA, Dougan G, Ulett GC. 2016. Discovery and characterization of human-urine utilization by asymptomatic-bacteriuria-causing Streptococcus agalactiae. Infect Immun 84:307–319. doi: 10.1128/IAI.00938-15. [DOI] [PMC free article] [PubMed] [Google Scholar]
- 24.Berube BJ, Bubeck Wardenburg J. 2013. Staphylococcus aureus alpha-toxin: nearly a century of intrigue. Toxins (Basel) 5:1140–1166. doi: 10.3390/toxins5061140. [DOI] [PMC free article] [PubMed] [Google Scholar]
- 25.von Eiff C, Friedrich AW, Peters G, Becker K. 2004. Prevalence of genes encoding for members of the staphylococcal leukotoxin family among clinical isolates of Staphylococcus aureus. Diagn Microbiol Infect Dis 49:157–162. doi: 10.1016/j.diagmicrobio.2004.03.009. [DOI] [PubMed] [Google Scholar]
- 26.Jenkins A, Diep BA, Mai TT, Vo NH, Warrener P, Suzich J, Stover CK, Sellman BR. 2015. Differential expression and roles of Staphylococcus aureus virulence determinants during colonization and disease. mBio 6:e02272-14. doi: 10.1128/mBio.02272-14. [DOI] [PMC free article] [PubMed] [Google Scholar]
- 27.Supersac G, Piemont Y, Kubina M, Prevost G, Foster TJ. 1998. Assessment of the role of gamma-toxin in experimental endophthalmitis using a hlg-deficient mutant of Staphylococcus aureus. Microb Pathog 24:241–251. doi: 10.1006/mpat.1997.0192. [DOI] [PubMed] [Google Scholar]
- 28.Malachowa N, Whitney AR, Kobayashi SD, Sturdevant DE, Kennedy AD, Braughton KR, Shabb DW, Diep BA, Chambers HF, Otto M, DeLeo FR. 2011. Global changes in Staphylococcus aureus gene expression in human blood. PLoS One 6:e18617. doi: 10.1371/journal.pone.0018617. [DOI] [PMC free article] [PubMed] [Google Scholar]
- 29.Nilsson IM, Hartford O, Foster T, Tarkowski A. 1999. Alpha-toxin and gamma-toxin jointly promote Staphylococcus aureus virulence in murine septic arthritis. Infect Immun 67:1045–1049. doi: 10.1128/IAI.67.3.1045-1049.1999. [DOI] [PMC free article] [PubMed] [Google Scholar]
- 30.Parker D, Prince A. 2012. Immunopathogenesis of Staphylococcus aureus pulmonary infection. Semin Immunopathol 34:281–297. doi: 10.1007/s00281-011-0291-7. [DOI] [PMC free article] [PubMed] [Google Scholar]
- 31.Ponnuraj K, Bowden MG, Davis S, Gurusiddappa S, Moore D, Choe D, Xu Y, Hook M, Narayana SV. 2003. A “dock, lock, and latch” structural model for a staphylococcal adhesin binding to fibrinogen. Cell 115:217–228. doi: 10.1016/s0092-8674(03)00809-2. [DOI] [PubMed] [Google Scholar]
- 32.Flores-Mireles AL, Walker JN, Potretzke A, Schreiber HLt, Pinkner JS, Bauman TM, Park AM, Desai A, Hultgren SJ, Caparon MG. 2016. Antibody-based therapy for enterococcal catheter-associated urinary tract infections. mBio 7(5):e01653-16. doi: 10.1128/mBio.01653-16. [DOI] [PMC free article] [PubMed] [Google Scholar]
- 33.Cardile AP, Sanchez CJ, Samberg ME, Romano DR, Hardy SK, Wenke JC, Murray CK, Akers KS. 2014. Human plasma enhances the expression of Staphylococcal microbial surface components recognizing adhesive matrix molecules promoting biofilm formation and increases antimicrobial tolerance In Vitro. BMC Res Notes 7:457. doi: 10.1186/1756-0500-7-457. [DOI] [PMC free article] [PubMed] [Google Scholar]
- 34.Krismer B, Liebeke M, Janek D, Nega M, Rautenberg M, Hornig G, Unger C, Weidenmaier C, Lalk M, Peschel A. 2014. Nutrient limitation governs Staphylococcus aureus metabolism and niche adaptation in the human nose. PLoS Pathog 10:e1003862. doi: 10.1371/journal.ppat.1003862. [DOI] [PMC free article] [PubMed] [Google Scholar]
- 35.Alteri CJ, Smith SN, Mobley HL. 2009. Fitness of Escherichia coli during urinary tract infection requires gluconeogenesis and the TCA cycle. PLoS Pathog 5:e1000448. doi: 10.1371/journal.ppat.1000448. [DOI] [PMC free article] [PubMed] [Google Scholar]
- 36.Tenover FC, Goering RV. 2009. Methicillin-resistant Staphylococcus aureus strain USA300: origin and epidemiology. J Antimicrob Chemother 64:441–446. doi: 10.1093/jac/dkp241. [DOI] [PubMed] [Google Scholar]
- 37.Bagale K, Paudel S, Cagle H, Sigel E, Kulkarni R. 2020. Electronic cigarette (e-cigarette) vapor exposure alters the streptococcus pneumoniae transcriptome in a nicotine-dependent manner without affecting pneumococcal virulence. Appl Environ Microbiol 86:e02125-19. doi: 10.1128/AEM.02125-19. [DOI] [PMC free article] [PubMed] [Google Scholar]
- 38.Lather P, Mohanty AK, Jha P, Garsa AK. 2016. Contribution of cell surface hydrophobicity in the resistance of Staphylococcus aureus against antimicrobial agents. Biochem Res Int 2016:1091290. doi: 10.1155/2016/1091290. [DOI] [PMC free article] [PubMed] [Google Scholar]
- 39.Peignier A, Planet PJ, Parker D. 2020. Differential induction of type i and iii interferons by Staphylococcus aureus. Infect Immun 88:e00352-20. doi: 10.1128/IAI.00352-20. [DOI] [PMC free article] [PubMed] [Google Scholar]
- 40.Bolger AM, Lohse M, Usadel B. 2014. Trimmomatic: a flexible trimmer for Illumina sequence data. Bioinformatics 30:2114–2120. doi: 10.1093/bioinformatics/btu170. [DOI] [PMC free article] [PubMed] [Google Scholar]
- 41.Langmead B, Salzberg SL. 2012. Fast gapped-read alignment with Bowtie 2. Nat Methods 9:357–359. doi: 10.1038/nmeth.1923. [DOI] [PMC free article] [PubMed] [Google Scholar]
- 42.Liao Y, Smyth GK, Shi W. 2019. The R package Rsubread is easier, faster, cheaper and better for alignment and quantification of RNA sequencing reads. Nucleic Acids Res 47:e47. doi: 10.1093/nar/gkz114. [DOI] [PMC free article] [PubMed] [Google Scholar]
- 43.Love MI, Huber W, Anders S. 2014. Moderated estimation of fold change and dispersion for RNA-seq data with DESeq2. Genome Biol 15:550. doi: 10.1186/s13059-014-0550-8. [DOI] [PMC free article] [PubMed] [Google Scholar]
- 44.Young MD, Wakefield MJ, Smyth GK, Oshlack A. 2010. Gene ontology analysis for RNA-seq: accounting for selection bias. Genome Biol 11:R14. doi: 10.1186/gb-2010-11-2-r14. [DOI] [PMC free article] [PubMed] [Google Scholar]
- 45.UniProt C. 2019. UniProt: a worldwide hub of protein knowledge. Nucleic Acids Res 47:D506–D515. [DOI] [PMC free article] [PubMed] [Google Scholar]
- 46.Tenenbaum D. 2019. KEGGREST: client-side REST access to KEGG. R package version 1.26.1.
Associated Data
This section collects any data citations, data availability statements, or supplementary materials included in this article.
Supplementary Materials
Figures S1 to S3, legends to Tables S1 to S3. Download AEM.00744-21-s0001.pdf, PDF file, 0.6 MB (631.2KB, pdf)
Tables S1 to S3. Download AEM.00744-21-s0002.xlsx, XLSX file, 0.4 MB (437.5KB, xlsx)
Data Availability Statement
The raw Illumina reads have been deposited in NCBI’s BioProject database under accession number PRJNA715655.