Abstract
Cytochrome P450BM-3 (P450BM-3) is a flavoprotein reductase-heme fusion protein from the bacterium Bacillus megaterium that has been well-characterized in many biophysical aspects. Although the enzyme is known to catalyze the hydroxylation of medium and long-chain fatty acids at high rates, no definitive physiological function has been associated with this process in the organism other than a possible protective role. We found that P450BM-3 rapidly hydroxylates alkyl sulfates, particularly those with 12–16 carbons (i.e., including dodecyl sulfate) in a similar manner to the fatty acids. The products were characterized as primarily ω−1 hydroxylated alkyl sulfates (plus some ω−2 and ω−3 hydroxylation products), and some further oxidation to dihydroxy and keto derivatives also occurred. Binding of the alkyl sulfates to P450BM-3 converted the iron from the low-spin to high-spin form in a saturable manner, consistent with the catalytic results. Rates of binding decreased as a function of increasing concentration of dodecyl sulfate or the fatty acid myristate. This pattern is consistent with a binding model involving multiple events and with conformational selection (equilibrium of the unbound enzyme prior to binding) instead of an induced fit mechanism. Neither C–H bond-breaking nor product release was found to be rate-limiting in the oxidation of lauric acid. The conformational selection results rationalize some known crystal structures of P450BM-3 and can help explain the flexibility of P450BM-3 and engineered forms in accepting a great variety of substrates.
Keywords: Cytochrome P450, BM-3, enzyme kinetics, dodecyl sulfate, hydroxylation, fatty acid oxidation, conformational selection, kinetic isotope effects
Graphical Abstract

INTRODUCTION
The > 381,000 cytochrome P450 (P450) enzymes (https://uniprot.org) are found in nearly all forms of life, even in viruses.1–2 The roles of the mammalian P450s in the metabolism of drugs, steroids, vitamins, and carcinogens have been studied extensively.3 Bacterial P450s have classically served as models for eukaryotic P450s, particularly in biophysical studies,4–5 but these enzymes also have important roles in the biosynthesis of natural products that can confer advantages to these organisms and may serve as pharmaceuticals for humans and other mammals.6–8 Catalysis by P450 enzymes can be understood largely in the context of a high valent iron-oxygen complex termed Compound I (formally FeO3+),9–10 named after a similar complex previously characterized in peroxidase chemistry.11
P450BM-3 (CYP102A1, UniProt P14779) was discovered in the bacterium Bacillus megaterium by Fulco and his associates.12 The native enzyme catalyzes the ω−1, ω−2, and ω−3 hydroxylations of various fatty acids13–14 at high rates (> 40 s−1). P450BM-3 (heme domain) was the second P450 to be crystallized,15–17 and the enzyme has been useful as a model in biophysical studies and homology-based docking with mammalian P450s.16, 18–19 An ACS SciFinder search yielded 1269 papers on this enzyme (using the terms “P450 BM-3 or P450 BM3 or P450 102A1 or CYP102A1”), and there are at least 78 crystal structures in the Protein Data Bank (including site-directed mutants). In addition, because of its lack of a need for a separate electron-donating partner, it has been a starting point for mutants that can be used for industrial purposes, and both rational and directed evolution approaches have been applied.20–25 Interestingly, the enzyme is also known to be inducible in the bacterium by barbiturates,26 for unknown physiological reasons. To our knowledge no auxotrophs have been reported, but overexpression of the repressor protein Bm3R1 leads to growth inhibition and sensitivity to fatty acid and barbiturate toxicity.27–28
The chemical similarity of alkyl sulfates and fatty acids (Figure 1) led us to consider the former compounds as alternative substrates for P450BM-3. Sodium dodecyl sulfate, the reagent most known in biochemistry for its use in denaturing gel electrophoresis, also has commercial applications, e.g. consumer products including shampoo and toothpaste. Mammalian metabolism results in ω- and ω−1 hydroxylation,29 similar to fatty acids (except for β-oxidation). Shaw et al.30 reported that, like palmitate, sodium dodecyl sulfate could induce P450BM-3 in B. megaterium. As a part of an electrochemistry study in which P450BM-3 was incorporated into thin-layer films, Udit et al.31 observed that sodium dodecyl sulfate could shift the spin state of P450BM-3 from low-spin to high-spin. Axarli et al.32 studied the application of a related protein, B. subtilis P450 102A2 (CYP102A2), as a catalyst for bioremediation of dodecyl sulfate. Of interest was the sigmoidal nature of both dodecyl sulfate binding and catalysis (analyzed only by NADPH oxidation rates), which were very unusual. Even before the Axarli et al. report,32 Gustafsson et al.33 studied the related B. subtilis P450 102A2 and 102A3 proteins (CYP102A2, CYP102A3) and reported sigmoidal patterns of both binding and catalytic activity with some, but not all, methyl-substituted fatty acids.
Figure 1.
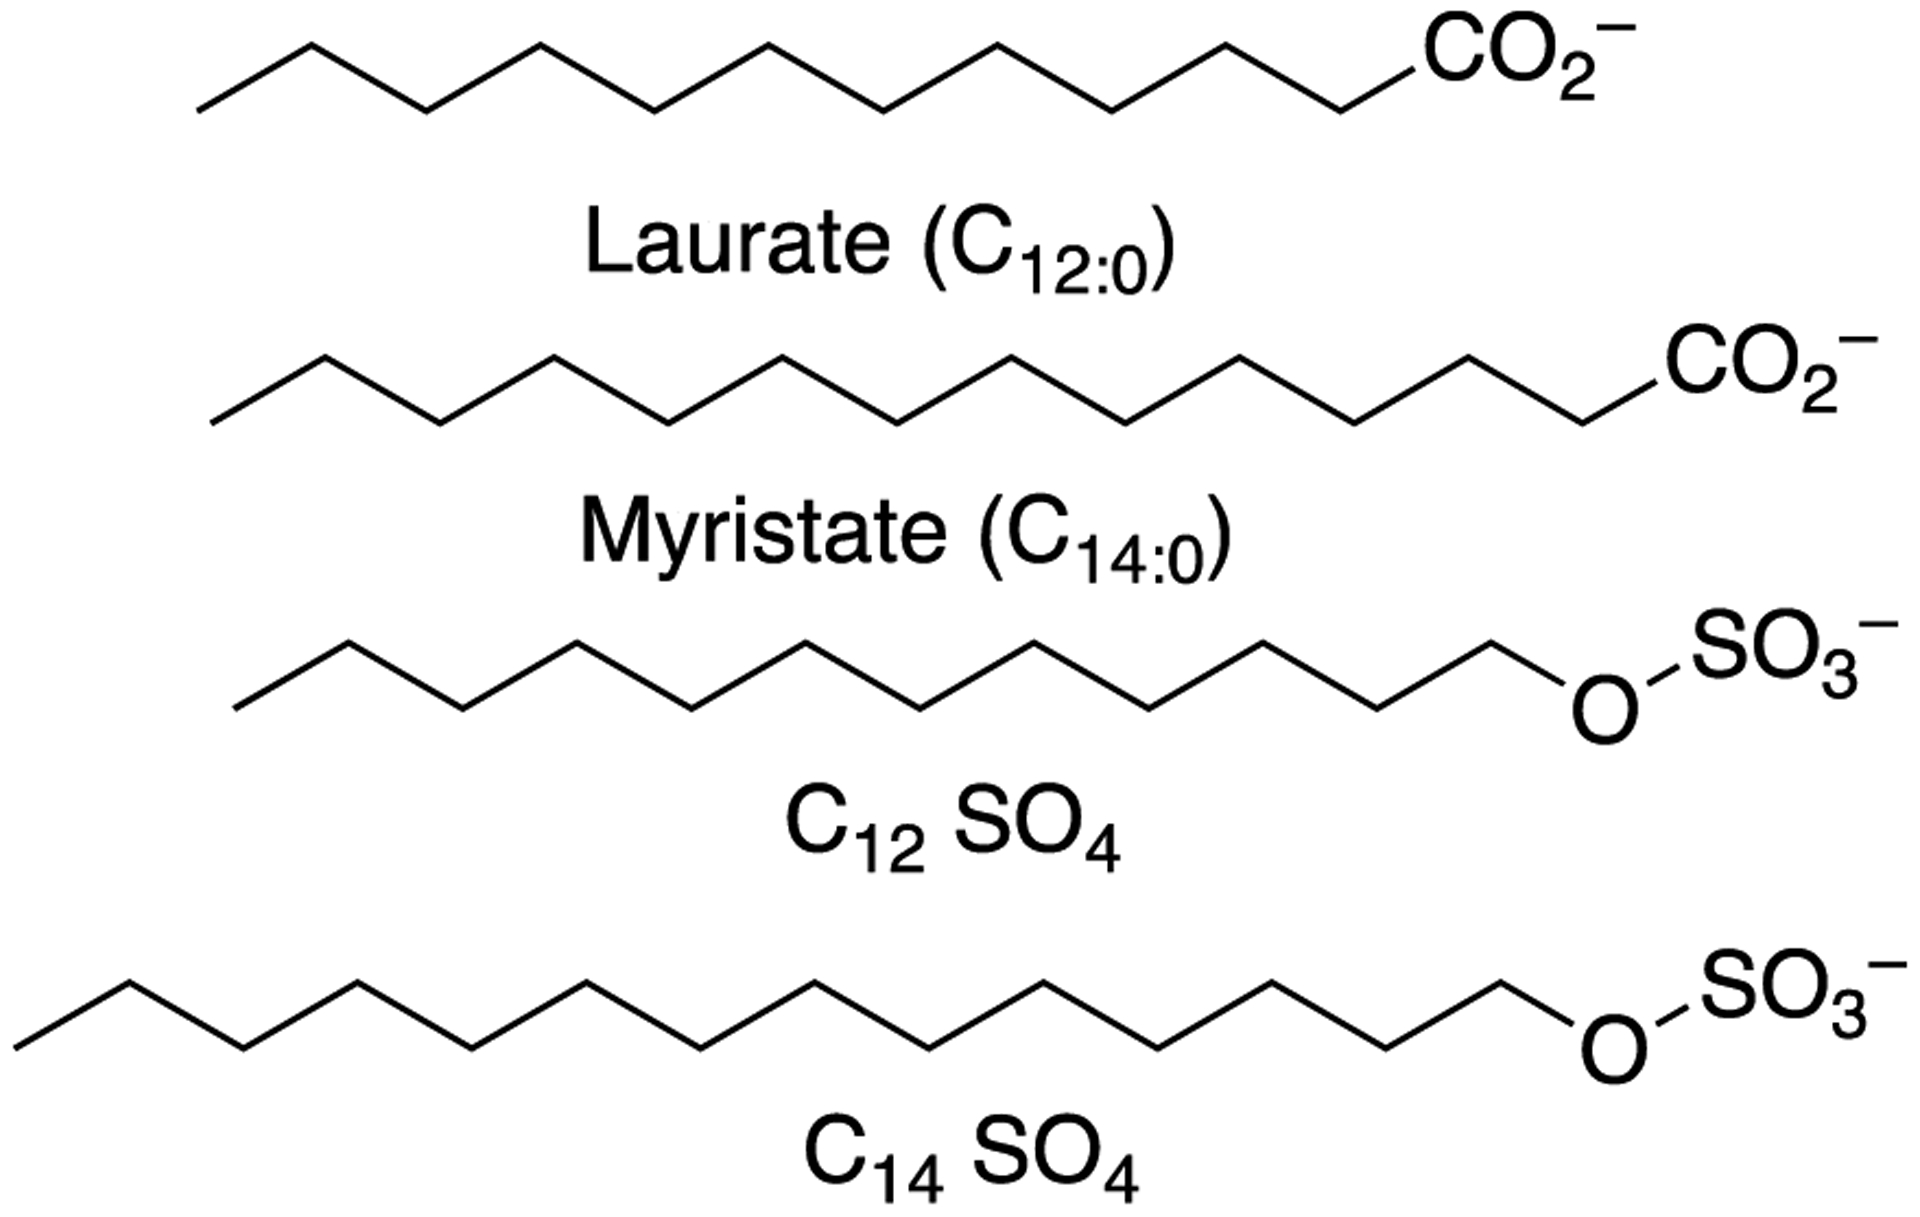
Structures of lauric acid and dodecyl and tetradecyl sulfates.
We found that alkyl sulfates are oxidized even faster than the corresponding fatty acids and acyl amino acids. As model substrates, the alkyl sulfates have some advantages in solubility. The oxidation products are similar to those derived from fatty acids. Although the practical implications of oxidation of alkyl sulfates are probably not an issue, these substrates have increased solubility and some advantages as tools in studying basic aspects of catalysis in this system.
A general question regarding enzyme selectivity involves the roles of induced fit and conformational selection in complex substrate binding phenomena34–35 (Scheme 1), which has parallels in receptor activation in pharmacology.36
Scheme 1.
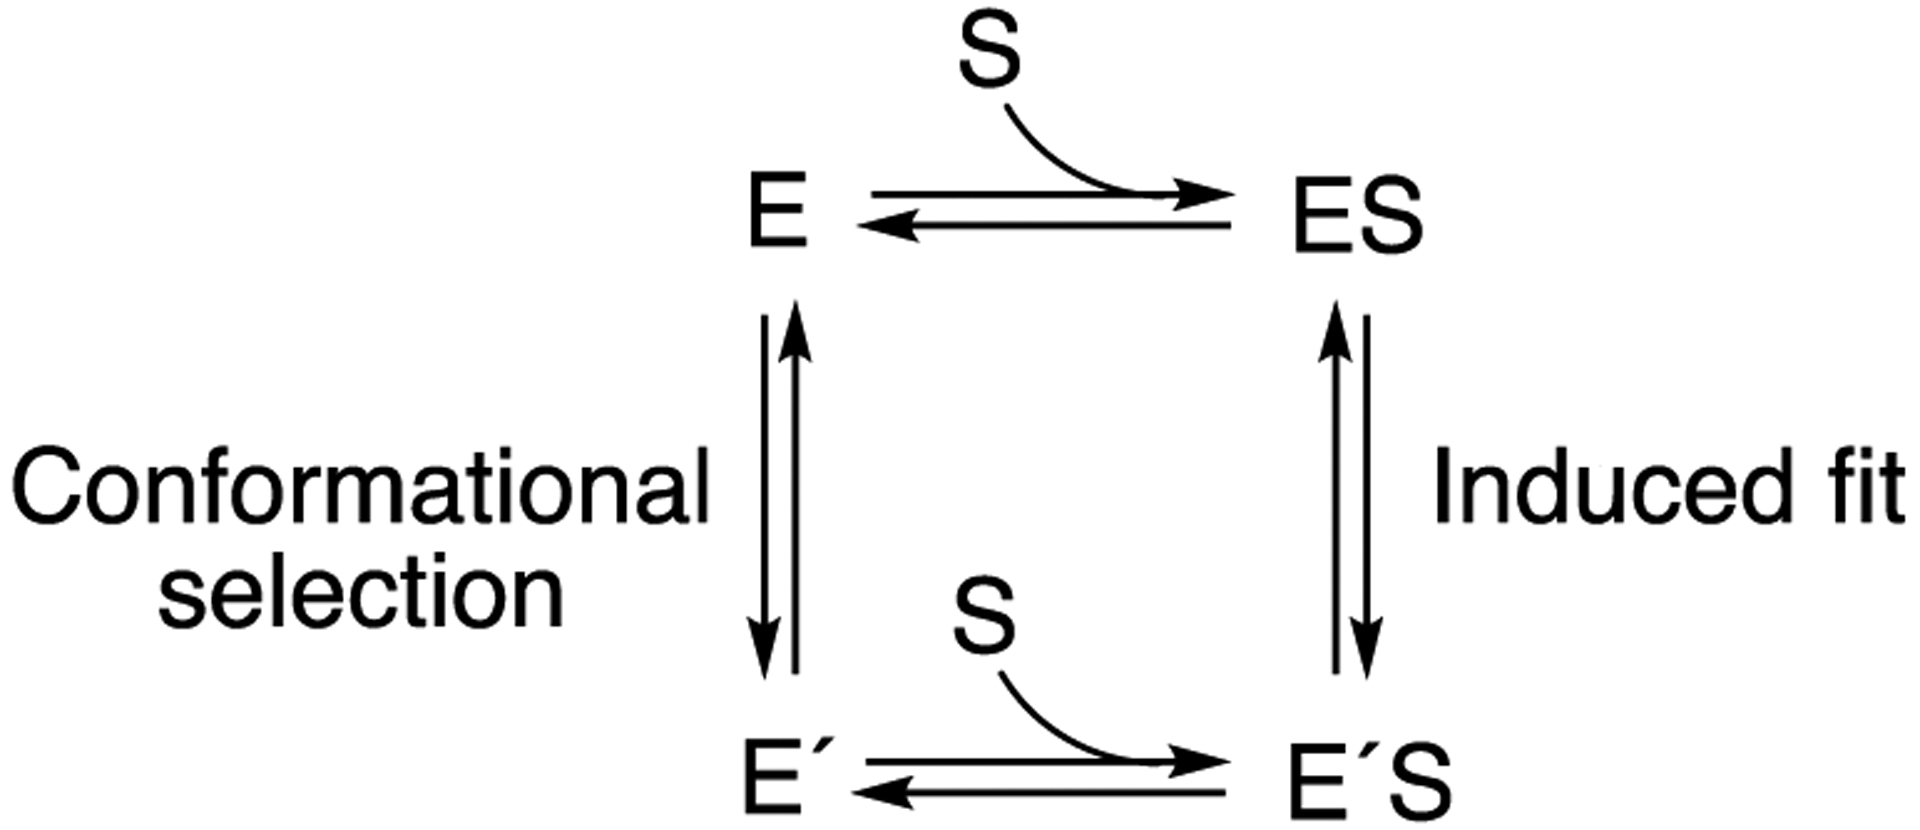
Alternate mechanisms for conformational changes related to substrate binding in enzymes. See references34, 37–38.
Recent studies with several human P450 enzymes have indicated a role for conformational selection,37, 39 and we considered what might be a simpler bacterial P450 here. Analysis of rates of alkyl sulfate (substrate) binding support a conformational selection model that is consistent with previous observations about the effects of a particular amino acid substitution on the crystal structure.40–41
RESULTS
Initial Screening of Reactions with Alkyl Sulfates.
P450BM-3 has long been known to catalyze hydroxylation of medium-length and long-chain fatty acids,12, 42–43 suggesting that the corresponding alkyl sulfates might also be substrates (Figure 1). Initial examination indicated that these induced low- to high-spin state conversions (Figure 2A). Dodecyl sulfate, the popular denaturant used in protein electrophoresis, induced rapid NADPH oxidation when this compound was added to P450BM-3.
Figure 2.
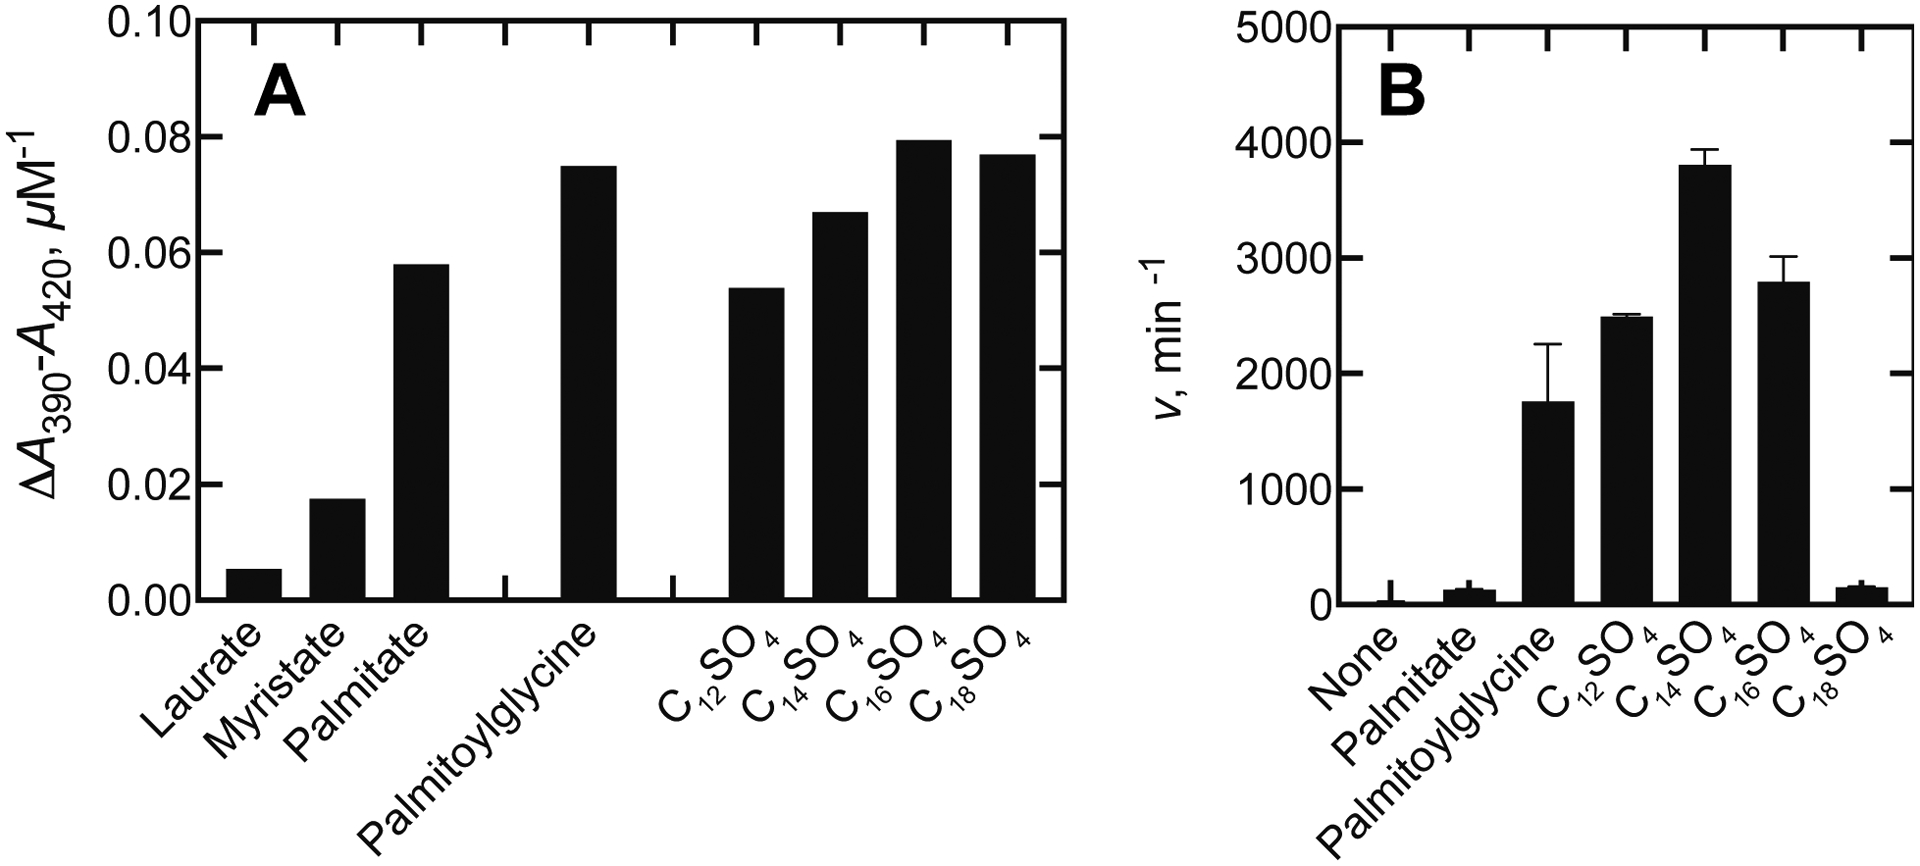
Initial screens of fatty acids and alkyl sulfates by P450BM-3. A. Initial comparisons of the extent of Type I difference spectral changes of P450BM-3 with fatty acids and alkyl sulfates. All values are expressed as ΔA390-A420 units per μM P450 BM-3 (done with 1 or 2 μM P450BM-3 and 500 μM concentrations for laurate and myristate, 200 μM in the case of dodecyl sulfate (C12SO4, 50 μM for other alkyl sulfates–C14, C16, C18). B. Rates (v) were determined by oxidation of NADPH (ΔA340) and are presented as means ± SD of triplicate assays (nmol NADPH oxidized/min/nmol P450BM-3 (units equivalent to “ min−1”). The substrate concentration was 200 μM in each case.
A screen of several alkyl sulfates showed that these induced “Type I” binding spectra (i.e., low- to high-spin iron conversion) as well or better than known fatty acid substrates (Figure 2A). The alkyl sulfates also stimulated NADPH oxidation, indicative of oxidation of the alkyl sulfates, with the highest activity being observed with 12-, 14-, and 16-carbon alkyl sulfates. The rates were much higher than with the classic substrate palmitate and even higher than for the preferred substrate N-palmitoylglycine19 (Figure 2B). In these P450BM-3 systems there is very little “uncoupling,” i.e., operation of the catalytic cycle with oxidation of NADPH and reduction of oxygen (to O2•–, H2O2) in the absence of substrate oxidation. The rate of NADPH oxidation in the absence of a substrate was 5–7 min−1 (at room temperature) and was subtracted in each case.
Overall, the extent of the spectral changes did not vary much except for the medium chain length fatty acids laurate and myristate (Figure 2A). However, the rates of NADPH oxidation in the presence of the different alkyl sulfates and fatty acids varied considerably among them (all measured at high concentrations, Figure 2B), more than expected based on binding.
The spectral binding is shown in more detail in Figure S1 of the Supporting Information. The absolute spectra in Figure 3 are distorted from other P450s because of the two flavins present, which have absorbance peaks at 380 and 450 nm. P450BM-3 is essentially completely low-spin in the absence of a substrate, as indicated by (i) the position of the Soret band (Figure S1A), (ii) the presence of the α and β bands in the 500–600 nm region (Figure S1B), (iii) the absence of the high-spin band at 650 nm (Figure S1B), and (iv) the single negative peak seen at 417 nm in the second derivative spectrum,44 which is split upon the addition of tetradecyl sulfate (Figure S1C).
Figure 3.
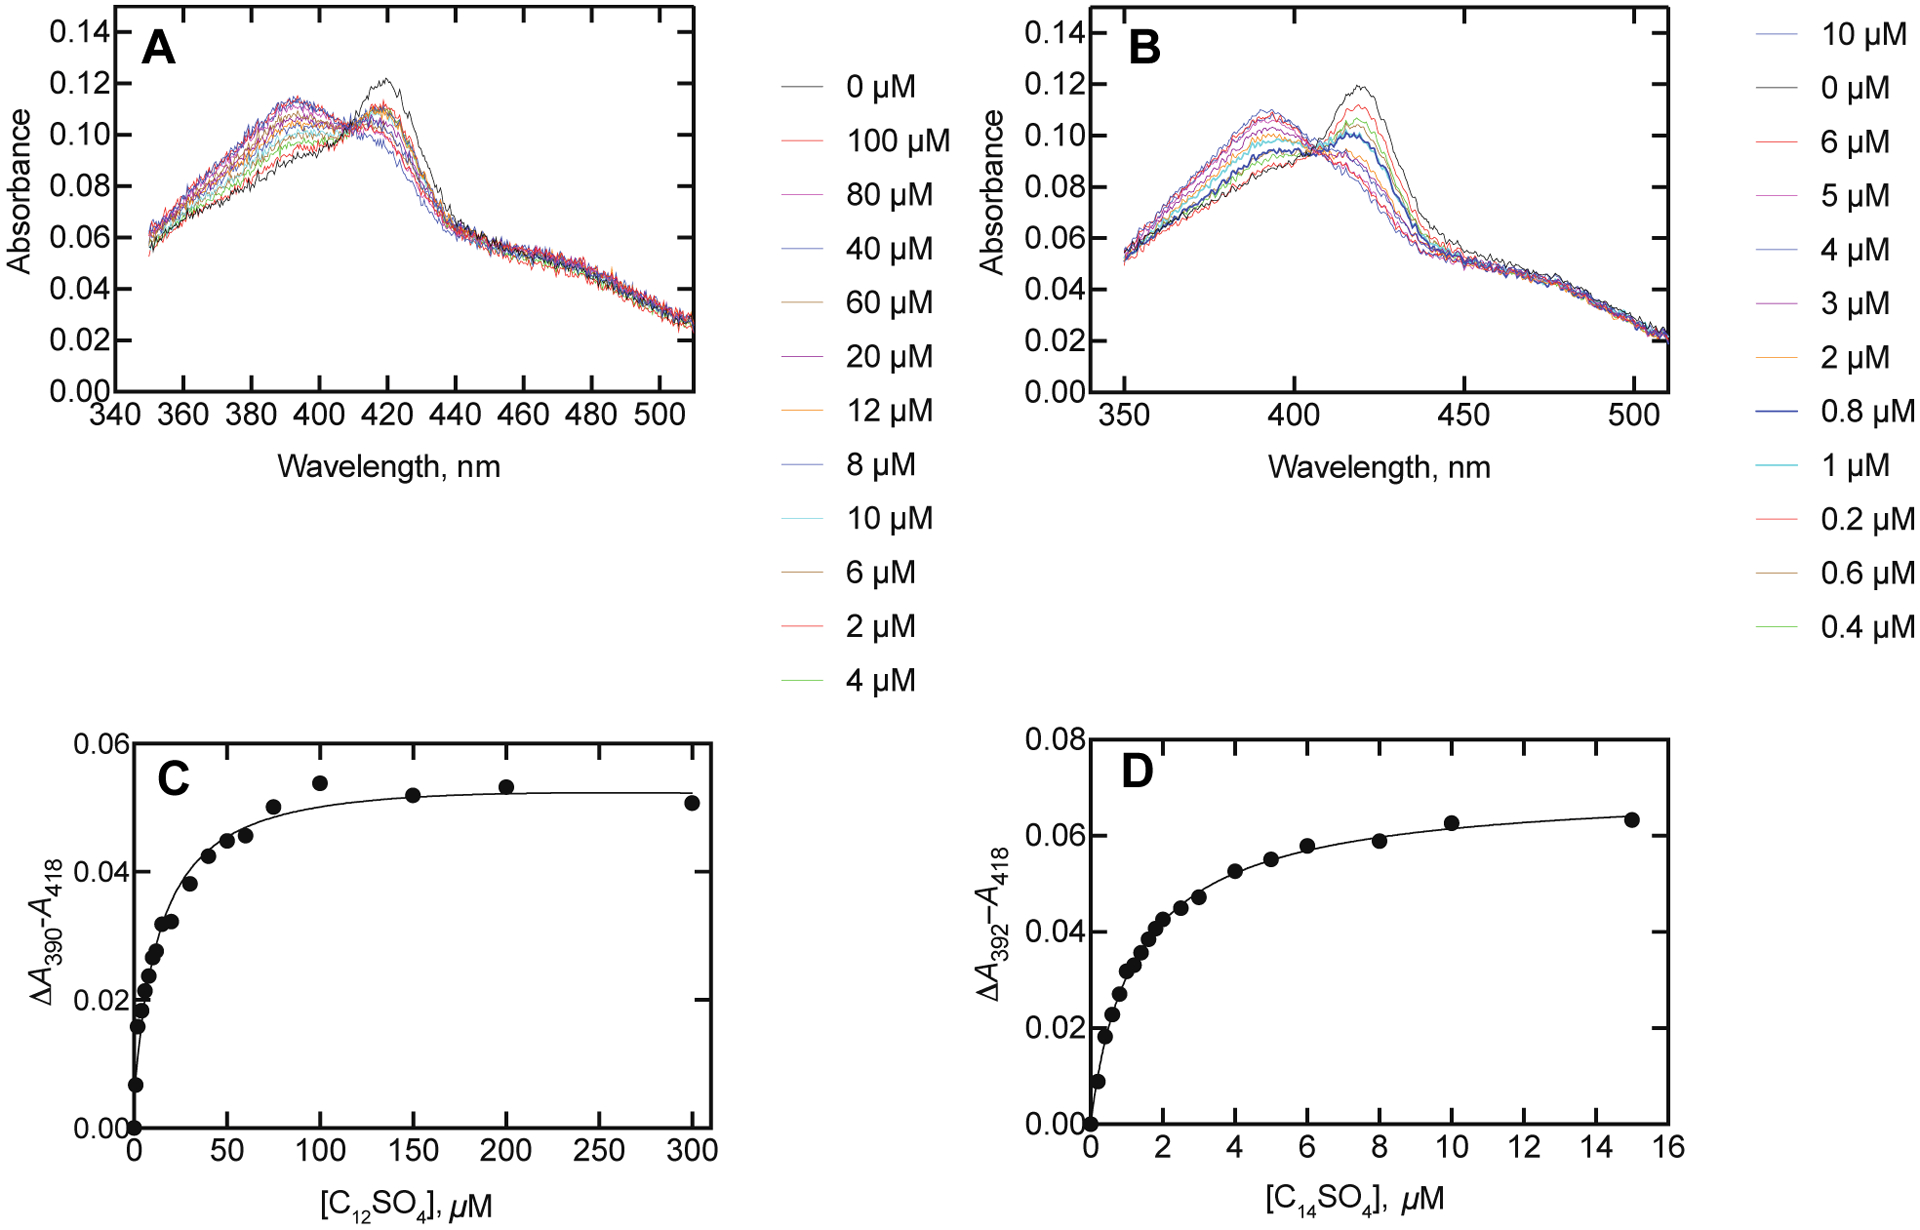
P450BM-3 spectral changes observed during titrations with alkyl sulfates. A. Dodecyl sulfate. B. Tetradecyl sulfate. The P450BM-3 concentration was 1.0 μM and the additions of the alkyl sulfates (final concentrations) are indicated in the colored legends. Plots of spectral titrations of P450BM-3 with alkyl sulfates: C. Dodecyl sulfate (Kd 14 ± 2 μM). D. Tetradecyl sulfate (Kd 1.4 ± 0.1 μM). For Part D, see Figure S1 of the Supporting Information for the P450BM-3 second derivative spectra.
Steady-state Analysis of Binding of Alkyl Sulfates.
More quantitative analyses with dodecyl sulfate and tetradecyl sulfate showed almost complete shifts to high-spin iron at saturating concentrations of these detergents (Figure 3A, 3B). The measured Kd values for dodecyl sulfate and tetradecyl sulfate were 14 ± 2 and 1.4 ± 0.1 μM, respectively (Figure 3C, 3D). These can be compared to the values of 29 μM for laurate (12 carbons, Fig. 12, vide infra) and 12 μM for myristate (14 carbons, (from work in Fig. 10, vide infra, results not shown). The respective Kd values in the previous literature vary from 27–390 μM and from 0.5 to 78 μM for laurate and myristate, respectively, although the buffer conditions appear to affect these.45
Figure 12.
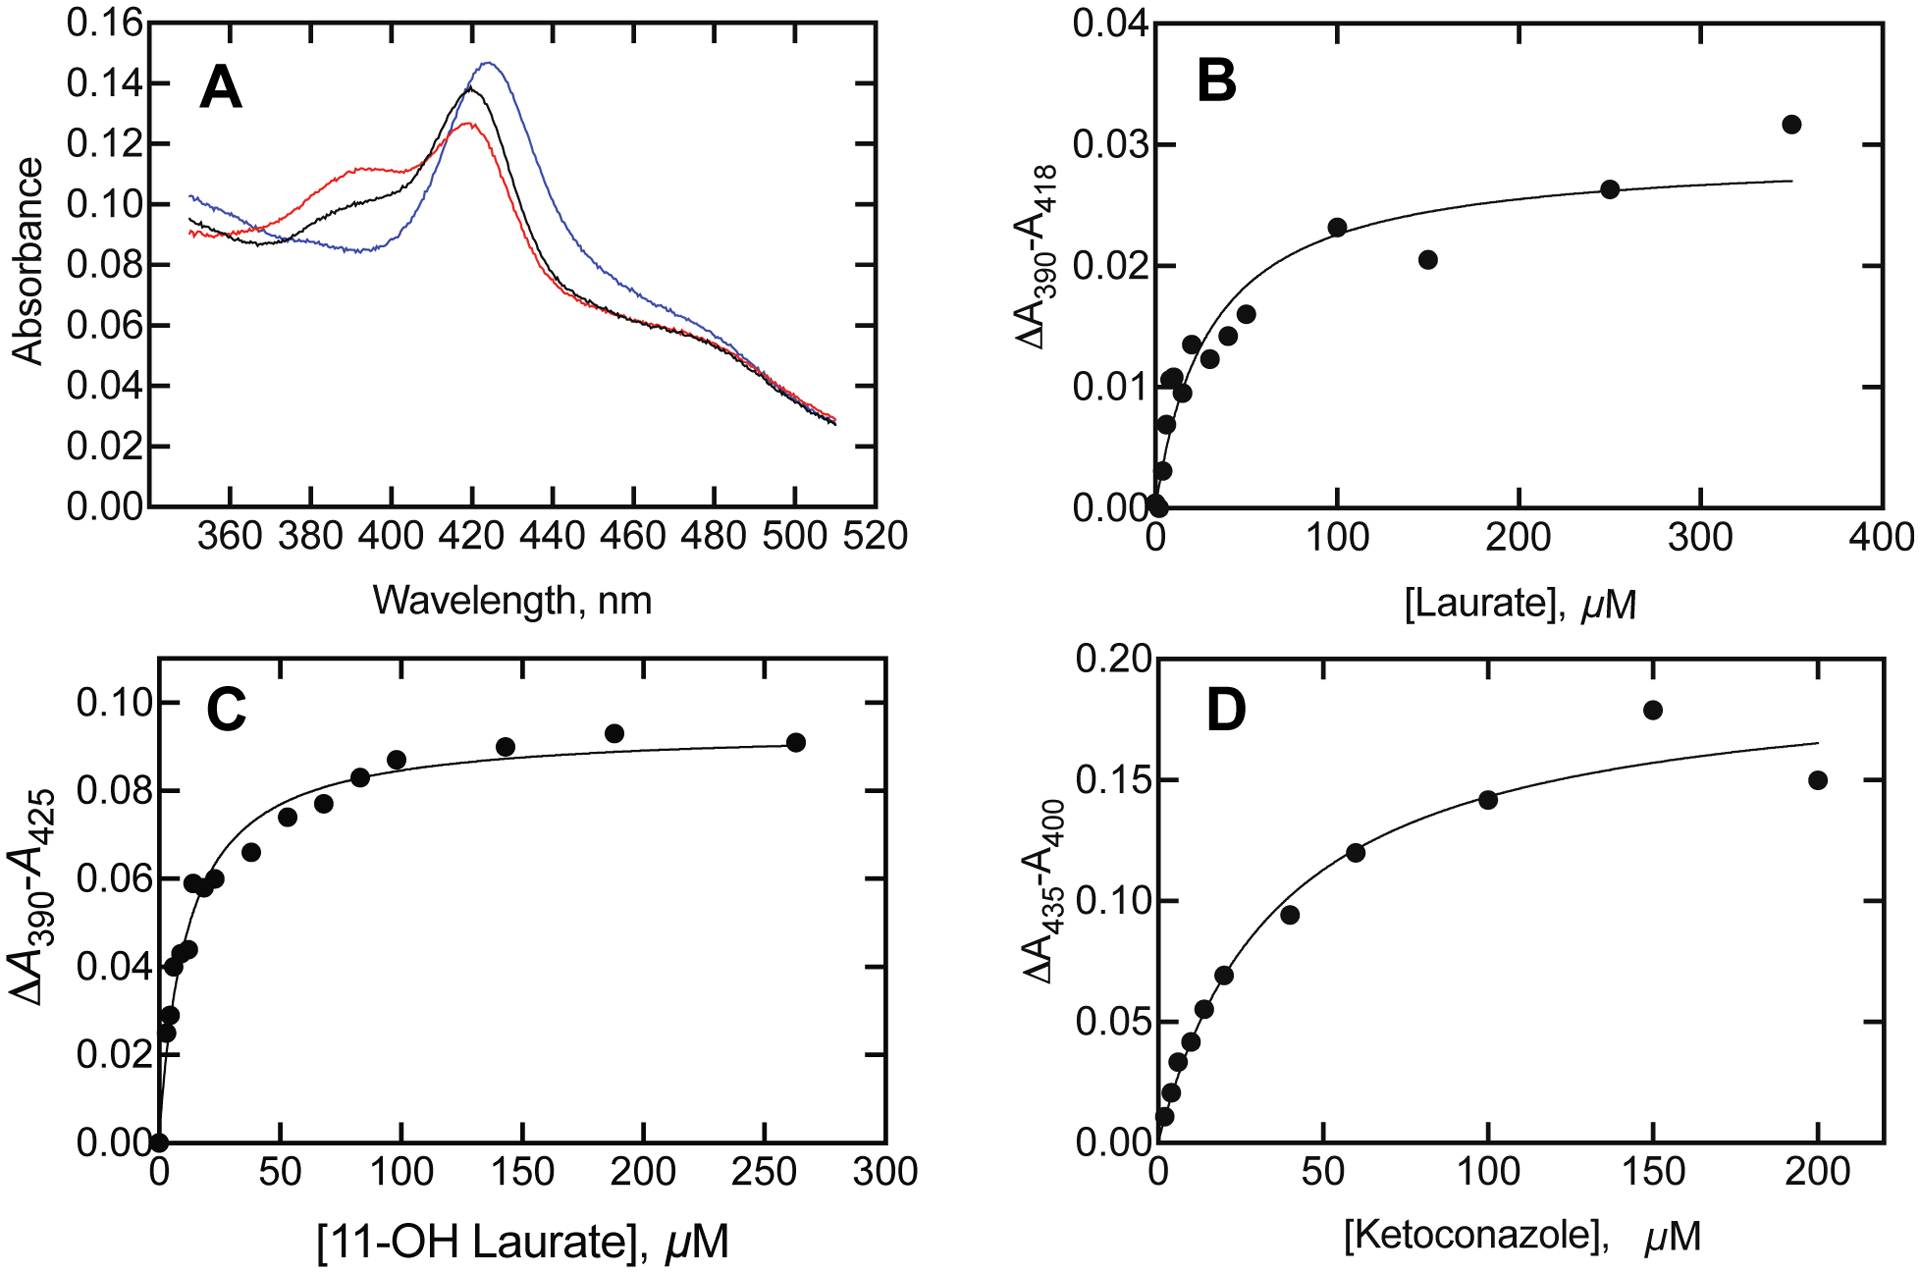
Binding of lauric acid, 11-OH lauric acid, and ketoconazole to P450BM-3. P450BM-3 (1.2 μM) was present in 50 mM potassium MOPS buffer (pH 7.4). A. Spectra are indicated for P450BM-3 (black line) and the sequential addition of 200 μM 11-OH lauric acid (red line) and then 200 μM ketoconazole (blue line). B. Binding of lauric acid to P450BM-3 (1.2 μM P450BM-3), Kd 29 ± 6 μM. C. Binding of 11-OH lauric acid to P450BM-3 (4 μM P450BM-3, Kd 8.0 ± 2.0 μM. D. Binding of ketoconazole to P450BM-3 (1.2 μM P450BM-3), Kd 37 ± 8 μM.
Figure 10.
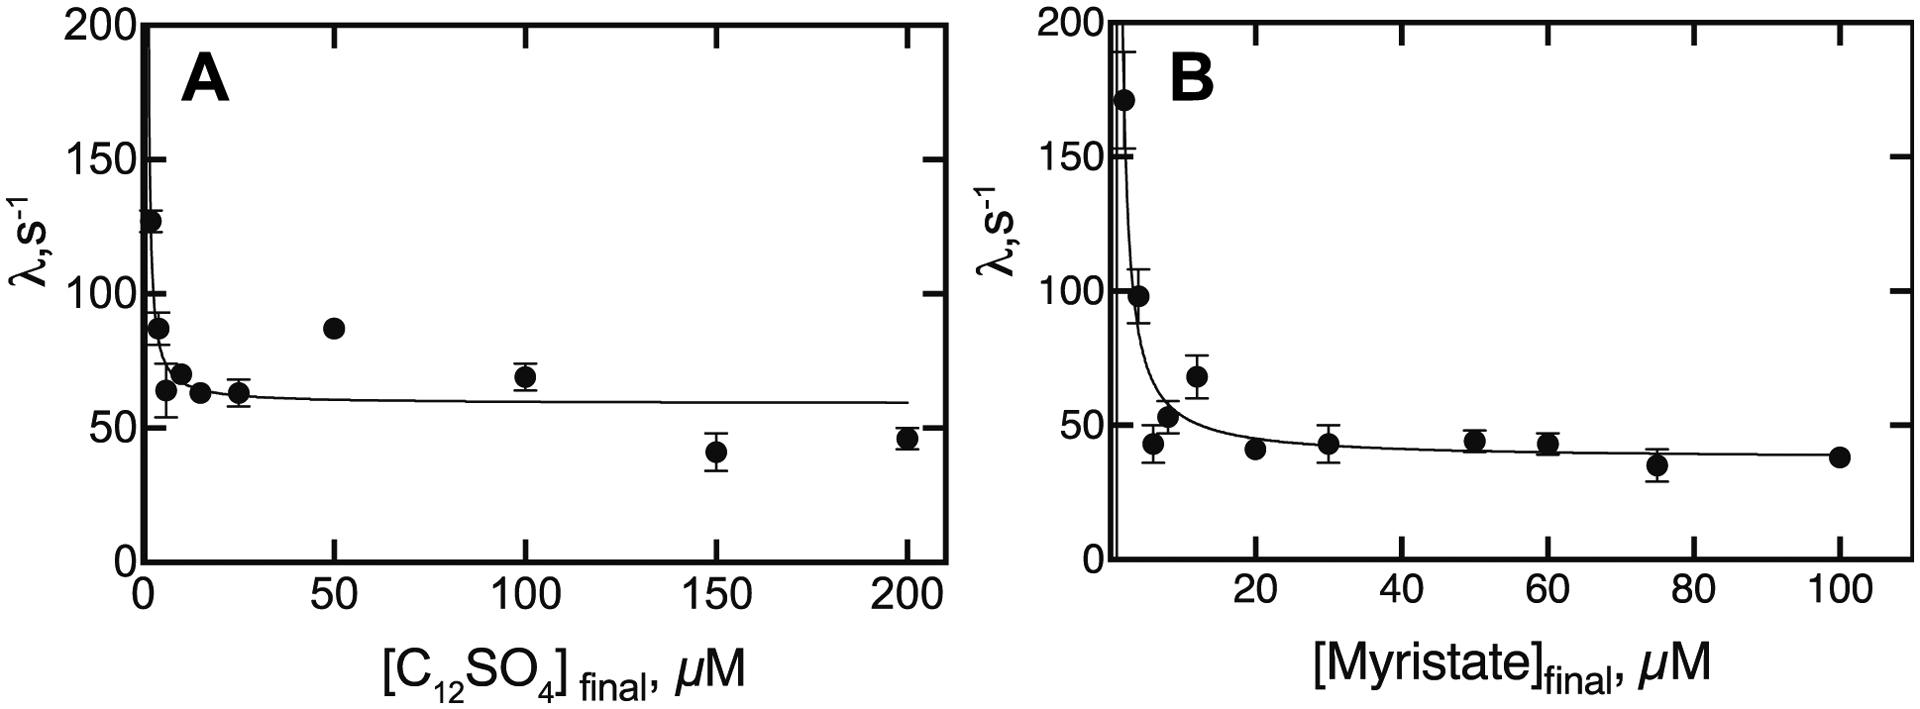
A. Eigenvalues of spectral changes upon mixing P450BM-3 (1 μM final concentration) with varying concentrations of dodecyl sulfate. First-order eigenvalues (λ) were estimated from the plots in Figure 11 (≥ 4 traces averaged in OLIS Global Works software, with the indicated SD for the fit shown in each case). B. Similar experiments were done with myristate as in Part A. The lines were fit with the equation λ = kf + kr (Kd/Kd + S), set as Y = kf + kr * Kd (Kd + X) in GraphPad Prism.
Analysis of Reactions with Dodecyl Sulfate and Tetradecyl Sulfate.
NADPH oxidation was used as a means of monitoring the reactions not only because of convenience but also because it provides a continuous mode for defining the linear phases of the reactions.
Steady-state kinetic analysis yielded specificity constants (kcat/Km) of 6 × 10⁵ M−1 s−1 for dodecyl sulfate, 7.7 × 10⁶ M−1 s−1 for tetradecyl sulfate, 3.3 × 10⁴ M−1 s−1 for palmitate, and 1.1 × 10⁶ M−1 s−1 for N-palmitoylglycine, respectively (Figure 4).
Figure 4.
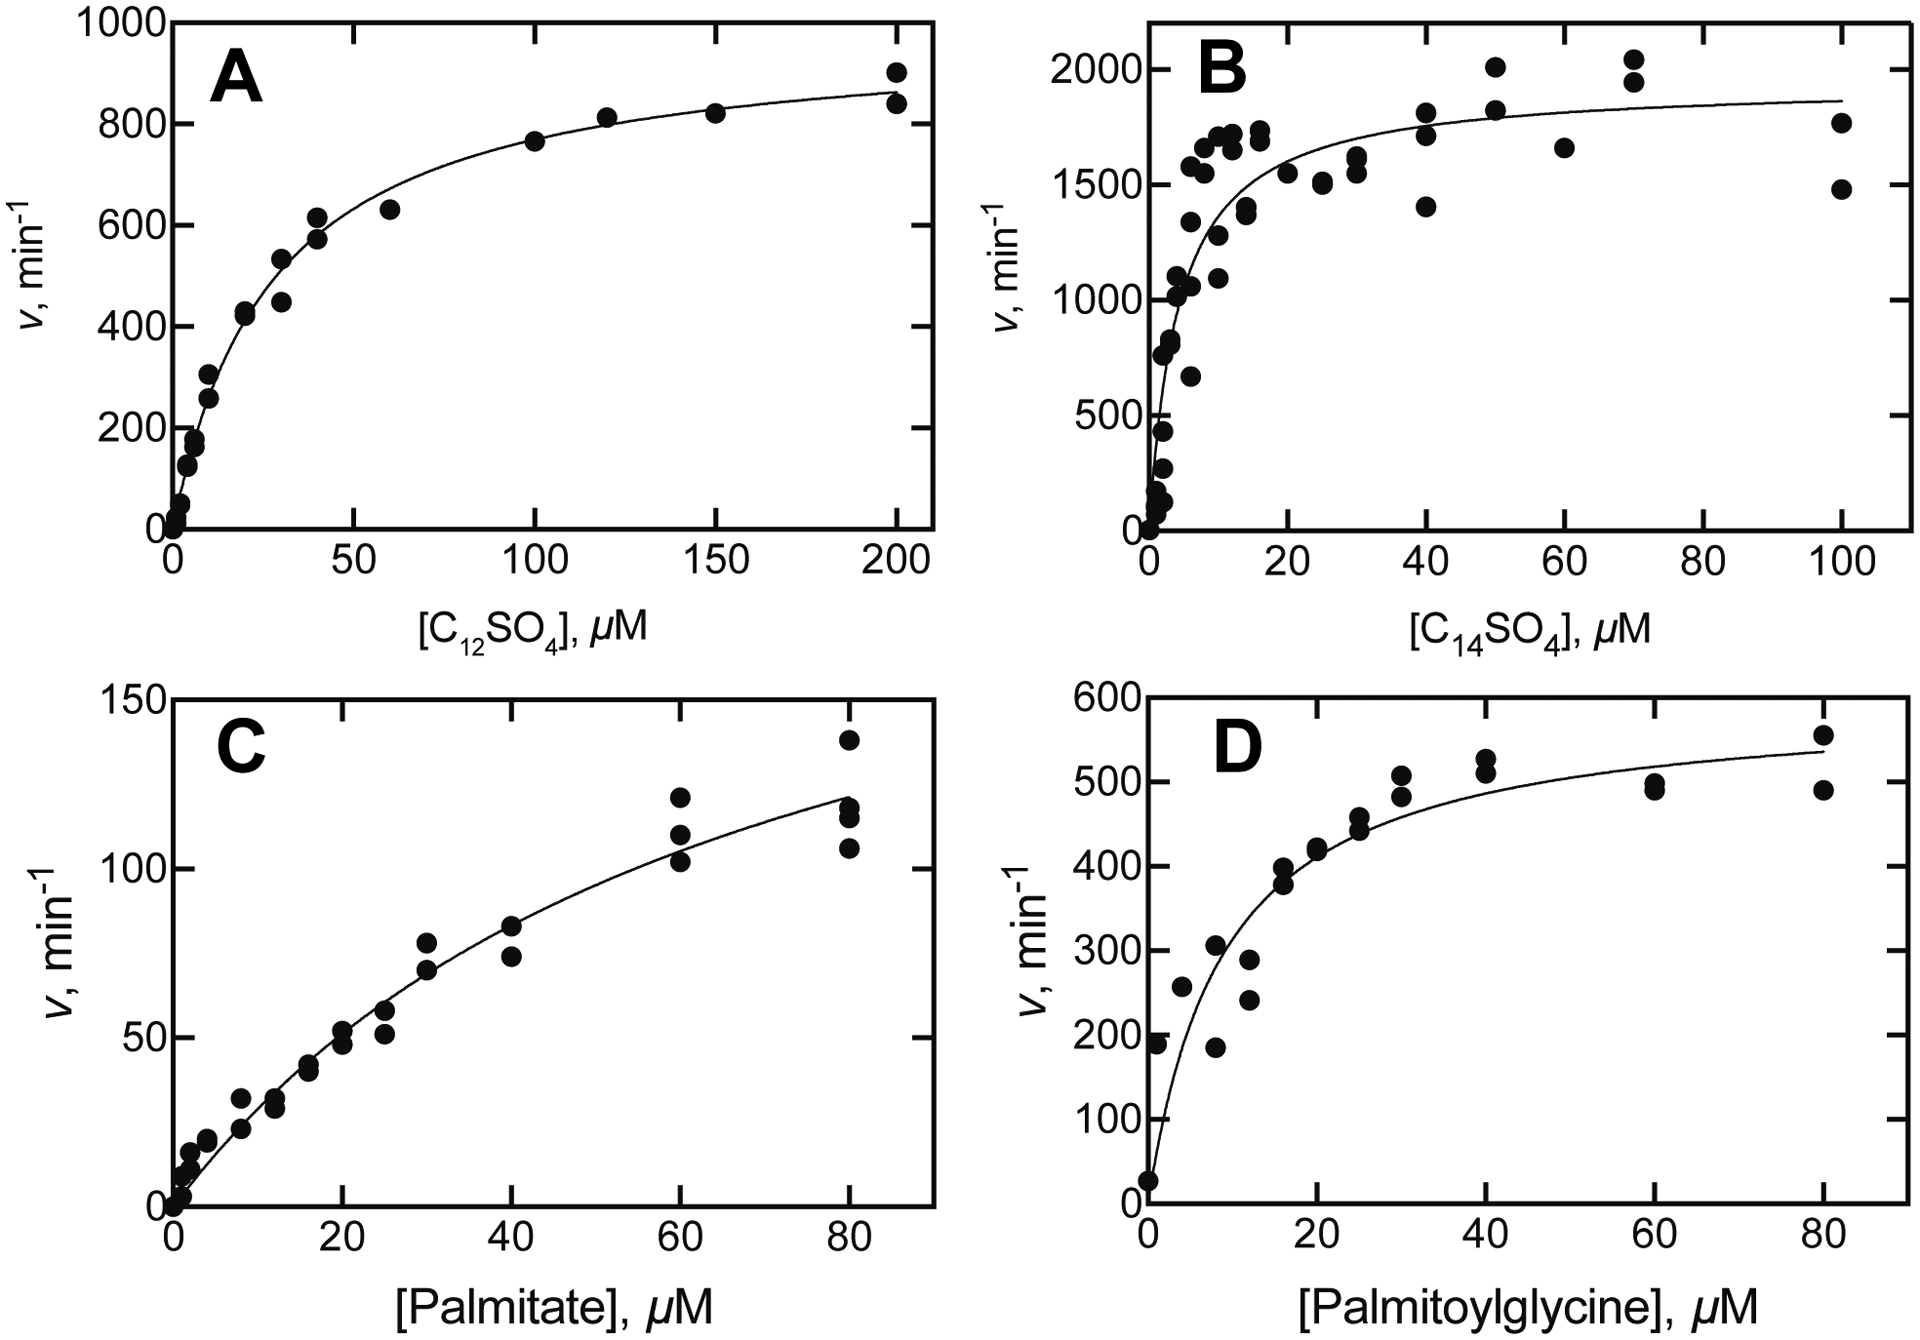
Steady-state kinetics of oxidation of alkyl sulfates and fatty acids by P450BM-3. Measurements were based on rates of oxidation of NADPH and the lines show hyperbolic fits to the data points. A. Dodecyl sulfate (C12SO4): kcat 980 ± 20 min−1, Km 28 ± 1 μM; kcat/Km 36 ± 2 μM−1 min−1 (7.7 × 10⁵ M−1 s−1). B. Tetradecyl sulfate (C14SO4): kcat 1940 min−1, Km 4.2 ± 0.6 μM, kcat/Km 460 ± 60 μM−1 min−1 (3 × 10⁶ M−1 s−1). C. Palmitic acid: kcat 220 ± 20 min−1, Km 67 ± 8 μM, kcat/Km 3.3 ± 0.3 × 10⁵ μM−1 min−1 (5.5 × 10⁴ M−1 s−1). D. N-Palmitoylglycine: kcat 595 ± 40 min−1, Km 9 ± 2 μM, kcat/Km 66 ± 12 μM min−1 (1.1 × 10⁶ M−1s−1).
UPLC-HRMS traces of the reaction products of tetradecyl sulfate are shown in Figure 5. All products were well separated from the substrate. A single peak corresponding to an initial hydroxylation product(s) was detected, as indicated by the [M + 16]¯ profile (Figure 5A). That product(s) was apparently oxidized to a ketone (or possibly an aldehyde), as judged by the [M + 14]¯ trace, i.e. corresponding to the addition of 16 a.m.u. and then loss of 2 a.m.u (Figure 5B), and a hydroxy-ketone product was apparently also formed ([M + 30]–, Figure 5C), as well as a dihydroxy product [M + 32]– (Figure 5D).
Figure 5.
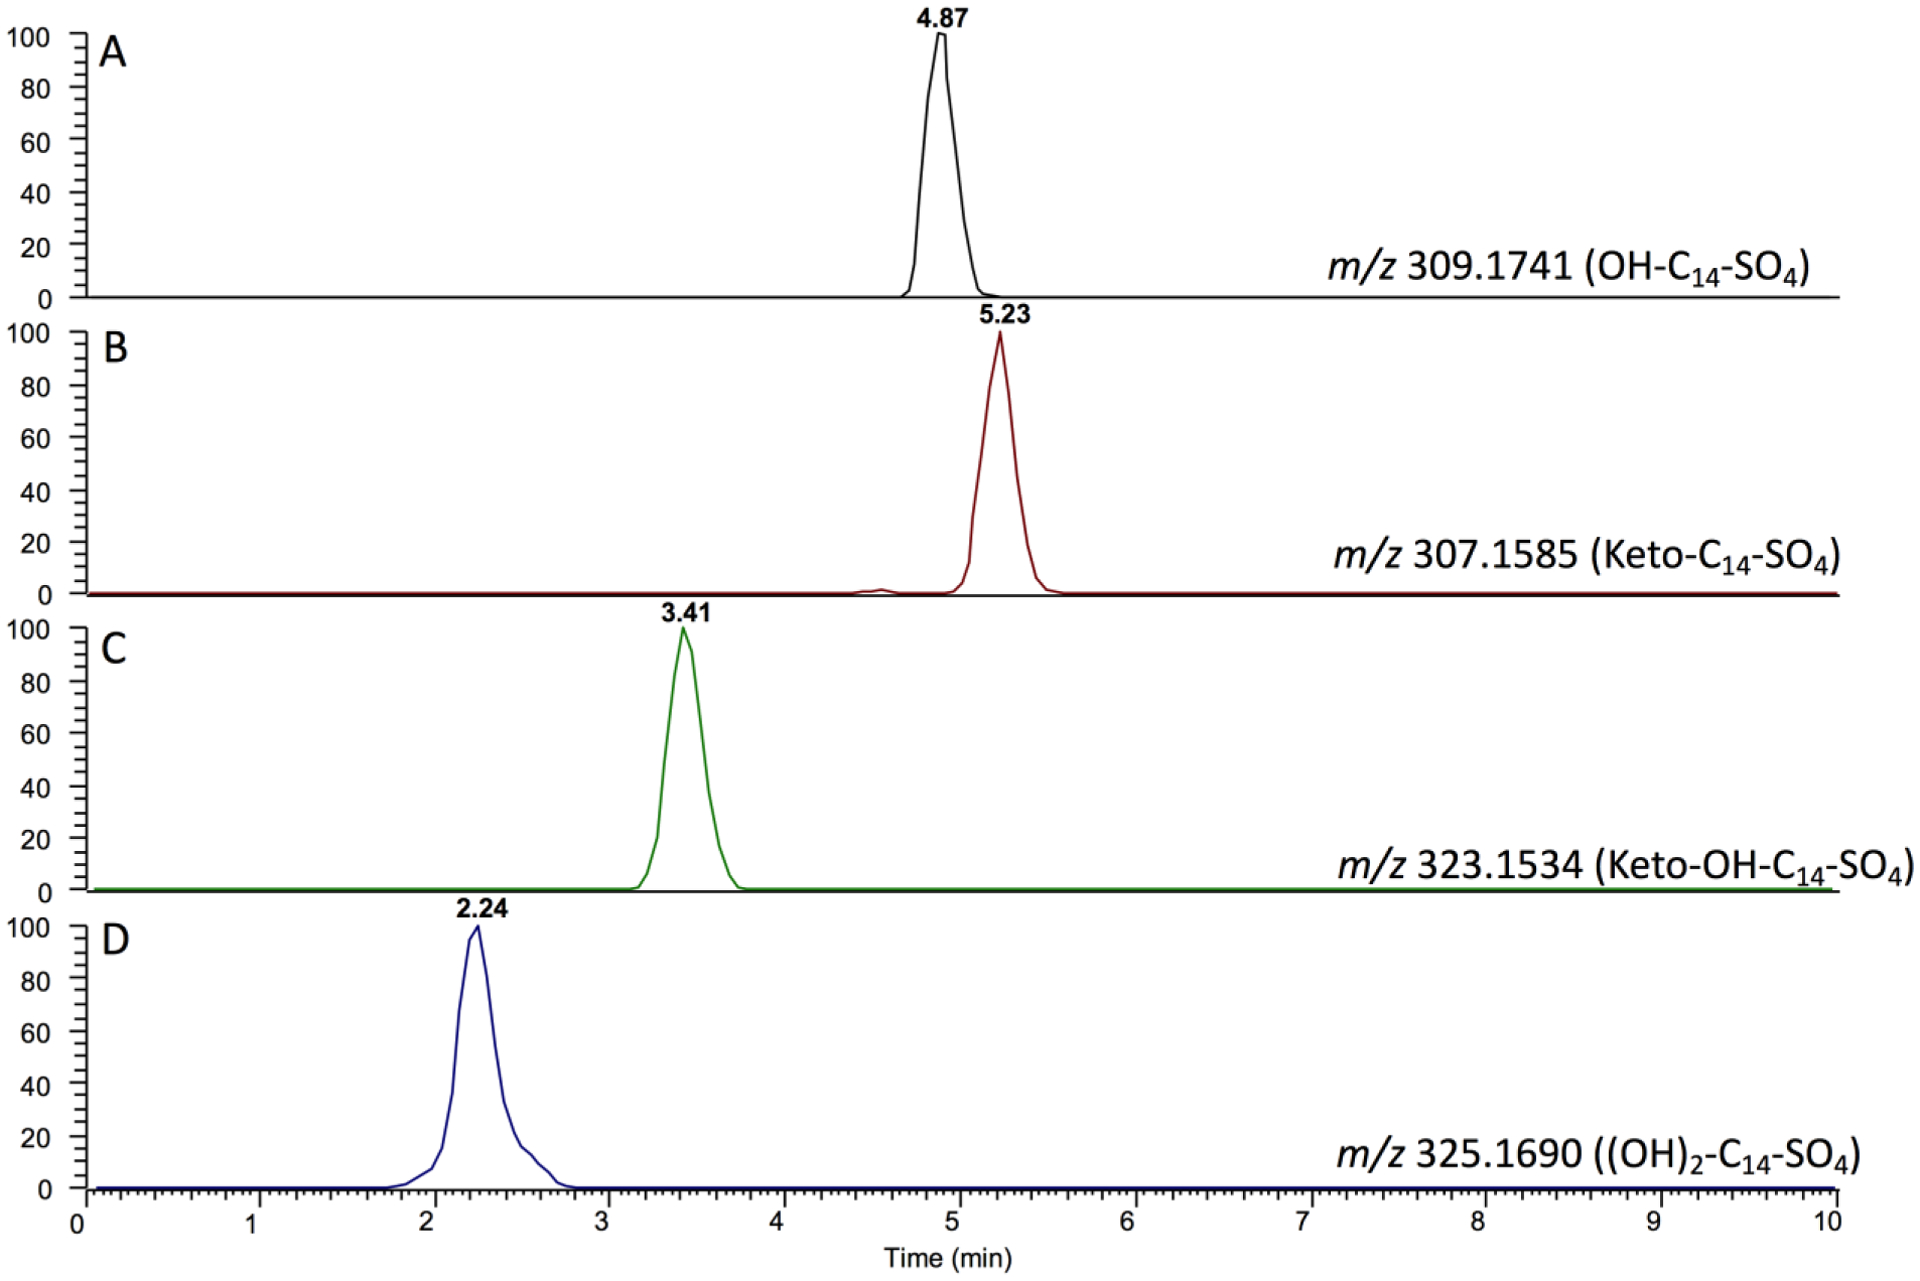
LC-HRMS of P450BM-3 reaction products. The traces were obtained 7 minutes after the reaction began with 25 nM P450BM-3, 100 μM tetradecyl sulfate, and 150 μM NADPH at room temperature. The samples were analyzed directly by LC-HRMS (negative ion mode). A. OH-tetradecyl sulfate channel (m/z 309.1741). B. Keto-tetradecyl sulfate channel (m/z 307.1585). C. Ketone plus OH tetradecyl sulfate channel (m/z 323.1534). D. Dihydroxy ((OH)2)-tetradecyl sulfate channel (m/z 325.169).
Attempts to utilize direct fragmentation analysis46 to characterize the hydroxylation products of the alkyl sulfates were unsuccessful because of the tendency to lose the sulfate group. Accordingly we resorted to an approach used previously with P450BM-3 product identification (Scheme 2).42 The reactions were stopped when only mono-hydroxylated products were formed. These were converted to the corresponding ketones with Jones reagent (CrO3),47 which in turn were converted to esters using a chemical Baeyer-Villiger reaction (CF3CO3H)48 and then fragmented in (negative ion) LC-MS/MS (Figure 6) or subjected to base hydrolysis to alcohols and LC-MS (Figure 7). The traces indicated primarily ω−1 hydroxylation for both tetradecyl and dodecyl sulfate, with smaller amounts of ω−2 hydroxylation (for tetradecyl and dodecyl sulfate) and some ω−3 hydroxylation in the case of tetradecyl sulfate (Figure 7, Supporting Information Figures S3, S4).
Scheme 2.
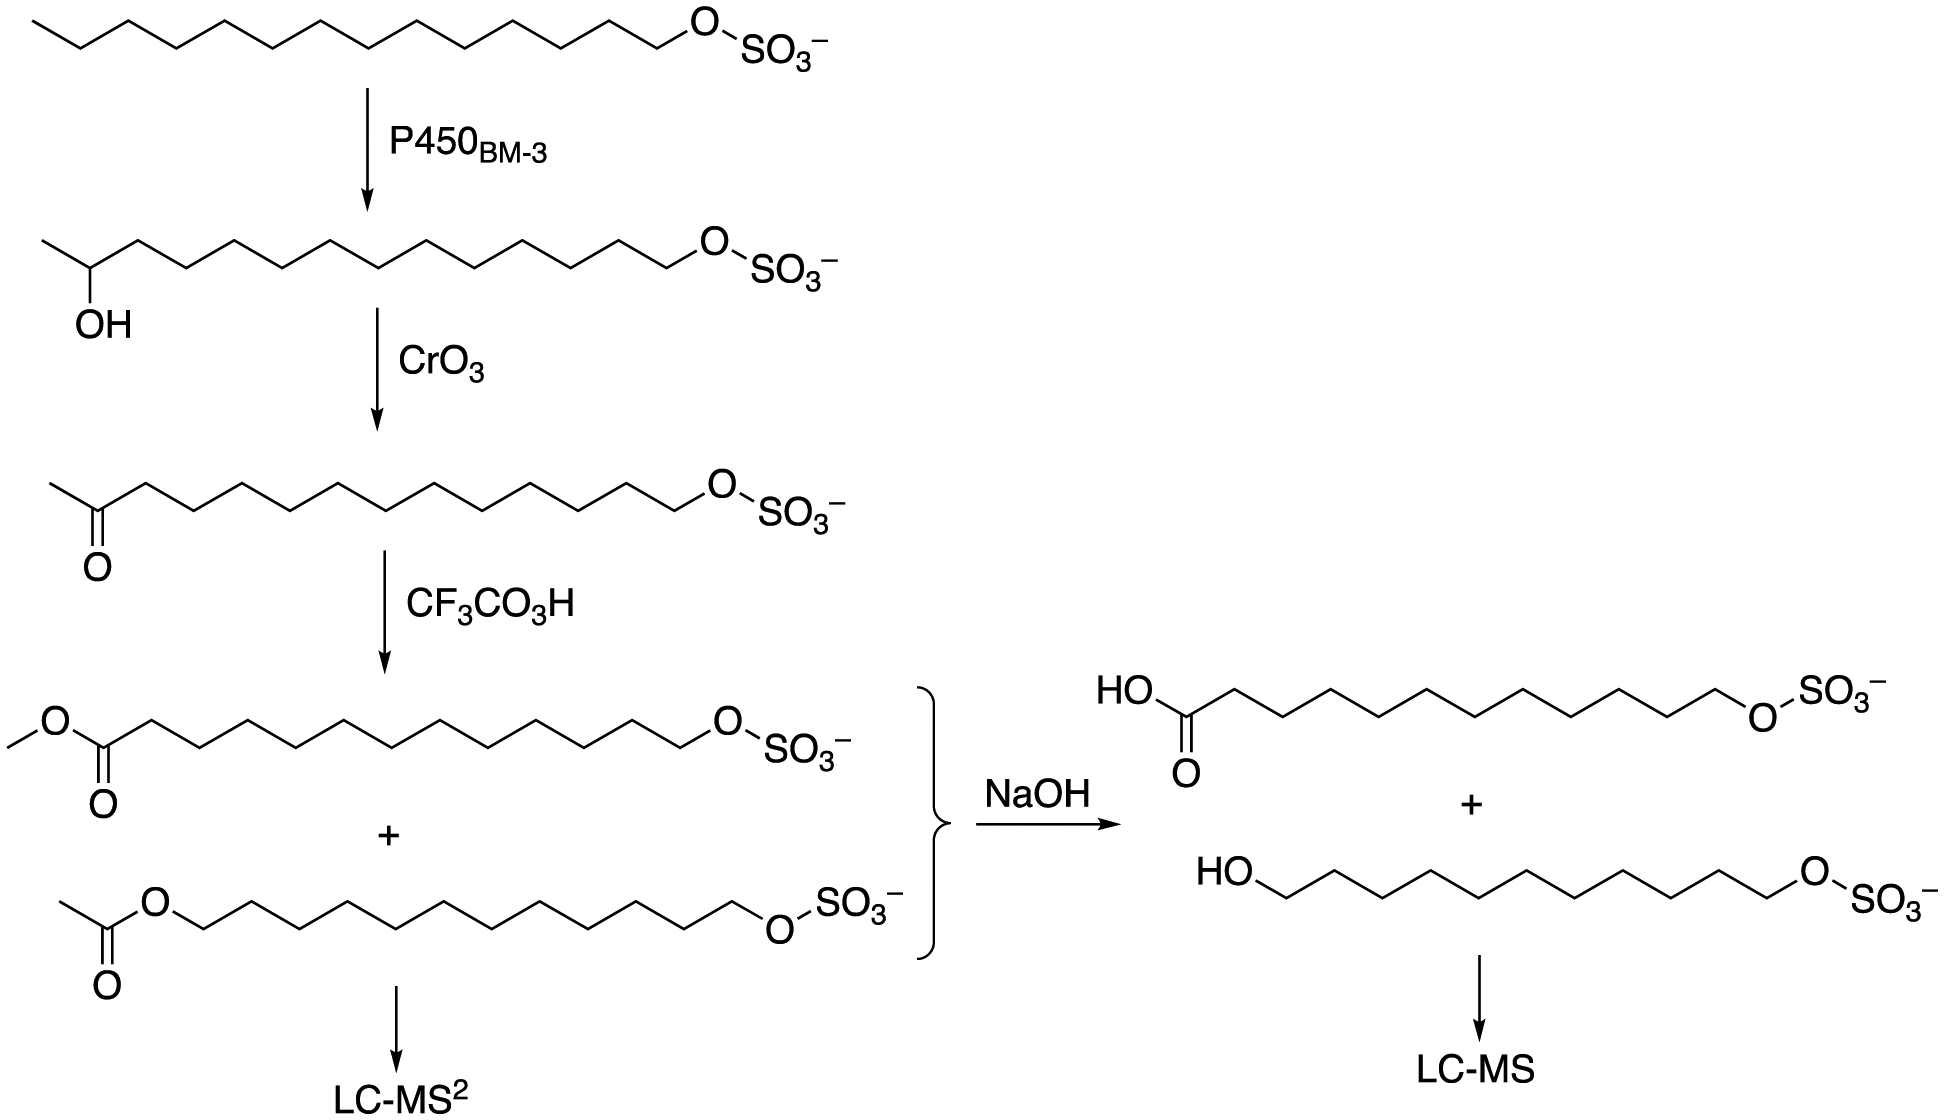
Scheme for identification of sites of hydroxylation using Jones reagent (CrO3)47 followed by Baeyer-Villiger oxidation (CF3CO3H).48 The method is adapted from that of Miura and Fulco.42
Figure 6.
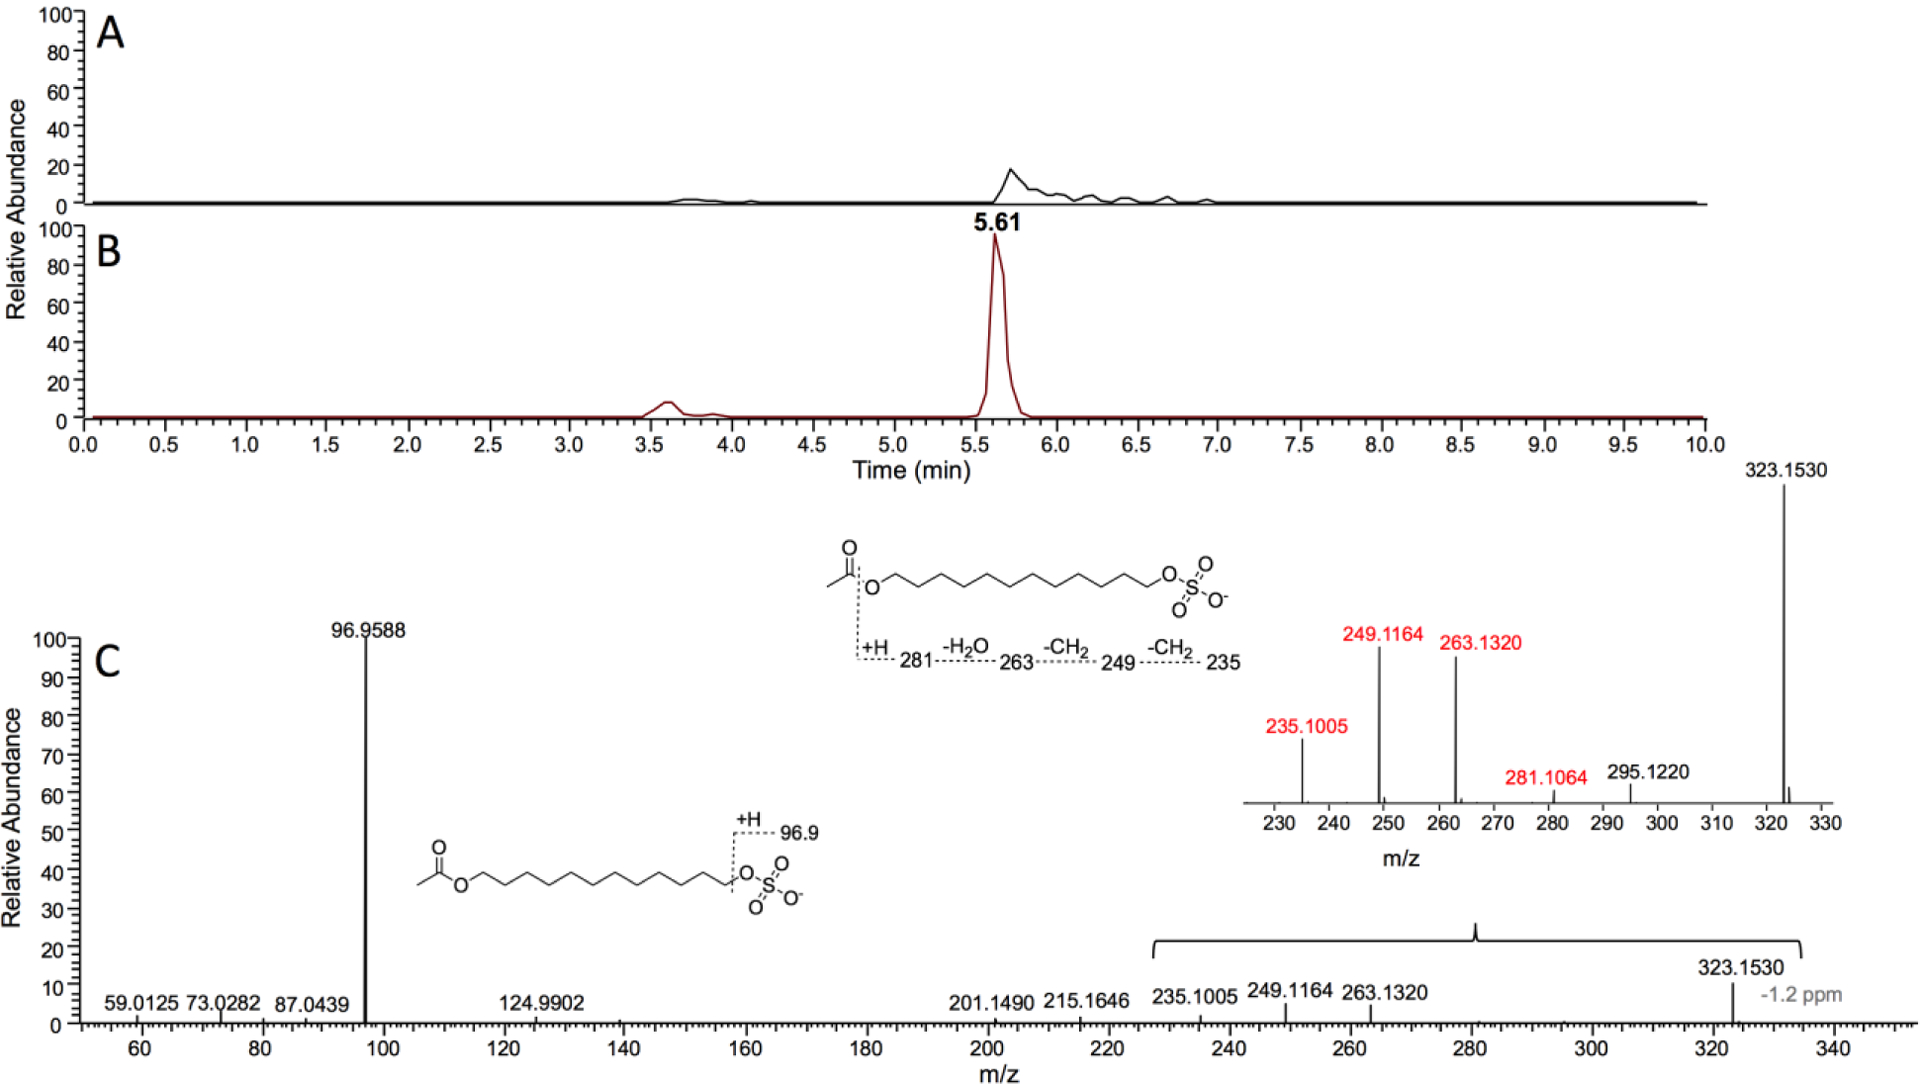
LC-HRMS of P450BM-3 reaction products following derivatization to form esters. A. Tetradecyl sulfate incubated with NADPH but without P450BM-3 for ~ 2 minutes. B. Tetradecyl sulfate incubated with NADPH and P450BM-3. Both reactions were followed by oxidation of alcohol products using Jones reagent47 and then Baeyer-Villiger ketone oxidation48 to form esters (Scheme 2). Extracted ion chromatograms for m/z 323.1534 are shown in Parts A and B, corresponding to a substrate ester derivative. C. HRMS (ESI−) mass fragmentation spectrum of the ester formed from incubation of tetradecyl sulfate with P450BM-3 and NADPH followed by the chemical oxidation steps.
Figure 7.
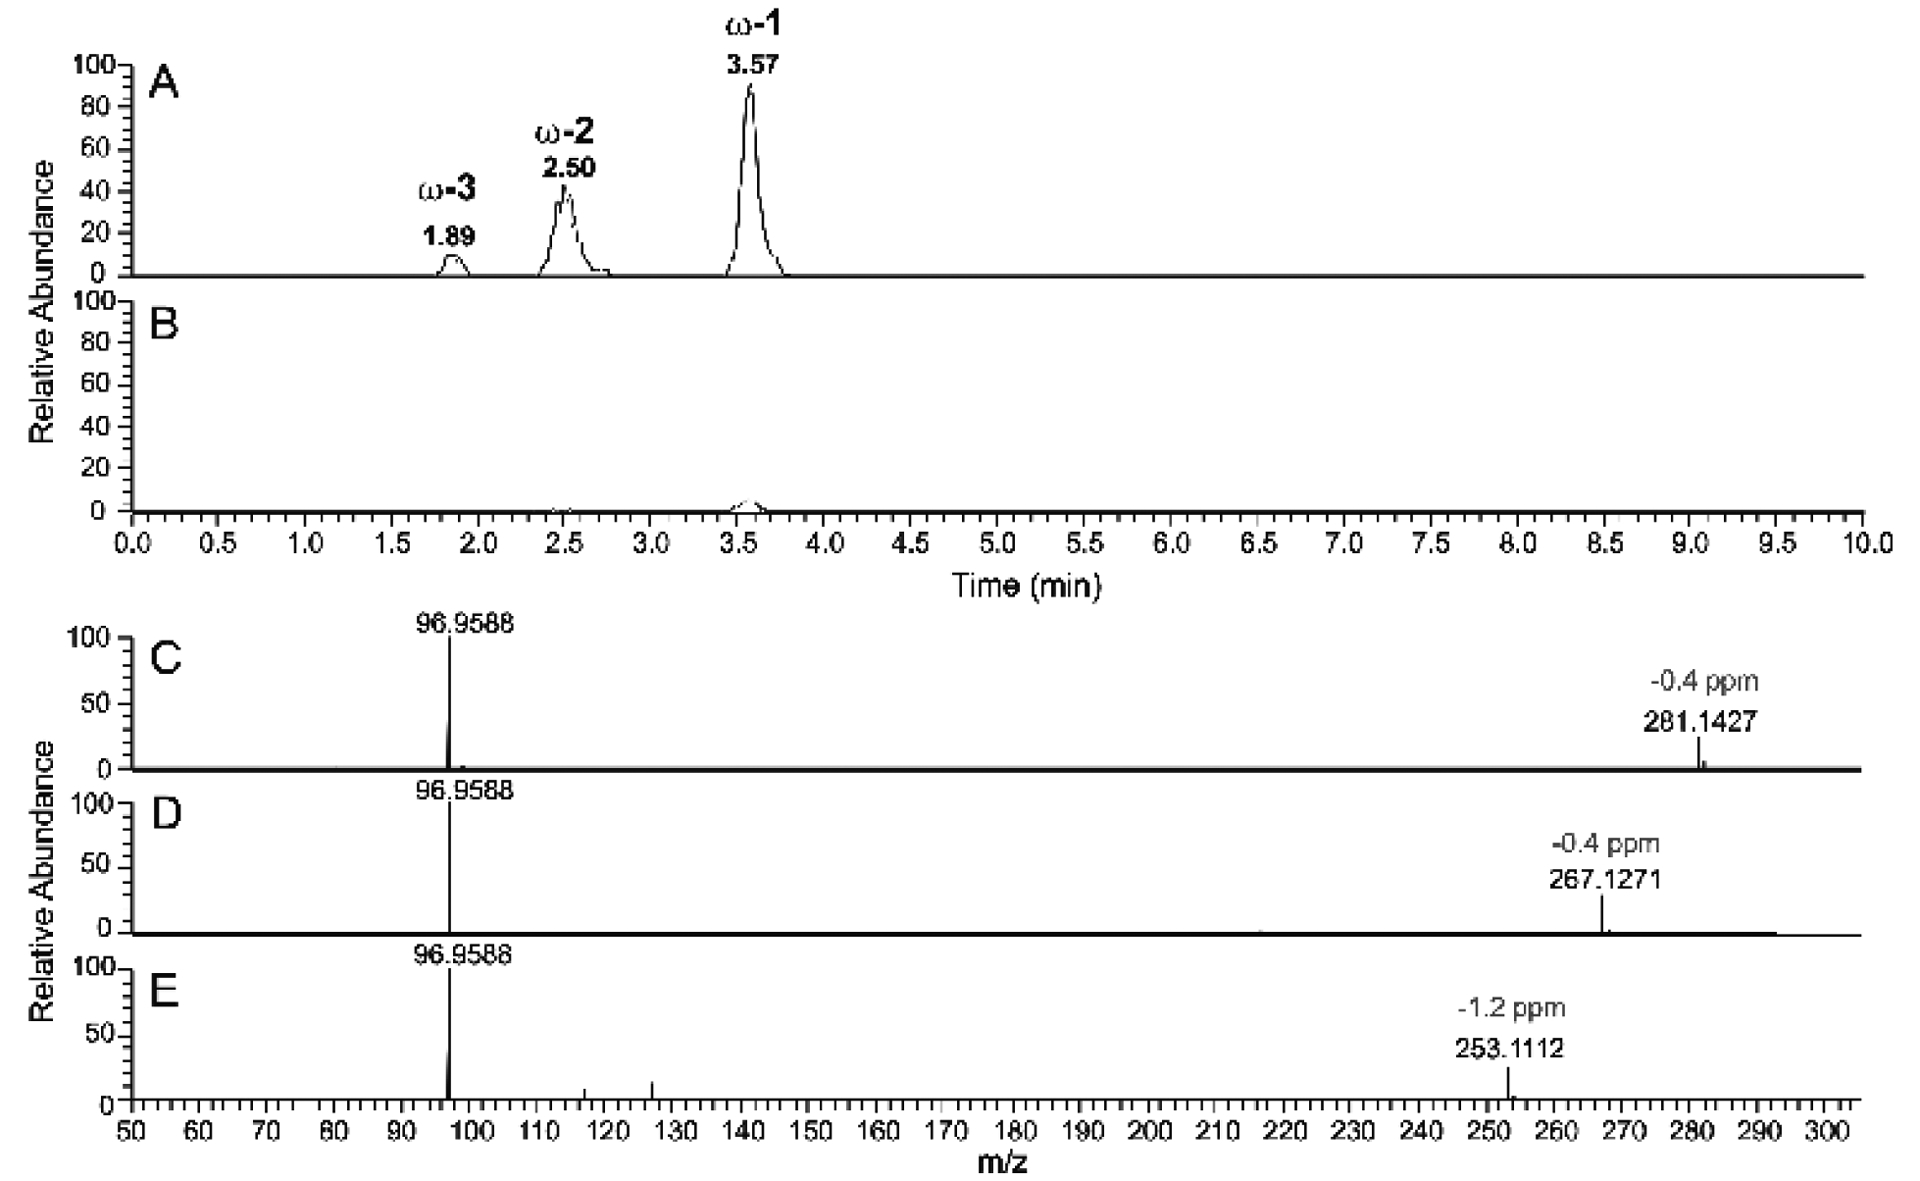
LC-HRMS of P450BM-3 reaction product of tetradecyl sulfate following derivatization to esters and base hydrolysis. A. Tetradecyl sulfate incubated with NADPH and P450BM-3 for 2 minutes. B. Tetradecyl sulfate incubated with NADPH in the absence of P450BM-3. Both reactions were followed by oxidation of alcohol products using Jones reagent,47 Baeyer-Villiger ketone oxidation48 to form esters, and then NaOH treatment to hydrolyze the esters (Scheme 2). Extracted ion chromatograms for m/z 281.1428, 267.1272, and 253.1115 (combined) are shown in Parts A and B, corresponding to the alcohol products detected after base hydrolysis. C-E. HRMS (ESI−) mass fragmentation spectra of the alcohols formed from incubation of tetradecyl sulfate with P450BM-3 and NADPH followed by the two chemical oxidation steps and base hydrolysis: C, fragmentation spectrum of peak eluted at tR 3.57 min peak; D, fragmentation spectrum of peak eluted at tR 2.50 min peak; E, fragmentation spectrum of peak eluted at tR 1.89 min peak.
The site of the second hydroxylation (for dihydroxy products) is unknown, and attempts to apply this method (Scheme 2) were unsuccessful, probably due to the difficulty in doing a Baeyer-Villiger reaction on a 1,2-diketone (although we do not have any specific further evidence for di-ω−1, ω−2, or di-ω−2, ω−3 oxidation).
Analysis of laurate oxidation by P450BM-3 by LC-MS showed the formation of a product that migrated with a synthetic standard of 11-OH lauric acid (ω−1 hydroxylation product). However, analysis of the trimethylsilyl derivatives by GC-MS showed that ω−2 and ω−3 hydroxylation products were also formed from lauric acid, as described by others earlier45, 49–50 (Supporting Figure S2). (We were unable to apply the GC-MS procedure to the sulfates because of the lack of volatility, and both strong acid- and base-catalyzed cleavage of the sulfate was unsuccessful, as well as an enzymatic attempt with mollusk glucuronidase/sulfatase.) Standard hydroxylated derivatives of dodecyl sulfate and tetradecyl sulfate were not available, and the UV spectra were weak at wavelengths > 200 nm and not useful for quantitative analysis. However, we were able to use the MS ESI− ion current traces to monitor the disappearance of the tetradecyl sulfate (Figure 8A) and compare the results with rates of NADPH oxidation (Figure 8B). These comparisons indicated that 97% of the NADPH oxidation could be accounted for as disappearance of the substrate (over the first 100 seconds). The oxidation of NADPH continued to occur even after depletion of the substrate, tetradecyl sulfate. This phenomenon is due to the oxidation of the initial hydroxylation product to further products (Figures 5B–5D, 8A). The production of the secondary products did not begin until the initial substrate (tetradecyl sulfate) was depleted (Figure 8A). Further comparison of the stoichiometry was not done because of the lack of standards of the products and the potential for variable ionization responses.
Figure 8.

Time course of oxidation of tetradecyl sulfate by P450BM-3. A. Disappearance of tetradecyl sulfate (blue circles) and appearance of monohydroxy (red squares) and other oxidized products (identified in Figs. 5, 7). B. Comparison of rates of disappearance of NADPH (blue line, A340, with initial rate indicated with green line, 1.75 pmol s−1) and tetradecyl sulfate (filled circles, with maximal rate between 20 and 100s indicated with purple line, 1.65 pmol s−1).
Pre-steady-state Kinetics of Binding.
Although the amplitude of dodecyl sulfate binding to P450BM-3 increased with the substrate concentration (Figure 3), the rate (or, more correctly, eigenvalue, λ)37, 38 of the spectral change decreased. Fits are shown in Figure 9 for the (final) concentrations of 2 and 200 μM, for which the fitted eigenvalues were 127 and 41 s−1, respectively.
Figure 9.
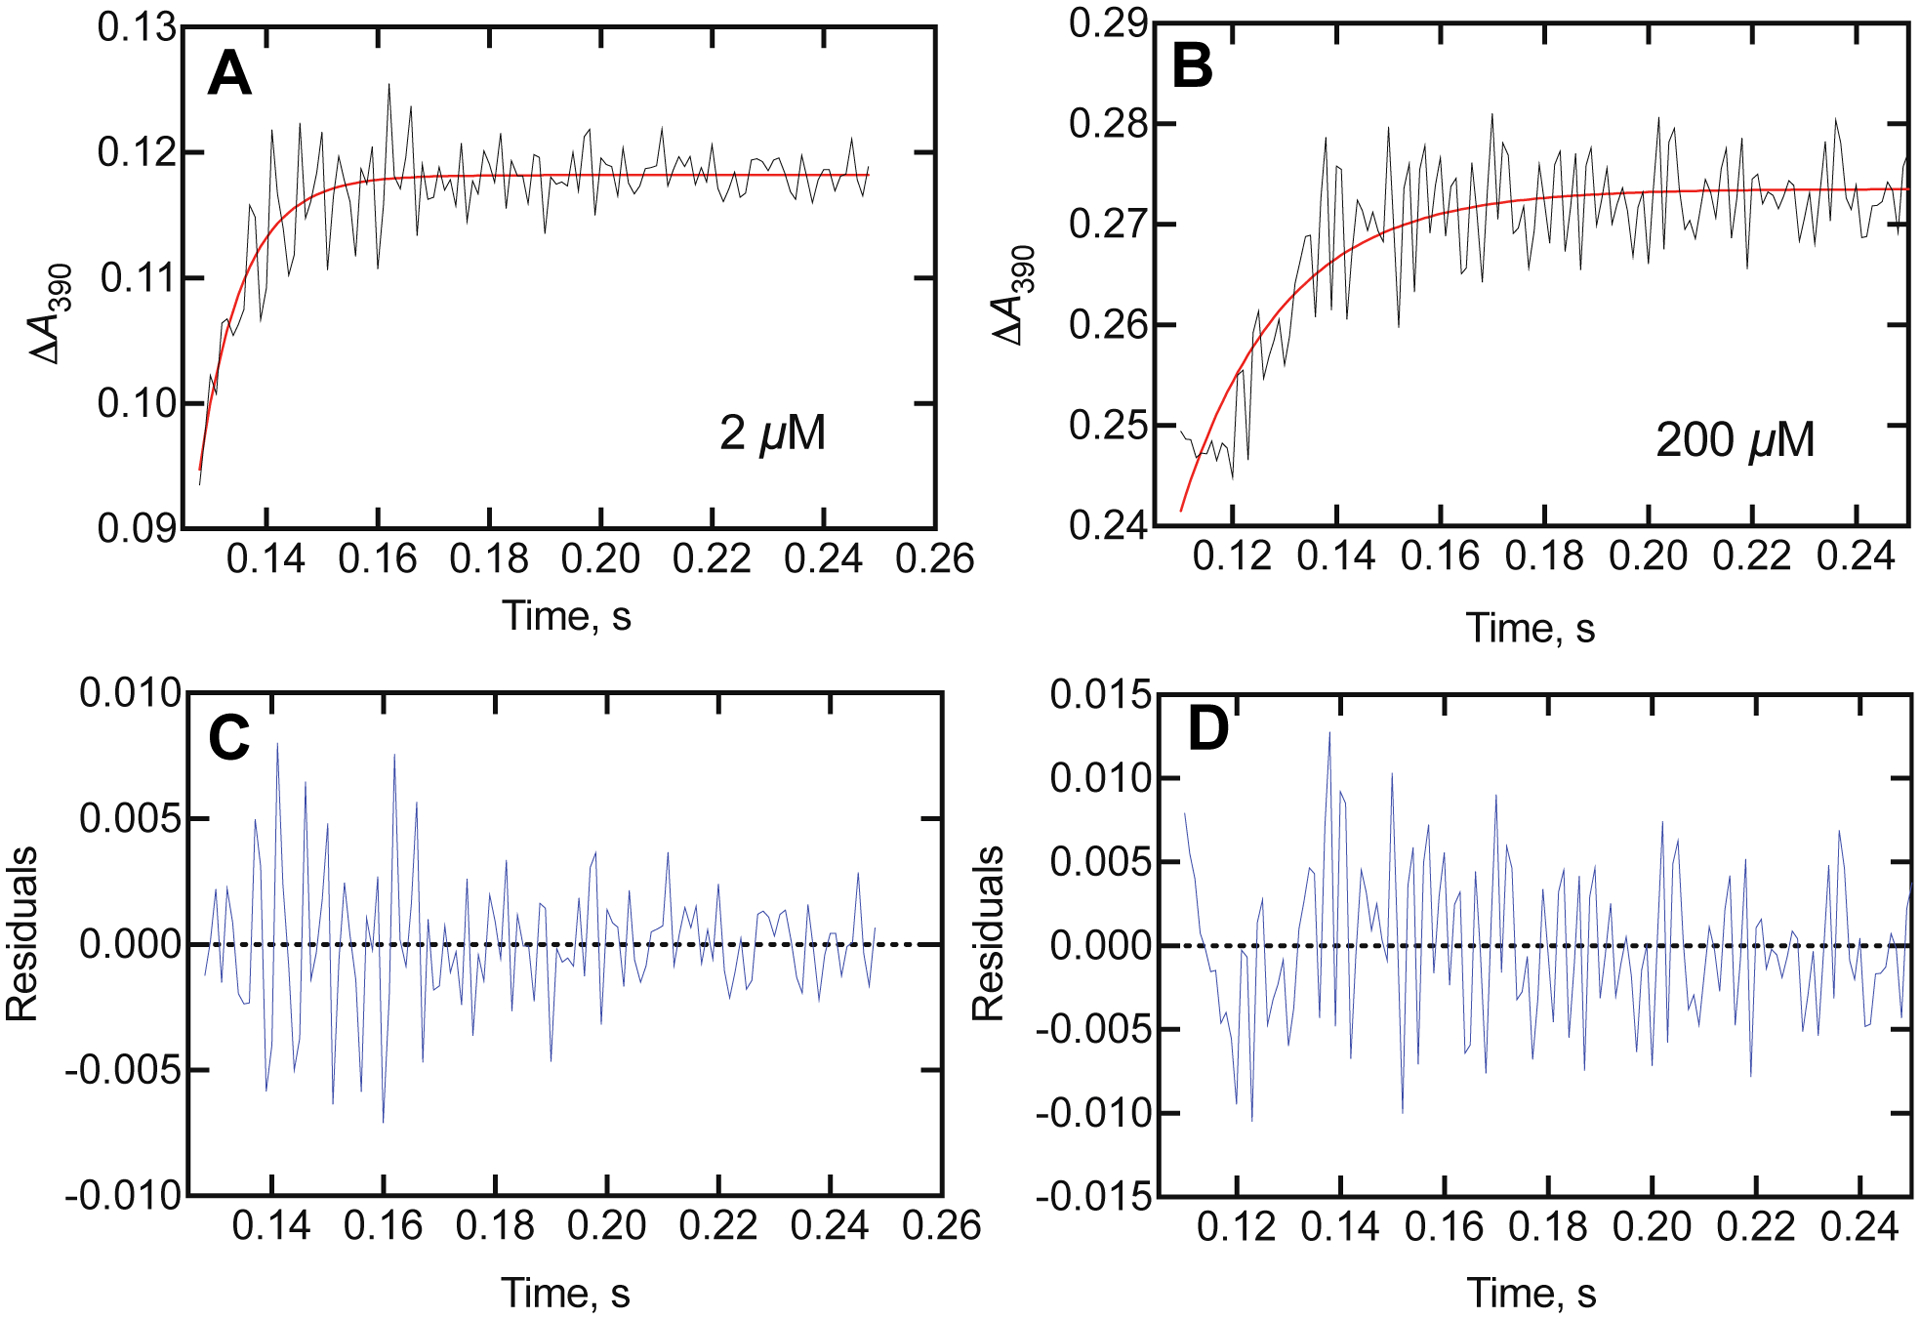
Kinetics of binding of dodecyl sulfate to P450BM-3. Traces of ΔA390 obtained upon mixing 2 μM P450BM-3 with dodecyl sulfate (all concentrations listed are final in the observation cell; the concentrations in the two mixing syringes are twice the final). A. Trace for 2 μM dodecyl sulfate (black), with fit (red) to a single exponential of 127 ± 4 s−1. B. Trace for 200 μM dodecyl sulfate (black), with fit (red) to a single exponential of 51 ± 4 s−1. C. Residuals plot for fit in part A. D. Residuals plot for fit in part B.
Similar patterns were observed for the rates of binding of dodecyl sulfate and myristate (Figures 9, 10).
A conformational selection model can be described
with kf and kr being the forward and reverse rate constants for two forms of the enzyme, E and É, and S denoting the substrate,
using adaptions of the convention of Vogt and Di Cera.34 The y (λ) intercept is (kf + kr) and the asymptote is kf. The y (λ) intercept is difficult to estimate accurately but is ≥ 150–200 s−1 for the sum of kf and kr and 40–60 s−1 for kf (Figure 10), nearly the same for the two substrates, and kf/kr ≅ 0.3 – 0.6, in reasonable agreement, with Kd being in the low μM range in both cases.
Kinetic Isotope Effect (KIE) for Lauric Acid Oxidation.
One of the ways in which rate-limiting steps in the catalytic cycle (Scheme 3) can be analyzed involves KIEs, which measure the contribution of the C-H bond breaking step being at least partially rate-limiting.51 The most appropriate KIE approach is the non-competitive intermolecular comparison. The comparison is difficult in this case, in that ideally only the carbons that are hydroxylated would be deuterated (but metabolic switching to alternate oxidation sites could occur). However, the commercial availability of perdeuterated (d23) lauric acid provides a facile comparison, and there is no issue of “metabolic switching” (or “isotopically sensitive branching”,52–53 favoring an alternative oxidation site instead of the deuterium-blocked normal one).
Scheme 3.
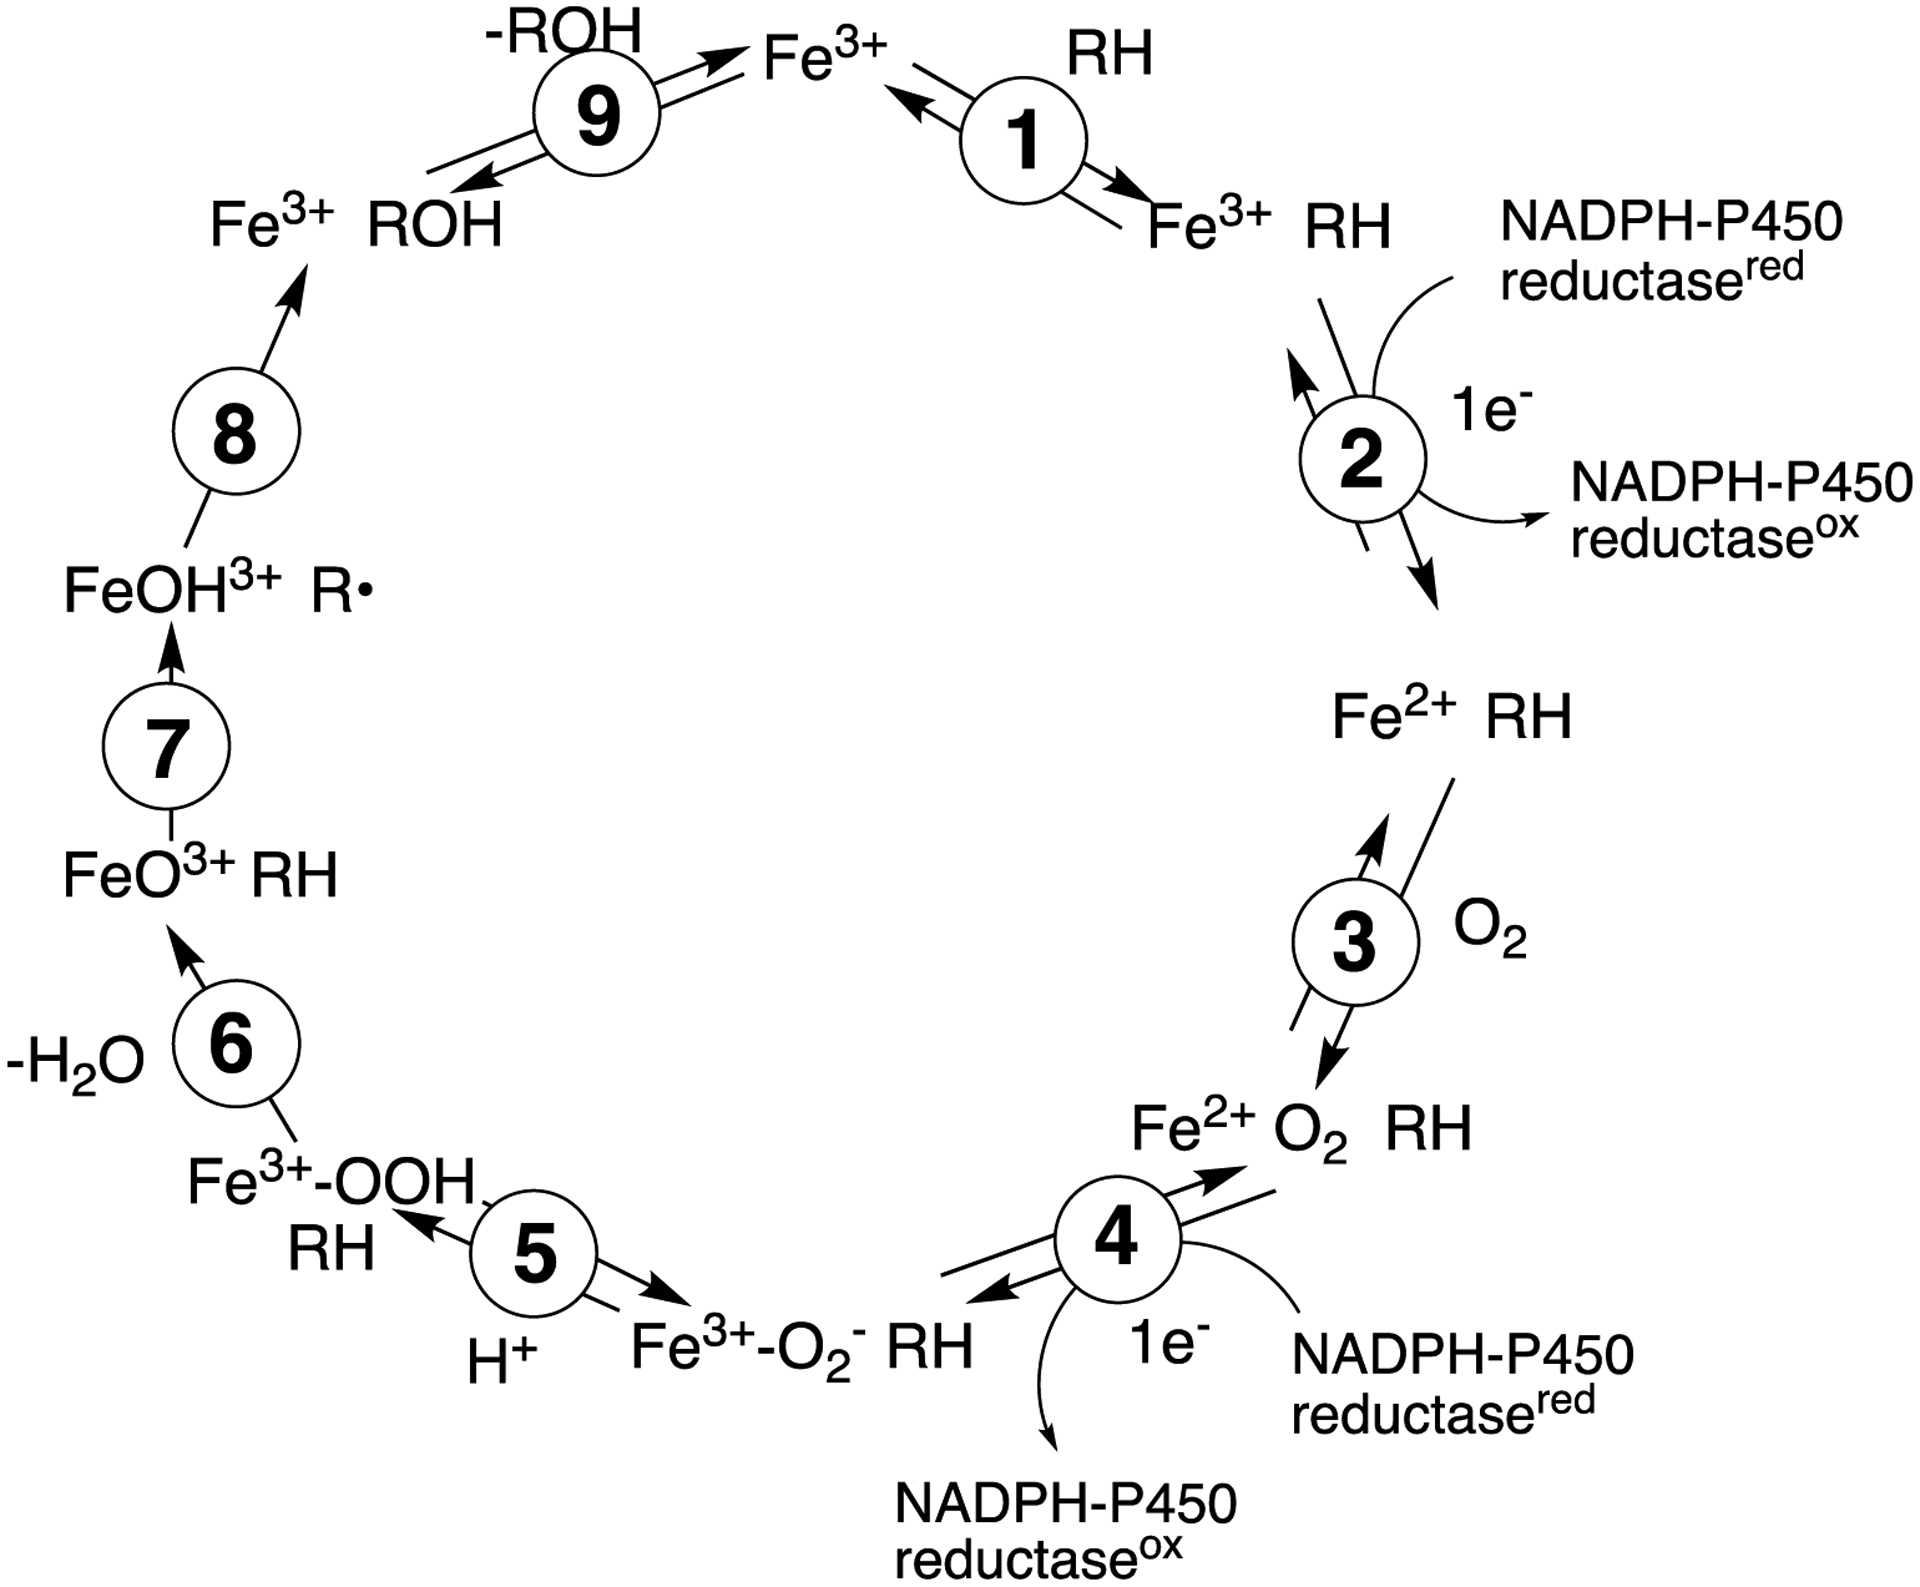
General catalytic cycle for P450 reactions.
The plots of velocity vs. lauric acid concentration, although not very saturable, were nearly superimposable for d0 and d23 lauric acid (Figure 11A). Calculation of the isotope effect gave DV = 1.19 ± 0.16 and D(V/K) = 0.79 ± 0.07, using the conventions of Northrop.54–55 Analysis using the rates of formation of hydroxylated laurate products by LC-MS (also at 100 μM laurate concentration) yielded a KIE of 1.03 (at 180 seconds) (Figure 11B). Taken together, the results indicate that there is only a small, if any, kinetic deuterium isotope effect and that C–H bond breaking is not rate-limiting in the catalytic cycle (Scheme 2) for lauric acid hydroxylation.
Figure 11.
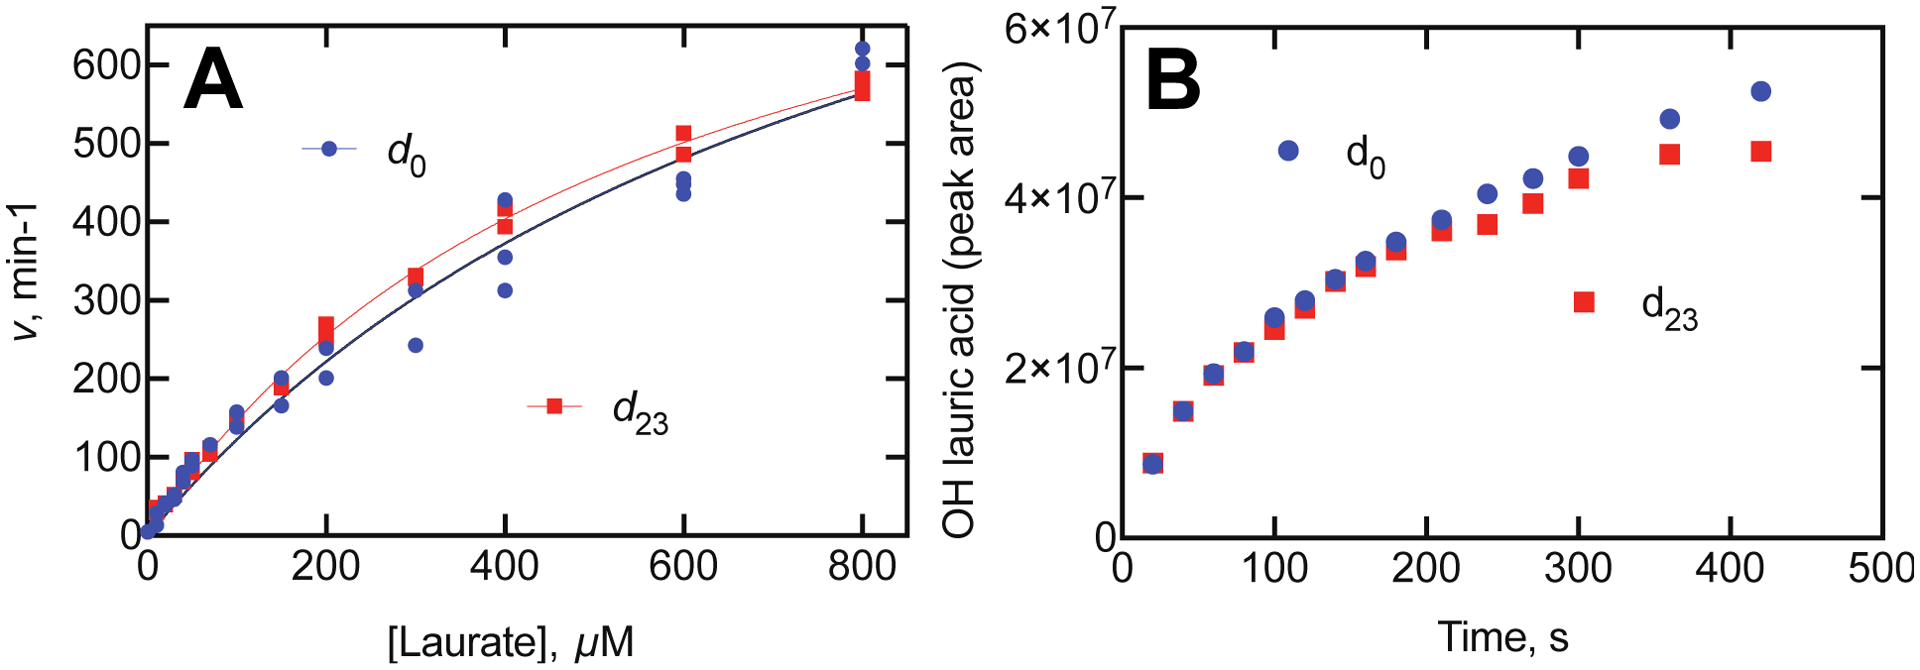
KIE for lauric acid hydroxylation by P450BM-3. A. Rates of oxidation were measured in the presence of d0- or d23-lauric acid (98% atomic excess). For d0 lauric acid, the calculated kcat was 1160 ± 150 min−1 and kcat/Km was 1.38 ± 0.11 μM−1 min−1. For d23 lauric acid, the calculated kcat was 970 ± 30 min−1 and kcat/Km was 1.73 ± 0.04 μM−1 min−1. The KIE was calculated to be DV = 1.19 ± 0.16 and D(V/K) = 0.79 ± 0.07, using the conventions of Northrop.54–55 B. Rates of appearance of hydroxy lauric acids (Supporting Figure S2) from d0 or d23 lauric acid were analyzed by LC-MS. The calculated KIE at the 180 second time point was 1.03.
Consideration of Rate-limiting Product Release.
One step that can be considered as potentially rate-limiting is product release. One lauric acid product (11-OH lauric acid, Supporting Figure S2) was available56 and was considered. Like lauric acid, 11-OH lauric acid generated a Type I difference spectrum, with an apparent Kd of 8.0 μM (less than the Kd for lauric acid measured with the same P450BM-3 preparation, 29 μM) (Figure 12).
If a similar kon rate constant is assumed for 11-OH lauric acid as myristic acid (Figures 9, 10) (i.e., ~ 107 M−1 s−1) then the expression Kd = koff/kon suggests a koff rate constant of ~ 140 s−1, much faster than the overall reaction (4 s−1, Figure 9A).
We attempted to use a trap reaction to measure the rate of release of 11-OH lauric acid by measuring the rates of binding of a spectrally distinct ligand in the absence and presence of 11-OH lauric acid. The drug ketoconazole, which binds to several P450s, was used and had a distinct Type II low-spin spectrum (Figure 12) and Kd 37 μM. The measured rate of binding (150 μM) was 2.59 s−1 in the absence of 11-OH lauric acid and 2.43 s−1 in the presence of 70 μM 11-OH lauric acid.
where E = P450BM-3, P = 11-OH lauric acid, and I = ketoconazole, with k1 = 0.016 × 10⁶ M−1 s−1 (derived from fitting the trace (without 11-OH lauric acid in Part A), k2 = 10 × 106 M−1 s−1, k−2 = 1840 s−1, and ε445–410 = 0.011 mM−1 cm−1. C. FitSpace plot of min χ2/χ2 vs the value of k−2. The x-axis legend (loaded directly from software output) indicates values for k−2 of 5000, 10000, 15000, … s−1.
The rate of binding of ketoconazole (~ 2 s−1, Figure 13) is probably too slow to realistically describe a simple 2-component model39, 57 but its spectral properties can be used to estimate an off-rate for the product 11-OH lauric acid, because of the distinct nature of the ketoconazole spectrum (Figure 12A). The free and 11-OH lauric acid bound forms of P450BM-3 are isosbestic at 410 and 445 nm (Figure 12A), and the difference in the absorbance at those wavelengths were used to monitor the binding of free enzyme to ketoconazole (Figure 13). As indicated, the rates in the presence and absence of 11-OH laurate were nearly identical (single exponential fits). The system could be modeled to generate reasonable rate constants for the system, and a fit was generated with an on-rate constant of 1.0 × 10⁷ M−1 s−1 for 11-OH lauric acid and an off-rate constant of 110 s−1 (Figure 13). Combining these (Kd = koff/kon) yields a Kd estimate of 11 μM, similar to that measured by titration (8 μM, Figure 12C). Further, FitSpace analysis58 showed that a rate constant of > 200 s−1 is needed to optimize min χ2/χ2 (Figure 13C). Thus we conclude that the off-rate for the product 11-OH lauric acid is ≥ 200 s−1 and not rate-limiting, in that the overall reaction steady-state rate is 2–3 s−1 (Figure 11). Such an off-rate (100 s−1 = 6,000 min−1) should not be very limiting even with the “faster” of the fatty acid and alkyl sulfate substrates (Figure 2).
Figure 13.

Kinetics of binding of ketoconazole to P450BM-3. P450BM-3 (4 μM, in 50 mM potassium MOPS buffer, pH 7.4) was mixed with 300 μM ketoconazole (in 50 mM potassium MOPS buffer, pH 7.4). A. Plot of ΔA445-A410 data measured either with no other ligands present (black line) or with 70 μM 11-OH lauric acid present (red line). The respective rates (single exponential fits) were 2.59 and 2.43 s−1. B. Fit of data from mixing a P450BM-3/11-OH lauric acid mixture with 300 μM ketoconazole and fitting to the equations
An alternate approach for finding evidence for or against a slow product release step is to examine the possibility of a kinetic burst, i.e. a fast initial cycle of the enzyme followed by a slower steady-state reaction.38, 59–60 This experiment was done by monitoring oxidation of the substrate NADPH in the presence of lauric acid in a stopped-flow spectrophotometer (Figure 14). The reaction was highly coupled (i.e., NADPH was only rapidly consumed in the presence of substrate) under these experimental conditions, and an absorbance burst of 0.025 absorbance units would have been expected if it were to occur.
Figure 14.
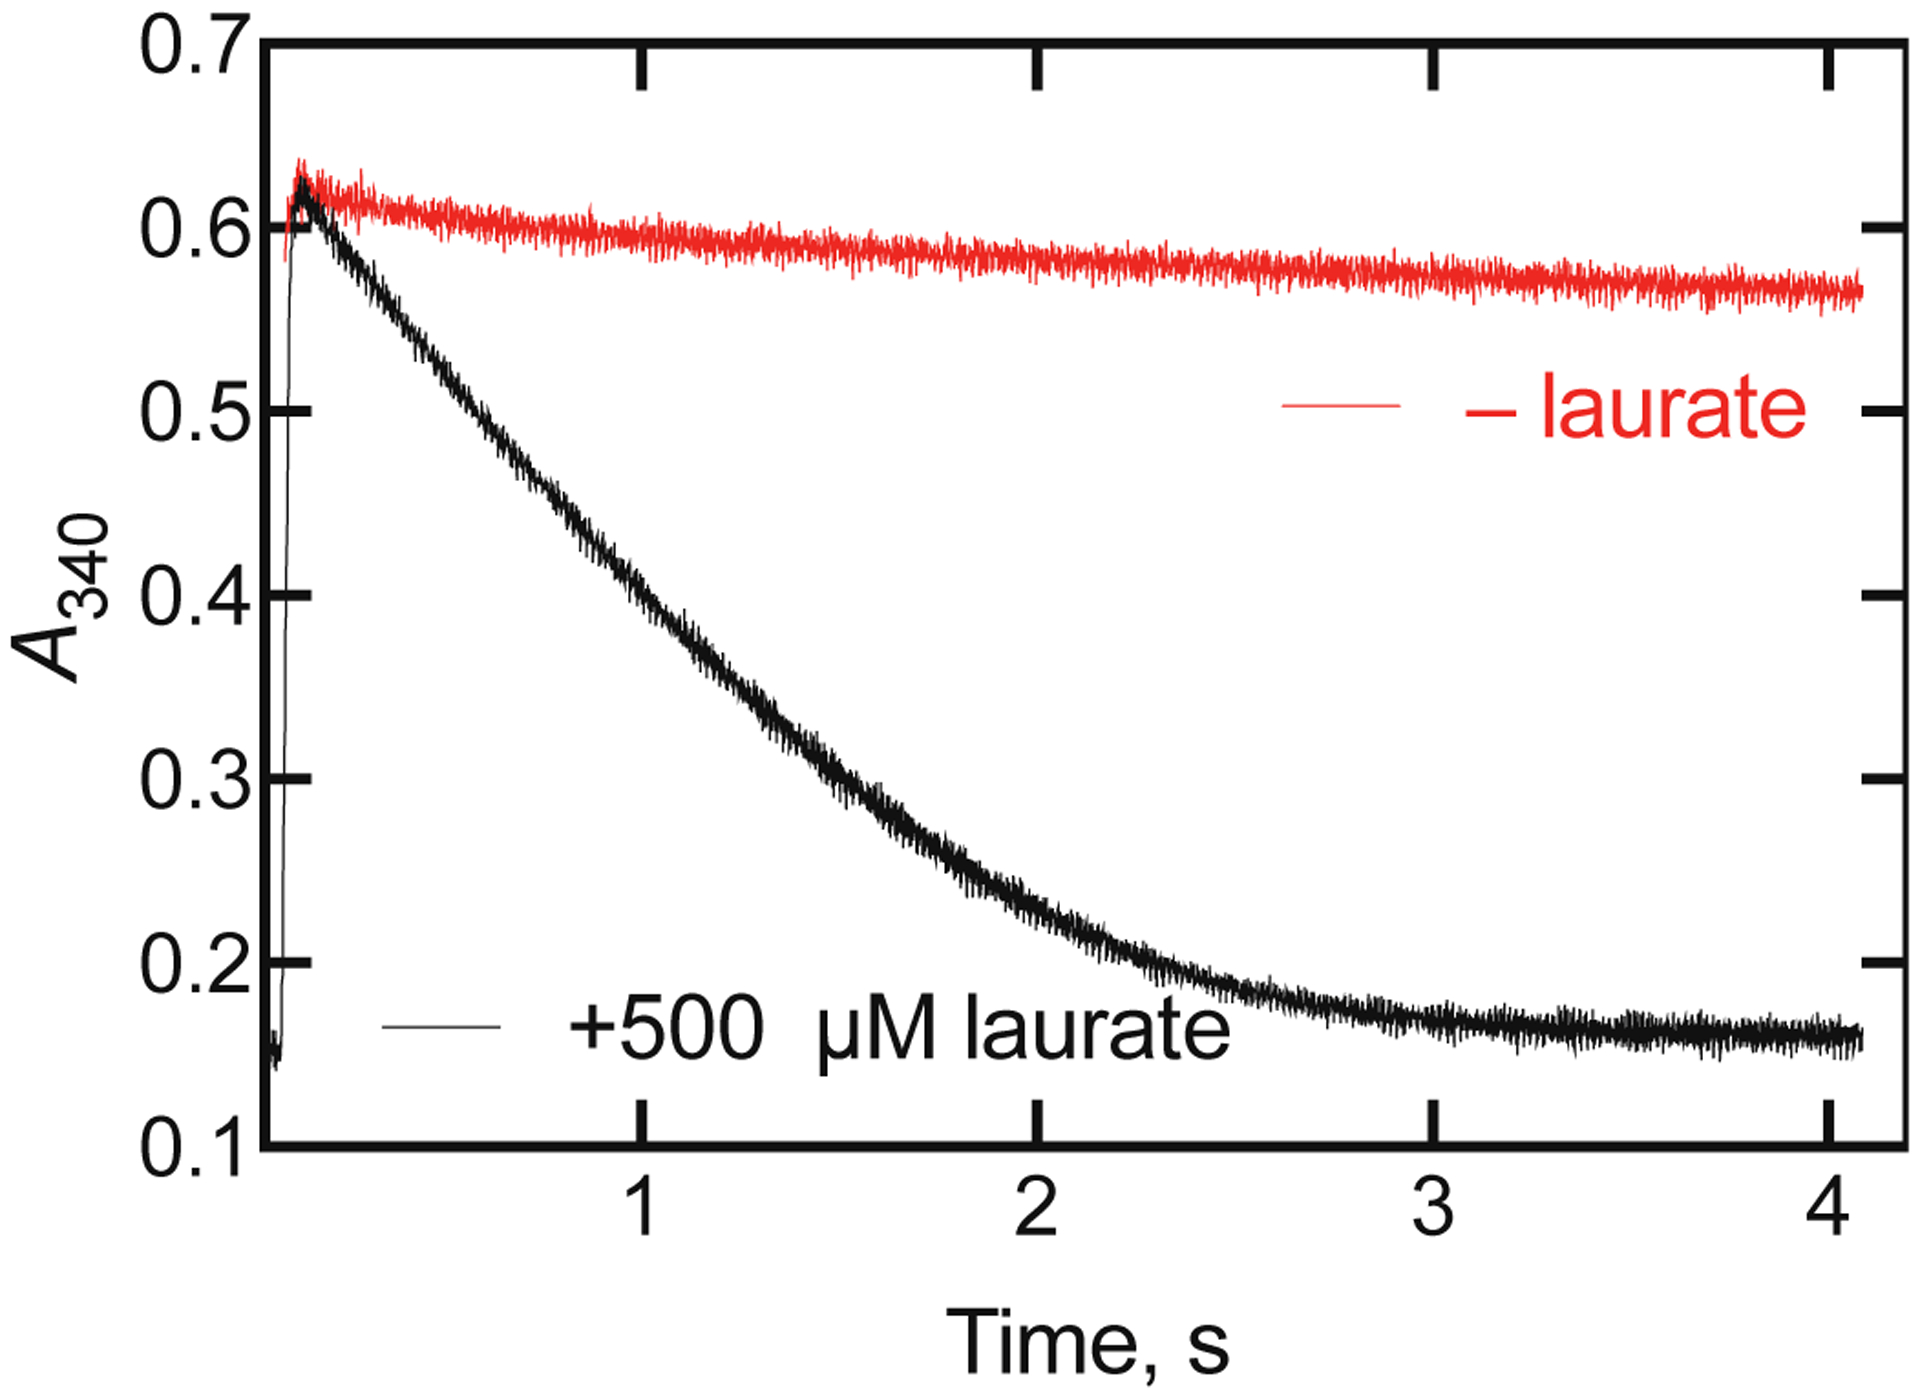
Burst experiment with P450BM-3 oxidation of lauric acid. One syringe of the stopped-flow spectrophotometer contained 4 μM P450BM-3 in the presence of 1 mM lauric acid and 50 mM potassium MOPS buffer (pH 7.5). The other syringe contained 100 μM NADPH in the same buffer. Final concentrations in the observation cell were 2 μM P450BM-3, 500 μM lauric acid, 50 mM potassium MOPS (pH 7.5), and 50 μM NADPH. Ten independent shots were averaged to yield the curve shown, with a measured rate of 608 ± 4 min−1 for the steady-state portion. In a separate experiment, the lauric acid was not included. No burst was observed.
DISCUSSION
Oxidation of alkyl sulfates by P450BM-3 yielded primarily ω−1 hydroxylation products, similar to those previously reported for fatty acids (ω−1, ω−2, ω−3) (Figures 5–7, Supporting Information Figure S2). The rates were even faster (Figures 2, 4), although there is not an obvious reason why. Alkyl sulfates have much lower pKa values (~ −1.5) than carboxylic acids (3–4), although there is no evidence that this is the reason for more rapid oxidation. The extent of conversion to high-spin iron was similar for all of the alkyl sulfate substrates (Figure 2A). Alkyl sulfates are more water-soluble and, for many purposes, easier to work with than fatty acids.
The related bacterial enzyme P450 102A2 has been reported to oxidize dodecyl sulfate, or at least to oxidize NADPH in the presence of dodecyl sulfate, but the apparent specificity constant (kcat/S0.5 1.6 × 10³ M−1 s−1, at 37 °C) was ~500-fold lower than we measured for P450BM-3 (at 23 °C, Figure 4A). The very sigmodal nature of the (spectral) binding and oxidation (of NADPH) (Hill n value 5.7) by P450 102A2 (CYP102A2) is highly unusual for P450s61 and was not seen with P450BM-3 (Figure 4A). It is also of interest to note, as mentioned earlier, that Gustafsson et al.33 reported highly sigmoidal patterns of both binding and catalytic activity with some, but not all, methyl-substituted fatty acids with the related B. subtilis P450 102A2 and 102A3 proteins (CYP102A2, CYP102A3). None of our plots for binding of alkyl sulfates or fatty acids showed detectable cooperativity in binding or catalytic activity.
Aside from work with derived mutants of P450BM-3,20, 22 the most common substrates used have been fatty acids. Higher rates of oxidation have generally been seen with the longer chain fatty acids, but the rates can be rather erratic under certain conditions,62 and we attribute some of the behavior to the properties of these surfactants. For instance, sodium palmitate is a classic soap and not very soluble in water at even sub-mM concentrations.63 Some of our own rates with sodium palmitate (and laurate) were lower than reported in the literature,45, 50 but were included for direct comparison to the alkyl sulfates with the same enzyme preparation. In our experience the alkyl sulfates, particularly dodecyl and tetradecyl sulfates, have superior solubility and consistency of their enzymatic parameters (e.g., Figure 4). Exactly why the rates of hydroxylation are higher is not clear. The alkyl sulfates have technical advantages in mechanistic studies. Although they are non-physiological, it still remains unclear as to what the physiological role of rapid ω−1, ω−2, …hydroxylation of fatty acids is in B. megaterium.
In a previous study with both full-length P450BM-3 and with the isolated heme domain, Rowlatt et al.62 reported some unusual spectral binding isotherms with fatty acids and unexpected buffer dependence patterns, particularly at low ionic strength. In the present work, we restricted the buffer to 50 mM potassium MOPS (pH 7.4), the same one used in the extensive work on P450BM-3 by the Peterson group.43, 64–65 The spectral changes reported by Rowlatt et al.62 for binding appear to be very isosbestic but the plots (of absorbance changes vs. fatty acid concentration) involve plateaus and decreases at low ionic strength, and the authors used a 4-site model to fit the results. We did not see any unusual patterns in our own work with fatty acids (Figure 12) or alkyl sulfates (Figure 3). Rowlatt et al.62 also reported a highly sigmoidal pattern of the rate of NADPH oxidation in the presence of palmitate, at low ionic strength, but not with laurate or myristate, and the pattern with palmitate changed to a hyperbolic one at higher ionic strength. Our steady-state kinetic experiments all yielded hyperbolic plots in the potassium MOPS buffer system (Figures 4, 11). (It should be noted that the work of Rowlatt et al.62 was done by adding solutions of the free acids in DMSO and at 30 °C, as opposed to our own work with sodium salts of the fatty acids and alkyl sulfates at 23 °C, although we do not know if that produced the differences.) To our knowledge, no other ligand binding patterns as complex as those reported by Rowlatt et al.62 have been reported for other P450 enzymes. A 4-component binding model can not be ruled out for P450s (and our own results in terms of multiple conformations of both unliganded and liganded P450 are consistent with four (or more) forms, but we do not have a solid basis for using an equation for this system.
One of the main reasons for studying P450BM-3 was to extend our studies on the nature of complex binding kinetics from mammalian P450s37, 39 to a simpler, non-membrane P450, and the use of alkyl sulfates precluded some technical solubility problems encountered with long chain fatty acids. The spectral changes observed for dodecyl sulfate binding could be fit to single exponentials (Figure 9A, 9B), and the eigenvalues decreased with increasing substrate concentration (Figure 10). This behavior cannot be described by a simple two-state reversible system and is indicative of conformational selection, as opposed to induced fit, as the driving phenomenon (Scheme 1).34–35 Thus, P450BM-3 exists in (at least) two conformations in the absence of substrate, as proposed by Joyce et al.40 Using the approach of Vogt and Di Cera34 the asymptotes in Figure 10 correspond to the forward rate of conformational change (kf), ~ 50 s−1, and the (y-, λ) intercept is the sum of the forward and reverse rates (kf + kr) (150 s−1), so the reverse rate (kr) is ~ 100 s−1 and Keq = kr/kf ≅ 2. The ratio is roughly similar to those observed with human P450s 17A137 and 2C8, 2D6, 4A11, and 21A2.39
The kinetic analysis (Figure 9) has inherent error in the measurements (presented as averaged traces), although the OLIS GlobalWorks analysis yielded error estimates of <10% for the rates (Figure 9 legend, Figure 10). Although the estimates of the y-intercepts are rough, the overall conclusion of Figure 10 can only be that the rates are not increasing with substrate concentration, a hallmark of a dominant conformational selection model, as opposed to induced fit (Scheme 1).34–35 The rate of 127 s−1 at a dodecyl sulfate concentration of 2 μM yields a rough value of 6 × 10⁷ M−1 s−1, which is consistent with a rate constant for substrate binding,38 accompanied by a spectral change.
Differences between the crystal structures of P450BM-3 with and without substrate have been known for many years.16–17 A basic difference is that of an open vs. closed structure, but even that is an oversimplification.17 The first structures of unliganded P450BM-3 included a pair of molecules, closely associated and one in a more open conformation than the other (PDB 2HPD).16, 66 The differences between the two molecules were clustered in the F and G helices.45 An independent structure (2BMH) only showed the open conformation.67 Energy minimization suggested that the open conformation was too spacious to bind a substrate such as myristate, suggesting that reshaping must occur upon substrate binding to produce a closed conformation. The first P450BM-3 structure with a substrate was that with palmitoleic acid bound (1FAG),17, 68 in which the F and G helices were repositioned. A high resolution structure with N-palmitoylglycine (1JPZ)69 showed the exclusion of most of the water molecules seen in the open structures, consistent with the spin state change. However, a problem with the substrate-bound structures is that the site of (methylene) oxidation is still ~ 7.5 Å from the Fe-O complex, too far to be catalytically competent.70 Thus, the bound complex must change for catalysis to occur, and at least two unbound and two bound P450BM-3 structures must exist. However, Joyce et al.40 reported that the site-directed mutation A264E caused the enzyme to be in the substrate-bound conformation even in the absence of substrate. The enzyme could bind substrate and was catalytically active.41 This A264E mutant protein, in the absence of substrate, had the iron atom in the low-spin configuration, and the oxidation-reduction potential (Em,7) was −316 and −318 mV in the absence and presence of substrate (cf. −427 and −289 mV for the wild type enzyme), respectively.
A previous report71 indicated that the rates of binding of lauric and other fatty acids to P450BM-3 were > 800 s−1 for either the intact holoenzyme or the isolated heme domain (at 25 °C). A rate of 800 s−1 corresponds to a t1/2 of 0.9 ms and the deadtime of most stopped-flow spectrophotometers is ~ 2 ms, so < 20% of a reaction would be observed. In our work with dodecyl sulfate, which is clearly a substrate and has none of the issues with substrate aggregation we experienced in preliminary trials with sodium palmitate, the changes could clearly be observed with t1/2 values of 6–25 ms (Figure 9), and the variation in rates (Figure 10) forms the basis of our conclusions about the role of conformational selection in P450BM-3.
The experiments in which the rates (eigenvalues) of conversion of low- to high-spin P450BM-3 were measured as a function of substrate concentration (Figures 9, 10) are consistent with a major role for conformational selection in the binding of substrates by P450BM-3 (Scheme 1, Figure 10). However, even that diagram (Scheme 1) is probably an oversimplification. Previous work has shown the existence of temperature-dependent spin-state equilibria in (wild-type) P450BM-3, and the rate of change was too fast to accurately measure with temperature jump methods.70 N-Palmitoylglycine-bound P450BM-3 also showed temperature-dependent spin equilibria, but it changed at a rate of ~ 800 s−1 (which would be somewhat too fast to detect by stopped-flow methods, i.e. t1/2 < 1 ms).70 Another point is that the site of hydroxylation of N-palmitoylglycine in the (wild-type) P450BM-3 crystal structure is 7.5 Å distal from the heme iron and not in a catalytically competent position, as mentioned earlier,69 so that an alternate conformation must be achieved (either in the ferric state or a different electronic state of the catalytic cycle) to change the juxtaposition for catalysis. Thus, multiple conformations of P450BM-3 are implicated, and the results of the experiments presented in Figures 9 and 10 indicate conformational selection having a major role (Scheme 1) but do not exclude more dynamic structures from the catalytic process (Scheme 4).
Scheme 4.

Conformations of P450BM-3 involved in catalysis. Rates for the free E complex are from Fig. 10 and from ref.70 for the ES complex.
An open question is what step(s) limits rates of substrate hydroxylation by P450BM-3, as we consider the general P450 reaction cycle (Scheme 2).10 Substrate binding is faster than the overall reaction (dodecyl sulfate), and even the rates of the conformational changes (Figure 11) are faster than the overall reaction (Figures 4, 11). In principle, the rates of conformational change of the unbound enzyme should be invariant regarding different substrates (Scheme 1, Figure 10), although it is possible (actually probable) that more than two conformations are sampled and that different substrates may be selected with different poses.72 Multiple substrates have been used in catalytic studies, and there are some discrepancies (or at least controversies) in the literature. Flavin reduction and transfer of electrons to the heme iron have been reported to be fast (53–306 s−1 for laurate, myristate, and palmitate, for the reduction of iron from the ferric to the ferrous state).62, 71 The next steps in the cycle follow the ferrous P450BM-3 complex. Although the rate of O2 binding to ferrous P450BM-3 has not been reported, the rate constant for CO binding (as a surrogate) has been estimated to be 1.6 × 10⁶ M−1 s−1, and the rate of O2 binding was reported to be too fast to measure.73 The stability of the FeIIO2 complex is an open question. Sevrioukova and Peterson73 observed the complex (heme domain, in the presence of arachidonate) and reported the rate of decomposition to be 0.22 s−1 at 20 °C. Bec et al.74 also characterized the FeIIO2 complex of (the heme domain of) P450BM-3, with a rate of decomposition of 0.1 min−1 (i.e., 0.0017 s−1, t1/2 7 min) at −25 °C. These rates are too slow to be a part of the catalytic cycle, but the point should be made that this reaction (i.e., decomposition of the FeIIO2 complex) is a non-productive reaction and competes with productive catalysis.
The breaking of the C-H bond is probably not rate-limiting, at least in the case of laurate hydroxylation (Figure 11). The KIEs, measured with multiple concentrations of d0/d23 laurate, were ≤1.2 (depending on the assay method), not considered to be particularly high for a non-competitive P450 reaction.51 A KIE value of ~1.2 is also subject to the influence of secondary isotope effects, especially with a perdeuterated fatty acid.75 The commercial availability of other deuterated substrates has limited searches for KIEs with other substrates. It is of interest to note that high KIEs (6–17) have been reported for the O-deethylation of the alternate substrate 7-ethoxycoumarin by mutants of P450BM-3, although the rates are much slower.76
So which steps do limit catalysis by P450BM-3? Apparently substrate binding, transfer of the first electron to the flavin and to the heme, oxygen binding, and C–H bond breaking (Scheme 3, steps 1, 2, 3, and 7) are ruled out. Product release (step 9) was examined (Figures, 13, 14) but appears not to be, although a more definite conclusion would necessitate product burst kinetic analysis. A possibility is the transfer of the second electron from flavin to the FeIIO2 complex (step 4), but how to address this question is unclear, given the instability of the FeIIO2 complex73 and the fused nature of the protein with the flavins and the heme both present.
The other most-extensively studied bacterial P450 is P450cam (CYP101A1). Kinetic studies by Peterson, Sligar, and others have led to the general conclusion, at least with the classic substrate camphor, that steps 1–3 and 7–9 of Scheme 3 are not rate-limiting.5 Step 4 has been proposed to be but has been difficult to measure directly.5, 77 This may not be possible, in that distinguishing the kinetics of binding the accessory protein putidaredoxin (the electron donor) from actual electron transfer may not be feasible. With mammalian P450s the issue of rate-limiting steps has been considered extensively for many years.51, 78–80 Discussion of all aspects is beyond the scope of the report, but there is evidence from kinetic measurements of individual steps, KIEs, and product burst kinetics to indicate that steps 1, 2, 7, and 9 in Scheme 3 can be at least partially rate-limiting in different situations.51, 81–83 Indirect evidence from cytochrome b5 stimulation also indicates that step 4 may be in some cases,10, 84 although direct analysis is also limited as in the case of the bacterial P450s due to the need to bind an accessory protein (cytochrome b5 or NADPH-P450 reductase).
In summary, we report that alkyl sulfates are excellent substrates for P450BM-3, with rates of hydroxylation even faster than for analogous fatty acids measured under the same conditions. These are, of course, not physiological substrates, but a biological role for fatty acid oxidation by P450BM-3 has never been firmly established, despite the high catalytic efficiency of the enzyme. An important finding presented here is that P450BM-3 uses conformational selection in binding different substrates, in support of a model presented by Joyce et al.40 on the basis of crystal structures of the A264E mutant.
EXPERIMENTAL SECTION
Chemicals.
Palmitic acid was recrystallized from hot ethanol (mp 61–62 °C, lit 63–64 °C85). Dodecyl sulfate, tetradecyl sulfate, hexadecyl sulfate, and octadecyl sulfate, and N-palmitoylglycine were purchased from Sigma Aldrich and used directly. d23-Lauric acid (98%) was obtained from Cambridge Isotopes (Andover, MA). 11-OH lauric acid was synthesized in this laboratory and characterized as described previously.56 Fatty acids were dissolved (2–10 mM) in aqueous 50 mM K2CO3, and alkyl sulfates were made up as 10 mM stocks in H2O. Ketoconazole was dissolved in CH3OH. A probe sonicator was used, with mild heating as necessary, to prepare homogenous aqueous solutions when necessary.
Enzymes.
P450BM-3 was expressed from a cDNA vector (provided by the late Armand J. Fulco, Univ. California, Los Angeles) in Escherichia coli and purified, essentially as described15 using a sequence of steps involving cell lysis, ultracentrifugation, DEAE chromatography, 2´,5´-ADP affinity chromatography, and dialysis. The electrophoretic and spectral properties are shown in Supporting Figures S5 and S6. The preparation was stored at −20 °C in buffer 10 mM Tris-acetate buffer (pH 7.4) containing 1 mM EDTA and 20% glycerol (v/v).
Enzyme Assays.
All assays with P450BM-3 were done at 23 °C (room temperature) in 50 mM potassium 3-morpholinopropane-1-sulfonic acid (MOPS) buffer (pH 7.4).
NADPH Oxidation.
NADPH (150 μM) was added to P450BM-3 (25–75 nM) in 50 mM potassium MOPS buffer (pH 7.4) and the absorbance decrease at 340 nm was monitored in an OLIS-Cary 14 spectrophotometer (On-Line Instrument Systems, Bogart, GA) at 23 °C. Only the initial (linear) changes were used in analysis of rates (OLIS Global Works software). Hyperbolic fits were done to solve for kcat and ksp (kcat/Km), which was analyzed directly instead of Km86 (see the reference for the advantages of this approach; non-linear regression of hyperbolic fits was done using Prism v 8.0 software (GraphPad, San Diego, CA), using the input formula Y= (ksp*X)/(1 + (ksp*X/kcat)).
Incubations of P450BM-3 with Tetradecyl Sulfate, Dodecyl Sulfate, and Lauric Acid for Measurement of Products.
Incubation mixtures (100 μL) contained P450BM-3 (25 nM), substrate (100 μM), NADPH (150 μM), and 50 mM potassium MOPS buffer (pH 7.4). Reaction mixtures were incubated at room temperature for 2–7 min and terminated by the addition of 500 μL of cold ethyl acetate containing 0.1% HCO2H (v/v), followed by mixing for 1 min with a vortex device and centrifugation at 3 × 10³ × g for 5 min. An aliquot of the the organic layer was carefully removed and evaporated under a stream of nitrogen. Samples were reconstituted in 50 μL of CH3CN containing 0.1% HCO2H (v/v) followed by the addition of 50 μL of water containing 0.1% HCO2H (v/v), transferred into vials, and subjected to LC-MS analysis. Negative control runs contained all of the components except P450BM-3.
Derivatization Procedures.
P450BM-3 was incubated with tetradecyl sulfate for 2 min at room temperature, as described above. Incubation mixtures (100 μL) were then mixed with Jones reagent (10 μL)47 and incubated at room temperature for 10 min (Scheme 2). Alcohol oxidation was terminated by adding 500 μL of cold ethyl acetate containing 0.1% HCO2H (v/v), followed by mixing for 1 min with a vortex device and centrifugation at 3 × 10³ × g for 5 minutes.47 The organic layer was carefully removed and evaporated under a stream of nitrogen. For Baeyer-Villiger oxidation (Scheme 2), each sample was reconstituted in CH3CN (50 μL), sodium percarbonate (NaCO3, 10 mg) and trifluoroacetic acid (CF3CO3H, 50 μL) were added, and the mixture was incubated at room temperature for 60 minutes.48 Ester formation was terminated by the addition of 500 μL of cold ethyl acetate containing 0.1% HCO2H (v/v), followed by mixing for 1 min with a vortex device and centrifugation at 3 × 10³ g for 5 min. The organic layer was carefully removed and evaporated under a stream of nitrogen. Base hydrolysis of the ester product (Scheme 2) was done in 0.1 M NaOH (100 μL, 60 °C, 1 h). The solution was partially neutralized by the addition of 0.3 μL of HCO2H (24 M). CH3CN (100 μL) was added and 10 μL was injected onto an LC-MS column.
UPLC–HRMS Analysis.
Samples (5 μL) were injected onto a Hypersil Gold Vanquish C18 octadecylsilane column (2.1 mm × 150 mm, 1.9 μm) operating at room temperature with a flow rate of 0.3 mL min−1. Chromatographic separation was achieved using a system composed of solvent A (10 mM NH4CH3CO2, pH 6.8) and solvent B (CH3CN). Gradient conditions were set up as follows: 30% B (0–1 min), linear gradient of B increasing to 95% (1–7 minutes), hold at 95% B (7–8 minutes), return to initial condition (5% B) for column equilibration (8–10 minutes). The UPLC system was coupled to an Orbitrap mass spectrometer with an heated electrospray ionization source (Thermo Fisher, San Jose, CA). Analysis was performed in the negative ionization mode using: (1) full MS scan range m/z 100–400 Da at 30,000 resolution, 1e6 automatic gain control target, and 250 ms IT value (time of accumulating ions per scan event); (2) MS/MS data-dependent fragmentation was triggered-based on each full MS scan for the top five most intense ions at 15,000 resolution, 1e5 automatic gain control target, 50 ms IT value, and an m/z 2 isolation window; and (3) PRM scanning at the exact mass of each of the parent molecule and its corresponding oxygenated products at 30,000 resolution, 2e5 automatic gain control target, 200 ms IT value, 50 eV collision energy, and an m/z 1.5 isolation window. The tune file source parameters were set as follows: N2 sheath gas flow 40 arbitrary units; auxiliary gas flow 10 arbitrary units; spray voltage at 3.5 kV in the positive ionization mode, 3.0 kV in the negative ionization mode; capillary temperature 320 °C; S-lens RF value 60; probe heater temperature 200 °C.
Product Derivatization and GC–MS Analysis of Lauric Acid Oxidation by P450BM-3.
Incubation mixtures (200 μL) contained P450BM-3 (1 μM), lauric acid (1 mM), NADPH (1.25 mM), and 50 mM potassium MOPS buffer (pH 7.4). Reaction mixtures were incubated at room temperature for 10 min and terminated by the addition of 600 μL of cold ethyl acetate containing 0.1% HCO2H (v/v), followed by mixing for 1 min with a vortex device and centrifugation at 3 × 10³ × g for 5 min. An aliquot of the organic layer was carefully removed and evaporated under a stream of nitrogen. Derivatization was carried out by adding 100 μL of N,O-bis(trimethyl)trifluoroacetamide (with 0.1% trichloromethylsilane, v/v) to the dried sample, followed by incubation at 70 °C for 60 min. The derivatizing reaction mixture was evaporated under a stream of nitrogen and reconstituted in hexane (50 μL). Product analysis was done using an Agilent GC/MS instrument with a 30 m × 0.25 mm × 0.25 μm DB-5 GC column (Agilent). Injection was (cold) on-column. The oven program used an initial temperature of 130 °C and was increased at 25 °C/min to 310 °C. Electron impact ionization was used, and ions in the range of 60–400 m/z were scanned at a rate of two scans per second. Negative control runs contained all of the components except NADPH.
Substrate Binding Spectral Changes.
In the initial screening trials, P450BM-3 (1.0 μM) was divided into two 1.0 mL cuvettes and a baseline (350–500 nm) was recorded in an OLIS-Cary 14 spectrophotometer. Each substrate was added to 200 μM (or 500 μM in the case of dodecyl sulfate) to the sample cuvette and the difference spectrum was recorded. Second derivative spectra44, 87 were obtained using the manufacturer’s GlobalWorks software.
In the titrations, a single 1.0-mL sample cuvette was used and sequential additions (1–5 μL) were made directly before recording each spectrum. The difference ΔA390-A418 was plotted vs. substrate concentration, and the data points were fit to a hyperbolic quadratic equation for tight binding in Prism software (Y=B+(A/2)*(1/E)*((Kd+E+X)-sqrt((Kd+E+X)^2-(4*E*X))).
Pre-steady-state Measurements.
All data were acquired at 23 °C in 50 mM potassium MOPS (buffer (pH 7.4) utilizing an OLIS RSM-1000 stopped-flow spectrophotometer in the rapid scanning mode (16 × 0.2 mm ScanDisk) with 1.24 mm slits and 400 lines/mm, >500 nm gratings, acquiring spectra from 332–565 nm and plotting kinetic traces at individual wavelengths. At least four shots were done at each substrate concentration, and the OLIS GlobalWorks software was used to extract ΔA390, ΔA390-A418, or other traces, which were averaged and fitted to single exponentials, each with SD.
In some cases, the kinetic files were transferred as Excel and txt files to KinTek Explorer38, 58, 88software (version 8.0, KinTek Corp., Snow Shoe, PA) using an Apple iMac OSX 10.13.6 system. Prism software (V 8.0) was used for some of the fitting.
Supplementary Material
ACKNOWLEDGMENTS
We thank K. Trisler for assistance in preparation of the manuscript.
Funding Sources. This work was supported by the National Institutes of Health Grant R01 GM118122.
ABBREVIATIONS
- HRMS
high resolution mass spectrometry
- KIE
(deuterium) kinetic isotope effect
- LC
ligand chromatography
- LC-MS
combined liquid chromatography-mass spectrometry
- MS
mass spectrometry
- OH
hydroxy
- P450 (or CYP)
cytochrome P450
- UPLC
ultraperformance liquid chromatography
Footnotes
Conflict of Interest. The authors declare no conflicts of interest.
Supporting Information Available. This information is available free of charge on the ACS Publications website and includes UV-visible spectra and second derivative spectra of P450BM-3 without and with tetradecyl sulfate, identification of the ω−1, ω−2, and ω−3 oxidation products of lauric acid, LC-HRMS of the P450BM-3 reaction products of dodecyl sulfate following derivatization to esters, LC-HRMS of P450BM-3 reaction products of dodecyl sulfate following derivatization to esters and base hydrolysis, purity of P450BM-3 preparation determined using SDS-polyacrylamide gel electrophoresis, and a Fe2+·CO complex vs. Fe2+ difference spectrum of the P450BM-3 preparation used for this study.
References
- 1.Ortiz de Montellano PR, Ed., Cytochrome P450: Structure, Mechanism, and Biochemistry. 4th ed.; Springer: New York, 2015. [Google Scholar]
- 2.Lamb DC; Follmer AH; Goldstone JV; Nelson DR; Warrilow AG; Price CL; True MY; Kelly SL; Poulos TL; Stegeman JJ, On the Occurrence of Cytochrome P450 in Viruses, Proc. Natl. Acad. Sci. U. S. A 2019, 116, 12343–12352. [DOI] [PMC free article] [PubMed] [Google Scholar]
- 3.Guengerich FP, Human Cytochrome P450 Enzymes, in Cytochrome P450: Structure, Mechanism, and Biochemistry, 4th ed.; Ortiz de Montellano PR, Ed., Springer: New York, 2015; pp 523–785. [Google Scholar]
- 4.Poulos TL; Finzel BC; Howard AJ, High-resolution crystal structure of cytochrome P450cam, J. Mol. Biol 1987, 195, 687–700. [DOI] [PubMed] [Google Scholar]
- 5.Mueller EJ; Loida PJ; Sligar SG, Twenty-five Years of P450cam Research: Mechanistic Insights into Oxygenase Catalysis, in Cytochrome P450: Structure, Mechanism, and Biochemistry, 2nd ed., Ortiz de Montellano PR, Ed., Plenum Press: New York, 1995; pp 83–124. [Google Scholar]
- 6.McLean KJ; Leys D; Munro AW Microbial Cytochromes P450, in Cytochrome P450. Structure, Mechanism, and Biochemistry, 4th ed.; Ortiz de Montellano PR, Ed., Springer: New York, 2015; pp 261–407. [Google Scholar]
- 7.Guengerich FP; Yoshimoto FK, Formation and Cleavage of C-C Bonds by Enzymatic Oxidation-Reduction Reactions, Chem. Rev 2018, 118, 6573–6655. [DOI] [PMC free article] [PubMed] [Google Scholar]
- 8.Guengerich FP Cytochrome P450 Catalysis in Natural Product Biosynthesis, in Comprehensive Natural Products, III: Chemistry and Biology Bollinger M, Booker S, Bandarian V, Eds. Elsevier: New York, 2020; Vol. 5, Radicals and Metalloenzymology, in press. [Google Scholar]
- 9.Rittle J; Green MT, Cytochrome P450 Compound I: Capture, Characterization, and C-H Bond Activation Kinetics, Science 2010, 330, 933–937. [DOI] [PubMed] [Google Scholar]
- 10.Guengerich FP, Perspective: Mechanisms of Cytochrome P450-Catalyzed Oxidations, ACS Catal. 2018, 8, 10964–10976. [DOI] [PMC free article] [PubMed] [Google Scholar]
- 11.Theorell H; Ehrenberg A; Chance B, Electronic Structure of the Peroxidase-Peroxide Complexes, Arch. Biochem. Biophys 1952, 37, 237–239. [DOI] [PubMed] [Google Scholar]
- 12.Narhi LO; Fulco AJ, Characterization of a Catalytically Self-Sufficient 119,000-Dalton Cytochrome P-450 Monooxygenase Induced by Barbiturates in Bacillus megaterium, J. Biol. Chem 1986, 261, 7160–7169. [PubMed] [Google Scholar]
- 13.Narhi LO; Fulco AJ, Identification and Characterization of Two Functional Domains in Cytochrome P-450BM-3, a Catalytically Self-Sufficient Monooxygenase Induced by Barbiturates in Bacillus megaterium, J. Biol. Chem 1987, 262, 6683–6690. [PubMed] [Google Scholar]
- 14.Graham-Lorence S; Truan G; Peterson JA; Falck JR; Wei S; Helvig C; Capdevila JH, An Active Site Substitution, F87V, Converts Cytochrome P450BM-3 into a Regio- and Stereoselective (14S,15R)-Arachidonic Acid Epoxygenase, J. Biol. Chem 1997, 272, 1127–1135. [DOI] [PubMed] [Google Scholar]
- 15.Li H; Darwish K; Poulos TL, Characterization of Recombinant Bacillus megaterium Cytochrome P-450BM-3 and Its Two Functional Domains, J. Biol. Chem 1991, 266, 11909–11914. [PubMed] [Google Scholar]
- 16.Ravichandran KG; Boddupalli SS; Hasemann CA; Peterson JA; Deisenhofer J, Crystal Structure of Hemoprotein Domain of P450 BM-3, a Prototype for Microsomal P450’s, Science 1993, 261, 731–736. [DOI] [PubMed] [Google Scholar]
- 17.Li H; Poulos TL, The Structure of the Cytochrome P450BM-3 Haem Domain Complexed with the Fatty Acid Substrate, Palmitoleic Acid, Nat. Struct. Biol 1997, 4, 140–146. [DOI] [PubMed] [Google Scholar]
- 18.Li H; Poulos TL, Fatty Acid Metabolism, Conformational Change, and Electron Transfer in Cytochrome P-450BM-3, Biochim. Biophys. Acta 1999, 1441, 141–149. [DOI] [PubMed] [Google Scholar]
- 19.Haines DC; Hegde A; Chen B; Zhao W; Bondlela M; Humphreys JM; Mullin DA; Tomchick DR; Machius M; Peterson JA, A Single Active-Site Mutation of P450BM-3 Dramatically Enhances Substrate Binding and Rate of Product Formation, Biochemistry 2011, 50, 8333–8341. [DOI] [PMC free article] [PubMed] [Google Scholar]
- 20.Ost TW; Miles CS; Murdoch J; Cheung Y; Reid GA; Chapman SK; Munro AW, Rational Re-Design of the Substrate Binding Site of Flavocytochrome P450BM3, FEBS Lett. 2000, 486, 173–177. [DOI] [PubMed] [Google Scholar]
- 21.Stjernschantz E; van Vugt-Lussenburg B; Bonifacio A; de Beer S; van der Zwan G; Gooijer C; Commandeur J; Vermeulen NP; Oostenbrink C, Structural Rationalization of Novel Drug Metabolizing Mutants of Cytochrome P450BM3, Proteins 2007, 71, 336–352. [DOI] [PubMed] [Google Scholar]
- 22.Sawayama AM; Chen MM; Kulanthaivel P; Kuo MS; Hemmerle H; Arnold FH, A Panel of Cytochrome P450BM3 Variants to Produce Drug Metabolites and Diversify Lead Compounds, Chemistry 2009, 15, 11723–11729. [DOI] [PMC free article] [PubMed] [Google Scholar]
- 23.Coelho PS; Wang ZJ; Ener ME; Baril SA; Kannan A; Arnold FH; Brustad EM, A Serine-substituted P450 Catalyzes Highly Efficient Carbene Transfer to Olefins in vivo, Nat. Chem. Biol 2013, 9, 485–U433. [DOI] [PMC free article] [PubMed] [Google Scholar]
- 24.Brandenberg OF; Chen K; Arnold FH, Directed Evolution of a Cytochrome P450 Carbene Transferase for Selective Functionalization of Cyclic Compounds, J. Am. Chem. Soc 2019, 141, 8989–8995. [DOI] [PubMed] [Google Scholar]
- 25.Fasan R; Jennifer Kan SB; Zhao H, A Continuing Career in Biocatalysis: Frances H. Arnold, ACS Catal. 2019, 9, 9775–9788. [DOI] [PMC free article] [PubMed] [Google Scholar]
- 26.Narhi LO; Fulco AJ, Phenobarbital Induction of a Soluble Cytochrome P-450-Dependent Fatty Acid Monooxygenase in Bacillus megaterium, J. Biol. Chem 1982, 257, 2147–2150. [PubMed] [Google Scholar]
- 27.Palmer CN; Axen E; Hughes V; Wolf CR, The Repressor Protein, Bm3R1, Mediates an Adaptive Response to Toxic Fatty Acids in Bacillus megaterium, J. Biol. Chem 1998, 273, 18109–18116. [DOI] [PubMed] [Google Scholar]
- 28.Liang Q; Chen L; Fulco AJ, In vivo Roles of Bm3R1 Repressor in the Barbiturate-mediated Induction of the Cytochrome P450 Genes (P450BM-3 and P450BM-1) of Bacillus megaterium, Biochim. Biophys. Acta 1998, 1380, 183–197. [DOI] [PubMed] [Google Scholar]
- 29.Parish WE; Wood J; Groger W; Sharma RK, An Apparatus to Simulate Metabolism of Ingested Substances, Toxicol. In Vitro 1990, 4, 532–536. [DOI] [PubMed] [Google Scholar]
- 30.Shaw G-C; Sung C-H; Chiang A, Induction by Long-Chain Fatty Acids and Sodium Dodecyl Sulfate of Cytochrome P450BM-3 in Bacillus megaterium, Curr. Microbiol 1996, 32, 124–128. [Google Scholar]
- 31.Udit AK; Hill MG; Gray HB, Electrochemistry of Cytochrome P450 BM3 in Sodium Dodecyl Sulfate Films, Langmuir 2006, 22, 10854–10857. [DOI] [PMC free article] [PubMed] [Google Scholar]
- 32.Axarli I; Prigipaki A; Labrou NE, Cytochrome P450 102A2 Catalyzes Efficient Oxidation of Sodium Dodecyl Sulphate: A Molecular Tool for Remediation, Enzyme Res 2010, 2010, 125429. [DOI] [PMC free article] [PubMed] [Google Scholar]
- 33.Gustafsson MC; Roitel O; Marshall KR; Noble MA; Chapman SK; Pessegueiro A; Fulco AJ; Cheesman MR; von Wachenfeldt C; Munro AW, Expression, Purification, and Characterization of Bacillus subtilis Cytochromes P450 CYP102A2 and CYP102A3: Flavocytochrome Homologues of P450BM3 from Bacillus megaterium, Biochemistry 2004, 43, 5474–5487. [DOI] [PubMed] [Google Scholar]
- 34.Vogt AD; Di Cera E, Conformational Selection or Induced Fit? A Critical Appraisal of the Kinetic Mechanism, Biochemistry 2012, 51, 5894–5902. [DOI] [PMC free article] [PubMed] [Google Scholar]
- 35.Gianni S; Dogan J; Jemth P, Distinguishing Induced Fit from Conformational Selection, Biophys. Chem 2014, 189, 33–39. [DOI] [PubMed] [Google Scholar]
- 36.Baca QJ; Golan DE, Pharmacodynamics, in Principles of Pharmaoclogy, The Pathophysiologic Basis of Drug Therapy, 4th ed.; Golan DE, Armstrong EJ, Armstrong AW, Eds., Wolters Kluwer: Philadelphia, pp 17–26, 2016. [Google Scholar]
- 37.Guengerich FP; Wilkey CJ; Glass SM; Reddish MJ, Conformational Selection Dominates Binding of Steroids to Human Cytochrome P450 17A1, J. Biol. Chem 2019, 294, 10028–10041. [DOI] [PMC free article] [PubMed] [Google Scholar]
- 38.Johnson KA, Multi-Step Reaction Kinetics, in Kinetic Anaylsis for the New Enzymology. 1st ed.; KinTek: Austin, TX, 2019; pp 257–293. [Google Scholar]
- 39.Guengerich FP; Wilkey CJ; Phan TTN, Human Cytochrome P450 Enzymes Bind Drugs and Other Substrates Mainly Through Conformational-Selection Modes, J. Biol. Chem 2019, 294, 10928–10941. [DOI] [PMC free article] [PubMed] [Google Scholar]
- 40.Joyce MG; Girvan HM; Munro AW; Leys D, A Single Mutation in Cytochrome P450BM3 Induces the Conformational Rearrangement Seen Upon Substrate Binding in the Wild-Type Enzyme, J. Biol. Chem 2004, 279, 23287–23293. [DOI] [PubMed] [Google Scholar]
- 41.Girvan HM; Marshall KR; Lawson RJ; Leys D; Joyce MG; Clarkson J; Smith WE; Cheesman MR; Munro AW, Flavocytochrome P450BM3 Mutant A264E Undergoes Substrate-Dependent Formation of a Novel Heme Iron Ligand Set, J. Biol. Chem 2004, 279, 23274–23286. [DOI] [PubMed] [Google Scholar]
- 42.Miura Y; Fulco AJ, ω–2 Hydroxylation of Fatty Acids by a Soluble System from Bacillus megaterium, J. Biol. Chem 1974, 249, 1880–1888. [PubMed] [Google Scholar]
- 43.Boddupalli SS; Estabrook RW; Peterson JA, Fatty Acid Monooxygenation by Cytochrome P-450BM-3, J. Biol. Chem 1990, 265, 4233–4239. [PubMed] [Google Scholar]
- 44.O’Haver TC; Green GL, Numerical Error Analysis of Derivative Spectrometry for the Quantitative Analysis of Mixtures, Anal. Chem 1976, 48, 312–318. [Google Scholar]
- 45.Whitehouse CJC; Bell SG; Wong L-L, P450BM3 (CYP102A1): Connecting the Dots, Chem. Soc. Rev 2012, 41, 1218–1260. [DOI] [PubMed] [Google Scholar]
- 46.Fekry MI; Xiao Y; Berg JZ; Guengerich FP, A Role for the Orphan Human Cytochrome P450 2S1 in Polyunsaturated Fatty Acid ω−1 Hydroxylation Using an Untargeted Metabolomic Approach, Drug Metab. Dispos 2019, 47, 1325–1332. [DOI] [PMC free article] [PubMed] [Google Scholar]
- 47.Bowden K; Heilbron IM; Jones ERH; Weedon BCL, 13. Researches on Acetylenic Compounds. Part I. The Preparation of Acetylenic Ketones by Oxidation of Acetylenic Carbinols and Glycols, J. Chem. Soc 1946, 39–45. [Google Scholar]
- 48.Olah GA; Wang Q; Trivedi NJ; Prakash GKS, Baeyer-Villiger Oxidation of Ketones to Esters with Sodium Percarbonate/Trifluoroacetic Acid, Synthesis-Stuttgart 1991, 739–740. [Google Scholar]
- 49.Cirino PC; Arnold FH, Regioselectivity and Activity of Cytochrome P450BM-3 and Mutant F87A in Reactions Driven by Hydrogen Peroxide, Adv. Synthesis Catal 2002, 344, 932–937. [Google Scholar]
- 50.Hammerer L; Winkler CK; Kroutil W, Regioselective Biocatalytic Hydroxylation of Fatty Acids by Cytochrome P450s, Catal. Lett 2018, 148, 787–812. [Google Scholar]
- 51.Guengerich FP, Kinetic Deuterium Isotope Effects in Cytochrome P450 Enzyme Reactions, Methods Enzymol. 2017, 596, 217–237. [DOI] [PMC free article] [PubMed] [Google Scholar]
- 52.Jones JP; Korzekwa KR; Rettie AE; Trager WF, Isotopically Sensitive Branching and Its Effect on the Observed Intramolecular Isotope Effects in Cytochrome P-450 Catalyzed Reactions: A New Method for the Estimation of Intrinsic Isotope Effects, J. Am. Chem. Soc 1986, 108, 7074–7078. [Google Scholar]
- 53.Miwa GT; Lu AYH, Kinetic Isotope Effects and ‘Metabolic Switching’ in Cytochrome P450-Catalyzed Reactions, BioEssays 1987, 7, 215–219. [DOI] [PubMed] [Google Scholar]
- 54.Northrop DB, Deuterium and Tritium Kinetic Isotope Effects on Initial Rates, Methods Enzymol. 1982, 87, 607–625. [DOI] [PubMed] [Google Scholar]
- 55.Northrop DB, Steady-state Analysis of Kinetic Isotope Effects in Enzymic Reactions, Biochemistry 1975, 14, 2644–2651. [DOI] [PubMed] [Google Scholar]
- 56.Chun Y-J; Shimada T; Sanchez-Ponce R; Martin MV; Lei L; Zhao B; Kelly SL; Waterman MR; Lamb DC; Guengerich FP, Electron Transport Pathway for a Streptomyces Cytochrome P450: Cytochrome P450 105D5-Catalyzed Fatty Acid Hydroxylation in Streptomyces coelicolor A3(2), J. Biol. Chem 2007, 282, 17486–17500. [DOI] [PubMed] [Google Scholar]
- 57.Isin EM; Guengerich FP, Multiple Sequential Steps Involved in the Binding of Inhibitors to Cytochrome P450 3A4, J. Biol. Chem 2007, 282, 6863–6874. [DOI] [PubMed] [Google Scholar]
- 58.Johnson KA; Simpson ZB; Blom T, FitSpace Explorer: An Algorithm to Evaluate Multidimensional Parameter Space in Fitting Kinetic Data, Anal. Biochem 2009, 387, 30–41. [DOI] [PubMed] [Google Scholar]
- 59.Walsh C, Introductory Remarks About Enzymes and Enzymatic Catalysis, in Enzymatic Reaction Mechanisms. W. H. Freeman Co.: San Francisco, pp 24–48, 1979. [Google Scholar]
- 60.Johnson KA, Introduction to Kinetic Analysis of Enzyme Systems, in Kinetic Analysis of Macromolecules. A Practical Approach, Johnson KA, Ed. Oxford University Press: Oxford, UK, 2003; pp 1–18. [Google Scholar]
- 61.Sohl CD; Isin EM; Eoff RL; Marsch GA; Stec DF; Guengerich FP, Cooperativity in Oxidation Reactions Catalyzed by Cytochrome P450 1A2: Highly Cooperative Pyrene Hydroxylation and Multiphasic Kinetics of Ligand Binding, J. Biol. Chem 2008, 283, 7293–7308. [DOI] [PubMed] [Google Scholar]
- 62.Rowlatt B; Yorke JA; Strong AJ; Whitehouse CJC; Bell SG; Wong L-L, Chain Length-Dependent Cooperativity in Fatty Acid Binding and Oxidation by Cytochrome P450BM3 (CYP102A1), Protein Cell 2011, 2, 656–671. [DOI] [PMC free article] [PubMed] [Google Scholar]
- 63.Leggett CW; Void RD; McBain JW, The Solubility of Sodium Palmitate in Organic Liquids, J. Phys. Chem 1942, 46, 429–440. [Google Scholar]
- 64.Peterson JA; Boddupalli SS, P-450BM-3: Reduction by NADPH and Sodium Dithionite, Arch. Biochem. Biophys 1992, 294, 654–661. [DOI] [PubMed] [Google Scholar]
- 65.Shirane N; Sui Z; Peterson JA; Ortiz de Montellano PR, Cytochrome P450BM-3 (CYP102) Regiospecificity of Oxidation of ω-Unsaturated Fatty Acids and Mechanism-Based Inactivation, Biochemistry 1993, 32, 13732–13741. [DOI] [PubMed] [Google Scholar]
- 66.Boddupalli SS; Hasemann CA; Ravichandran KG; Lu JY; Goldsmith EJ; Deisenhofer J; Peterson JA, Crystallization and Preliminary X-Ray Diffraction Analysis of P450terp and the Hemoprotein Domain of P450BM-3, Enzymes Belonging to Two Distinct Classes of the Cytochrome P450 Superfamily, Proc. Natl. Acad. Sci. U. S. A 1992, 89, 5567–5571. [DOI] [PMC free article] [PubMed] [Google Scholar]
- 67.Li H; Poulos TL, Modeling Protein-Substrate Interactions in the Heme Domain of Cytochrome P450(BM-3), Acta Crystallogr. Sect. D, Biol. Crystallogr 1995, 51, 21–32. [DOI] [PubMed] [Google Scholar]
- 68.Li H; Poulos TL, Conformational Dynamics in Cytochrome P450-Substrate Interactions, Biochimie 1996, 78, 695–699. [DOI] [PubMed] [Google Scholar]
- 69.Haines DC; Tomchick DR; Machius M; Peterson JA, Pivotal Role of Water in the Mechanism of P450BM-3, Biochemistry 2001, 40, 13456–13465. [DOI] [PubMed] [Google Scholar]
- 70.Brenner S; Hay S; Girvan HM; Munro AW; Scrutton NS, Conformational Dynamics of the Cytochrome P450BM3/N-Palmitoylglycine Complex: The Proposed “Proximal-Distal” Transition Probed by Temperature-Jump Spectroscopy, J. Phys. Chem. B 2007, 111, 7879–7886. [DOI] [PubMed] [Google Scholar]
- 71.Munro AW; Daff S; Coggins JR; Lindsay JG; Chapman SK, Probing Electron Transfer in Flavocytochrome P-450BM3 and Its Component Domains, Eur. J. Biochem 1996, 239, 403–409. [DOI] [PubMed] [Google Scholar]
- 72.Benkovic SJ; Hammes GG; Hammes-Schiffer S, Free-Energy Landscape of Enzyme Catalysis, Biochemistry 2008, 47, 3317–3321. [DOI] [PubMed] [Google Scholar]
- 73.Sevrioukova IF; Peterson JA, Reaction of Carbon Monoxide and Molecular Oxygen with P450terp (CYP108) and P450BM-3 (CYP102), Arch. Biochem. Biophys 1995, 317, 397–404. [DOI] [PubMed] [Google Scholar]
- 74.Bec N; Anzenbacher P; Anzenbacherova E; Gorren AC; Munro AW; Lange R, Spectral Properties of the Oxyferrous Complex of the Heme Domain of Cytochrome P450BM-3 (CYP102), Biochem. Biophys. Res. Commun 1999, 266, 187–189. [DOI] [PubMed] [Google Scholar]
- 75.Matsson O; Westaway KC, Secondary Deuterium Kinetic Isotope Effects and Transition State Structure, Adv. Phys. Org.Chem 1998, 31, 143–248. [Google Scholar]
- 76.Kim D-H; Kim K-H; Kim D-H; Liu K-H; Jung H-C; Pan J-G; Yun C-H, Generation of Human Metabolites of 7-Ethoxycoumarin by Bacterial Cytochrome P450BM3, Drug Metab. Dispos 2008, 36, 2166. [DOI] [PubMed] [Google Scholar]
- 77.Brewer CB; Peterson JA, Single Turnover Kinetics of the Reaction Between Oxycytochrome P-450cam and Reduced Putidaredoxin, J. Biol. Chem 1988, 263, 791–798. [PubMed] [Google Scholar]
- 78.Björkhem I, On the Rate-Limiting Step in Microsomal Hydroxylation of Steroids, Eur. J. Biochem 1972, 27, 354–363. [DOI] [PubMed] [Google Scholar]
- 79.Gander JE; Mannering GJ, Kinetics of Hepatic Cytochrome P-450-Dependent Mono-Oxygenase Systems, Pharmacol. Therapeut 1980, 10, 191–221. [DOI] [PubMed] [Google Scholar]
- 80.Guengerich FP, Rate-Limiting Steps in Cytochrome P450 Catalysis, Biol. Chem 2002, 383, 1553–1564. [DOI] [PubMed] [Google Scholar]
- 81.Isin EM; Guengerich FP, Kinetics and Thermodynamics of Ligand Binding by Cytochrome P450 3A4, J. Biol. Chem 2006, 281, 9127–9136. [DOI] [PubMed] [Google Scholar]
- 82.Gonzalez E; Guengerich FP, Kinetic Processivity of the Two-Step Oxidations of Progesterone and Pregnenolone to Androgens by Human Cytochrome P450 17A1, J. Biol. Chem 2017, 292, 13168–13185. [DOI] [PMC free article] [PubMed] [Google Scholar]
- 83.Bell LC; Guengerich FP, Oxidation Kinetics of Ethanol by Human Cytochrome P450 2E1. Rate-Limiting Product Release Accounts for Effects of Isotopic Hydrogen Substitution and Cytochrome b5 on Steady-State Kinetics, J. Biol. Chem 1997, 272, 29643–29651. [DOI] [PubMed] [Google Scholar]
- 84.Hildebrandt A; Estabrook RW, Evidence for the Participation of Cytochrome b5 in Hepatic Microsomal Mixed-Function Oxidation Reactions, Arch. Biochem. Biophys 1971, 143, 66–79. [DOI] [PubMed] [Google Scholar]
- 85.O’Neil MJ Sr. Ed.., Palmitic Acid, in Merck Index, 13th ed.; Merck Research Laboratories: Whitehouse Station, NJ, p 1253, 2000. [Google Scholar]
- 86.Johnson KA, New Standards for Collecting and Fitting Steady State Kinetic Data, Beilstein J. Org. Chem 2019, 15, 16–29. [DOI] [PMC free article] [PubMed] [Google Scholar]
- 87.Guengerich FP, Oxidation-Reduction Properties of Rat Liver Cytochromes P-450 and NADPH-Cytochrome P-450 Reductase Related to Catalysis in Reconstituted Systems, Biochemistry 1983, 22, 2811–2820. [DOI] [PubMed] [Google Scholar]
- 88.Johnson KA; Simpson ZB; Blom T, Global Kinetic Explorer: A New Computer Program for Dynamic Simulation and Fitting of Kinetic Data, Anal. Biochem 2009, 387, 20–29. [DOI] [PubMed] [Google Scholar]
Associated Data
This section collects any data citations, data availability statements, or supplementary materials included in this article.


