

Abstract
Changing food preferences brought about by Westernisation that have deleterious health effects1,2, plus myriad forces contributing to increased food insecurity, are catalyzing efforts to identify more nutritious and affordable foods3. Consumption of dietary fibre can help prevent cardiovascular disease, type 2 diabetes, and obesity4,5,6. A substantial number of reports have explored the effects of dietary fibre on the gut microbial community7,8,9. However, the microbiome is complex, dynamic, and exhibits considerable intra- and interpersonal variation in its composition and functions. The massive number of potential interactions between its components makes it challenging to define the mechanisms by which food ingredients affect community properties. Here we address the question of how foods containing different fibre preparations can be designed to alter functions associated with specific microbiome components. Given the marked increase in snack consumption associated with Westernisation, plant fibres from different sustainable sources that targeted distinct features of obese human donor gut microbiomes in gnotobiotic mice were formulated into snack prototypes and used to supplement controlled diets consumed by overweight and obese adults; the results revealed fibre-specific changes in their microbiomes that were linked to changes in their plasma proteomes indicative of altered physiologic state.
Keywords: Dietary fibre-gut microbiome interactions; carbohydrate metabolism; gnotobiotic mice, human controlled diet studies; human microbiome-plasma proteome relationships
Previously, we observed that transplanting faecal microbiomes from obesity discordant twin pairs [one co-twin is obese (Ob), the other is lean (Ln)] into germ-free mice resulted in increased adiposity in recipients of Ob compared to Ln microbiomes10. Cohousing mice shortly after they received Ob or Ln donor microbiomes prevented the Ob cagemate from developing obesity and associated metabolic abnormalities; protection was associated with invasion of members of Bacteroidales, notably several Bacteroides, from Ln into Ob gut communities. Invasion did not occur when co-housed Ob and Ln mice consumed a fibre-deficient diet high in saturated fats and low in fruits and vegetables (HiSF-LoFV)10. A follow-up screen of 34 food-grade fibres in gnotobiotic mice harboring a defined consortium of cultured gut bacterial strains from an Ln donor and fed the HiSF-LoFV diet identified fibre preparations that selectively increased the abundances of targeted Bacteroides under-represented in Ob microbial communities11. We have now characterized the effects of dietary supplementation with different lead fibres emerging from this screen in gnotobiotic mice fed the HiSF-LoFV diet and colonized with faecal microbiomes from nine adults with obesity. Snack prototypes containing one, two, or four leads were subsequently tested in two pilot human, controlled-diet studies where participants consumed a diet similar in nutritional composition to the one used in the mouse studies. The effects of the fibre supplements on gut microbiome components, including carbohydrate-active enzymes (CAZymes) and various metabolic pathways, as well as host biology (defined by measuring changes in 1305 plasma protein biomarkers and mediators of numerous physiologic functions) were evaluated using computational approaches for feature selection. The results provide an illustration of translatability from gnotobiotic mice to the human population they are designed to portray, and the intersection between the microbiome and nutrition.
Results
Gnotobiotic mouse studies
Fibres isolated from the endosperm of peas, the vesicular pulp of oranges and the bran of barley each contain a diverse set of glycans. Arabinan and galacturonan are the most abundant glycans in pea fibre. Orange fibre also contains arabinan and galacturonan but, in contrast to pea fibre, galacturonan dominates. Barley bran contains mixed-linkage β-glucans11 with arabinose and xylose represented in arabinoxylans (linear β-1,4-linked xylose with α-1,2- and α-1,3-linked arabinose decorations) (Extended Data Fig.1a,b; Supplementary Table1a).
Adult germ-free mice were each colonized with a faecal sample obtained from one of nine 32–41-year-old women with obesity (Supplementary Table1b; n=6–10 mice/donor microbiome). Each mouse in each group was subjected to a diet oscillation protocol where the base HiSF-LoFV diet was supplemented with 10% (w/w) of one of the three types of fibres (Extended Data Figs.1c,d;2a; Supplementary Table1c,d). The unsupplemented HiSF-LoFV diet was given for 10 days between each period of fibre-supplementation. Bacterial taxa were identified by sequencing 16S rDNA genes, while genes in the faecal microbiome were identified by sequencing whole community DNA (Supplementary Table1e-i). Microbiome annotation focused on genes represented in (i) the Carbohydrate-Active enZYmes (CAZy) database12 with a focus on glycoside hydrolases (GH) and polysaccharide lyases (PL) (Supplementary Table2) and (ii) metabolic pathways [microbial community (mc)SEED subsystems]13. Higher-Order Singular Value Decomposition (HOSVD), a technique from the fields of signal processing and machine-learning, that has recently been shown to be useful in analysing multi-feature time-series studies of microbial communities14 was used to identify changes specific to each fibre treatment (Extended Data Fig.2b-e). Our analysis included 269 bacterial taxa [defined as V4–16S rDNA amplicon sequence variants (ASVs)], 318 genes encoding CAZymes and 81 mcSEED metabolic pathways identified in faecal samples collected from animals during the diet oscillation.
Extended Data Figs.2f and 3a show GH and PL genes whose increases in abundances were statistically significant (q-value <0.1; linear-mixed effects model) and right-most projecting along tensor component 1 (TC1) (Supplementary Table3a-e). Consistent with the composition of pea fibre, they encode reported or predicted α-arabinofuranosidases (GH43_17, GH43_9, GH43_1, GH43_12, GH43_2, GH43_19, GH43_18), rhamnogalacturonan lyases, galacturonidases, xylanases and xylosidases, among others. mcSEED metabolic pathways whose increases in abundance were statistically significant (q-value<0.1; linear-mixed effects model) and whose projections along TC1 were at the tails of the distribution (α<0.1). The representation of genes in mcSEED pathways involved in utilization of arabinose/arabino-oligosaccharides (AOS), xylose/xylo-oligosaccharides (XOS), plus galacturonate/glucuronate and rhamnose and their respective oligosaccharides also increased (Extended Data Figs.3b,4a; Supplementary Table3f-j). Reflecting their similarities in polysaccharide composition, orange and pea fibre each produced increases in CAZyme genes involved in processing of arabinan and galacturonans. Although both fibre preparations contain cellulose, the magnitude of the increase in abundances of some β-glucanases/β-glucosidases (GH5_1, GH5_26, GH48, GH30_6, GH5_38, GH9) was more pronounced with orange fibre (Extended Data Fig.2f). As with pea fibre, there were significant increases in the representation of mcSEED pathways involved in utilization of arabinose/AOS, xylose/XOS, as well as galacturonate/glucuronate and rhamnose and their respective oligosaccharides (Extended Data Fig.3b). Barley bran consumption led to a decrease in CAZymes involved in processing arabinan (with the exception of GH5_13, GH43_35 and GH43_12 which may recognize arabinose in arabinoxylans prominently represented in barley bran), while glucanases involved beta-glucan processing increased to a greater degree than with the other two fibre preparations [GH5_4 (a xylo-glucan-specific β-glucanase and endo-β-1,4 xylanase) plus GH5_46 (endo- β-1,4 glucanase whose rise was unique to barley bran); Extended Data Fig.2f].
Members of Bacteroides (B. vulgatus, B. thetaiotaomicron, B. xylanisolvens, B. cellulosilyticus, B. nordii, B. ovatus) plus Blautia wexlerae were the major drivers of microbiota configurational changes induced by pea fibre as defined by the magnitude and statistical significance of increases in their relative abundances (q-value <0.1, linear mixed effects model) and their right-most projection along TC1. Similar to pea fibre, B. thetaiotaomicron and B. vulgatus were the major responders to orange fibre (in addition to B. nordii, B. xylanisolvens, and B. cellulosilyticus). B. vulgatus and B. thetaiotaomicron decreased with barley bran while B. uniformis, B. ovatus, B. xylanisolvens and Ruminococcus bicirculans increased (Supplementary Table3k-o; Extended Data Figs.4b,5a,b). Notably, the degree of interpersonal variation in the community response to all three fibres was less pronounced at the level of CAZymes and mcSEED metabolic pathways than in ASV-feature space (P=0.002 to <0.0001; Dunn’s Kruskal-Wallis test of Bray-Curtis dissimilarity distances) (Extended Data Figs.3a,b;5b).
Microbiome effects of fibre-snacks in humans
To test the translatability of results obtained in gnotobiotic mice, we first performed an open-label, single group assignment, controlled diet study involving 13 participants (12 completed the study) who were overweight or obese (BMI ≥25.0 and ≤35.0 kg/m2), and a snack food prototype containing pea fibre (Supplementary Table 4a). Participants (Supplementary Table5a) followed a 45-day regimen (Fig. 1a) where their normal diet was replaced with the equivalent of the HiSF-LoFV diet in the form of specifically designed, pre-prepared meals (Supplementary Table4b). One week after switching to this diet, participants began consuming a single 35g snack containing 8.1g of extruded pea fibre: a dose escalation followed such that 7 days after beginning supplementation, 3 snacks/day were being consumed (1/meal). This dose was continued for 21 days, after which time snack supplementation ceased. No adjustments in the amount of diet consumed were needed to maintain constant weight during or after the period of snack supplementation (Supplementary Table5b,c). HOSVD of the representation of CAZymes, mcSEED metabolic pathways and ASVs was performed (Supplementary Tables6a,b,7a-l).
Fig. 1: Controlled diet study of the effects of fibre snack food prototypes on the faecal microbiomes of overweight and obese humans.
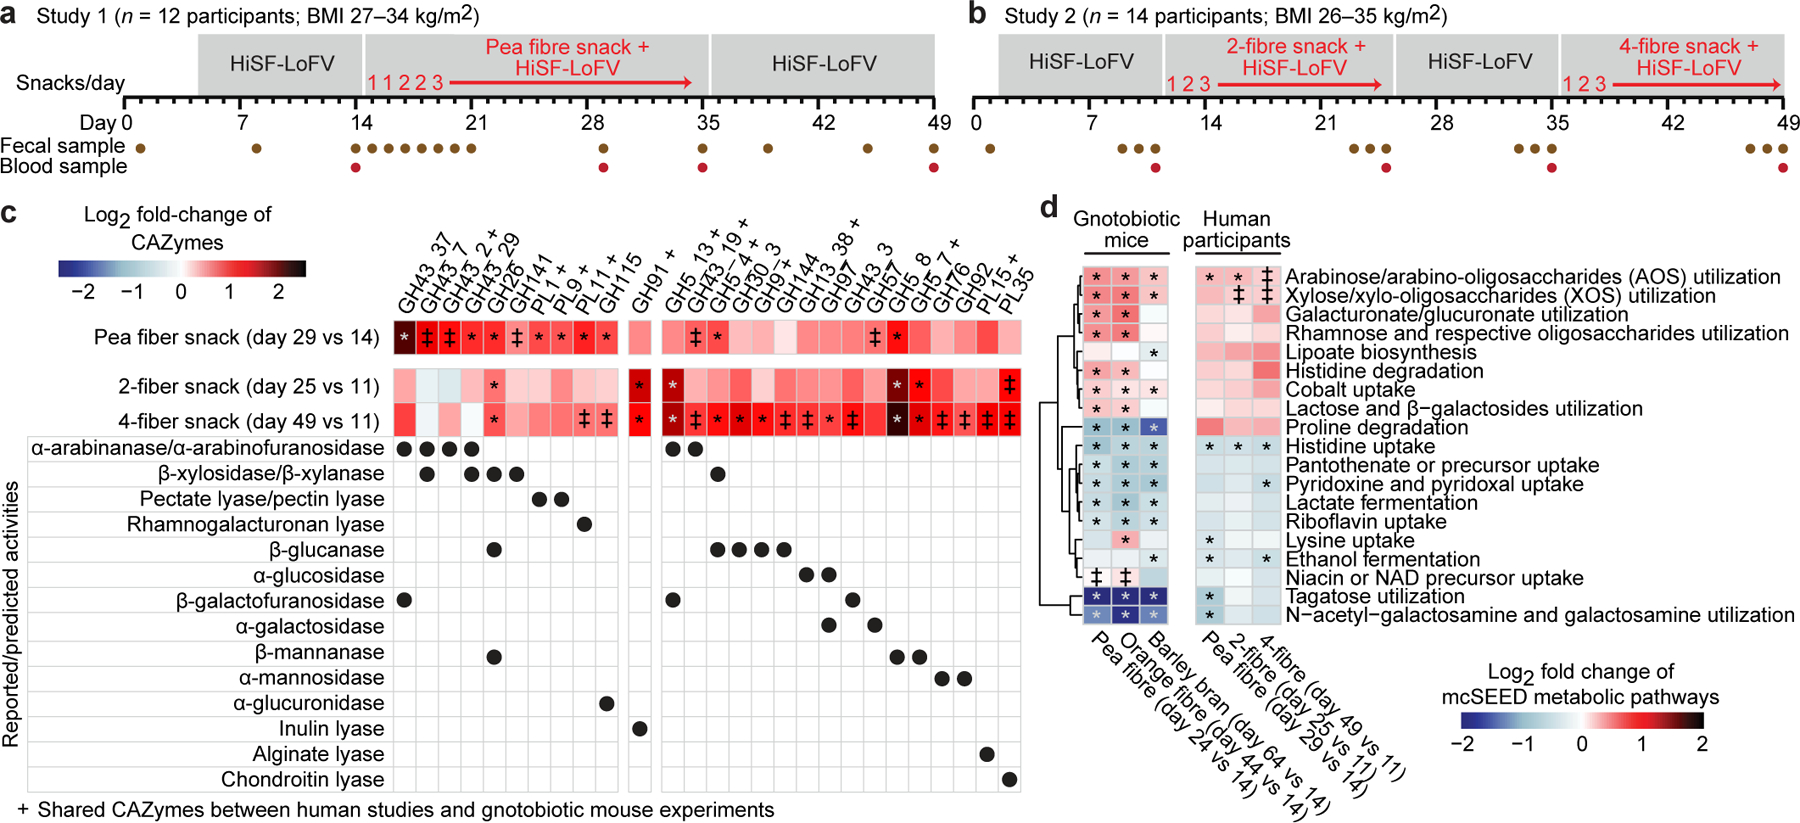
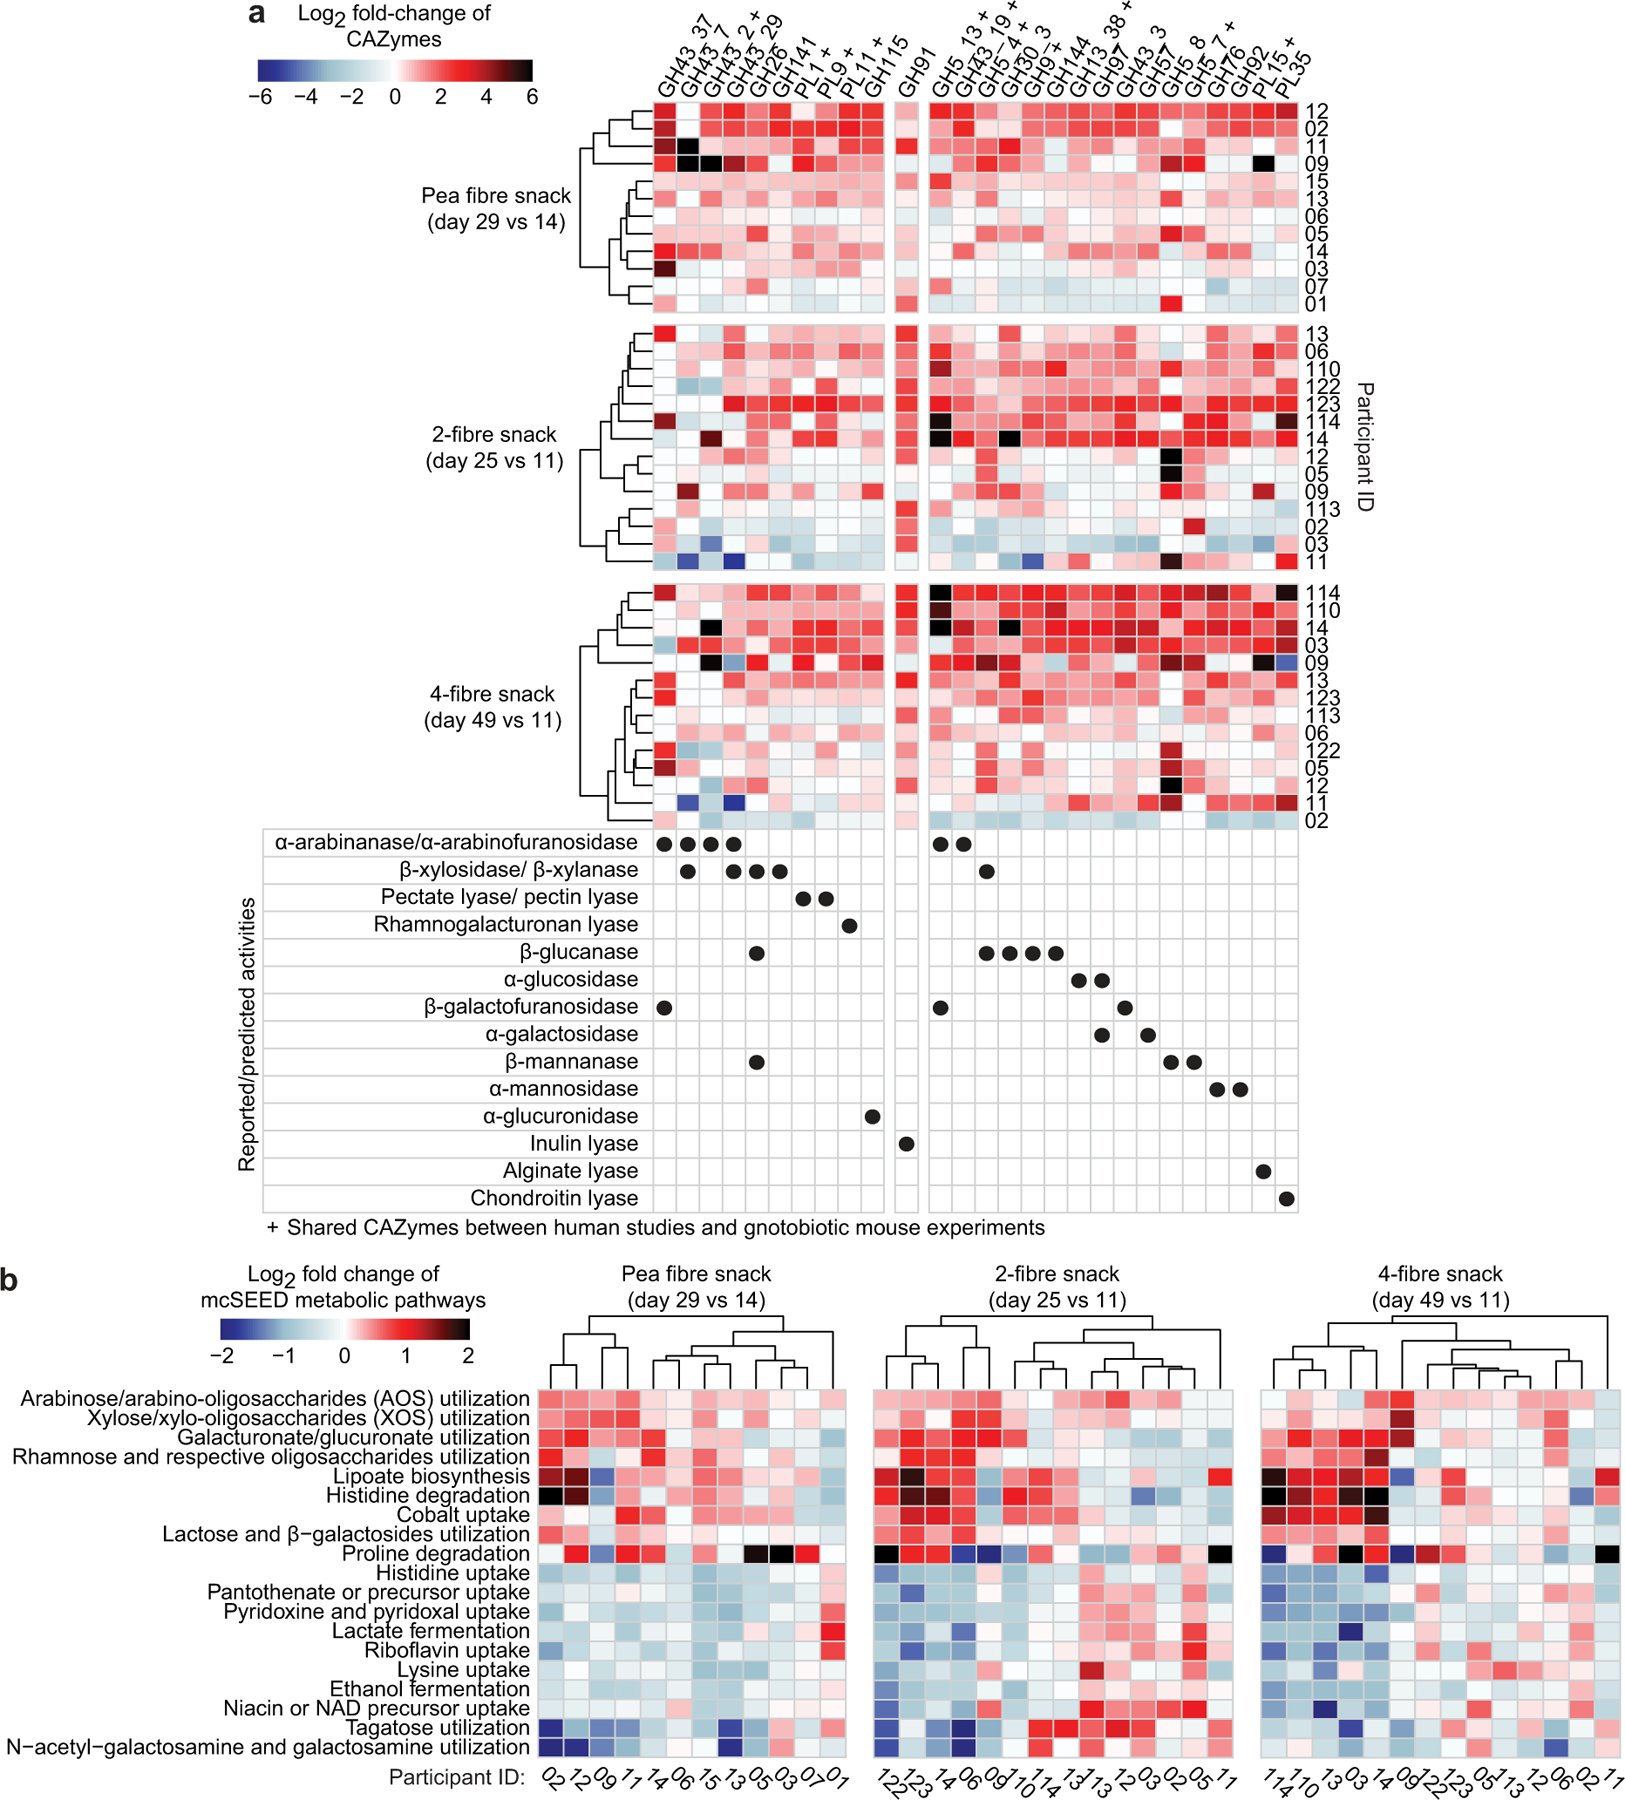
a,b, Study designs. c, Heatmap plotting discriminatory CAZymes for all three fibre snack treatments whose log2-fold change in abundance was statistically significant during at least one dietary intervention in the faecal microbiomes of participants during consumption of either of the fibre snacks relative to last day of the pretreatment phase. Data are averaged for all participants during each dietary intervention period (n=12 and 14 participants for study 1 and 2, respectively, n=66 faecal samples analysed). d, Heatmap of discriminatory mcSEED pathways represented in the microbiomes of gnotobiotic mice and human participants whose changes in abundance were statistically significant during at least one of the dietary fibre interventions. The heatmap depicted on the left shows the grand mean of the log2 fold-change in abundances of mcSEED pathways in animals containing the nine different human donor communities (n=6 to 10 mice/donor microbiome; n=232 faecal samples analysed), while the heatmap on the right shows the mean log2 fold-change in the abundances of mcSEED pathways in participants consuming the pea fibre, 2-fibre or 4-fibre snacks (n=12 and 14 for studies 1 and 2, respectively; n=66 faecal samples analysed). The order of mcSEED pathways from top to bottom is based on hierarchical clustering (Euclidean distances). ‡ q-value <0.1, * q-value <0.05 (linear-mixed effects model, FDR-corrected). CAZymes marked with a ‘+’ were also fibre-treatment discriminatory in the gnotobiotic mouse studies.
Fig. 1c and Extended Data Fig.6a show GHs and PLs whose responses were conserved in study participants and in the pea fibre-treated gnotobiotic mice; they include significant increases in GH43 subfamily arabinofuranosidases (GH43_2, GH43_19), the β-glucanase/β-xylanase GH5_4, pectin/pectate lyases (PL1, PL9), and the rhamnogalacturonan lyase PL11 (q-value <0.1, mixed-effects linear model). Fig. 1d and Extended Data Fig.6b document mcSEED pathway responses shared between mice and humans, including an increase in the representation of the arabinose/AOS utilization pathway. Cross-correlation of faecal levels of monosaccharides and glycosidic linkages with discriminatory CAZyme gene abundances confirmed that study participant microbiomes contain CAZymes that recognize and cleave 1,2-arabinofuranose and 1,3-arabinofuranose linkages found in the branches of pea fibre arabinan11,15, leaving the backbone (1,5-arabinofuranose) to accumulate (Extended Data Fig.7, Supplementary Table8a-c, Supplementary Results).
Fourteen overweight/obese adults (Supplementary Table5a) completed a second open-label, single group assignment controlled diet study that tested two multi-fibre snack prototypes; one contained pea fibre and inulin (a β-2–1-linked fructose polymer that produced pronounced increases in B. caccae in our previous fibre screening experiment11; 10.1g fibre/30g snack; 64% pea fibre, 36% inulin) and the other contained pea fibre, inulin, orange fibre and barley bran (10.5g fibre/30g snack; 33% pea fibre, 36% inulin, 11% orange fibre, 20% barley bran; Supplementary Table4a). Nine participants participated in both studies. The interval between the two studies for these individuals ranged from 63–96 days; their body weights were not significantly different between each study (-0.6±3.3 kg; mean±SD; Supplementary Table5a). All 14 participants followed a 48-day controlled-diet protocol where their normal diet was replaced with the HiSF-LoFV diet (Fig. 1b). They consumed the 2-fibre snack for 14 days (3 servings/day), then returned to the unsupplemented HiSF-LoFV diet for 10 days, and subsequently switched to the 4-fibre snack (3 servings/day) for 14 days. No caloric adjustments had to be made in the amount of HiSF-LoFV diet consumed to maintain a constant body weight in all participants (Supplementary Table5b,c).
We conducted HOSVD of changes in the representation of CAZymes, mcSEED pathways and ASVs; data were normalized to the last day of the pre-intervention phase (day 11; Supplementary Tables6c,d;7m-x). Fig. 1c shows GH and PL genes whose increases in abundances were statistically significant (q-value<0.1; linear-mixed effects model) and that were the right-most [90th percentile (α<0.1)] ranked feature projections along TC1 (Supplementary Table7y); six and 19 CAZymes satisfied these criteria for the 2- and 4-fibre snacks, respectively. An inulin lyase (GH91) exhibited the greatest increase in participants consuming the 2-fibre snack. Eight of the 19 CAZymes that exhibited significant responses in humans with the 4-fibre snack also exhibited statistically significant increases in mice (Fig. 1c). Among these 19 CAZymes, the responses of nine were uniquely associated with the 4-fibre blend; GH30_3 (activity shown for fungal β-1,6-glucan16), GH9 (various β-glucan substrates including xyloglucan17 and mixed linkage β-1,3–1,4-glucans such as barley β-glucan18), GH144 (β-1,2-glucans19), GH13_38 (α-glucosidase), GH97 (various activities reported including α-glucosidase20 and α-galactosidase21), GH43_3 (activity reported with a synthetic 4-nitrophenyl-β-D-galactofuranoside substrate22 but also likely on α-L-arabinofuranosides, as documented for GH43_3423), GH76 (α-1,6-mannanase), GH92 (α-mannosidase), and PL15 (alginate lyase activity reported24 although other functions cannot be excluded). Thus, the microbiome response to the 4-fibre snack is consistent, at least in part, with its inclusion of barley bran and orange fibre.
The 2- and 4-fibre snacks both produced significant increases in the representation of mcSEED pathways involved arabinose/AOS and xylose/XOS utilization (changes also documented in mice) (Fig. 1d, Supplementary Table7z) and statistically significant increases in several Bacteroides (Extended Data Fig.5c, Supplementary Table7aa). In both human studies (as in the mouse study), there was substantially greater degree of interpersonal variation in the pattern of change in the abundances of ASVs compared to genes encoding CAZymes and mcSEED pathways (P<0.0001, Dunn’s Kruskal-Wallis test of Bray-Curtis dissimilarity distances; Extended Data Fig.6a,b, Supplementary Table6e,f). Together, these results provided evidence that the 4-fibre blend produced the largest number of significant CAZyme responses; they also raised the question of whether the different treatments were associated with qualitatively and quantitatively distinct host responses.
Plasma proteome responses
We employed the analytic approach described in Extended Data Fig.8 to relate CAZyme responses to each type of fibre snack with each participant’s plasma proteomic responses. In the first step, a cross-correlation (CC) matrix was created for each snack where columns were measured plasma proteins (n=1170 and 1205 for studies 1 and 2, respectively) representing biomarkers and regulators of a range of physiologic functions and rows were the identified fibre-responsive CAZymes. Each element of the matrix contained the Spearman correlation between plasma protein levels (Supplementary Tables9a-c; 10a-c) and CAZyme abundances over time for all participants. In Step 2, singular value decomposition (SVD) was performed on this matrix to identify plasma proteins that were most highly correlated with fibre-responsive CAZymes. We focused on the first singular vector (SV1) because it explained the highest percentage of the cross-correlation variance for responses to each of the snacks. Using a histogram of protein projections along SV1, we selected those proteins located within the 10th and 90th percentiles of the distribution (α<0.1) (Extended Data Fig.8). In Step 3, proteins in the 10th and the 90th percentile group were each analysed separately using a knowledge generation algorithm [COmprehensive Multi-omics Platform for Biological InterpretatiOn (‘CompBio’]. CompBio performs an automated extraction of knowledge from all PubMed abstracts that reference entities of interest using contextual language processing and a biological language dictionary that is not restricted to fixed pathway and ontology knowledge bases. CompBio uses conditional probability analysis to compute the statistical enrichment of contextually associated biological ‘concepts’ (e.g., pathways) over those that occur by random sampling. Related concepts, built from the list of differentially represented proteins, are further clustered into higher-level ‘themes’ (e.g., biological processes). Statistical enrichment of concepts (and subsequently, themes) is determined using a Normalized Enrichment Score (NES) (Methods). The final step (Step 4) identified significant correlations between SVD projections (SV1) of proteomic themes and CAZymes responsive to a given fibre treatment.
Supplementary Table10d-f lists themes and their enrichment scores for each of the different fibre snack formulations and provides a breakdown of all proteins and concepts in each theme for each treatment. These themes encompass a broad swath of processes related to cell signalling, energy homeostasis/metabolism, cell growth/development/differentiation, immune processes, extracellular matrix/collagen/bone biology, vascular biology, coagulation and thrombosis, and neuronal function. Extended Data Fig.9 shows examples of themes that were significantly enriched for plasma proteins whose abundances significantly correlated with discriminatory CAZymes during consumption of the 4-fibre snack as well as the specificity of these thematic responses compared to the other snack prototypes.
Extended Data Fig.10 plots the correlation values between (i) the 19 CAZymes that satisfied our threshold criteria for significant change in their abundances across all participants consuming the 4-fibre snack and (ii) biological themes that were significantly enriched for proteins in the 10th and 90th percentiles. Among the nine CAZymes whose significant changes in abundance were unique to the 4-fibre snack, two had Spearman rho values |≥ 0.45| with themes; the abundance of GH43_3 across study participants was correlated with changes in themes related to glucose metabolism, calcineurin signalling, AKT signalling, heat shock proteins/chaperones and BCL-2 related apoptosis, while changes in GH13_38 were correlated with a theme related to kallikrein-kinin proteases (Supplementary Table10i). Four CAZymes exhibited significant increases in their abundances after exposure to both the pea fibre and 4-fibre snacks, including the xyloglucan-specific glucanase/xylanase GH5_4 which was significantly increased with pea, orange and barley bran fibre consumption in gnotobiotic mice. Changes in GH5_4 in participants consuming the 4-fibre or pea fibre snacks were strongly correlated with changes in proteomic themes related to immune processes (C-type lectin receptor signalling, neutrophil proteases, antigen presentation/co-stimulation), IGF/IGFBP, FGF and ErbB pathways, and angiogenesis (Extended Data Fig.10, Supplementary Table10g-i).
This analysis was also able to identify subgroups of individuals based on their CAZyme and proteomic responses to a given treatment type (Extended Data Fig.11a-c). For example, participants in the 4-fibre study can be subdivided into two groups based on changes in 23 themes, including ‘glucose metabolism’, derived from proteins in the 10th percentile. The grouping of participants based on these themes could not be attributed to differences in their consumption of the 4-fibre snack prototype as judged by mass spectrometry-based measurements of a faecal biomarker of this orange fibre-containing formulation (Supplementary Results, Extended Data Fig. 11d-f; Supplementary Table8d-f).
Finally, we expanded our analysis to include plasma proteins that did not necessarily have statistically significant correlations with treatment-associated CAZymes. Extended Data Fig.12 and Supplementary Table9d-f describe proteins whose log2-fold abundances were significantly altered (P<0.05, limma25) after treatment with the 1-, 2- and 4-fibre snacks compared to the initial unsupplemented HiSF-LoFV diet phase. For example, non-receptor tyrosine-protein kinase (TYK2), a central transducer of signals elicited by several cytokines that control diverse cellular processes, increased with the 4-fibre and pea fibre snacks and to a lesser extent with the 2-fibre formulation. Mice lacking TYK2 develop obesity26. The chemokine CXCL1 was elevated after 4-fibre snack treatment. In mice, increases in muscle and serum levels of CXCL1 attenuate diet-induced fat accumulation, with associated upregulation of genes involved in fatty acid oxidation27. Neurexophilin-1 (NXPH1), a neuronal glycoprotein that binds to α-neurexin and regulates numerous neuronal processes, was also increased after 4-fibre snack treatment; SNPs in NXPH1 have been associated with type 2 diabetes, and blood pressure, cholesterol, triglyceride and C-reactive protein levels28. The 4-fibre snack produced statistically significant reductions of fibroblast growth factor 2 (FGF2) - an adipokine whose expression is increased in mice with high-fat diet-induced obesity where it exacerbates an obesogenic adipocyte inflammatory response through activation of the NLRP3 inflammasome29. Together, our data indicate that the different snack prototypes elicit shared as well as fibre-specific responses that encompass plasma biomarkers and mediators of diverse physiologic processes.
Discussion
Correlation of discriminatory CAZymes in the gut microbiomes of participants in our controlled diet studies with discriminatory features of their plasma proteomes provided a way to operationally define responses to the different fibre snack prototypes, as well as a means for assessing the translatability of results from gnotobiotic mice to humans. Identifying treatment-discriminatory CAZymes can also provide insights about the bioactive components of fibre preparations. However, much remains to be defined (through direct biochemical tests) about the substrate specificities of CAZymes, including those identified as ‘fibre-responsive’ in the current study. Moreover, some of the CAZyme associations we identify could be due to changes in the microbiome that are not directly related to breakdown of glycans in the snacks we tested (the so-called ‘butterfly effect’30). This work needs to be extended to include analyses of the expression of various microbiome-encoded metabolic pathways, including but not limited to those involving CAZymes, and how their levels of expression correlate with plasma proteomic responses. The feature reduction achieved with our analytic pipeline yielded a set of biomarkers that could be used to design and interpret necessary follow-on randomized controlled proof-of-concept studies of lead fibre snack prototypes. A goal of these studies is to provide a rigorous scientific foundation for claims about how such products may affect different aspects of the physiology of consumers, who is most likely to benefit, and required dose. Finally, additional tests are needed of the translatability of findings from gnotobiotic mice to humans, specifically tests of causality between changes in microbiome features and host biological responses, and the mechanisms that connect changes in the microbiome to these host responses. Investments in such efforts could provide one way to accelerate identification and testing of new, more nutritious food formulations at a time when many factors are operating to create large disparities in nutritional status among members of many societies.
METHODS
GNOTOBIOTIC MOUSE STUDIES
All mouse experiments were carried out using protocols approved by the Institutional Animal Care and Use Committee (IACUC) of Washington University in St. Louis.
Diets –
The HiSF-LoFV diet was milled to powder (D90 particle size, 980 µm), and mixed with powdered fibre preparations [10% (w/w)]. Fibre content was defined for each preparation [Association of Official Agricultural Chemists (AOAC) 2009.01]. Similarly, protein, fat, total carbohydrate, ash, and water content were measured [protein AOAC 920.123; fat AOAC 933.05; ash AOAC 935.42; moisture AOAC 926.08; total carbohydrate (100 - (Protein + Fat + Ash + Moisture)]. The powdered food mixtures were vacuum-packed in sterile plastic containers and sterilized by gamma irradiation (20–50 kilograys, Steris, Mentor, OH). Sterility was confirmed by culturing the diets under aerobic and anaerobic conditions (atmosphere, 75% N2, 20% CO2, 5% H2) at 37 ºC in TYG medium.
Diet oscillation studies –
A 500 mg aliquot of a pulverized frozen faecal sample obtained from nine unrelated obese adult female members of the Missouri Adolescent Female Twin Study (MOAFTS) cohort31 listed in Supplementary Table1b was diluted in 5 mL of reduced PBS [1X PBS supplemented with 0.1% Resazurin (w/v), 0.05% L-cysteine-HCl] in an anaerobic Coy chamber (atmosphere, 75% N2, 20% CO2, 5% H2). The sample was vortexed for 2 minutes at room temperature in 5 mL of 2 mm-diameter autoclaved borosilicate glass beads in order to disrupt clumps of bacterial cells trapped within the faecal matrix. The resulting suspension was filtered through a sterile nylon mesh cell strainer (100 µm pore diameter; BD Falcon). The filtrate was then mixed with 5 mL of sterile PBS containing 0.1% Resazurin (w/v), 0.05% L-cysteine-HCl, and 30% (v/v) glycerol, transferred to a sterile glass crimped tube and stored at -80 ºC until further use. Aliquots of the stored filtrate were transported in a frozen state to the gnotobiotic mouse facility. The outer surface of the tube was sterilized by a 30-minute exposure to chlorine dioxide in the transfer sleeve attached to the gnotobiotic isolator. The tube was then introduced into the isolator.
To test the effects of different fibre preparations on uncultured human faecal microbial communities, germ-free male C57BL/6J mice were dually housed in plastic cages located in plastic flexible film gnotobiotic isolators (Class Biologically Clean Ltd., Madison, WI). The gnotobiotic facility was maintained at 23 ºC and 40% humidity under a strict 12 h light cycle (lights on at 0600 h). Cages contained autoclaved paper ‘shepherd shacks’ to facilitate their natural nesting behaviours and to provide environmental enrichment.
Germ-free animals were weaned onto and subsequently maintained on an autoclaved, low-fat, high-plant polysaccharide chow (Envigo, catalogue number 2018S) that was administered ad libitum. Four days prior to colonization, mice were switched to a diet low in saturated fats and high in fruits and vegetables (LoSF-HiFV) that was formulated based on the National Health and Nutrition Examination Survey of US dietary practices10. A 300 µL aliquot of a clarified suspension of a given faecal sample was introduced into the stomachs of 12–16-week-old male animals using an oral gavage needle. Recipients were maintained in separate gnotobiotic isolators dedicated to animals colonized with the same human donor microbial communities. Four days after gavage, mice were switched to the HiSF-LoFV diet10.
Mice in the experimental groups completed a 64-day multi-phase diet-oscillation feeding protocol. On day 4 after gavage of the human donor faecal community, animals were fed a pelleted version of the HiSF-LoFV diet for 10 days. Beginning on experimental day 14, mice were fed 20–30 g aliquots of a mixture that was made from the milled HiSF-LoFV diet supplemented with 10% (w/w) raw pea fibre (Pea fiber EF 100; J. Rettenmaier & Söhne GmbH & Co. KG) and hydrated with 10–15 mL sterile water (mixing of the sterile powdered diet and sterile water occurred within the gnotobiotic isolator). The resulting dough-like mixture was pressed into a plastic feeding dish and placed on the cage floor for feeding ad libitum. Food supply was monitored daily. A freshly hydrated aliquot of the diet was supplied every 3 days to prevent food levels from dropping below roughly one third of the original volume. The HiSF-LoFV/pea fibre mixture was administered for 10 days after which time mice were returned to the unsupplemented pelleted HiSF-LoFV diet for 10 days (‘wash out period’). On day 34, mice were switched to a diet/fibre mixture made from the milled HiSF-LoFV diet supplemented with 10% (w/w) coarse orange fibre (CitriFi 100; Fiber Star, Inc.). The HiSF-LoFV/orange fibre mixture was administered for 10 days. Mice were then returned to the unsupplemented pelleted HiSF-LoFV diet for 10 days. On experimental day 54, mice began receiving 20–30 g aliquots of the diet/fibre mixture made from the powdered HiSF-LoFV diet supplemented with 10% (w/w) raw barley bran fibre [Barley Balance - concentrated (1–3)(1–4) β-glucan; PolyCell Technologies, LLC] and hydrated with sterile water. The HiSF-LoFV/barley bran fibre mixture was administered for 10 days. All animals were euthanized by cervical dislocation without prior fasting on experimental day 64.
Bedding (Aspen Woodchips; Northeastern Products) was replaced after each 10-day diet oscillation period to prevent any leftover food or faecal matter from carrying over and being ingested during the subsequent diet phase. Fresh faecal samples were collected from each animal into sterile cryo-resistant polypropylene tubes within seconds of being produced on day 4 after initial colonization while consuming the LoSF-HiFV diet, and on days 5 and 10 of each 10-day oscillation period. Samples were placed in liquid nitrogen 45–60 minutes after they were collected. Pre-colonization faecal samples were also collected to verify the germ-free status of mice (by culture and by bacterial V4–16S rDNA amplicon sequencing).
HUMAN STUDIES
Individuals provided written informed consent before participating in these studies, which were approved by the IRB at Washington University School of Medicine in St. Louis. The first study (ClinicalTrials.gov NCT04159259) was performed between February and July 2019. The second study (ClinicalTrials.gov NCT04101344) was conducted between August and December 2019. The primary objective of these open-label, single group assignment studies was to test the effects of different fibre-supplemented snack prototypes on the configuration and expressed metabolic features of the gut microbiota of overweight and obese participants (BMI ≥ 25 kg/m2) consuming a controlled background diet containing quantities of saturated fats in the upper tertile, and quantities of fruits and vegetables in the lower tertile (HiSF-LoFV) of consumption in the NHANES database10. Both studies were conducted at the Clinical Translational Research Unit at Washington University School of Medicine in St. Louis. Since there was little precedent for controlled diet studies of this type examining the effects of single- and multi-fibre supplemented snack prototypes on gut microbiome composition and/or host physiology, a formal power calculation was not possible. However, since each subject served as his or her own control with repeated microbiome sampling, we aimed to have a minimum of 12 participants complete each of these studies.
Study 1 Design -
A total of 19 men and women who were overweight or obese (BMI ≥25.0 and ≤35.0 kg/m2), aged ≥18 and ≤60 years, were screened for potential participation in this study. Participants completed a comprehensive medical evaluation, including a medical history, physical examination, assessment of food preferences and aversions, and standard blood tests. A faecal sample was collected during the medical evaluation phase and used to determine whether Bacteroides species were present in their microbiota (B. vulgatus, B. thetaiotaomicron, B. cellulosilyticus, B. uniformis, and/or B. ovatus); those whose faecal microbiota contained less than 0.1% relative abundance of B. vulgatus (defined by V4 16S rDNA amplicon sequencing), and less than 0.1% relative abundance of at least one of the other Bacteroides were excluded from the study. Additional exclusion criteria included: (i) history of previous bariatric surgery; (ii) significant organ system dysfunction (e.g., diabetes, severe pulmonary, kidney, liver or cardiovascular disease); (iii) history of inflammatory bowel disease; (iv) pregnant or lactating; (v) use of medications known to affect the study outcome measures that could not be temporarily discontinued; (vi) use during the month prior to screening of medications known to affect the composition of the gut microbiota (e.g., antibiotics); (vii) bowel movements <3 times per week; (viii) vegans, vegetarians, and those with lactose intolerance and/or severe allergies/aversions/sensitivities to foods and ingredients included in the prescribed meal plan; and (ix) individuals who were not able to grant voluntary informed consent. Of 19 participants who were screened, four were excluded based on the Bacteroides criterion and two were excluded based on the screening assessment. Of the 13 individuals who were enrolled, 12 completed the study per protocol and one participant was excluded due to significant non-compliance (Supplementary Table5a). Side effects potentially related to the intervention were mild/moderate and included reported transient ‘abdominal bloating’ (n=3 participants), ‘GI cramps/upset stomach’ (n=3) and/or ‘diarrhoea’ (n=2).
The study design is described in Fig. 1a. Participants who met the enrollment criteria were asked to maintain their usual eating habits for 4 days with faecal samples collected at home on days 1, 2, 3 and 4. On days 5 through day 14, participants consumed only HiSF-LoFV meals (see below) provided by the study team. Faecal samples were collected at home on study days 6, 8, 10, 12 and 14 and a fasting blood sample was obtained on day 14. Starting on day 15, participants supplemented their HiSF-LoFV diet with the pea fibre-containing snack, beginning with 1 bar per day on days 15 and 16 (with lunch), 2 bars per day on days 17 and 18 (one at lunch and one at dinner) and 3 bars per day from day 19 through day 35 (with breakfast, lunch and dinner). All at-home faecal samples during the ramp up period (i.e., days 15–20) were collected and subsequently, every two days thereafter (i.e., on study days 21, 23, 25, 27, 29, 31, 33 and 35), with fasting blood collected on days 29 and 35. After completing 17 consecutive days consuming 3 snacks per day (24.3g of pea fibre), participants returned to the unsupplemented HiSF-LoFV diet for an additional 14 days, with faecal samples collected every two days (study days 37, 39, 41, 43, 45, 47 and 49) and a fasting blood sample on day 49. The primary outcome measures determined prior to and during fibre snack consumption (days 14 vs 29–35) were; (i) changes in the plasma lipid profile, (ii) changes to the gut microbiome, (iii) changes in the plasma proteome, and (iv) changes in HbA1c. Urine was collected but was not analysed.
Study 2 Design -
A total of 23 men and women who were overweight or obese (BMI ≥25.0 and ≤35.0 kg/m2) and aged ≥18 and ≤60 years were screened for eligibility using the same exclusion criteria as Study 1 with the exception that there was no prescreen for the representation of Bacteroides species in faecal samples. Among the 23 individuals who completed screening, 19 were enrolled and 14 completed the study protocol. Four participants did not complete the intervention for personal reasons; one participant was withdrawn for failure to comply (Supplementary Table5a). Potential intervention-related side effects were mild and included transient ‘abdominal bloating’ (n=1 participant), ‘GI cramping’ during dose escalation (n=1) and ‘constipation’ (n=1). The study design is described in Fig. 1b. On day 1, participants provided a faecal sample prior to entering the controlled diet phase. From day 2–11, participants consumed HiSF-LoFV meals provided by the study team in the form of packed-out meals and snacks; they collected at-home faecal samples on study days 5, 9,10 and 11. A fasting blood sample was obtained on day 11. On day 12, participants began supplementing their diet with the 2-fibre snack prototype [1 snack serving per day on day 12 (with lunch), 2 per day on day 13 (one at lunch and one at dinner) and 3 per day on days 14 through 25 (with breakfast, lunch and dinner)]. Participants collected all at home faecal samples during the ramp up period (i.e., days 12–14) and subsequently, at-home faecal samples on days 18, 23, 24 and 25. A fasting blood sample was collected on day 25 just prior to returning to the unsupplemented HiSF-LoFV diet (days 26–35). During this ‘wash-out’ phase of the study, faecal samples were collected on days 28, 33, 34 and 35 and a fasting blood sample on day 35. Consumption of the 4-fibre snack prototype began on day 36 [1 snack serving per day on day 36 (with lunch), 2 snacks per day on day 37 (one at lunch and one at dinner) and 3 snacks per day on days 38 through 49 (at breakfast, lunch and dinner)]. Participants collected all at-home faecal samples during the ramp-up period (days 36–38) and subsequently, at-home faecal samples on days 41, 47, 48 and 49. A fasting blood sample was obtained on day 49 (last day of study). The primary outcome measure was the effect of the fibre blend snacks on the gut microbiome as determined by analyses of faecal samples collected prior to supplementation (day 11) and end of each supplementation phase (day 25 and 35, respectively). The secondary outcome was the effect of the fibre blends on the blood (plasma) proteome. Urine was collected but was not analysed.
Fibre snacks -
Snack food prototypes were prepared by Mondelēz Global LLC., tested to confirm nutritional content as well as the absence of microbial contamination/pathogens, and then shipped to and stored at Washington University in St. Louis. Participants received weekly shipments of the snack food prototypes. The composition of these prototypes is described in Supplementary Table4a. Their organoleptic properties were designed based on common US consumer preferences.
Design, manufacture and distribution of HiSF-LoFV diets -
Participants consumed a diet composed of approximately 40% fat, 20% protein, and 40% carbohydrate during the dietary intervention. The HiSF-LoFV diet is high in refined grains (white bread and pasta, bagels, and corn cereals), added sugars (sugar-sweetened beverages, candies, and desserts), vegetables sourced primarily from potatoes and tomatoes, and protein and fat derived from animals. Representative diets are described in Supplementary Table4b.
Each participant’s estimated energy requirements were calculated using the Mifflin St. Jeor equation32 multiplied by an appropriate physical activity level. To ensure consistent intake of nutrients across all participants and to ensure weight stability, a registered dietitian designed a 7-day cycle menu specific to the participant’s energy needs and instructed each participant to consume only foods prescribed by the study team during the dietary intervention. All food was provided in the form of packed-out meals and snacks prepared by the metabolic kitchen in the Clinical Translational Research Unit (CTRU) at Washington University School of Medicine.
Collection of clinical meta-data -
Participants were provided with electronic smart scales (BodyTrace, Inc.) to enable weight monitoring between study visits. At enrollment, habitual dietary patterns were assessed using the National Cancer Institute Diet History Questionnaire III (DHQIII) food frequency questionnaire33. Participants visited the CTRU on a weekly basis to pick up packed-out meals (using insulated bags and rolling coolers), have their body weight measured, and any changes to their health and medications reviewed. During the study, participants recorded all food and beverage intake using a web-based food diary during all diet phases. An experienced study dietitian instructed study participants on how to complete the food records and reviewed these records with the participants at each study visit to ensure the accuracy of self-reported data. In addition, a member of the study team contacted participants regularly to (i) check on study progress, (ii) discuss prescribed and non-prescribed foods and beverages consumed, (iii) discuss weight changes and (iv) ensure participants had sufficient faecal collection kits.
Preparation of blood samples -
Fasting blood samples were obtained in the CTRU. Conventional blood chemistry tests were performed by the Clinical Laboratory Improvement Amendments (CLIA)-certified Core Laboratory for Clinical Studies (CLCS) at Washington University School of Medicine. To prepare plasma for SOMAscan proteomics analysis (SomaLogic, Boulder, CO), blood samples (10–20 mL) were aliquoted into EDTA-K2 treated tubes and centrifuged at 2,000 x g for 10 minutes at 4 ºC. Following centrifugation, plasma was immediately transferred into cryo-resistant polypropylene tubes (0.5 mL aliquots) and stored at -80 ºC prior to analysis according to manufacturer’s recommendations.
Statistical analysis of clinical study outcomes
The effects of supplementation with each of the snack fibre prototypes on BMI and clinical chemistry parameters, including lipids and HbA1c, were assessed using a linear mixed effects model that included a random-effect coefficient to control for differences in characteristics between individuals (Supplementary Table5c). Supplementation-associated, statistically significant differences (P≤0.05) for each analyte were determined using ANOVA, with FDR correction (least-squares means of linear mixed-effects model). Analyses of fibre supplementation-associated changes in the microbiome and the plasma proteome using higher-order singular value decomposition (HOSVD), cross-correlation singular value decomposition (CC-SVD) and linear models are described in detail below.
Faecal sample collection, processing and culture-independent analyses
Sample collection and processing -
Participants collected faecal samples using small medically approved collection containers. Containers were labelled with a unique study identifier and the collection date and time. Participants were provided with a dedicated -20 ºC freezer at the beginning of the study for temporary storage of faecal samples. Each sample was frozen immediately after collection. Every few days, frozen specimens were shipped with frozen gel packs, using prepaid express shipping boxes provided by the study team, to a biospecimen repository at Washington University in St. Louis where they were stored at -80 ºC until the time of processing.
Faecal samples were homogenized with a porcelain mortar (4 L) and pestle while submerged in liquid nitrogen and aliquots of each pulverized frozen sample were stored at -80 ºC. DNA was extracted from each pulverized human faecal sample (~50–100 mg) [or mouse faecal pellets (~20–50 mg)] by first bead-beating (BioSpec Mini-beadbeater-96) for 4 minutes in 500 µL buffer A (200 mM NaCl, 200 mM Trizma base, 20 mM EDTA), 210 µL of 20% SDS, and 500 µL phenol:chloroform:isoamyl alcohol (25:24:1), plus 250 µL of 0.1 mm-diameter zirconium oxide beads and a 3.97 mm-diameter steel ball. Following centrifugation at 3,220 x g for 4 minutes, DNA was purified (QiaQuick 96 purification kit; Qiagen, Valencia, CA), eluted in 130 µL of 10 mM Tris-HCl pH 8.5 (buffer EB, Qiagen), and quantified (Quant-iT dsDNA broad range kit; Invitrogen). Purified DNA was stored at -20 ºC prior to further processing.
16S rDNA amplicon sequencing and identification of ASVs -
Purified DNA samples were adjusted to a concentration of 1 ng/µL and subjected to PCR using barcoded primers directed against variable region 4 of the bacterial 16S rRNA gene34. PCR amplification was performed using the following cycling conditions: denaturation (94 ºC for 2 minutes), 26 cycles of 94 ºC for 15 seconds, 50 ºC for 30 seconds and 68 ºC for 30 seconds, and then incubation at 68 ºC for 2 minutes. Amplicons with sample-specific barcodes were quantified, pooled and sequenced (Illumina MiSeq instrument, paired-end 250 nt reads).
Paired-end reads were demultiplexed, trimmed to 200 nucleotides, merged, and chimeras removed using the 1.13.0 version of the DADA2 pipeline35 in R (v. 3.6.0)36. Amplicon sequence variants (ASV) generated from DADA2 were aligned against the GreenGenes 2016 (v. 13.8) reference database to 97% sequence identity, followed by taxonomic and species assignment with Ribosomal Database Project (RDP) (release 11.5) and SILVA (v. 128). The resulting ASV table was filtered to include only ASVs with ≥0.1% relative abundance in at least five samples and rarefied to 15,000 reads/sample.
Supplementary Table1e also shows results obtained with another approach to taxonomic assignment. In this procedure, each representative sequence was aligned (NCBI BLAST toolkit version 2.10.0) to a 16S rRNA gene reference database compiled by joining unique sequences from RDP version 11.5 and the NCBI 16S ribosomal RNA Project. Alignment results were sorted based on their percentage of sequence identity, with maximum values denoted as M. Hits were selected with identities in the range [M] to [M‒ (1‒M)/S] where S is a scaling parameter that controls the maximum number of taxonomic descriptors accepted for a ‘multi-taxonomic assignment’ (MTA) based on 16S rDNA sequence identity (in this study, set to 4)37.
Shotgun sequencing and annotation of microbiomes -
Purified DNA samples were adjusted to a concentration of 0.75 ng/µL. Sequencing libraries were generated from each DNA sample using the Nextera DNA Library Prep Kit (Illumina) with the reaction volume scaled down 10-fold to 2.5 µL38. Samples were pooled and sequenced using an Illumina NextSeq 550 instrument in the case of all mouse samples [10.7 ± 0.6 x 10⁶ paired-end 150 nucleotide-long reads/sample (mean ± s.d.)] and all human samples in study 2 (12.8 ± 1.2 x 10⁶ paired-end 150 nucleotide-long reads/ sample), while an Illumina NovaSeq 6000 instrument was used to sequence human samples collected in study 1 (28.0 ± 4.2 x 10⁶ paired-end 150 nucleotide-long reads/sample).
After sequencing, reads were demultiplexed (bcl2fastq, Illumina), adapter sequences were trimmed using cutadapt39 and reads were quality filtered with Sickle40. Human and mouse DNA sequences were identified and removed using Bowtie241 and either the H. sapiens genome (hg19 build) or the Mus musculus C57BL/6J strain genome (UCSC mm10), depending on sample origin, prior to further processing. Microbial reads were assembled using IDBA-UD42 (gnotobiotic mice) or MEGAHIT43 (samples from human studies) and annotated with prokka44. Counts for each open reading frame (ORF) were generated by mapping quality-controlled, paired-end reads generated from each sample to the corresponding assembled sample contigs. Duplicate reads (optical- and PCR-generated) were identified and removed from mapped data using the Picard MarkDuplicates tool (v 2.9.3). Alignments were processed to generate count data (featureCounts; Subread v. 1.5.3 package)45 for each ORF in each sample and normalized (transcripts per kilobase million reads, TPM) in R (v. 3.6.0).
Functional profiles for each faecal microbiome were generated by assigning microbiome-encoded proteins to 81 microbial community SEED13 (mcSEED) metabolic pathways/modules that capture core metabolism of nutrients/metabolites in four major categories (amino acids, sugars, fermentation products and vitamins) projected over ~2,600 reference bacterial genomes. To do so, translated protein sequences from each faecal DNA sample assembly were queried against representative protein sequences from the mcSEED subsystems/pathway modules using DIAMOND46 (threshold ≥80% identity). In the case of multiple high percent identity alignments, proteins were assigned the annotation of the best hit found in mcSEED.
CAZyme annotations were performed for the full set of ORFs identified in each faecal sample. Amino acid sequences were analysed using a custom script whose purpose is to accommodate the modular structure of CAZymes (which often carry a variable number of ancillary modules in addition to their catalytic domain). The script first compares each sequence to the full-length sequences stored in the CAZy database (download date April 21, 2020) using BlastP (version 2.3.0+)47. Query sequences with 100% coverage, >50% amino acid sequence identity and E-value ≤10-6 with a sequence already in the CAZy database are assigned to the same family/subfamily (or the same families if the found sequence contains more than one CAZy module). All remaining sequences are subject to a follow-on second similarity search that involves two parallel steps: (i) a BlastP comparison of the sequence of interest against a library composed of the individual (isolated) modules [i.e., where the individual modules (catalytic or ancillary) have been ‘isolated’ as opposed to full-length sequences in the CAZy database that can contain several modules); and (ii) a HMMER348 search against a curated collection of Hidden Markov Models (HMMs) based on each of the CAZy module families (and subfamilies where they have been defined, e.g. for GH5, GH13, GH16, GH30 and GH43). The script then assigns the sequences to the corresponding family/families (and subfamily/subfamilies) that satisfy the following two conditions: (i) a BlastP E-value <10-4 and (ii) a hmmhitstart ≤0.05 or hmmhitend ≥ 0.95 (note that the HMM search helps resolve problems of overlap between modules that are sometimes observed when using only BlastP). For this second similarity search strategy, CAZyme assignments are made only when the two methods indicate the same subject in the CAZy database with >90% alignment overlap and an E-value <10-4 for all CAZyme families [except for lytic polysaccharide monooxygenases (LPMOs; threshold 10-25)]. Carbohydrate esterases and auxiliary activities (aside from LPMOs) were not analysed. The above thresholds were designed to eliminate, as much as possible, assignment of query sequences to oxidoreductases or esterases not specific for carbohydrates and to produce annotation results more consistent with the manual procedure used, and add and update proteins contained in the CAZy database.
To generate CAZyme gene family/subfamily abundance tables amenable to downstream statistical analyses, per-sample abundance data was aggregated using a custom script in R. Genes encoding all non-CAZyme ORFs were removed. The abundances of genes annotated with multiple CAZyme families/ subfamilies was propagated to each individual family/subfamily member, then abundances were summed across all corresponding CAZyme families within each faecal sample.
Higher-order singular value decomposition (HOSVD)
HOSVD is used when an input matrix has more than two degrees of freedom. Mathematically, these types of matrices are called ‘tensors.’ Unlike Singular Value Decomposition (SVD), HOSVD is not a technique with an analytical solution, i.e., a tensor of rank N cannot be written as a product of N+1 tensors as in the case with SVD. As a consequence, several methods of approximation exist to deconstruct higher-order tensors for feature-reduction purposes. ‘Canonical Polyadic (CP) decomposition’ (CP decomposition), deconstructs a tensor into a sum of rank-1 tensors (arrays) related to each other through a ‘core tensor’. Extended Data Fig.2b shows the result of CP decomposition on a three-dimensional tensor O. The core tensor, G, is a three-dimensional tensor comprised of only diagonal elements, each of which specifies the amount of variance carried by a ‘tensor component’ analogous to the singular values computed by SVD. Each tensor component (TC) relates the rows, columns, and third-dimensional entries of O. The number of tensor components is determined by creating a tensor that is randomized with respect to the rows, columns, and third dimension entries and performing CP decomposition over 100 trials. The randomization process scrambles the correlations between each dimension of the tensor; therefore, the resulting CP decomposition reflects a random distribution of tensor component values. We used the alternating Least Squares Algorithm for the CP decomposition (CP-ALS) to iteratively improve the matrix factorization. The lowest tensor component whose variance was above that of tensor component 1 of the scrambled tensor defined the number of tensor components we considered. HOSVD was performed using MATLAB (version 2019b).
Aptamer-based characterization of the plasma proteome
Levels of proteins were quantified in a 50 µL aliquot of plasma using the SOMAscan 1.3K Proteomic Assay plasma/serum kit (SomaLogic, Boulder, CO). Procedures used for quality control filtering and analysis of differential protein abundances have been described previously49. Briefly, microarrays were scanned with an Agilent SureScan instrument at 5 µm resolution and the Cy3 fluorescence readout was quantified. Raw fluorescence signal values from each SOMAmer were processed using standardization procedures recommended by the manufacturer (i.e., datasets were normalized to remove hybridization variation within a run followed by median normalization across all samples to remove other assay biases). The final .adat file was log2-transformed, quantile-normalized and then filtered to remove non-human SOMAmers.
Cross-correlation singular value decomposition analysis (CC-SVD) and COmprehensive Multi-omics Platform for Biological InterpretatiOn (CompBio)
CC-SVD begins by computing the cross-correlation matrix between two feature types (microbial CAZymes and host plasma proteins). Given two matrices of dimensions Nm x n (with elements Ni,j) and Pm x p (with elements Pk,l) where m is the number of samples and n and p are the number of features of each feature type, a cross-correlation matrix is calculated by taking each feature in the m x n matrix N and correlating them with each feature in the m x p matrix P (Step 1 of Extended Data Fig.8). The resulting matrix is a n x p cross-correlation matrix Cn x p, where each element Aj,l contains the correlation between feature N1:m,j from the first matrix and feature P1:m,l from the second matrix (note that these starting matrices contain abundance information whereas the resulting cross-correlation matrix contains correlations between features). Next, SVD is used to decompose the cross-correlation matrix A into left and right singular matrices which contain left (U) and right (V) singular vectors (SVs), respectively; the left SVs correspond to the features of N and the right SVs correspond to the features of P (Step 2 of Extended Data Fig.8). An SV represents a module of cross-correlated features with a unique correlation profile, and the projections of each feature onto an SV represents the module membership of that feature (e.g., how similar a feature’s correlation profile is to the overall module’s correlation profile). To define a module, a user-defined threshold truncates the leading and trailing tails of the distribution of projections along an SV, and the features above and below the truncation are considered module members; in this case, modules were defined as those proteins with projections along the tails (10th and 90th percentile) of the distribution (α<0.1) of the right SV1. Note that SVD determines a projection for all features along each SV, providing a continuous measure of module membership. The number of SVs that should be considered is determined using a random-matrix approximation described elsewhere50. The continuous nature of projection values enabled us to rank-order proteins by their projections along SV1.
A literature analysis was then performed using CompBio V2.0 (available from PercayAI Inc., St. Louis, MO; https://www.percayai.com); our goal was to identify relevant processes and pathways represented by modules of plasma proteins derived from CC-SVD analysis (10th and 90th percentile of projections along SV1) that were highly correlated with CAZyme genes which were significantly increased by fibre snack consumption (Step 3 of Extended Data Fig.8). As described elsewhere51,52,53,54, CompBio uses an automated extraction of knowledge from all PubMed abstracts that reference entities of interest (Entrez Gene Symbol of input plasma proteins or their synonyms), using contextual language processing and a biological language dictionary that is not restricted to fixed pathway and ontology knowledge bases. Conditional probability analysis was utilized to compute the statistical enrichment of contextually associated biological concepts (e.g., pathways) over those that occur by random sampling. These related concepts, built from the list of highly correlated entities that were used as input, were further clustered into higher-level themes (e.g., biological processes, cell types and structures, etc.).
Within CompBio, scoring of a given input entity, concept, and overall theme enrichment was accomplished using a multi-component function referred to as the Normalized Enrichment Score (NES) commonly used in Gene Set Enrichment Analysis (GSEA)55. For our analysis, NES utilized an empirical p-value derived from several thousand random lists proteins, each containing a similar number of proteins to those in the 10th and 90th percentile groups. NES for concepts was first calculated and the values were then used to compute an NES score for their associated themes:
A two-step approach was used for annotation of themes within CompBio. For each theme, the most enriched concepts were first mapped to pathways and processes in common knowledge bases such as Gene Ontology (GO), KEGG and Reactome Pathways. Second, since CompBio is not restricted to these knowledge bases in its biological discovery process, themes were further annotated by subject area experts, which together with the initial mapping to existing knowledge bases, resulted in a summary description of the biology described by assimilation of the most enriched concepts in each theme.
We performed an SVD analysis on the log2 fold-change of plasma protein profiles enriched in each biological theme (for each treatment and all participants). Proteins belonging to a theme were selected, and SVD was performed on the m x p protein abundance matrix where m is the number of samples and p is the number of proteins in the biological theme. SV1 projections for each biological theme were cross-correlated with CAZymes whose abundances were significantly increased by the given treatment (Step 4 of Extended Data Fig.8). The resulting cross-correlation matrix, which contains Spearman Rho values as elements, was plotted as a heatmap using the ggplot package (v. 3.3.2)56 in R (v. 3.6.0).
Linear model analysis of SOMAscan data generated from human plasma samples
Differentially expressed plasma proteins that passed quality control criteria (1205 for human study 1 and 1170 for human study 2) were identified using limma (v.3.42.2)25 in R (v.3.6.0). Plasma protein datasets generated from each snack food intervention were analysed separately. Briefly, samples collected on day 14 (pre-intervention phase) and day 29 (after two weeks of consuming the pea fibre snack) from participants in study 1, and samples collected on day 11 (pre-intervention phase) and day 25 (2 weeks of consumption of the 2-fibre snack), and on day 11 (pre-intervention phase) and day 49 (two weeks of consumption of the 4-fibre snack) from participants in study 2 were analysed using a linear least-squares model [design = model.matrix(~ 0 + Timepoint + Participant ID)]. Plasma proteins were selected if their differences in abundance between the two time points were statistically significant (P<0.05) for a given fibre snack treatment.
Mass spectrometry-based carbohydrate analysis of fibre preparations, diets and faecal samples
Monosaccharide and linkage analysis of fibre preparations –
Methods described in ref. 11 were used to define the carbohydrate composition of the pea, orange and barley bran fibre preparations. Following a pre-hydrolysis step [incubation in concentrated sulfuric acid (72%) for 30 minutes at 30 °C to release glucose from cellulose], the fibres were hydrolysed by treatment with 1 M sulfuric acid for 6 hours at 100 °C. Individual neutral sugars were analysed by gas chromatography as their alditol acetate derivatives57,58. The meta-hydroxydiphenyl colorimetric acid method was used to measure uronic acid (as galacturonic acid)59,60; sodium tetraborate was used to differentiate glucuronic acid from galacturonic acid61. Methylation of galacturonic acid (in pectin) was estimated according to ref. 62.
Linkage analysis of fibres followed procedures detailed in ref. 63 with minor modifications that allowed for discrimination of galactose, galacturonic acid, and methyl-esterified galacturonic acid. Briefly, reduction of carboxymethyl ester groups of uronic acids was performed with NaBD4 and imidazole-HCl, followed by activation of carboxylic acid groups with carbodiimide and a second reduction with imidazole-HCl, NaBH4 (D/H) and NaBD4 (D/D). Samples were dialyzed, freeze-dried and then solubilized in DMSO before methylation of the accessible hydroxyl groups of reduced polysaccharides using iodomethane. Acid hydrolysis with trifluoroacetic acid and a subsequent reduction of partially methylated sugars with NaBD4 was performed. Lastly, samples were acetylated, extracted as partially methylated alditol acetates (PMAA) into dichloromethane, and analysed by gas chromatography-mass spectrometry (GC-MS)64.
Monosaccharide and linkage analysis of mouse diets and faecal biospecimens -
For homogenization of HiSF-LoFV diet with and without fibre supplementation, a 10 mg/mL stock solution was prepared from frozen starting material. Pre-weighed mouse and human faecal samples were diluted 10-fold in Nanopure water (Thermo Fisher) and homogenized overnight. Samples were then centrifuged; the remaining material was lyophilised to complete dryness and diluted to create a stock solution (10 mg/mL in water). Stock solutions were bullet-blended using 1.4 mm stainless steel beads followed by incubation at 100°C for 1 h. Lastly, samples were subjected to another round of bullet blending and aliquots were taken for monosaccharide and linkage analysis.
Methods for monosaccharide analysis of diets and faecal samples were adapted from ref. 65. Briefly, three 10 µL aliquots were taken from each bullet-blended ‘stock’, transferred to a 96-well plate and subjected to acid hydrolysis (4 M trifluoroacetic acid for 1 h at 121°C). The reaction was quenched with 855 µL of ice-cold Nanopure water. Hydrolysed samples were derivatized with 1-phenyl-3-methyl-5-pyrazolone (PMP) according to conditions described in ref. 66. Samples and 14 monosaccharide standards (0.001–100 µg/mL) were reacted in 0.2 M PMP (prepared in methanol) and 28% NH4OH at 70 °C for 30 minutes. Derivatized glycosides were then dried to completion (vacuum centrifuge) and reconstituted in Nanopure water. Excess PMP was removed (chloroform extraction) and a 1µL aliquot of the aqueous layer was injected into an Agilent 1290 infinity II ultrahigh-performance liquid chromatography (UHPLC) system coupled to an Agilent 6495A triple quadrupole mass spectrometer under dynamic multiple reaction monitoring (dMRM) mode. Monosaccharides were quantified using calibration curves generated with external standards.
The procedure for linkage analysis was adapted from previously described protocols. In short, three replicate 5 µL aliquots of each bullet-blended stock solution were incubated in saturated NaOH and iodomethane (in DMSO) to achieve methylation of free hydroxyl groups. Excess NaOH and DMSO were removed by extraction with dichloromethane and water. Permethylated samples were subsequently hydrolysed and derivatized (using the same procedure employed for monosaccharide analysis). Derivatized samples were subjected for UHPLC-dMRM-mass spectrometry. Glycosidic linkages present in samples were identified using a pool of oligosaccharide standards and a comprehensive linkage library described elsewhere67,68.
A cross-correlation matrix was computed between the log2 fold-change of statistically significant pea fibre-responsive CAZymes and faecal monosaccharides and glycosidic linkages in participants on days 29 and 35 (during consumption of pea fibre snacks) and days 45 and 49 (post-intervention phase) normalized to day 14 (pre-intervention phase). A cross-correlation matrix generated from this analysis with Spearman’s Rho values as elements is plotted as a heatmap in Extended Data Fig.7.
Liquid Chromatography Quadrupole Time-of-Flight Mass spectrometry (LC-QTOF-MS) identification of a faecal biomarker of orange fibre consumption –
Methods for preparing samples and performing LC-QTOF-MS using an Agilent 1290 LC system coupled to an Agilent 6545 Q-TOF mass spectrometer are detailed in an earlier publication69. Five μL of each prepared faecal sample for positive ESI ionization were injected into a BEH C18 column (2.1 × 150 mm, 1.7 μm, Waters Corp.) that was heated to 35 °C. The mobile phase was 0.1% formic acid in water (A) and 0.1% formic acid in acetonitrile (B). The following gradient was applied at a flow rate of 0.3 mL/minute over 14 minutes; 95% A/5% B to 100% B, followed by 3 minutes at 100% B. Analysis of faecal samples revealed a biomarker (m/z 274.1442) of orange fibre consumption.
Blinding, randomisation and power calculations
Before colonization with human faecal microbial communities, germ-free mice were randomised with respect to litter of origin but were matched by starting weight across treatment groups. The diet oscillation protocol allowed us to use each mouse as its own control. All data were generated from mouse biospecimens without knowledge of their treatment group of origin. The number of animals studied per treatment group was based on our previous knowledge of the reproducibility of colonization of recipient germ-free mice with a given human donor microbiome and ref. 11 which characterized the effect size of the selected fibers on a defined consortium of cultured human gut bacterial strains, including members of Bacteroides. Human studies were single group, open label studies and were therefore not blinded or randomised. Primary generation of data from human biospecimens was performed by individuals who were not involved in study design or interpretation of the results, without knowledge of the stage in the study from which the biospecimens were collected.
Extended Data
Extended Data Fig. 1: Monosaccharide content and glycosidic linkages present in the fibre preparations, and in the unsupplemented and fibre-supplemented HiSF-LoFV diets fed to gnotobiotic mice.
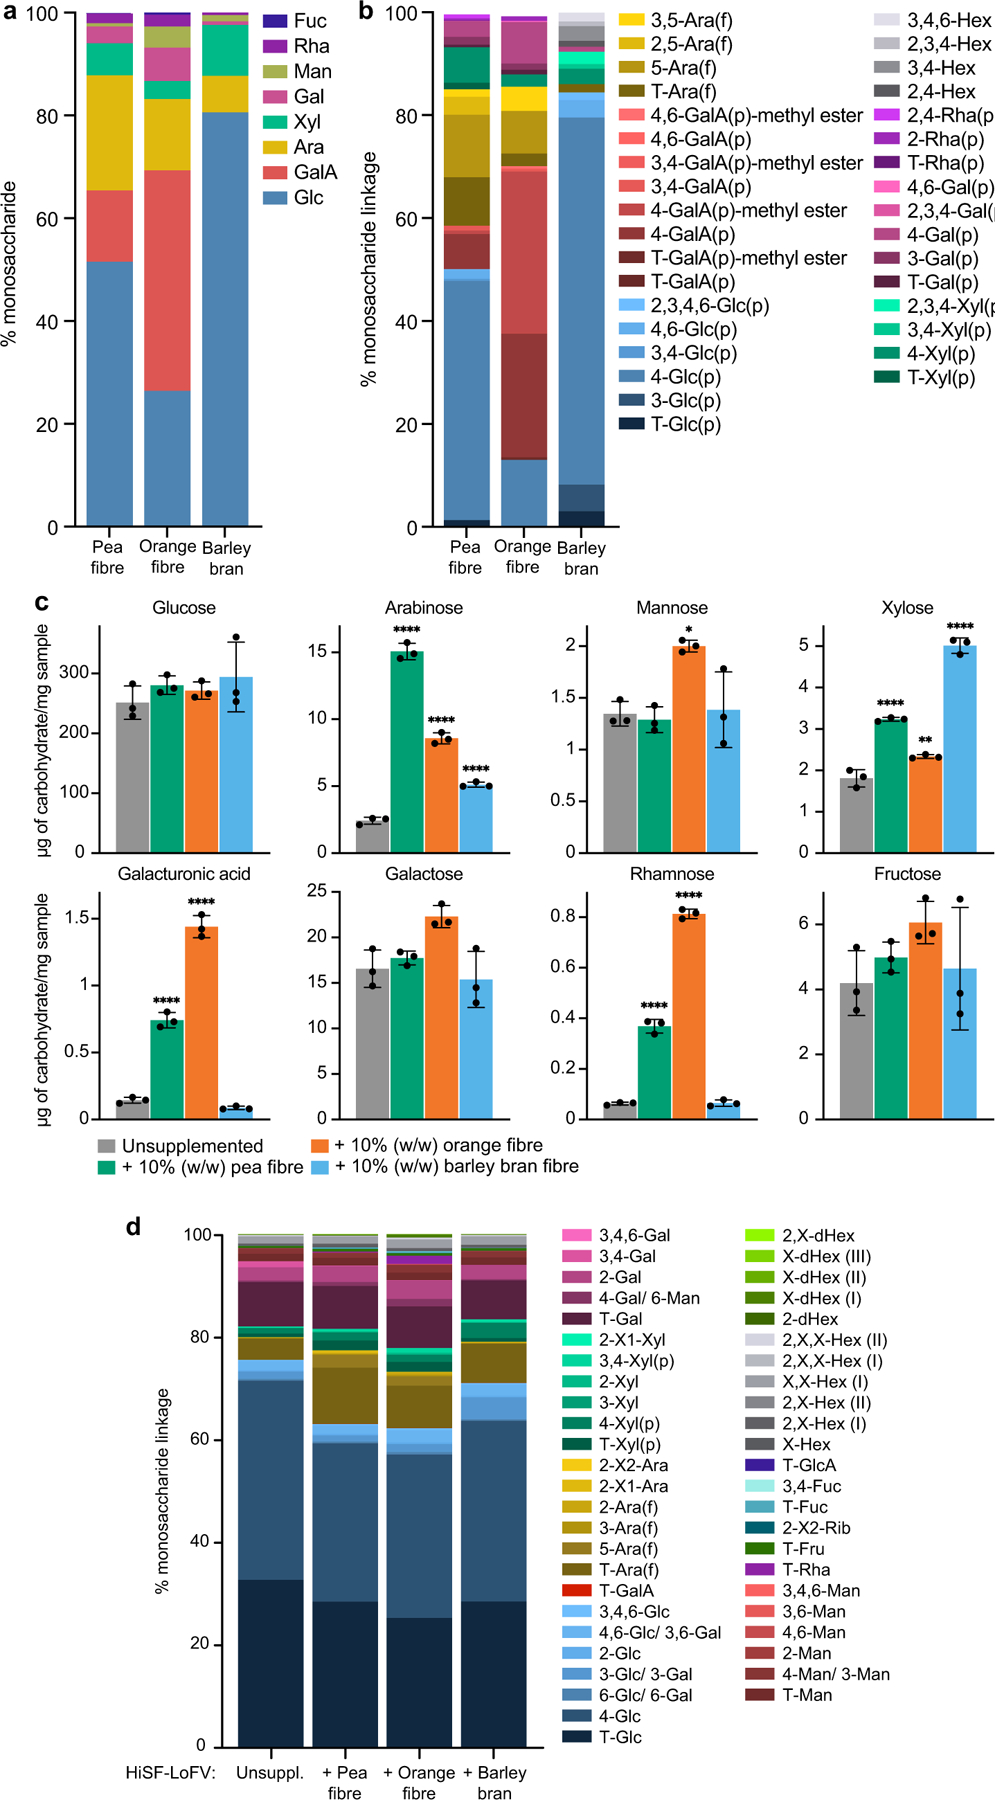
a,b, Monosaccharides and linkages, some represented by their methylated monosaccharide derivatives, in the fibre preparations. Stacked bars represent the mean for technical replicates (n=3) for each glycosyl linkage determination. c, Monosaccharides in the unsupplemented and fibre-supplemented HiSF-LoFV diets. Bars represent the mean ± s.d. for technical replicates (n=3). *P<0.01, ***, P<0.001 (one-way ANOVA with Holm-Šídák multiple comparison correction). d, Linkages, represented by their methylated monosaccharide derivatives in the unsupplemented and fibre-supplemented HiSF-LoFV diets. Stacked bars represent the mean for technical replicates (n=3) for each glycosidic linkage determination. Abbreviations. Glc, glucose; Gal, galactose; GalA, galacturonic acid; GlcA, glucuronic acid; Ara, arabinose; Xyl, xylose; Man, mannose; Fru, fructose; Fuc, fucose; Rha, rhamnose; Rib, ribose; Hex, hexose; dHex, deoxyhexose; T, terminal; f, furanose; p, pyranose; X, undefined linkage.
Extended Data Fig. 2: The effects of dietary fibres in gnotobiotic mice colonized with nine different obese human donor microbiota and fed a HiSF-LoFV diet.
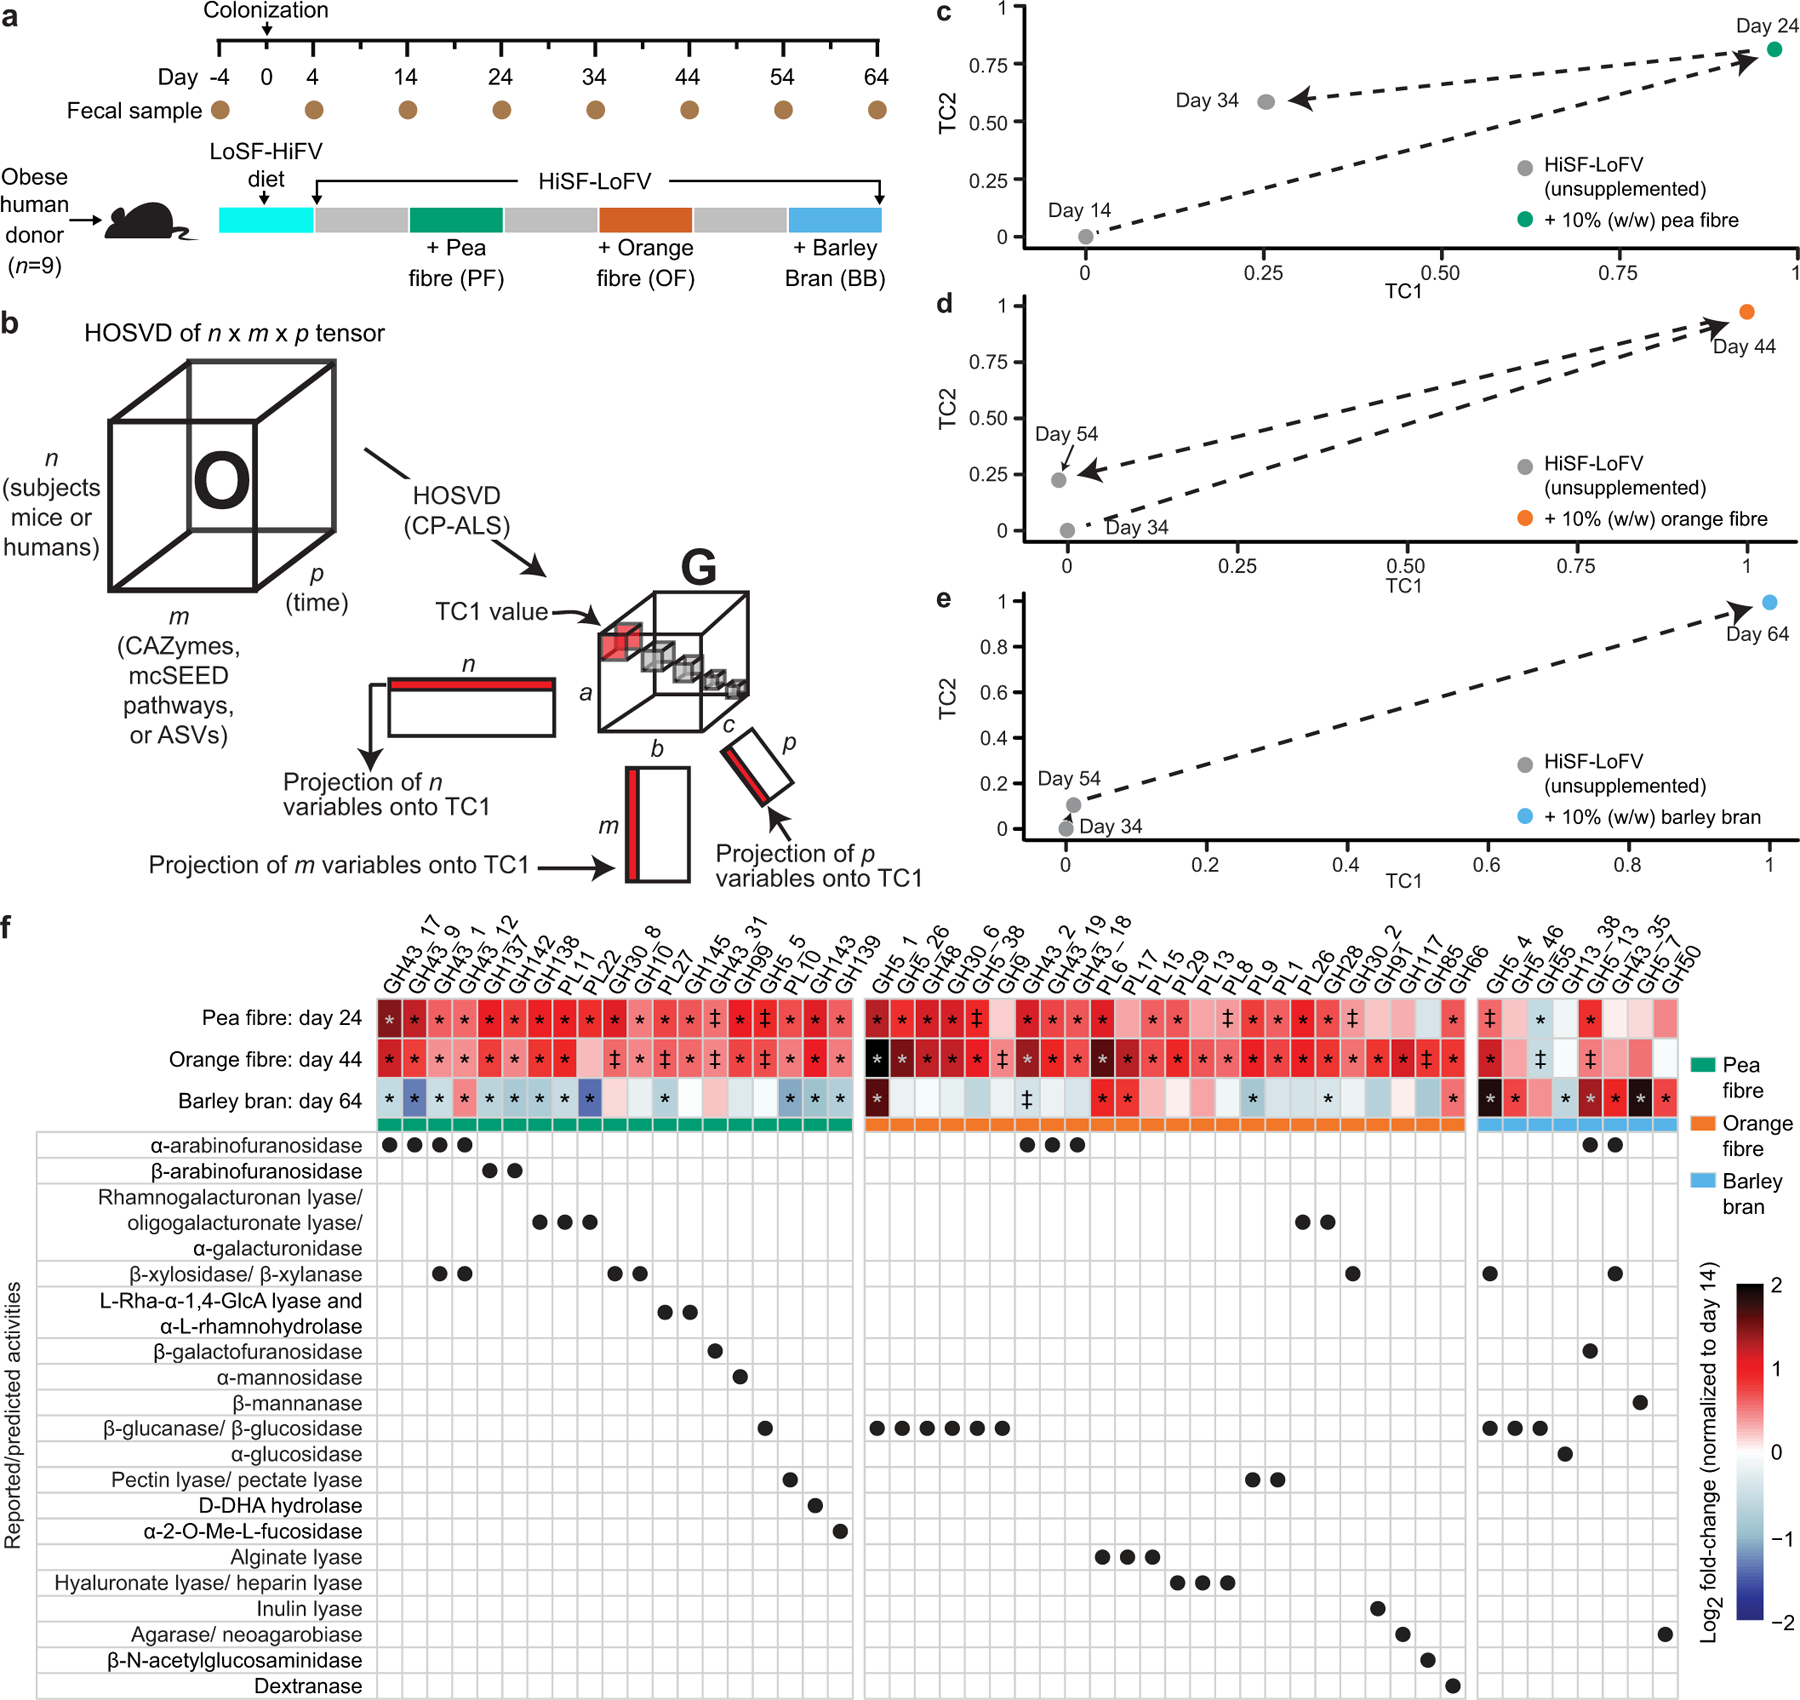
a, Experimental design. b, Higher-Order Singular Value Decomposition (HOSVD). Three-dimensional matrices are termed ‘tensors’. A tensor O with dimensions n, m, and p, where n represent subjects (mice or humans), m represents features (ASVs, CAZymes, mcSEED pathways), and p represents time, can be analysed by HOSVD where a ‘core tensor’ (G) is created—a tensor where the only non-zero values are along the diagonal (boxes shown in G). Each box represents a ‘tensor component’ (TC). Each TC relates the variation between each axis of the O tensor. Additionally, three new matrices are created that are related to each other through each TC; e.g., ‘Projection of variables onto TC1’ indicates that variation defined by TC1 is defined by variation across the first row of n, the first column of m, and the first column of p. c-e, HOSVD applied to CAZymes in faecal microbiomes of mice colonized with nine different obese human donor microbial communities (n=348 faecal samples analysed) during each of the three dietary fibre interventions in the diet oscillation experiment. f, Heatmap of discriminatory CAZymes whose log2 fold-changes in abundances were defined as statistically significant during at least one dietary intervention. The grand mean of the data is shown for animals containing the nine different human donor microbiomes sampled at the indicated time points and normalized to day 14 values (n=6–10 mice/group; n=232 faecal samples analysed). The order of CAZymes from left to right is based on their function (rows below) and magnitude of their change within and across fibre treatments. ‡, q-value < 0.10; *, q-value < 0.05 (linear-mixed effects model, FDR-corrected).
Extended Data Fig.3: Responses of CAZymes and mcSEED metabolic pathways identified by HOSVD analysis as discriminatory for fibre snack consumption in gnotobiotic mice colonized with the nine different human donor faecal communities.
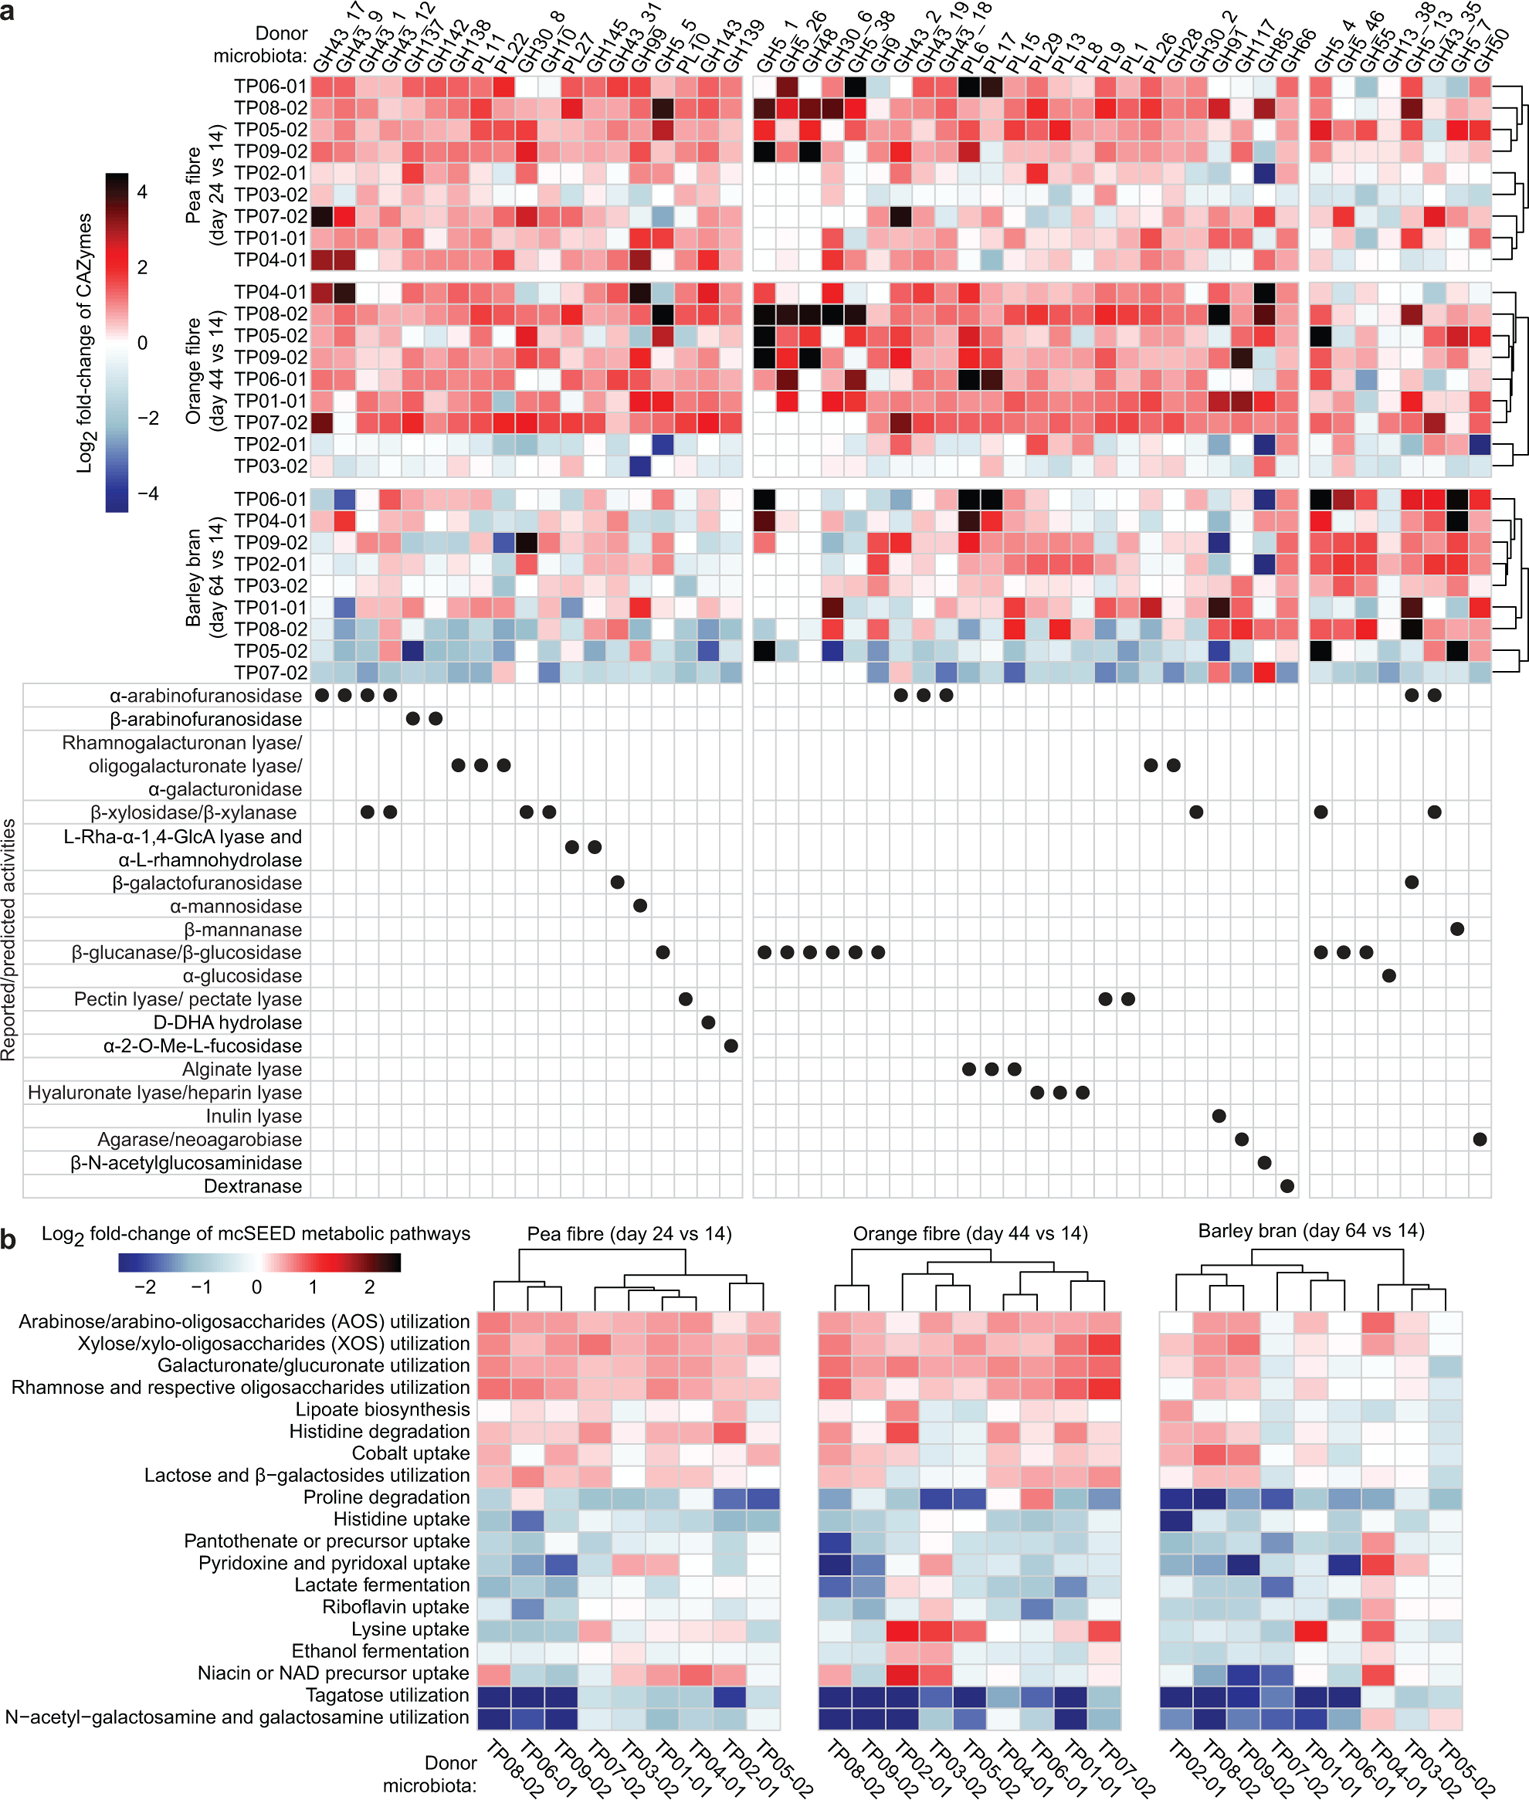
a,b, Heatmap of discriminatory CAZymes and mcSEED metabolic pathways whose changes in abundance were statistically significant during at least one dietary intervention. Data are averaged for animals containing a given human donor microbiota (n=6 to 10 mice/group; n=232 faecal samples analysed) sampled at the indicated time points and normalized to day 14 values. Note that the order of CAZymes from left to right of the heatmap in panel a follows the same order as in Extended Data Fig. 2f, while the order of mcSEED pathways from top to bottom in panel b follows the same order as shown in Fig. 1d. Hierarchical clustering (Euclidean distances) of CAZyme and mcSEED metabolic pathway profiles was used to group donor microbiomes.
Extended Data Fig. 4: HOSVD applied to mcSEED metabolic pathway and ASV datasets generated from the faecal microbial communities of mice harboring obese human donor microbial communities during the pea, orange and barley bran fibre phases of the diet oscillation.
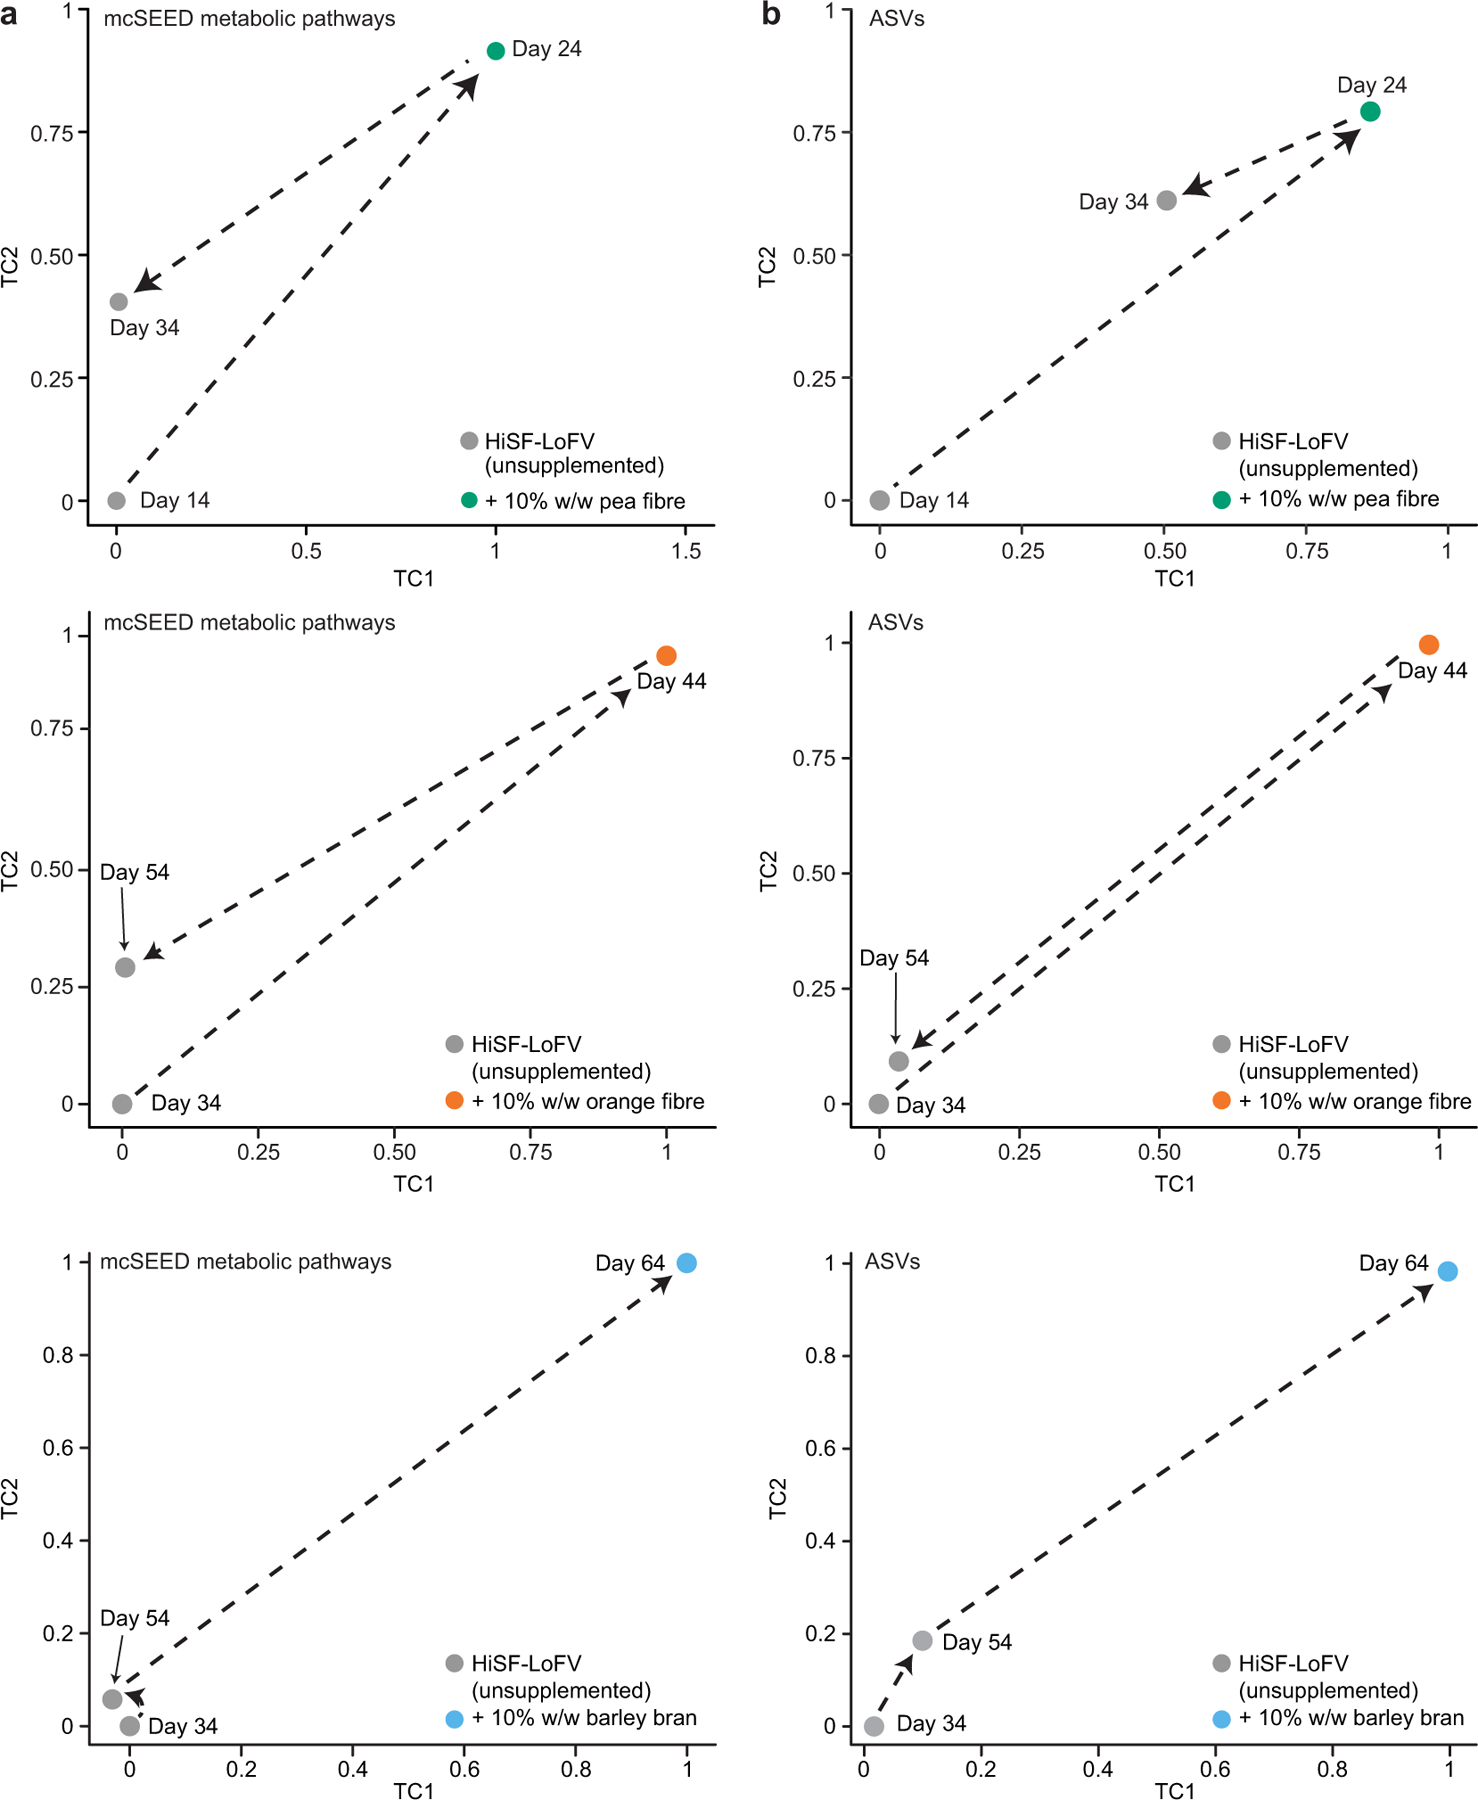
a, Microbiome configurations as defined by the representation of mcSEED metabolic pathways on TC1 and TC2 during pea fibre, orange fibre, and barley bran phase of diet oscillation. b, Projections of microbiota configuration as defined by representation of bacterial taxa (ASVs) on TC1 and TC2 during pea fibre, orange fibre and barley bran phases of the diet oscillation protocol. (n=9 human microbiomes; n=6–10 mouse recipients of each human microbiome; n=228 faecal samples analysed for data presented in panels a,b).
Extended Data Fig.5: Responses of bacterial taxa (ASVs) identified by HOSVD as discriminatory for dietary fibre consumption in gnotobiotic mice colonized with human donor microbiota, and in human participants enrolled in the controlled diet studies.
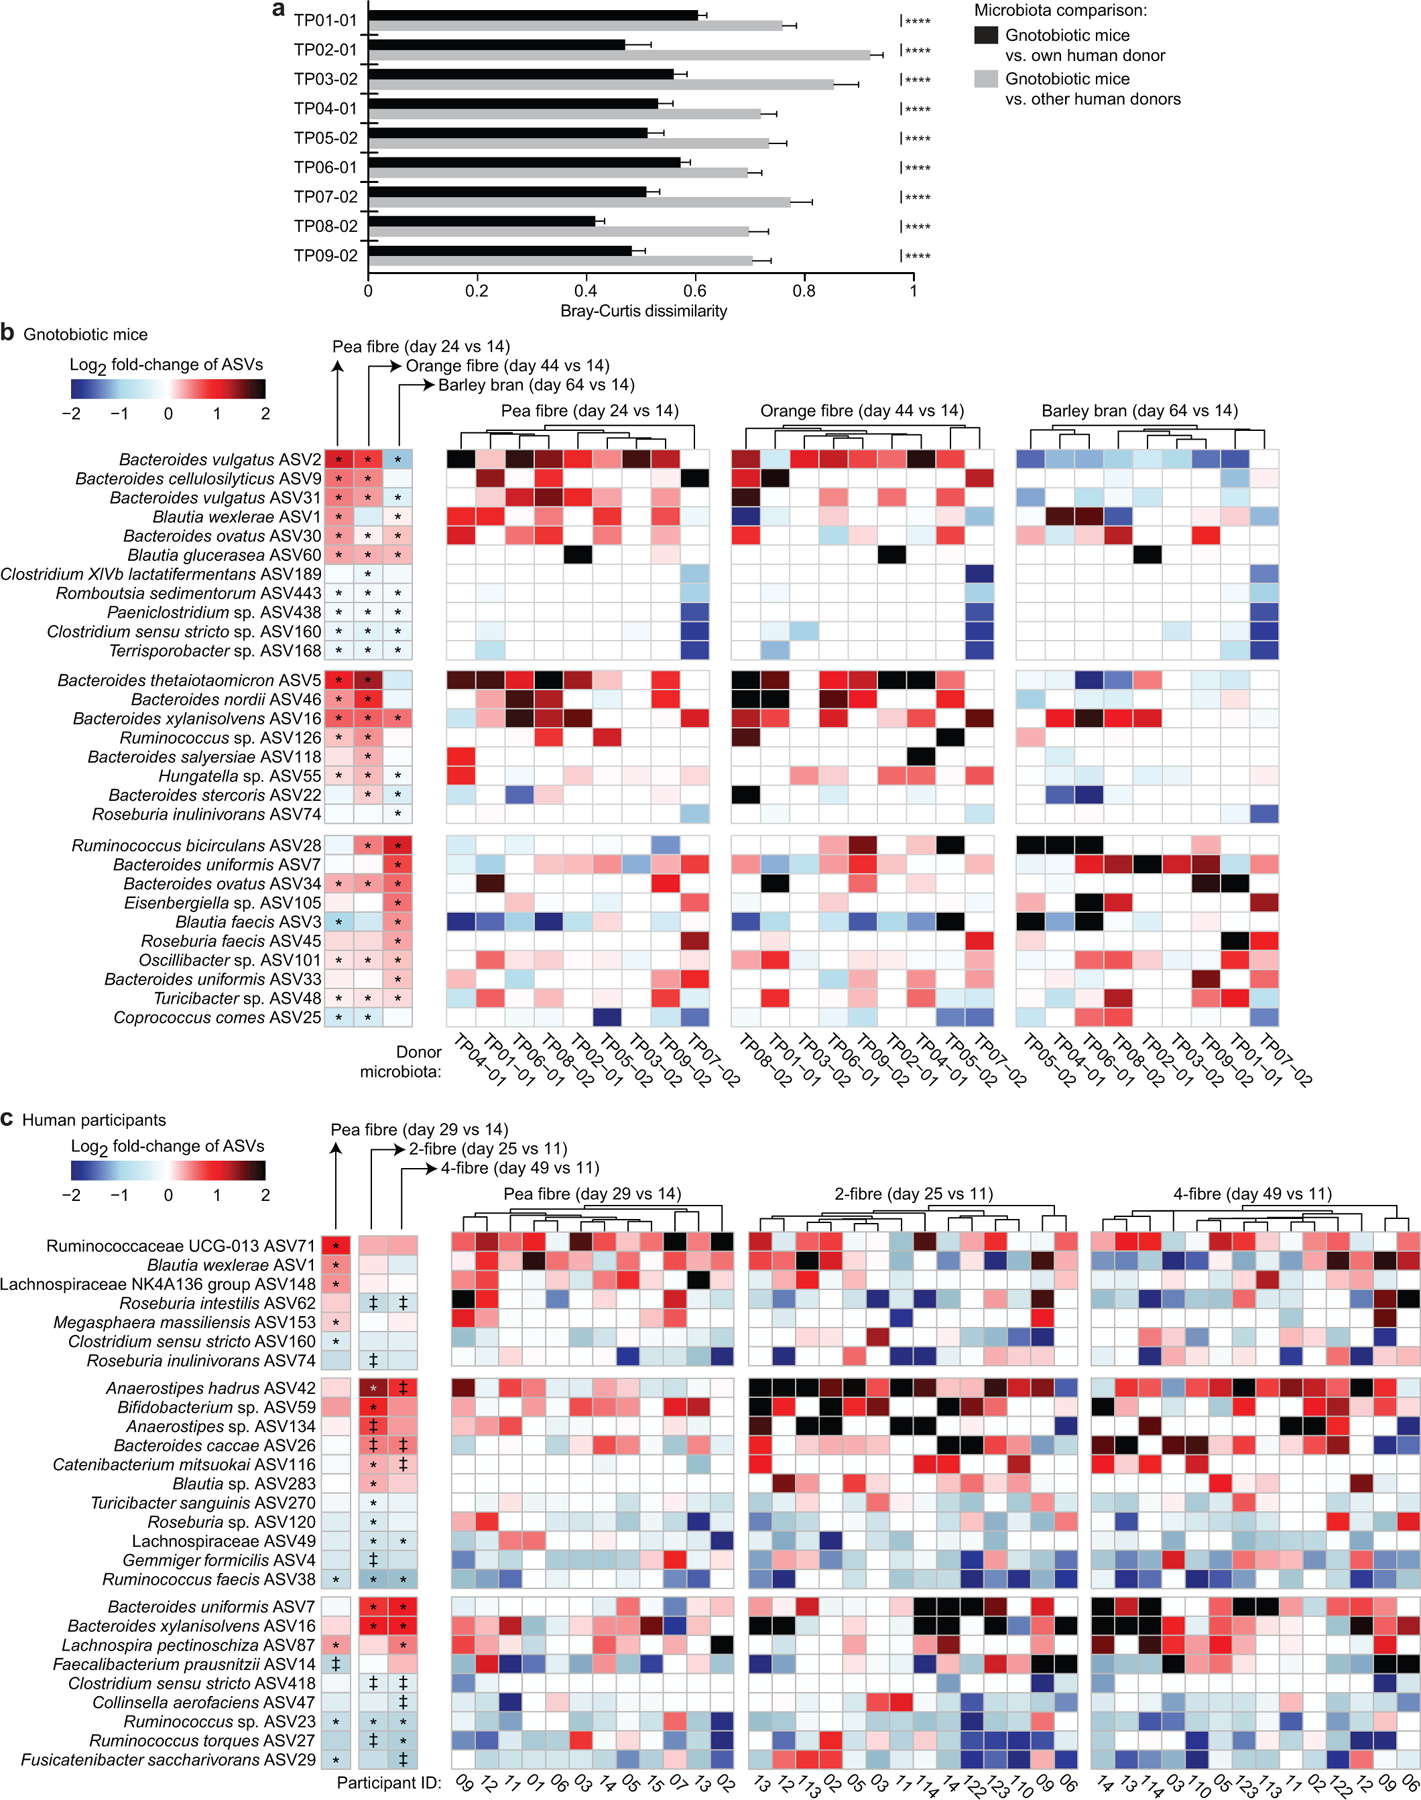
a, Bray-Curtis dissimilarity distances calculated from the ASV content of communities sampled at all time points (days 4, 9, 14, 19, 24, 29, 34, 39, 44, 49, 54, 59, and 64 post-colonization) from a given group of recipient mice compared to the ASV content of their corresponding human donor community prior to transplantation (Bray-Curtis distances calculated from ASV abundances in faecal samples collected from each group of mice (n=6–10 animals; n=752 faecal samples in total) compared to the abundances of these ASVs in each of their corresponding nine human donor faecal communities). ****, P-value <0.0001 (one-way ANOVA, Šídák’s correction). b, Heatmap of statistically significant log2 fold-changes in the abundances of discriminatory ASVs in gnotobiotic mice during at least one of the fibre interventions. The heatmap on the left shows the grand mean for data obtained from all groups of animals while the heatmap on the right shows averaged data for animals containing a given donor microbiota (n=6 to 10 mice/group; n=232 faecal samples obtained at the indicated time points with data normalized to day 14 values). Hierarchical clustering (Euclidean distances) of ASV profiles was used to group donor microbiota with similar responses to each fibre supplement. c, ASVs whose log2 fold changes in abundance were statistically significant in human participants after at least one of the fibre snack interventions. The left panel shows mean values for participants enrolled in each study, while the three panels to the right show changes in ASV abundances in individual participants after consumption of each of the fibre snacks. Data are normalized to pre-treatment timepoints, i.e., day 14 (study 1) and day 11 (study 2) (n=12 and 14 participants for study 1 and 2, respectively, n=66 faecal samples analysed). Hierarchical clustering (Euclidean distances) of ASV profiles was used to group participants with similar responses to a given fibre snack. ‡ q-value < 0.1, * q-value < 0.05 (linear-mixed effects model, FDR-corrected).
Extended Data Fig.6: Identification by HOSVD of fibre snack-discriminatory CAZymes and mcSEED metabolic pathways in human participants in the controlled diet studies.
a,b, CAZymes and mcSEED metabolic pathways whose log2 fold-changes in abundance were statistically significant during at least one of the 3 fibre snack interventions. Data are shown for each participant after consumption of each fibre snack type and are normalized to pretreatment timepoints, i.e., day 14 (study 1) and day 11 (study 2) (n=12 and 14 participants for study 1 and 2, respectively, n=66 faecal samples analysed). Hierarchical clustering (Euclidean distances) of CAZyme and mcSEED metabolic pathway profiles was used to group participants with similar responses to each fibre snack type. CAZymes marked with a ‘+’ were also fibre-treatment discriminatory in the gnotobiotic mouse studies.
Extended Data Fig.7: Spearman-rank cross-correlation analysis of the representation of CAZymes, monosaccharides and glycosidic linkages in the faecal communities of participants consuming the pea fibre snack prototype.
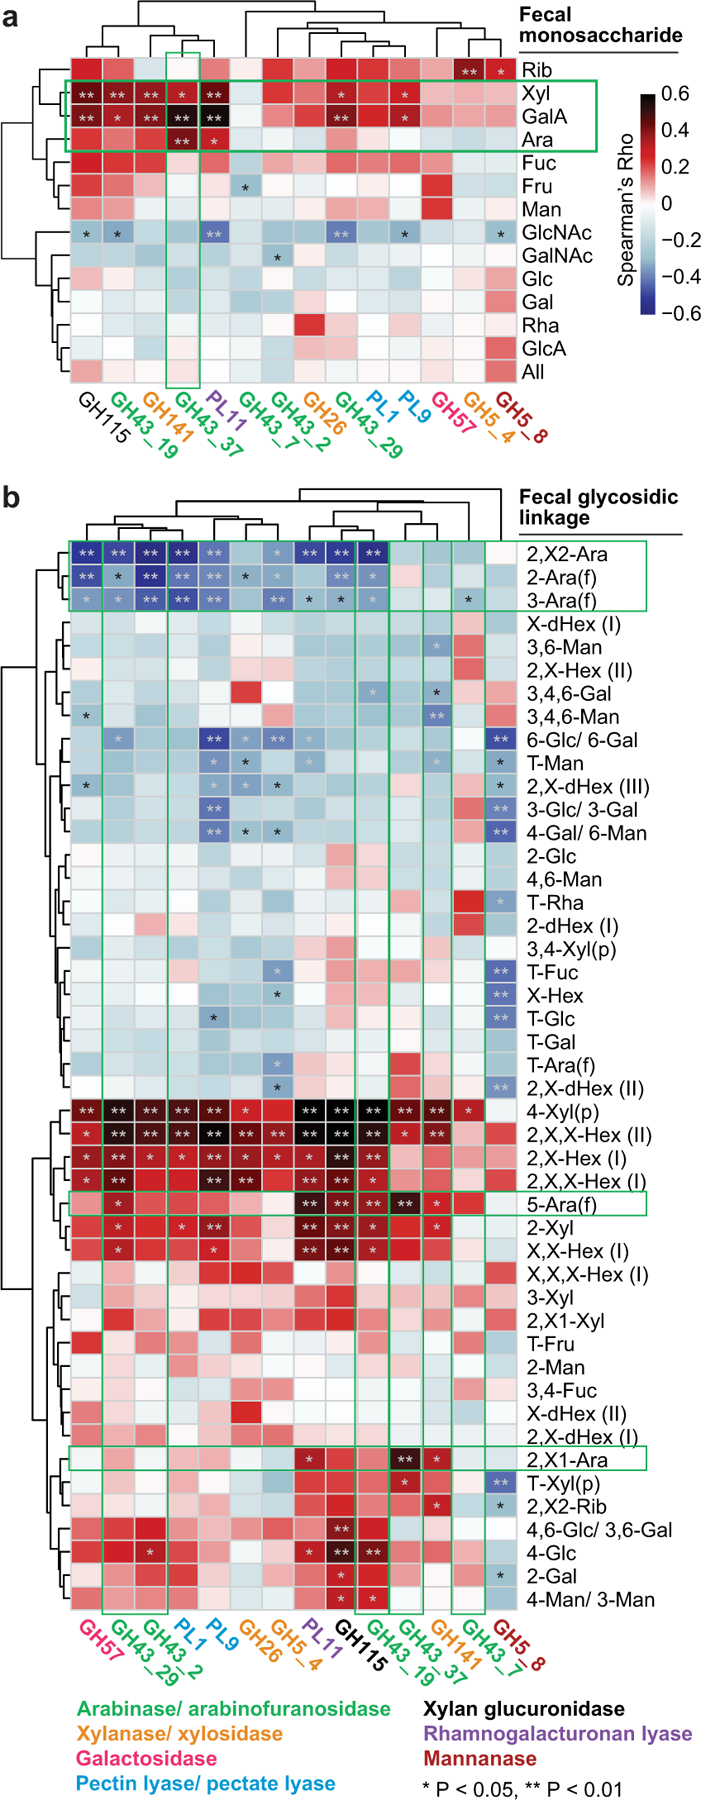
a,b, Correlations between the log2 fold-change of statistically significant, HOSVD-defined discriminatory CAZyme gene abundances (matched by time and participant) to the log2 fold-change in levels of monosaccharides and glycosidic linkages at days 25 and 35 (fibre snack consumption), and days 45 and 49 (post-intervention phase) normalized to day 14 (pre-intervention phase; n=72 faecal samples analysed; 12 participants). Green boxes in panel a highlight a significant correlation between GH43_37 (arabinofuranosidase) and arabinose, a prominent monosaccharide component of pea fibre. Panel b provides evidence that participant microbiomes contain CAZymes that cleave multiple branches of pea fibre arabinan, resulting in accumulation of its 1,5-arabinofuranose backbone in faeces. See Supplementary Results for further details. *, P <0.05; **, P<0.01. Abbreviations: glucose (Glc), galacturonic acid (GalA), arabinose (Ara), xylose (Xyl), galactose (Gal), mannose (Man), rhamnose (Rha), fucose (Fuc), fructose (Fru), glucuronic acid (GlcA), N-acetylglucosamine (GlcNAc), N-acetylgalactosamine (GalNAc), allose (All), ribose (Rib), hexose (Hex), deoxyhexose (dHex); terminal (T), pyranose (p), furanose (f), undefined linkage (X).
Extended Data Fig.8: Schematic of the analytic pipeline for identifying associations between changes in the plasma proteome and CAZyme responses after fibre snack consumption.
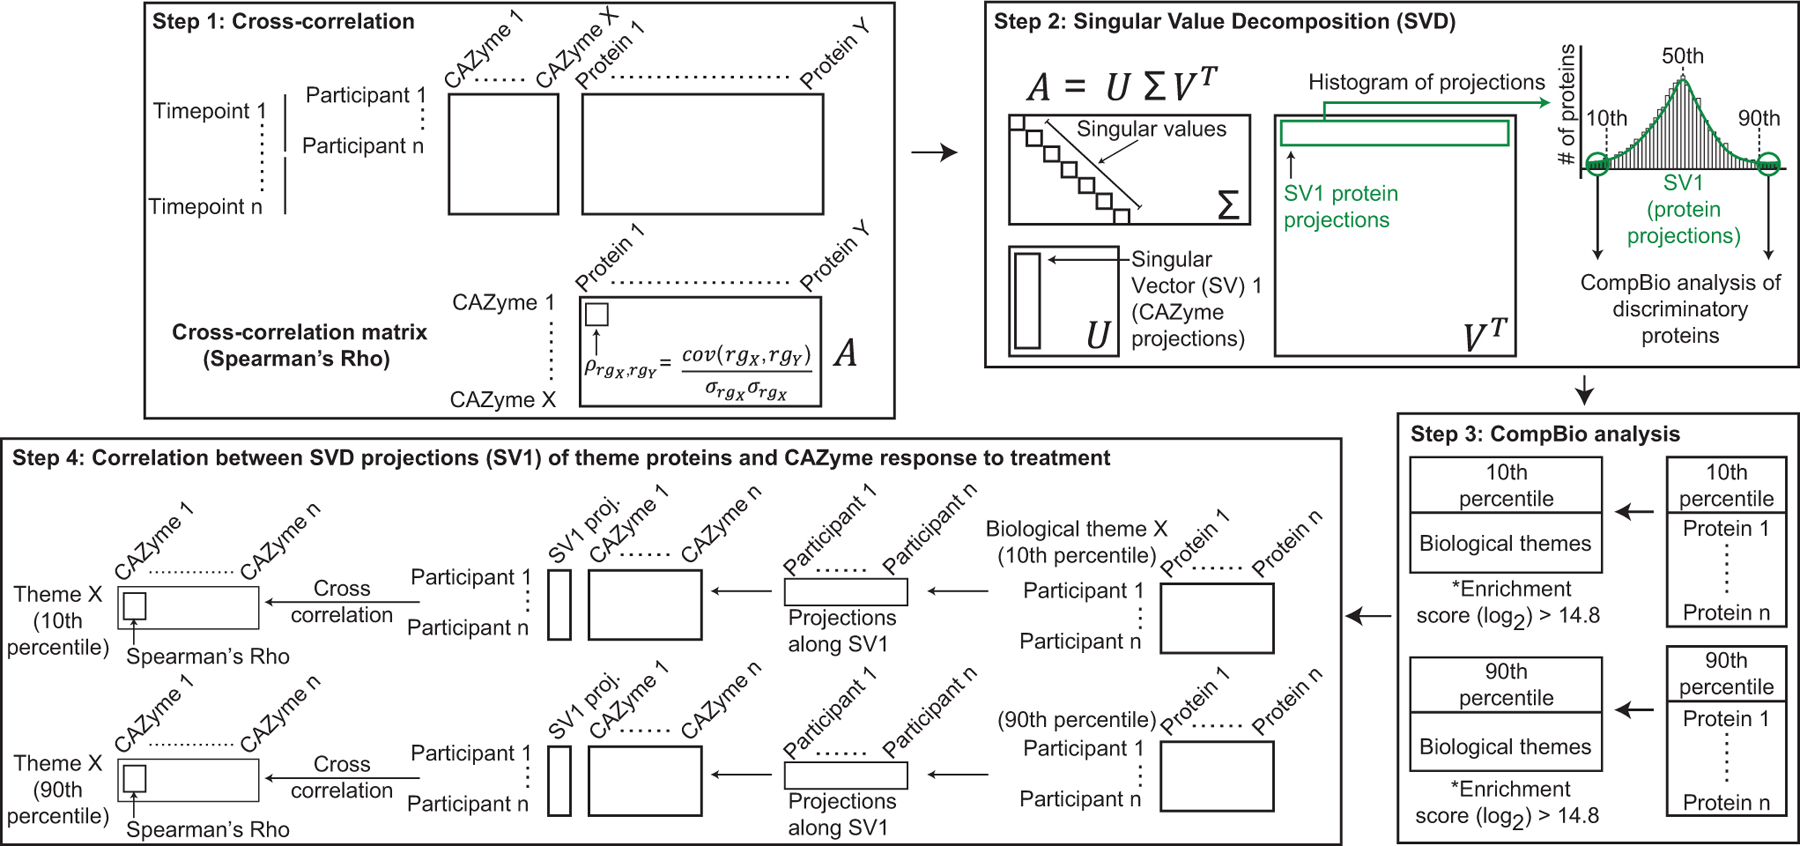
Step 1 shows cross-correlation analysis between plasma proteins and discriminatory CAZymes whose changes in abundance were statistically significant. Step 2 shows SVD analysis of Spearman’s Rho values of the cross-correlation matrix. Proteins with projections along Singular Vector (SV) 1 are plotted in a histogram to identify those proteins most correlated with discriminatory CAZymes (those within the 10th and 90th percentile, α<0.1). Step 3 represents a CompBio-based analysis of groups of proteins with SV1 projections within the 10th and 90th percentiles. Biological themes enriched in proteins binned in the 10th and 90th percentile are generated [threshold cutoff for enrichment score (log2) > 14.8]. Step 4 is an SVD analysis of protein profiles within each biological theme for all participants, followed by cross-correlation between SVD projections (SV1) of themed proteins and discriminatory CAZyme responses to treatment.
Extended Data Fig.9: CAZyme-associated plasma proteome responses to consumption of the 4-fibre snack prototype.
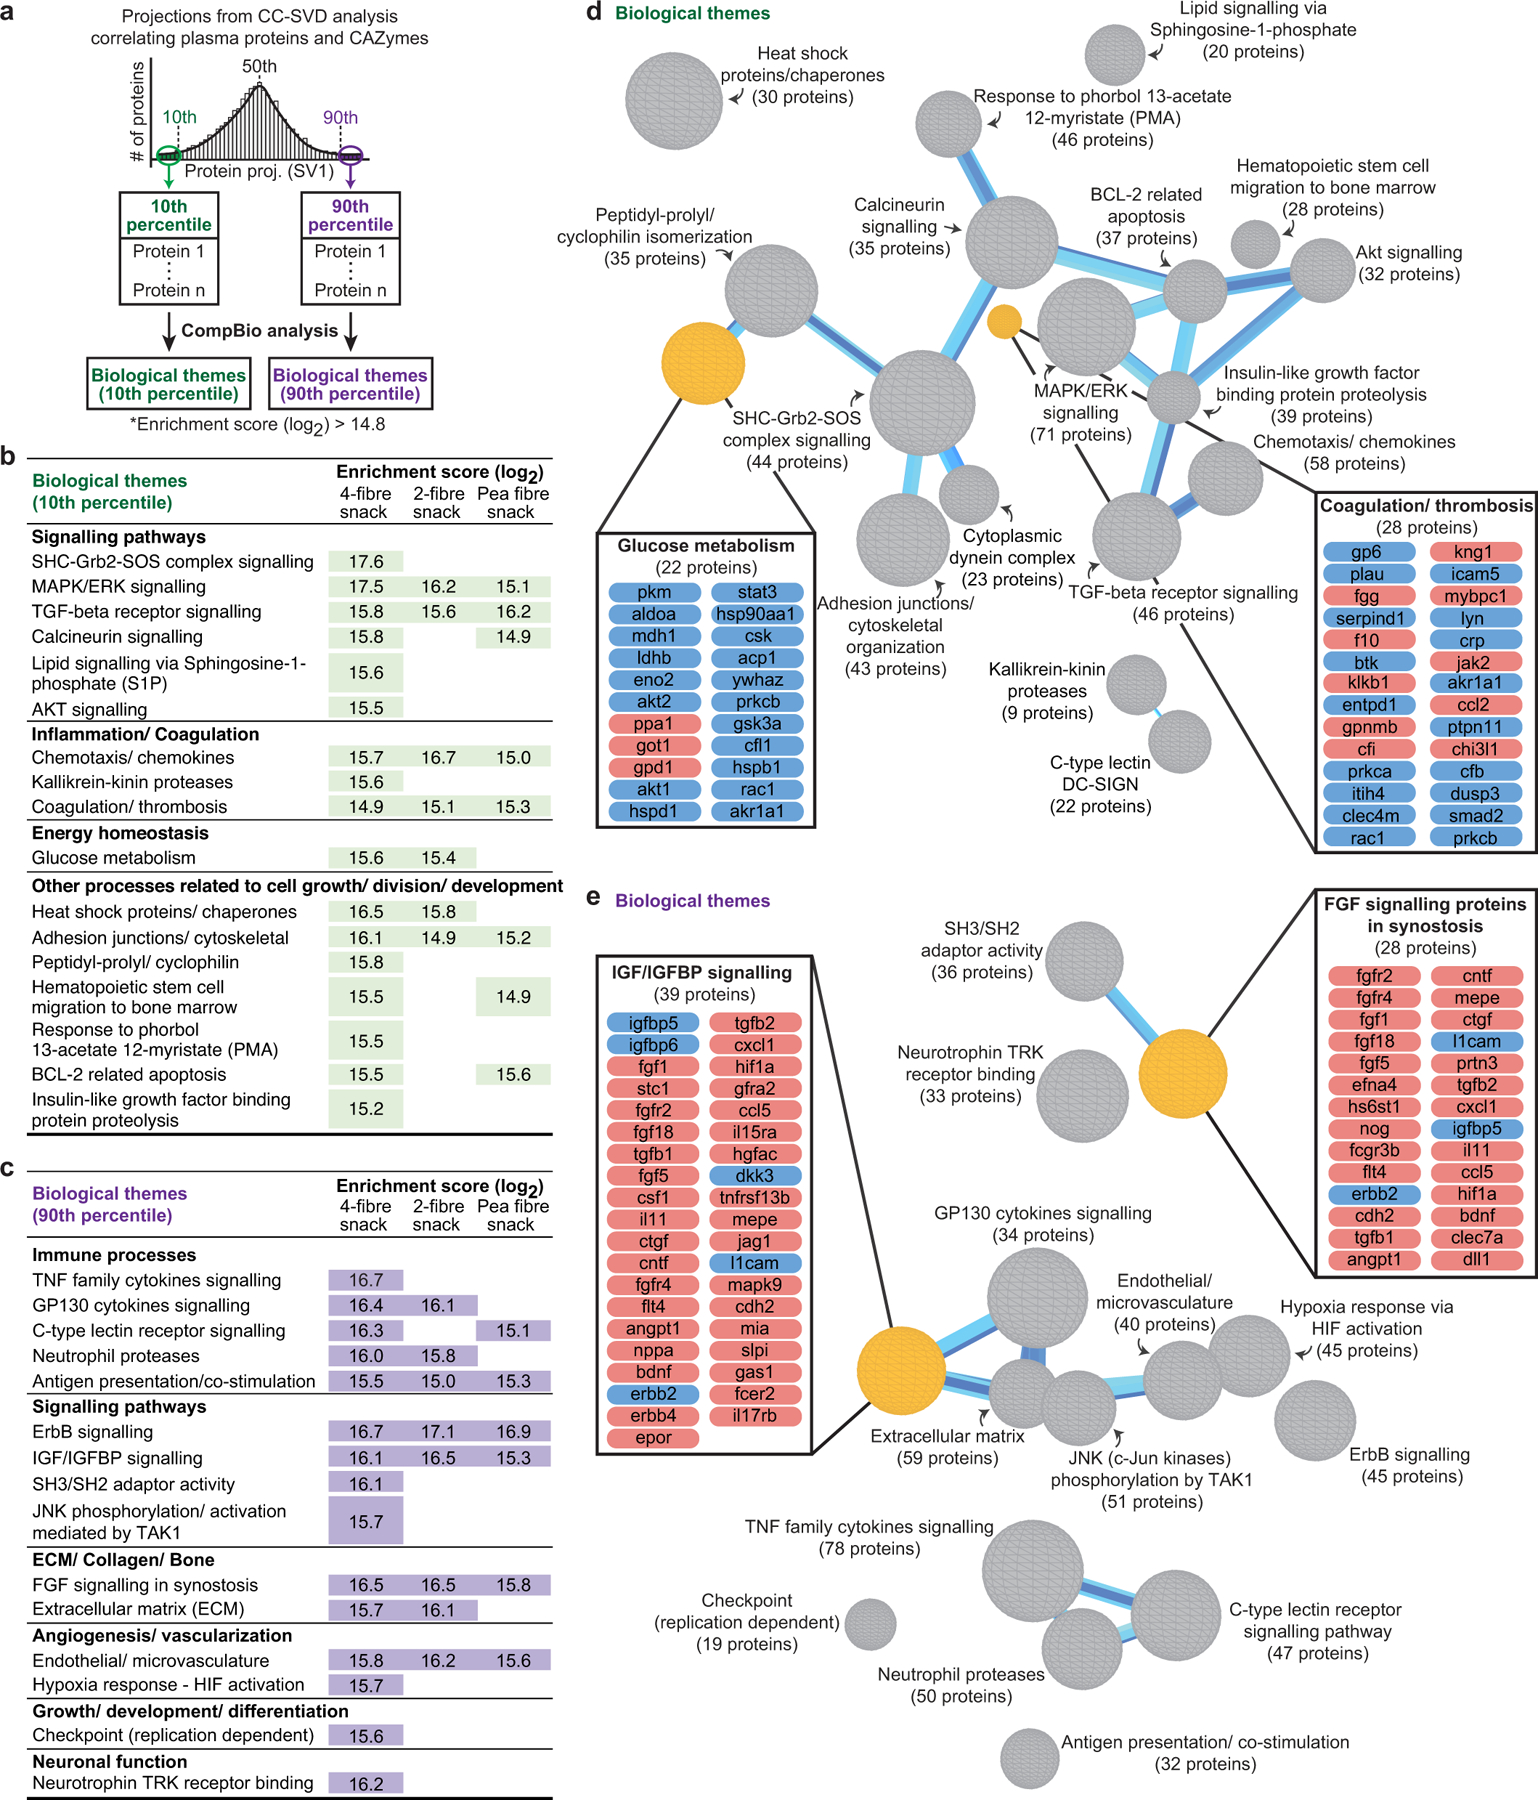
a-c, Contextual language processing literature analysis (CompBio) of proteins whose abundances were significantly correlated with treatment-discriminatory CAZymes in participants consuming the 4-fibre snack. The analysis procedure is summarized in Extended Data Fig.5. Treatment-responsive proteins, identified by CC-SVD as having projections at the extremes of singular vector 1 (10th and 90th percentiles of the distribution), are grouped into biological themes identified by CompBio, based on a conditional probability analysis, as being significantly enriched for contextually-associated biological ‘concepts’ (processes/pathways) over those that occur by random sampling of the literature. Themes with enrichment scores (log2) > 14.8 in the plasma proteomes of participants who consumed the 4-fibre snack are shown in panels b and c (see Supplementary Table10d-f for a comprehensive list of themes associated with this and the other fibre snacks). d,e, Biological themes based on proteins positioned in 10th and 90th percentiles (panels d and e, respectively) are portrayed as spheres. The size of a sphere is related to its enrichment score in the plasma proteome after consumption of the 4-fibre snack. The thickness of the blue lines connecting themes signifies the number of proteins shared between them. Component proteins of exemplary themes (orange spheres) are listed in boxes and coloured by their median log2 fold-change in response to consumption of the snack (blue, decrease; red, increase).
Extended Data Fig.10: Connecting host responses defined by plasma proteomic features to microbiome responses defined by CAZyme features in participants consuming the 4-fibre snack.
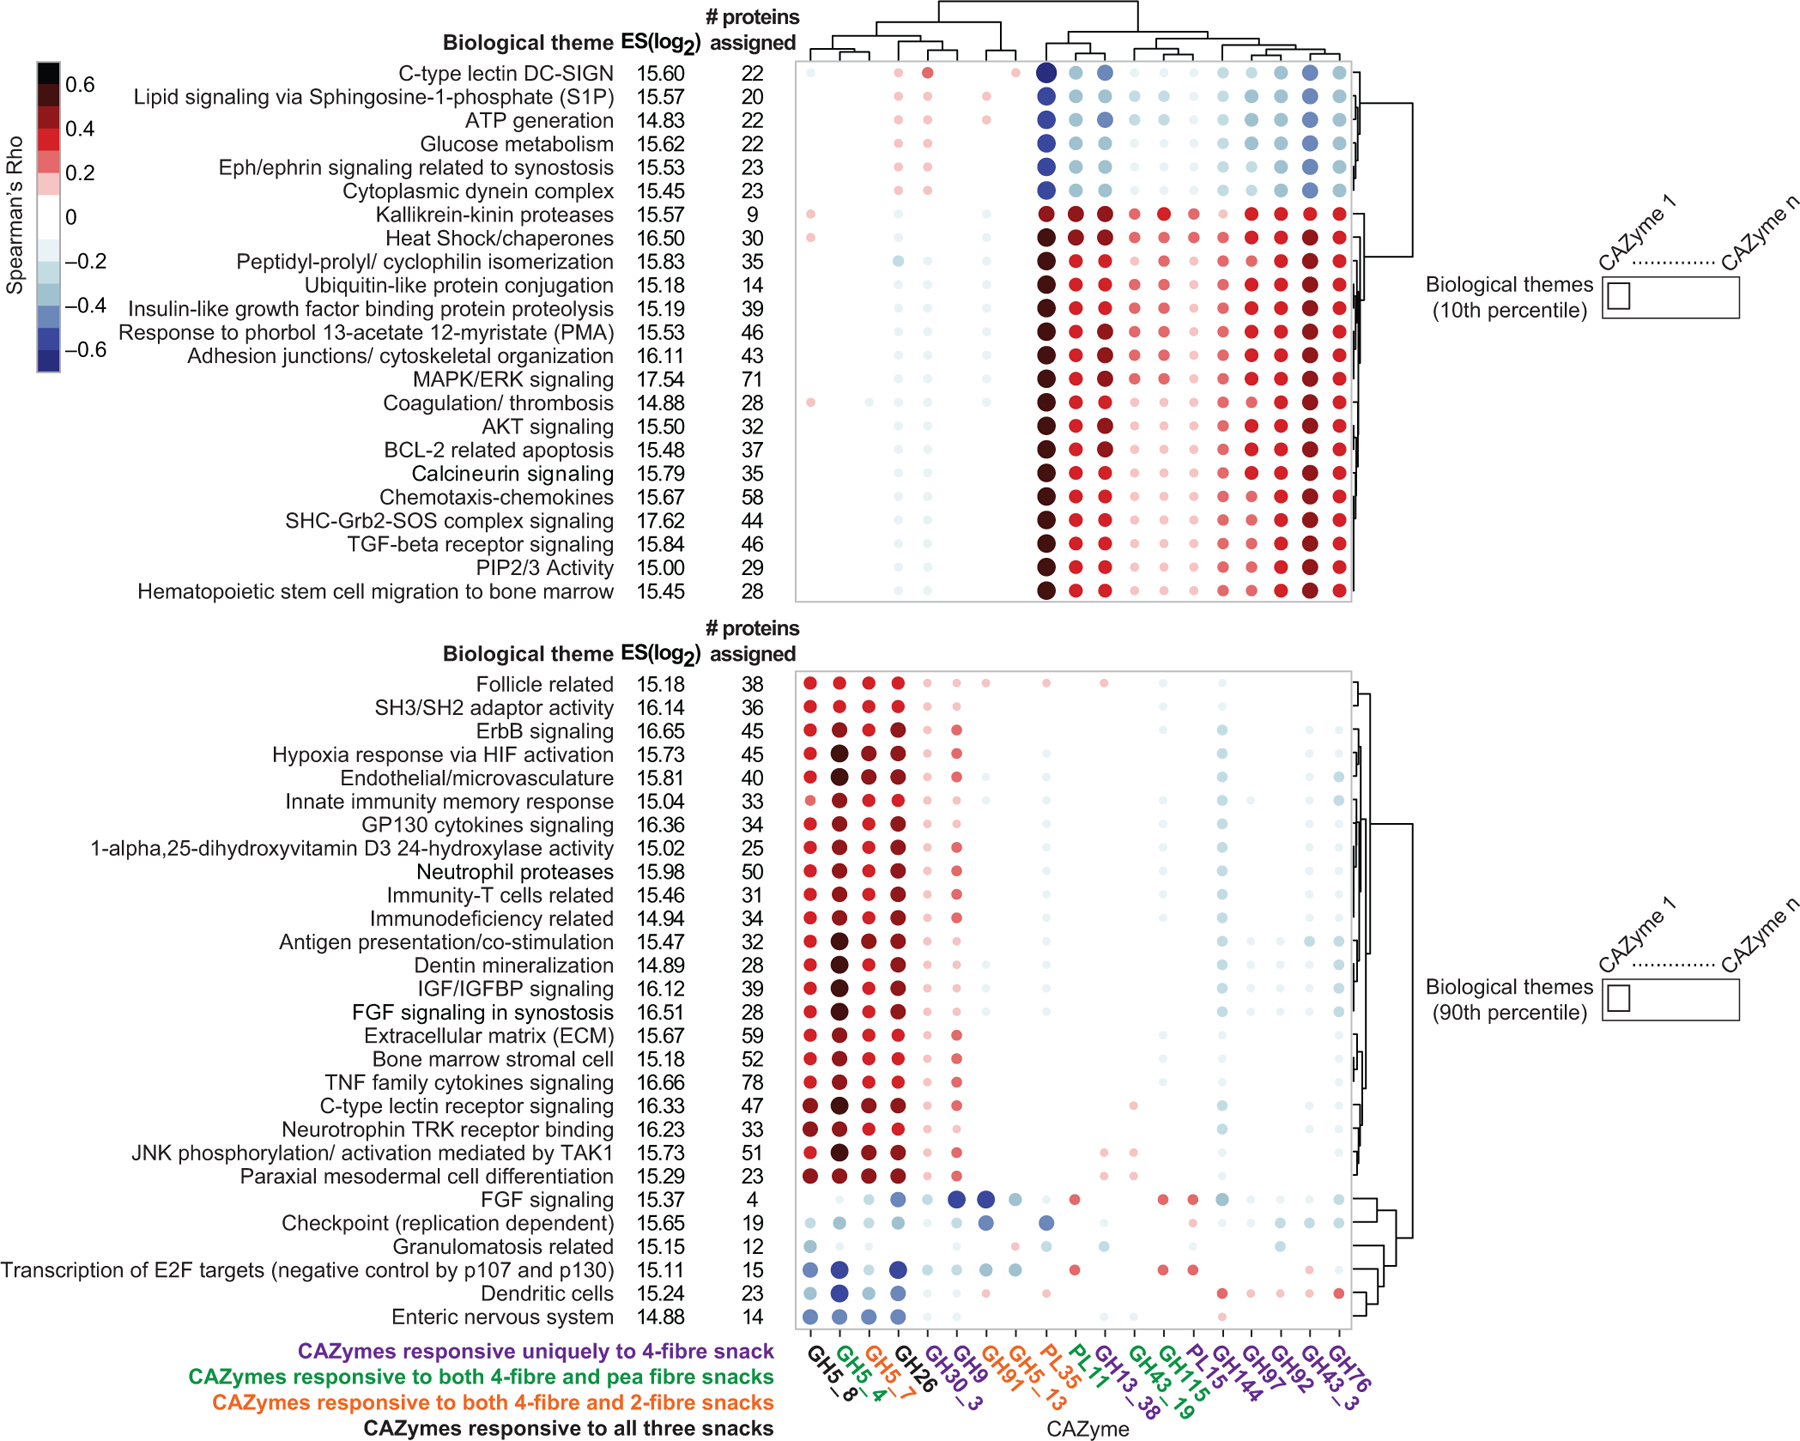
Cross-Correlation Singular Value Decomposition (CC-SVD) analysis of the plasma proteome with significantly changed discriminatory CAZymes in all participants after consuming the 4-fibre snack. Two distinct group of proteins with significant correlations with CAZymes are shown; one group with SV1 projections situated in the 10th percentile (top) and the other in the 90th percentile (bottom). CompBio analysis revealed biological themes that were significantly correlated with these CAZymes. Themes, their enrichment scores (log2), the number of proteins comprising each theme and the cross-correlation (Spearman’s Rho) values between SV1 projections of themes and discriminatory CAZymes are presented. Each circle represents the correlation between a biological theme and a fibre-responsive CAZyme, with larger and darker circles indicating stronger correlations (positive correlations are coloured in red while negative correlations are coloured in blue).
Extended Data Fig.11: Individual responses of the plasma proteome of participants consuming the 4-fibre snack prototype.
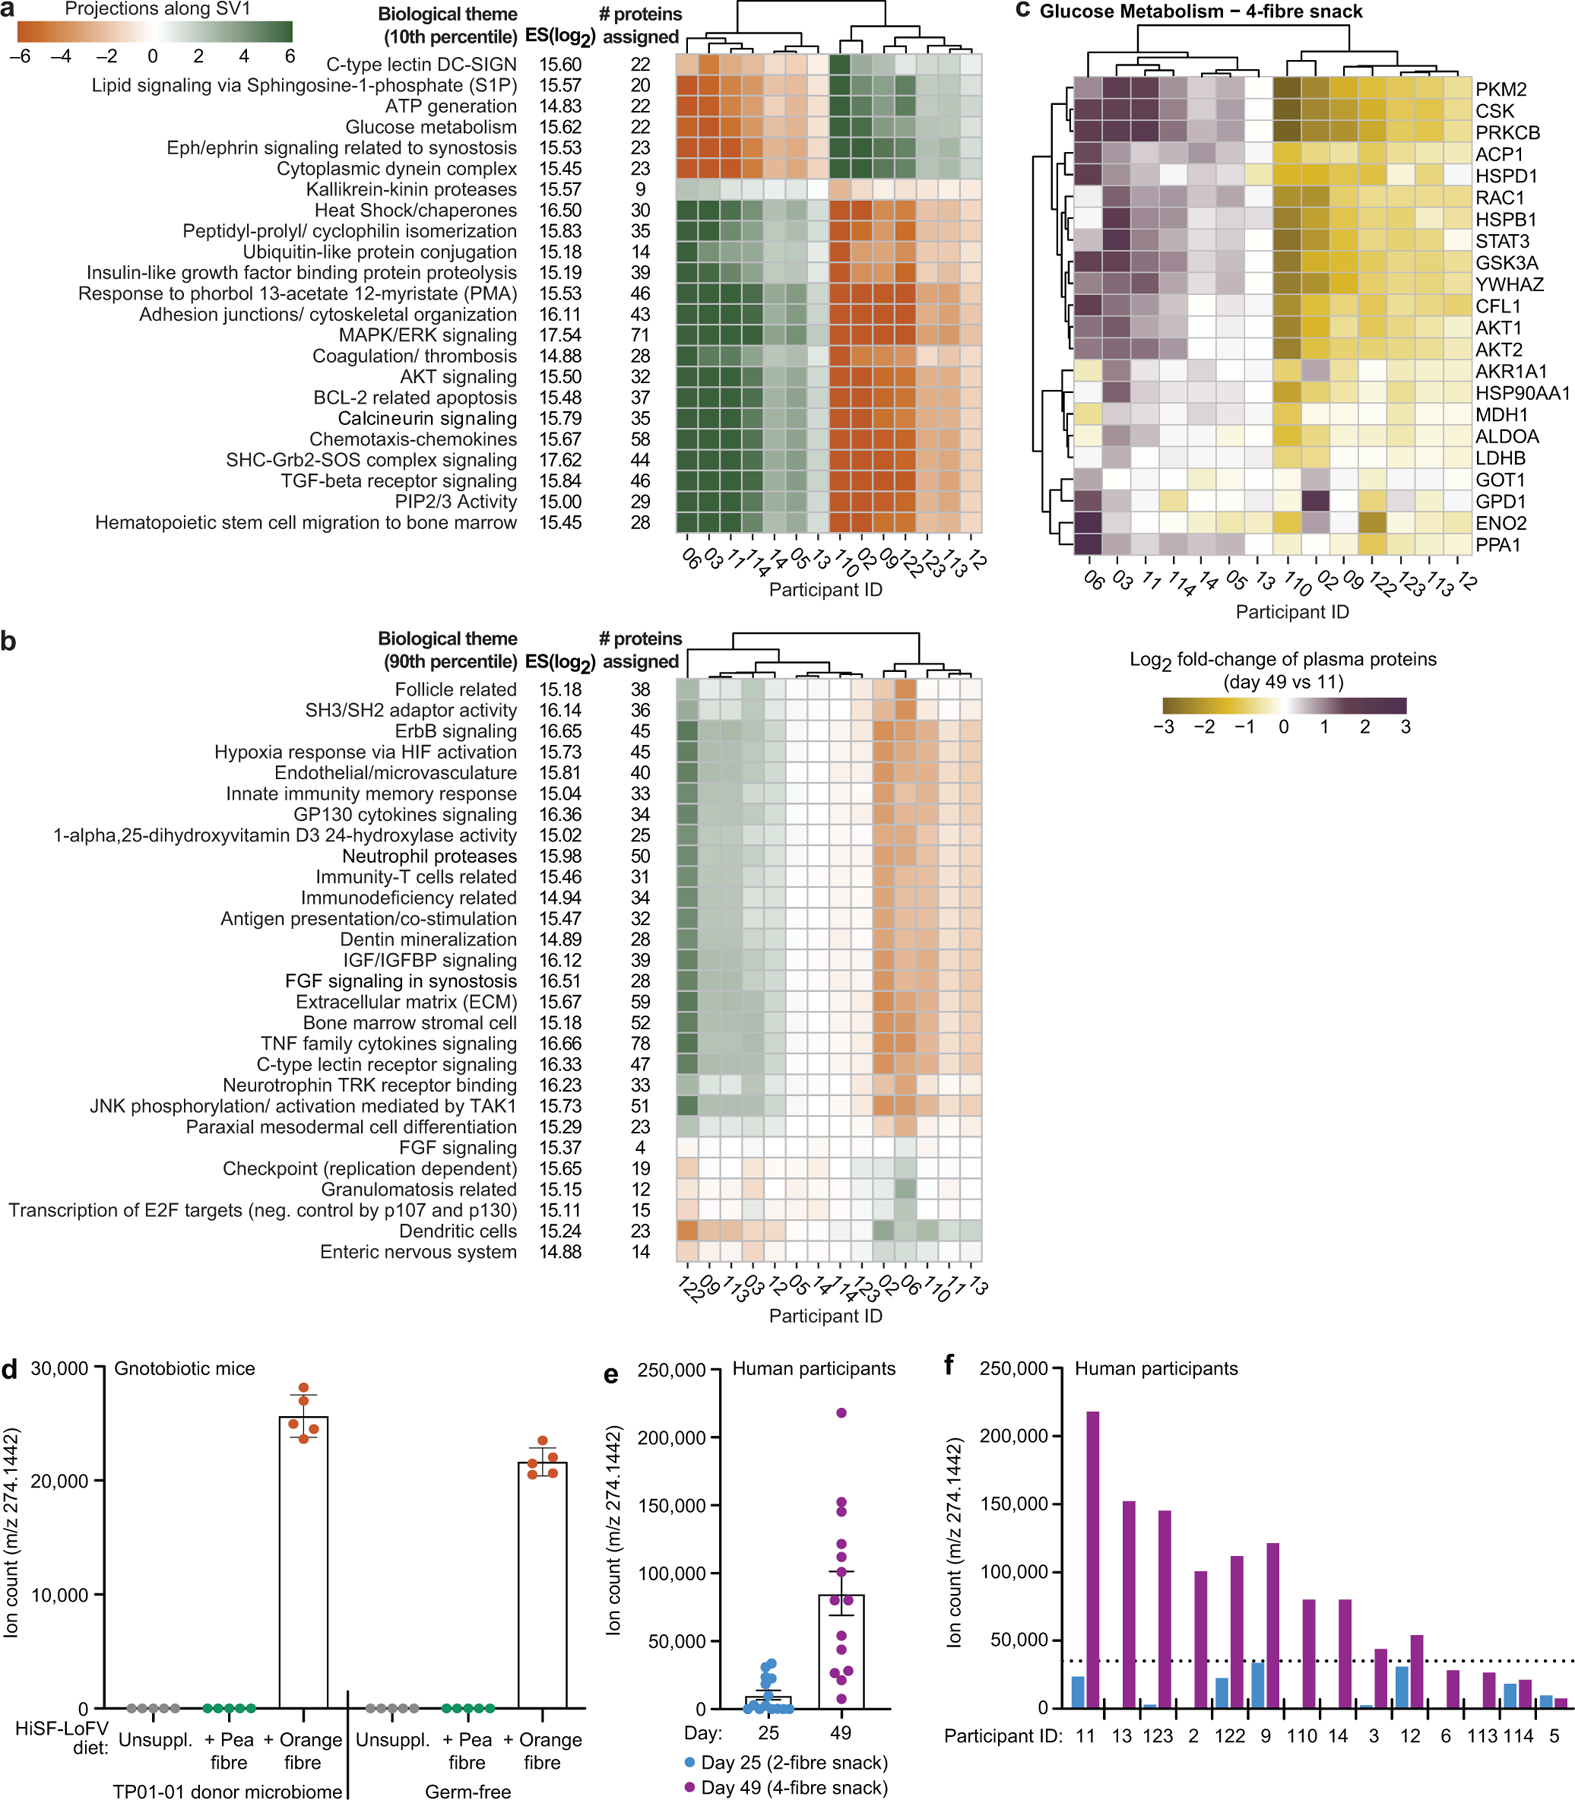
a,b, Heatmaps plotting the projections on SV1 of changes in the representation of biological themes during consumption of the 4-fibre snack. c, Heatmap plotting the log2 fold-change in the levels of plasma proteins enriched in the ‘Glucose Metabolism’ theme. Data for each participant is shown, normalized to the last day of the pretreatment phase on day 11. Note that the 4-fibre snack produced the greatest reduction in HOMA-IR among the three different snacks tested (Supplementary Table5c). However, this reduction did not achieve statistical significance (P=0.078, linear-mixed effects model) after the short period of snack consumption in this study. d-f, LC-QTOF-MS analysis of a biomarker of orange fibre consumption present in faecal samples obtained from gnotobiotic mice and humans. Panel d compares levels of the m/z 274.1442 analyte in colonized and germ-free mice fed the unsupplemented, orange fibre-supplemented or pea fibre-supplemented HiSF-LoFV diet for 10 days. The analyte is only detectable when orange fibre is consumed and is not dependent upon on the human donor microbiome for its generation. Bars represent mean values ± s.d. for biological replicates (n=5 mice/group). Panels d and e compare levels of the analyte in faecal samples obtained from participants in human study 2 on days 25 and 49 when they were consuming the maximum dose of the 2-fibre (pea and inulin) and 4-fibre (pea fibre, inulin, orange fibre plus barley bran) snack food prototypes. The bar graph in panel e represents mean values ± s.d. for technical replicates (n=14 participants). The horizontal dashed line in panel f denotes a baseline value operationally defined as the highest level of detection of the analyte in participants consuming the 2-fibre snack food prototype lacking orange fibre.
Extended Data Fig.12: Plasma proteins with statistically significant changes in their abundances as a function of fibre treatment type and participant.
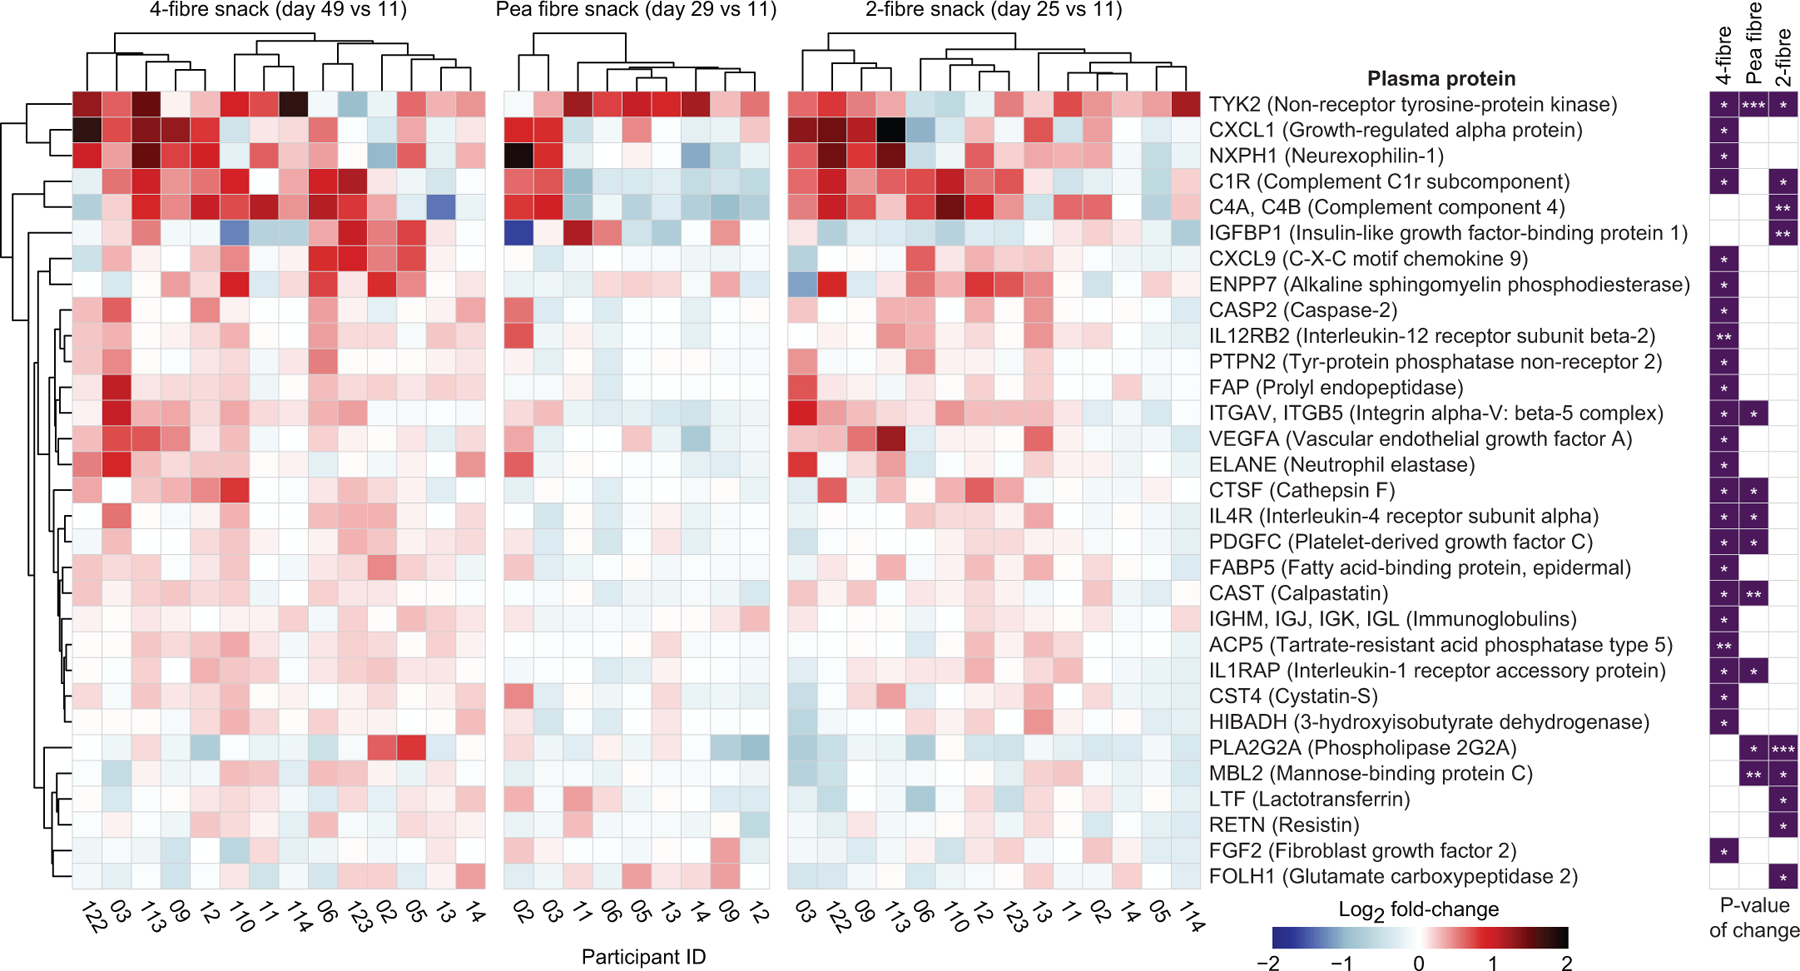
Heatmap plotting the log2 fold-change in the abundances of plasma proteins in participants consuming the indicated fibre snack prototype. Data from the nine participants in study 1 (pea fibre snack) who were also enrolled in study 2 (2- and 4-fibre snacks) are shown. Changes in protein levels are referenced to their abundances on the last day of the pretreatment phase (day 14 and day 11 in study 1 and study 2, respectively) (n=66 blood plasma samples analysed). *, P<0.05; ** P<0.01; *** P<0.001 (linear model, limma25).
Supplementary Material
Acknowledgements
We thank Maria Karlsson and David O’Donnell for their assistance with gnotobiotic mouse husbandry, Stacey Marion for her role in collecting clinical meta-data and faecal samples from obese members of the MOAFTs study cohort and the two human studies, Suzanne Waller for design of the controlled diet study menus and oversight of the metabolic kitchen, and Sally Torbitzky for her assistance with coordination and planning of the human studies. Technical support was provided by Su Deng, Justin Serugo, Janaki Lelwala-Guruge, Kazi Ahsan, Samantha Bale, Julia Veitinger, and Sebastian Karlsson (archiving and processing mouse and human biospecimens), Marty Meier, Jessica Hoisington-López, and MariaLynn Crosby (bacterial V4–16S rDNA amplicon and faecal microbiome shotgun sequencing), Twyla Juehne, Andrew Lutz and Jinsheng Yu (generating SOMAscan datasets), and Richard Head and Chad Storer (assistance with CompBio analyses). We also thank Michael Patnode for his input about the selection of lead fibres, Sophie Le Gall, Luc Saulnier, and Brigitte Laillet (Institut National de Recherche pour L’agriculture, L’alimentation et L’environnement at Nantes, France) for carbohydrate analysis of pea, orange, and barley bran fibre preparations, Gautier Cesbron Lavau and Monika Okoniewska for formulation and scale-up production of snack prototypes for human studies, Soraya Abdel-Hamid for production of the HiSF-LoFV diets given to gnotobiotic mice, Luca Dimartino for analysis of the fibre ingredients in these diets, and Laura Kyro for assistance with figure illustrations.
This work was funded by grants from the NIH (DK078669, DK70977, UL1-TR002345) and from Mondelēz Global LLC. Controlled diet studies of human participants were overseen by members of the Clinical Science Research Core of the Nutrition Obesity Research Center (NORC), which is supported by NIH grant P30 DK056341. Plasma proteomic datasets were generated by the Genome Technology Access Center at Washington University School of Medicine, which is supported in part by NIH Grants P30 CA91842 and UL1TR002345. O.D-B. received support from NIH R25GM103757, T32GM007067 and T32HL130357 as a pre-doctoral trainee. J.I.G. is the recipient of a Thought Leader Award from Agilent Technologies.
Footnotes
Data availability
V4–16S rRNA sequences in raw format prior to post-processing and data analysis, plus shotgun sequencing datasets generated from faecal DNA, have been deposited at the European Nucleotide Archive under study accession PRJEB38148. Raw proteomic datasets generated from the aptamer-based 1.3K SomaLogic platform have been deposited in the European Genome-Phenome Archive (EGA) under accession IDs EGAD00010002133 (Pea Fiber study) and EGAD00010002132 (Fiber Blends study)
Code availability
Code for HOSVD (CP-ALS plus randomization code) and CC-SVD is available via Zenodo (https://doi.org/10.5281/zenodo.4767887)70.
Declarations
J.I.G. is a co-founder of Matatu, Inc., a company characterizing the role of diet-by-microbiota interactions in animal health. A.O. and D.R. are co-founders of Phenobiome Inc., a company pursuing development of computational tools for predictive phenotype profiling of microbial communities. C.B.L is a co-founder of Evolve Biosystems, interVenn Bio, and BCD Bioscience, companies involved in the characterization of glycans and developing carbohydrate applications for human health.
D.K.H, A.M. and S.V. are employees of Mondelēz Global LLC, a multinational company engaged in production of snack foods. The remaining authors declare that they have no competing financial interests.
A patent application related to the fibre-snack formulations described in this report has been filed and published (WO 2021/016129).
References
- 1.NCD Risk Factor Collaboration (NCD-RisC). Trends in adult body-mass index in 200 countries from 1975 to 2014: a pooled analysis of 1698 population-based measurement studies with 19·2 million participants. The Lancet 387, 1377–1396 (2016). [DOI] [PMC free article] [PubMed] [Google Scholar]
- 2.GBD 2017 Diet Collaborators. Health effects of dietary risks in 195 countries, 1990–2017: a systematic analysis for the Global Burden of Disease Study 2017. The Lancet 393, 1958–1972 (2019). [DOI] [PMC free article] [PubMed] [Google Scholar]
- 3.Willett W et al. Food in the Anthropocene: the EAT–Lancet Commission on healthy diets from sustainable food systems. The Lancet 393, 447–492 (2019). [DOI] [PubMed] [Google Scholar]
- 4.Hauner H et al. Evidence-based guideline of the German Nutrition Society: carbohydrate intake and prevention of nutrition-related diseases. Ann. Nutr. Metab 60, 1–58 (2012). [DOI] [PubMed] [Google Scholar]
- 5.Reynolds A et al. Carbohydrate quality and human health: a series of systematic reviews and meta-analyses. The Lancet 393, 434–445 (2019). [DOI] [PubMed] [Google Scholar]
- 6.Zhao L et al. Gut bacteria selectively promoted by dietary fibers alleviate type 2 diabetes. Science 359, 1151–1156 (2018). [DOI] [PubMed] [Google Scholar]
- 7.Asnicar F et al. Microbiome connections with host metabolism and habitual diet from 1,098 deeply phenotyped individuals. Nat. Med 27, 321–332 (2021). [DOI] [PMC free article] [PubMed] [Google Scholar]
- 8.Kovatcheva-Datchary P et al. Dietary fiber-induced improvement in glucose metabolism is associated with increased abundance of Prevotella. Cell Metab 22, 971–982 (2015). [DOI] [PubMed] [Google Scholar]
- 9.Sonnenburg ED et al. Specificity of polysaccharide use in intestinal Bacteroides species determines diet-induced microbiota alterations. Cell 141, 1241–1252 (2010). [DOI] [PMC free article] [PubMed] [Google Scholar]
- 10.Ridaura VK et al. Gut microbiota from twins discordant for obesity modulate metabolism in mice. Science 341, 1241214 (2013). [DOI] [PMC free article] [PubMed] [Google Scholar]
- 11.Patnode ML et al. Interspecies competition impacts targeted manipulation of human gut bacteria by fiber-derived glycans. Cell 179, 59–73.e13 (2019). [DOI] [PMC free article] [PubMed] [Google Scholar]
- 12.Lombard V, et al. The Carbohydrate-active enzymes database (CAZy) in 2013. Nucleic Acids Res 42, D490–D495 (2014). [DOI] [PMC free article] [PubMed] [Google Scholar]
- 13.Overbeek R et al. The SEED and the Rapid Annotation of microbial genomes using Subsystems Technology (RAST). Nucleic Acids Res 42, D206–214 (2014). [DOI] [PMC free article] [PubMed] [Google Scholar]
- 14.Martino C et al. Context-aware dimensionality reduction deconvolutes gut microbial community dynamics. Nat. Biotechnol 1–4 (2020) doi: 10.1038/s41587-020-0660-7. [DOI] [PMC free article] [PubMed] [Google Scholar]
- 15.Wesener DA et al. Microbiota functional activity biosensors for characterizing nutrient metabolism in vivo. eLife e64478 (2021). [DOI] [PMC free article] [PubMed] [Google Scholar]
- 16.Temple MJ et al. A Bacteroidetes locus dedicated to fungal 1,6-β-glucan degradation: Unique substrate conformation drives specificity of the key endo-1,6-β-glucanase. J. Biol. Chem 292, 10639–10650 (2017). [DOI] [PMC free article] [PubMed] [Google Scholar]
- 17.Larsbrink J et al. A discrete genetic locus confers xyloglucan metabolism in select human gut Bacteroidetes. Nature 506, 498–502 (2014). [DOI] [PMC free article] [PubMed] [Google Scholar]
- 18.Schröder C et al. Characterization of a theme C glycoside hydrolase family 9 endo-beta-glucanase from a biogas reactor metagenome. Protein J 37, 454–460 (2018). [DOI] [PubMed] [Google Scholar]
- 19.Shimizu H et al. Characterization and structural analysis of a novel exo-type enzyme acting on β-1,2-glucooligosaccharides from Parabacteroides distasonis. Biochemistry 57, 3849–3860 (2018). [DOI] [PubMed] [Google Scholar]
- 20.Li W et al. PspAG97A: A halophilic α-glucoside hydrolase with wide substrate specificity from glycoside hydrolase family 97. J. Microbiol. Biotechnol 26, 1933–1942 (2016). [DOI] [PubMed] [Google Scholar]
- 21.Gloster TM, Turkenburg JP, Potts JR, Henrissat B & Davies GJ Divergence of catalytic mechanism within a glycosidase family provides insight into evolution of carbohydrate metabolism by human gut flora. Chem. Biol 15, 1058–1067 (2008). [DOI] [PMC free article] [PubMed] [Google Scholar]
- 22.Helbert W et al. Discovery of novel carbohydrate-active enzymes through the rational exploration of the protein sequences space. Proc. Natl. Acad. Sci. USA 116, 6063–6068 (2019). [DOI] [PMC free article] [PubMed] [Google Scholar]
- 23.Ndeh D et al. Complex pectin metabolism by gut bacteria reveals novel catalytic functions. Nature 544, 65–70 (2017). [DOI] [PMC free article] [PubMed] [Google Scholar]
- 24.Hashimoto W, Miyake O, Ochiai A & Murata K Molecular identification of Sphingomonas sp. A1 Alginate lyase (A1-IV′) as a member of novel polysaccharide lyase family 15 and implications in alginate lyase evolution. J. Biosci. Bioeng 99, 48–54 (2005). [DOI] [PubMed] [Google Scholar]
- 25.Ritchie ME et al. limma powers differential expression analyses for RNA-sequencing and microarray studies. Nucleic Acids Res 43, e47 (2015). [DOI] [PMC free article] [PubMed] [Google Scholar]
- 26.Derecka M et al. Tyk2 and Stat3 regulate brown adipose tissue differentiation and obesity. Cell Metab 16, 814–824 (2012). [DOI] [PMC free article] [PubMed] [Google Scholar]
- 27.Pedersen L, Olsen CH, Pedersen BK & Hojman P Muscle-derived expression of the chemokine CXCL1 attenuates diet-induced obesity and improves fatty acid oxidation in the muscle. Am. J. Physiol. Endocrinol. Metab 302, E831–840 (2012). [DOI] [PubMed] [Google Scholar]
- 28.Kraja AT et al. Genetic analysis of 16 NMR-lipoprotein fractions in humans, the GOLDN study. Lipids 48, 155–165 (2013). [DOI] [PMC free article] [PubMed] [Google Scholar]
- 29.ZhuGe D-L, Javaid HMA, Sahar NE, Zhao Y-Z & Huh JY Fibroblast growth factor 2 exacerbates inflammation in adipocytes through NLRP3 inflammasome activation. Arch. Pharm. Res 43, 1311–1324 (2020). [DOI] [PubMed] [Google Scholar]
- 30.Michalak L et al. Microbiota-directed fibre activates both targeted and secondary metabolic shifts in the distal gut. Nat. Commun 11, 5773 (2020). [DOI] [PMC free article] [PubMed] [Google Scholar]
REFERENCES
- 31.Bucholz KK, Heath AC & Madden PA Transitions in drinking in adolescent females: evidence from the Missouri adolescent female twin study. Alcohol. Clin. Exp. Res 24, 914–923 (2000). [PubMed] [Google Scholar]
- 32.Mifflin MD et al. A new predictive equation for resting energy expenditure in healthy individuals. Am. J. Clin. Nutr 51, 241–247 (1990). [DOI] [PubMed] [Google Scholar]
- 33.Subar AF et al. Comparative validation of the Block, Willett, and National Cancer Institute food frequency questionnaires The Eating at America’s Table study. Am. J. Epidemiol 154, 1089–1099 (2001). [DOI] [PubMed] [Google Scholar]
- 34.Caporaso JG et al. Global patterns of 16S rRNA diversity at a depth of millions of sequences per sample. Proc. Natl. Acad. Sci. U.S.A 108 Suppl 1, 4516–4522 (2011). [DOI] [PMC free article] [PubMed] [Google Scholar]
- 35.Callahan BJ et al. DADA2: High-resolution sample inference from Illumina amplicon data. Nat. Methods 13, 581–583 (2016). [DOI] [PMC free article] [PubMed] [Google Scholar]
- 36.R Core Team. R: a language and environment for statistical computing (R Foundation for Statistical Computing, Vienna, Austria, 2017). [Google Scholar]
- 37.Di Luccia B et al. Combined prebiotic and microbial intervention improves oral cholera vaccination responses in a mouse model of childhood undernutrition. Cell Host & Microbe 27, 899–908.e5 (2020). [DOI] [PMC free article] [PubMed] [Google Scholar]
- 38.Baym M et al. Inexpensive multiplexed library preparation for megabase-sized genomes. PLoS One 10, e0128036 (2015). [DOI] [PMC free article] [PubMed] [Google Scholar]
- 39.Martin M Cutadapt removes adapter sequences from high-throughput sequencing reads. EMBnet J 17, 10–12 (2011). [Google Scholar]
- 40.Joshi NA & Fass JN Sickle: A sliding-window, adaptive, quality-based trimming tool for FastQ files (Version 1.33) Software (2011). [Google Scholar]
- 41.Langmead B & Salzberg SL Fast gapped-read alignment with Bowtie 2. Nat. Methods 9, 357–359 (2012). [DOI] [PMC free article] [PubMed] [Google Scholar]
- 42.Peng Y, Leung HCM, Yiu SM & Chin FYL IDBA-UD: a de novo assembler for single-cell and metagenomic sequencing data with highly uneven depth. Bioinformatics 28, 1420–1428 (2012). [DOI] [PubMed] [Google Scholar]
- 43.Li D, Liu C-M, Luo R, Sadakane K & Lam T-W MEGAHIT: an ultra-fast single-node solution for large and complex metagenomics assembly via succinct de Bruijn graph. Bioinforma. Oxf. Engl 31, 1674–1676 (2015). [DOI] [PubMed] [Google Scholar]
- 44.Seemann T Prokka: rapid prokaryotic genome annotation. Bioinformatics 30, 2068–2069 (2014). [DOI] [PubMed] [Google Scholar]
- 45.Liao Y, Smyth GK & Shi W featureCounts: an efficient general purpose program for assigning sequence reads to genomic features. Bioinformatics 30, 923–930 (2014). [DOI] [PubMed] [Google Scholar]
- 46.Buchfink B, Xie C & Huson DH Fast and sensitive protein alignment using DIAMOND. Nat. Methods 12, 59–60 (2015). [DOI] [PubMed] [Google Scholar]
- 47.Camacho C et al. BLAST+: architecture and applications. BMC Bioinformatics 10, 421 (2009). [DOI] [PMC free article] [PubMed] [Google Scholar]
- 48.Mistry J, Finn RD, Eddy SR, Bateman A & Punta M Challenges in homology search: HMMER3 and convergent evolution of coiled-coil regions. Nucleic Acids Res 41, e121 (2013). [DOI] [PMC free article] [PubMed] [Google Scholar]
- 49.Chen RY et al. Duodenal microbiota in stunted undernourished children with enteropathy. N. Engl. J. Med 383, 321–333 (2020). [DOI] [PMC free article] [PubMed] [Google Scholar]
- 50.Plerou V et al. Random matrix approach to cross correlations in financial data. Phys. Rev. E 65, 066126 (2002). [DOI] [PubMed] [Google Scholar]
- 51.Winkler ES et al. Human neutralizing antibodies against SARS-CoV-2 require intact Fc effector functions for optimal therapeutic protection. Cell 184, 1804–1820 (2021) [DOI] [PMC free article] [PubMed] [Google Scholar]
- 52.Zou W et al. Ablation of fat cells in adult mice induces massive bone gain. Cell Metab 32, 801–813.e6 (2020). [DOI] [PMC free article] [PubMed] [Google Scholar]
- 53.Adamo L et al. Proteomic signatures of heart failure in relation to left ventricular ejection fraction. J. Am. Coll. Cardiol 76, 1982–1994 (2020). [DOI] [PMC free article] [PubMed] [Google Scholar]
- 54.Tsingas M et al. Sox9 deletion causes severe intervertebral disc degeneration characterized by apoptosis, matrix remodeling, and compartment-specific transcriptomic changes. Matrix Biology 94, 110–133 (2020). [DOI] [PMC free article] [PubMed] [Google Scholar]
- 55.Joly JH, Lowry WE & Graham NA Differential Gene Set Enrichment Analysis: A statistical approach to quantify the relative enrichment of two gene sets. Bioinformatics (2020) doi: 10.1093/bioinformatics/btaa658. [DOI] [PMC free article] [PubMed] [Google Scholar]
- 56.Wickham H ggplot2: Elegant graphics for data analysis (Springer-Verlag, 2009). doi: 10.1007/978-0-387-98141-3. [DOI] [Google Scholar]
- 57.Blakeney AB, Harris PJ, Henry RJ & Stone BA A simple and rapid preparation of alditol acetates for monosaccharide analysis. Carbohydr. Res 113, 291–299 (1983). [Google Scholar]
- 58.Englyst HN & Cummings JH Improved method for measurement of dietary fiber as non-starch polysaccharides in plant foods. J. Assoc. Off. Anal. Chem 71, 808–814 (1988). [PubMed] [Google Scholar]
- 59.Blumenkrantz N & Asboe-Hansen G New method for quantitative determination of uronic acids. Anal. Biochem 54, 484–489 (1973). [DOI] [PubMed] [Google Scholar]
- 60.Thibault J-F Automatisation du dosage des substances pectiques par la méthode au métahydroxydiphényle. Lebensm. Wiss. Technol 12, 247–251 (1979). [Google Scholar]
- 61.Filisetti-Cozzi TMCC & Carpita NC Measurement of uronic acids without interference from neutral sugars. Anal. Biochem 197, 157–162 (1991). [DOI] [PubMed] [Google Scholar]
- 62.Levigne S, Thomas M, Ralet M-C, Quemener B & Thibault J-F Determination of the degrees of methylation and acetylation of pectins using a C18 column and internal standards. Food Hydrocolloids 16, 547–550 (2002). [Google Scholar]
- 63.Pettolino FA, Walsh C, Fincher GB & Bacic A Determining the polysaccharide composition of plant cell walls. Nature Protoc 7, 1590–1607 (2012). [DOI] [PubMed] [Google Scholar]
- 64.Buffetto F et al. The deconstruction of pectic rhamnogalacturonan I unmasks the occurrence of a novel arabinogalactan oligosaccharide epitope. Plant Cell Physiol 56, 2181–2196 (2015). [DOI] [PubMed] [Google Scholar]
- 65.Amicucci MJ et al. A rapid-throughput adaptable method for determining the monosaccharide composition of polysaccharides. Int. J. Mass Spectrom 438, 22–28 (2019). [Google Scholar]
- 66.Xu G, Amicucci MJ, Cheng Z, Galermo AG & Lebrilla CB Revisiting monosaccharide analysis - quantitation of a comprehensive set of monosaccharides using dynamic multiple reaction monitoring. Analyst 143, 200–207 (2017). [DOI] [PMC free article] [PubMed] [Google Scholar]
- 67.Galermo AG et al. Liquid chromatography-tandem mass spectrometry approach for determining glycosidic linkages. Anal. Chem 90, 13073–13080 (2018). [DOI] [PMC free article] [PubMed] [Google Scholar]
- 68.Galermo AG, Nandita E, Castillo JJ, Amicucci MJ & Lebrilla CB Development of an extensive linkage library for characterization of carbohydrates. Anal. Chem 91, 13022–13031 (2019). [DOI] [PMC free article] [PubMed] [Google Scholar]
- 69.Cowardin CA et al. Mechanisms by which sialylated milk oligosaccharides impact bone biology in a gnotobiotic mouse model of infant undernutrition. Proc. Natl. Acad. Sci. U S A 116, 11988–11996 (2019). [DOI] [PMC free article] [PubMed] [Google Scholar]
- 70.Code for HOSVD (CP-ALS plus randomization code) and CC-SVD is available on Zenodo. doi: 10.5281/zenodo.4767887. [DOI]
Associated Data
This section collects any data citations, data availability statements, or supplementary materials included in this article.