Abstract
Polarized light microscopy provides high contrast to birefringent specimen and is widely used as a diagnostic tool in pathology. However, polarization microscopy systems typically operate by analyzing images collected from two or more light paths in different states of polarization, which lead to relatively complex optical designs, high system costs, or experienced technicians being required. Here, we present a deep learning-based holographic polarization microscope that is capable of obtaining quantitative birefringence retardance and orientation information of specimen from a phase-recovered hologram, while only requiring the addition of one polarizer/analyzer pair to an inline lensfree holographic imaging system. Using a deep neural network, the reconstructed holographic images from a single state of polarization can be transformed into images equivalent to those captured using a single-shot computational polarized light microscope (SCPLM). Our analysis shows that a trained deep neural network can extract the birefringence information using both the sample specific morphological features as well as the holographic amplitude and phase distribution. To demonstrate the efficacy of this method, we tested it by imaging various birefringent samples including, for example, monosodium urate and triamcinolone acetonide crystals. Our method achieves similar results to SCPLM both qualitatively and quantitatively, and due to its simpler optical design and significantly larger field-of-view this method has the potential to expand the access to polarization microscopy and its use for medical diagnosis in resource limited settings.
Keywords: polarization microscopy, holographic microscopy, deep learning, convolutional neural networks, on-chip microscopy, lensless microscopy
Graphical abstract
Polarized light microscopy is widely used as a diagnostic tool in pathology, as it introduces distinctive contrast to birefringent specimen.1 A number of diseases, such as squamous cell carcinoma,2 primary cutaneous amyloidosis,3 cerebral amyloid angiopathy,4 and senile cardiovascular amyloid5 can be diagnosed using various polarization imaging techniques. Since 1961, compensated polarized light microscopy (CPLM) has been the gold standard imaging technique to identify monosodium urate (MSU)6 crystals in synovial fluid samples7 and is used to diagnose gout and pseudogout.8 CPLM operates by allowing linearly polarized white light illumination to pass through a full-waveplate designed for green light (commonly between 530 to 560 nm), which in combination with a linear polarizer/analyzer, generates a magenta background. The presence of a birefringent specimen within the light path changes the polarization state of the green light, which shifts the spectrum after the analyzer and results in the final image becoming yellow or blue.
While CPLM images are treated as the gold standard for MSU crystal detection, the effort is labor intensive as microscopes have limited fields-of-view (FOV), and therefore mechanical scanning is required to inspect the whole sample area. In addition to having a limited FOV, the CPLM technique suffers from limitations such as requiring manual alignment of the polarizer in relation to the analyzer, limited focal depth with higher-magnification objectives, and limited sensitivity when being used to detect small crystals or crystals with weak birefringence. As a result, CPLM analysis is sensitive to both the concentration of the crystals in synovial fluid9 and the experience of the diagnostician/technician.10 Finally, clinical CPLM reporting is limited to qualitative results (e.g., presence or absence of crystals on the slide and whether crystals are intra- or extracellular).
There are a number of alternative polarization microscopy methods which have been developed to produce quantitative images of birefringent specimen. These methods all use the same principles of operation: they collect images from two or more light paths with either the polarizer or the analyzer oriented differently in order to infer the Stokes/Jones parameters that define the birefringent specimen.11-15 Among these methods, Jones phase microscopy14 and polarization holographic microscopy (PHM)15 are two examples, where both systems take advantage of the amplitude and phase information of the reconstructed interferogram and measure spatially resolved Jones matrix components of anisotropic samples using four different polarization states. However, these types of systems in general require the use of relatively sophisticated and costly optical components to maintain a linear mapping between the measurements and the inferred Jones parameters.
Various methods have demonstrated that the retardance and orientation information channels, especially for biological samples, provide some of the most useful spatial features corresponding to birefringent specimen.16-18 Because of the reduction of the number of unknown parameters, these methods usually have simpler optical designs compared to, for example, PHM. Among these, a technique known as single-shot computational polarized light microscopy (SCPLM)18 that uses a pixel-wise polarized image sensor with four polarization directions has been demonstrated to simplify the optical system required to image birefringent samples. Using this method, the retardance and orientation of the sample are explicitly solved, providing quantitative contrast for birefringent specimen. While these methods are quite effective, both PHM and SCPLM are lens-based imaging systems. Therefore, they suffer from the small field of view of objective lenses and a relatively high system cost. One method which can get past these limitations is wide-field lensfree differential holographic polarized microscopy.19,20 By taking advantage of the simple optical design and unit magnification of lensfree on-chip holographic systems, this method can achieve a FOV of >20–30 mm2.21-23 Furthermore, the technique is cost-effective, compact, and suitable for resource-limited settings.24,25 However, in order for this lensfree holographic imaging method to be used for the imaging of birefringent objects, two sets of raw holograms must be taken with illuminations in two different polarization states, which require precise image alignment, especially for the detection of small birefringent objects within the sample. Furthermore, this method does not resolve the retardance or orientation of the sample, leading to lower contrast compared to the SCPLM method.
In parallel to these advances in computational polarization microscopy, deep learning has emerged as a highly effective technique for solving inverse problems in microscopy.26,27 It has been applied to traditional inverse problems such as holographic image reconstruction,28-30 reconstruction of color images,31 super-resolution,32 as well as to perform cross-modality image transformations such as virtual labeling of histological tissues,33 live cells,34 and to give brightfield image contrast to holographic images.35
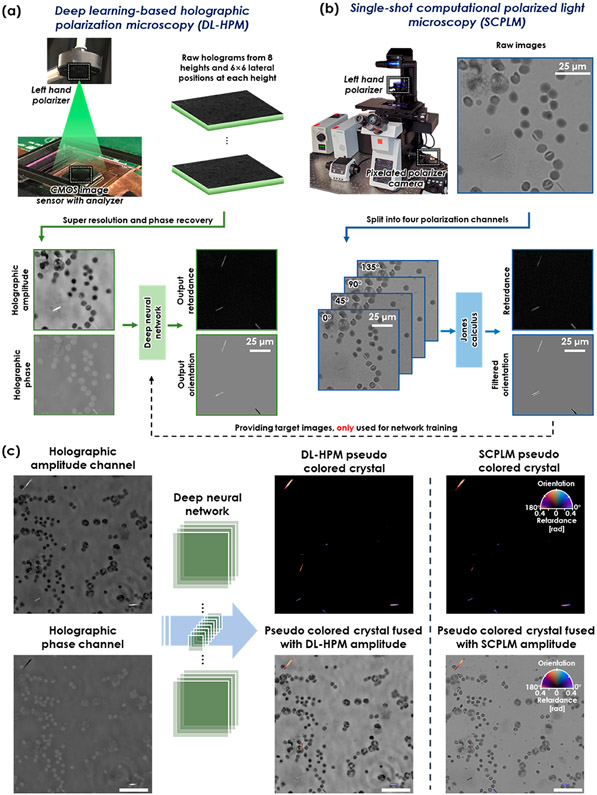
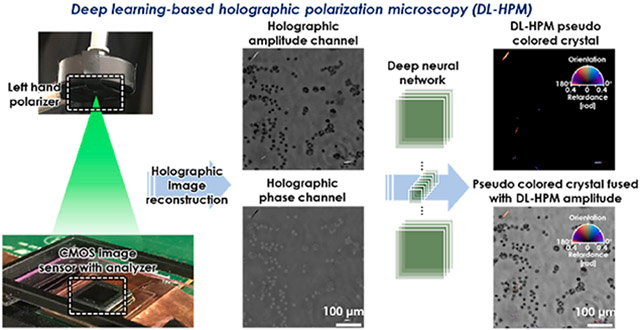
Here, we build upon these advances and present a novel deep learning-based holographic polarization microscope (DL-HPM) which can provide the retardation and orientation of birefringent specimen using a single phase-retrieved hologram that encodes one state of polarization (Figure 1). This system requires only minor changes to the existing imaging hardware, that is, the addition of a polarizer/analyzer set to a standard inline lensfree holographic microscope. Our framework uses SCPLM images as the ground truth to train a deep neural network (Figure 1b), which uses this image data to learn how to transform the information encoded within a reconstructed hologram into an image that directly reveals the specimen’s birefringence retardance and orientation. In addition to achieving a comparable image quality to the SCPLM images (Figure 1c), this deep learning-enabled lensfree microscopy method has a FOV of >20 mm2 using a cost-effective optical design. The performance of DL-HPM is demonstrated using MSU and triamcinolone acetonide (TCA) crystal samples as well as a corn starch sample, matching the performance to SCPLM, both qualitatively and quantitatively.
Figure 1.
(a) Schematic for deep learning-based holographic polarization microscopy (DL-HPM). Raw holograms are collected using a lensfree holographic microscope with a customized polarizer and analyzer. A trained neural network is used to transform the reconstructed holographic amplitude and phase images into the birefringence retardance and orientation images. (b) Schematic for single-shot computational polarized light microscopy (SCPLM). Images are collected with a four-channel pixelated polarized camera under circularly polarized illumination. Birefringent retardance and orientation channels are computed using Jones calculus, and the amplitude image is obtained by averaging the four polarization channels. SCPLM is used as the ground truth information channel, providing the network training target for DL-HPM. (c) Blind testing of DL-HPM. A new clinical sample (containing MSU crystals) collected from a deidentified patient is tested using DL-HPM. Birefringent samples are given a pseudo color using the same convention according to the compensated polarized light microscopy. Similar image quality was achieved compared to SCPLM images. Scale bar: 50μm.
We believe that the presented deep-learning based polarization microscopy approach could be widely used as a diagnostic tool in pathology and other fields that need to rapidly process and reveal the unique signatures of various birefringent crystals within complex specimen such as synovial fluid samples.
RESULTS
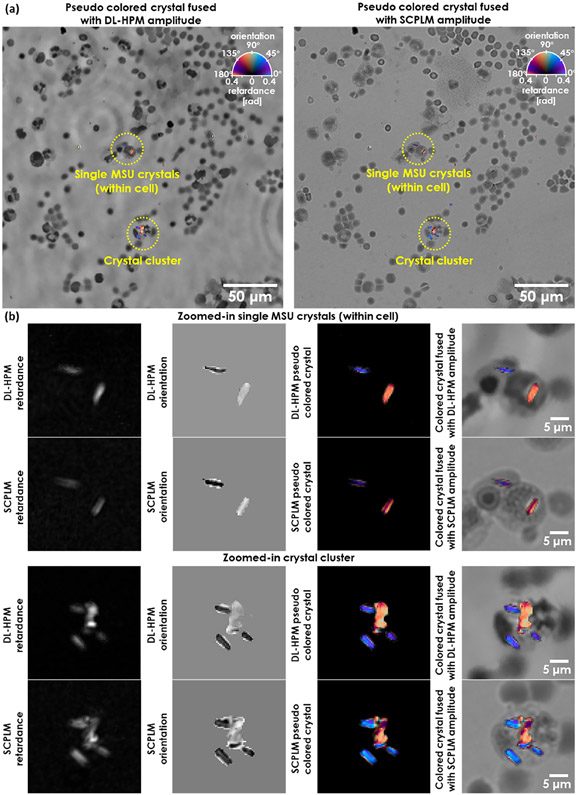
We trained a deep neural network (see Methods) using six clinical samples containing MSU crystals, collected from six deidentified patients, to perform an image transformation from an input holographic image (amplitude and phase) to the birefringence retardance and orientation images at the output of the network. The slides were all reviewed using CPLM (Olympus BX-51) by our clinical expert (JF) for the presence of MSU crystals. This analysis found that the majority of the birefringent crystals within these samples are needle-shaped MSU crystals. Once trained, the neural network was blindly tested with two additional MSU slides from two new patients; Figure 2a shows the blind output of the DL-HPM method in comparison to the SCPLM method. The birefringent crystals within the FOV are colored using a calibrated colormap according to the CPLM convention, where the background is left in grayscale to enhance the contrast. Figure 2b further shows two representative zoomed-in regions for both single MSU crystals (within a blood cell) and a crystal cluster. These images demonstrate that our deep learning framework is capable of accurately locating the birefringent objects and giving them a high color contrast with respect to the nonbirefringent cell background within the FOV.
Figure 2.
Imaging performance of DL-HPM. (a) Images generated using DL-HPM compared against coregistered images captured using SCPLM for a blindly tested MSU sample. The birefringent MSU crystals are colored according to CPLM convention after obtaining the retardance and orientation channels using each method. The pseudocolored retardance and orientation information is also fused with the amplitude channel to show the high contrast against the nonbirefringent cell background achieved by both methods. (b) Two different zoomed-in regions cropped from (a).
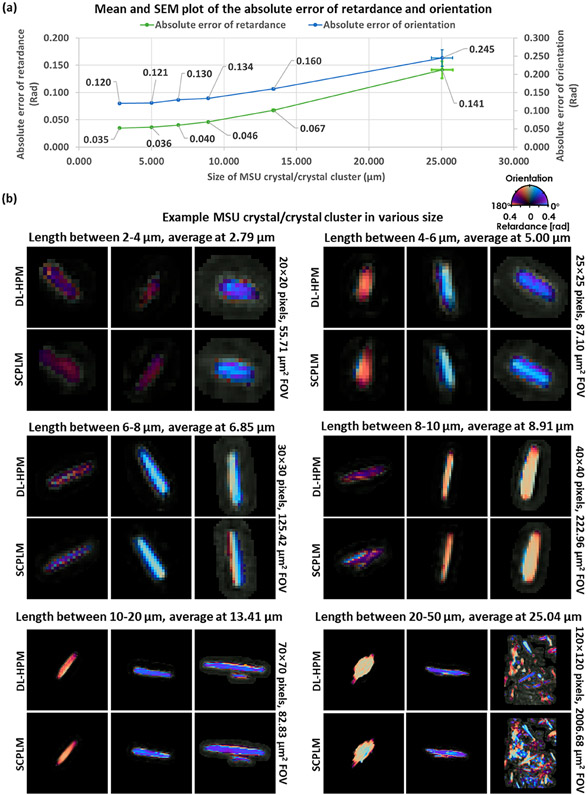
To quantify the performance of our method, 3432 different birefringent objects were detected and analyzed. These objects were composed of individual MSU crystals (most common), MSU crystal clusters, or protein clusters (rare). We classified the birefringent objects according to their length and analyzed each of these categories separately. The classification was performed by first setting a 0.2 Rad threshold on the retardance channel in SCPLM target to convert it into a binary mask. Then, using these masks, connected component analysis was performed to classify each object into different length categories. For each detected birefringent object in the SCPLM, the same coordinates were also used to locate the corresponding birefringent object in the coregistered DL-HPM. The absolute retardance/orientation error was computed pixel-wise and averaged by the number of pixels for each detected birefringent object at its local region within a 5-pixel radius of any edge of the object.
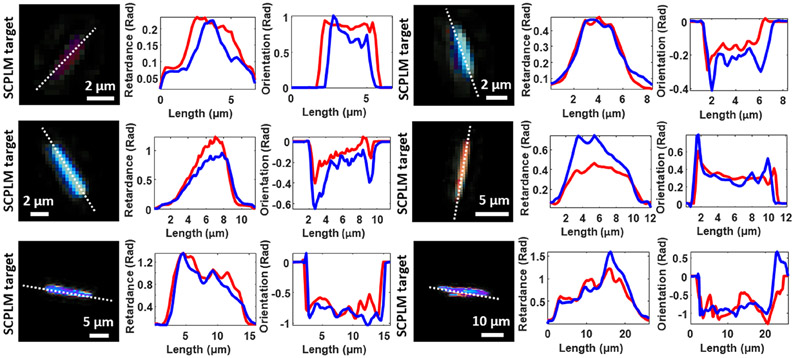
The results of this quantitative analysis are reported in Figure 3a with sample FOVs provided for visual comparison in Figure 3b. The minimum length of the crystals included in this analysis was selected to be 2 μm, representing an object with at least 5 pixels in length. Objects smaller than this threshold had insufficient resolution to assign a crystal type accurately. In total, six length categories were selected: 2–4 μm (1077 objects), 4–6 μm (582 objects), 6–8 μm (454 objects), 8–10 μm (466 objects), 10–20 μm (795 objects), and 20–50 μm (58 objects). The error was first computed and averaged pixel-wise for each detected birefringent object, and then averaged object-wise to obtain the statistics reported in Figure 3a. The overall object-wise averaged absolute error between the SCPLM results and the DL-HPM results was 0.047 Rad in the retardance channel and 0.135 Rad in the orientation channel, where the retardance and orientation channels range from 0 to π/2 and 0 to π, respectively. In order to further compare the performance of the DL-HPM with SCPLM, we plot in Figure 4 the cross sections of the retardance and orientation channels for various crystals selected from the middle column of Figure 3b in each length category. These results reveal that DL-HPM can quantitatively transform the holographic amplitude/phase information that is acquired at a single polarization state into birefringence retardance and orientation image channels, closely matching the results of SCPLM.
Figure 3.
Quantitative performance of DL-HPM, compared against SCPLM results. (a) Mean and standard error of the mean (SEM) plots of the absolute error. DL-HPM achieves an overall object-wise averaged absolute error of 0.047 Rad in the retardance channel and 0.135 Rad in the orientation channel. (b) Sample birefringent objects. For each length category, the left image is the smallest object, the right image is the largest, while the middle one has the median size.
Figure 4.
Cross sectional plots of the retardance and orientation channels obtained by DL-HPM output and SCPLM target. The blue curve represents the output of DL-HPM, while the red curve represents the target from SCPLM.
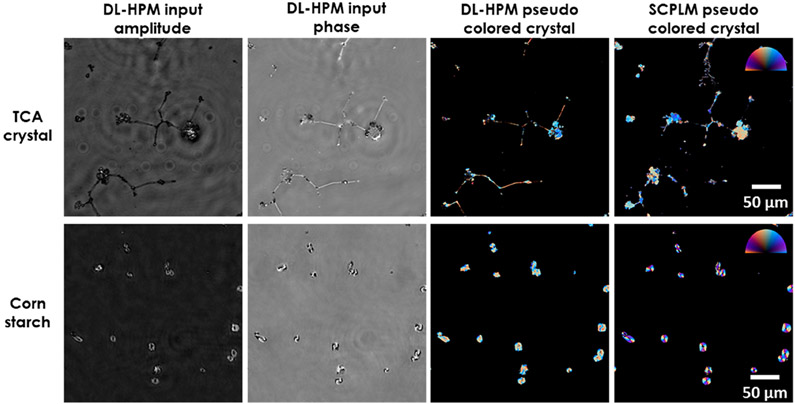
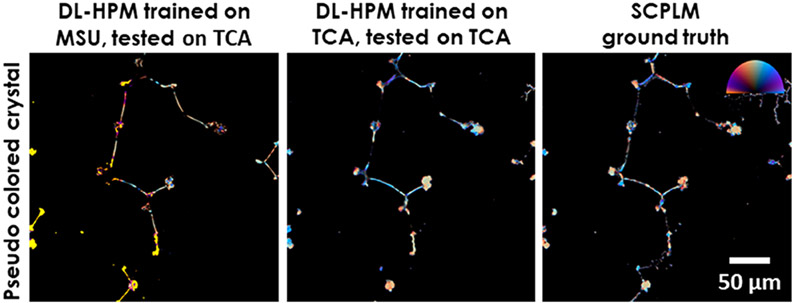
To further investigate the image transformation performed by the trained deep network, next we blindly tested it on two new types of birefringent samples that were never seen by the network during its training; for this purpose, we imaged TCA crystals and corn starch samples (Figure 5). The results revealed that DL-HPM can correctly identify birefringence in most of the TCA crystals and corn starch particles within the sample FOV. This is an indication that the presented DL-HPM method is learning a combination of the desired physical image transformation and a semantic segmentation which is related to morphological information of the samples. However, the network is observed to be less accurate when applied to these new types of samples compared to when it is tested upon samples of the same type with which it was trained. Therefore, transfer learning was used to improve its generalization for new types of samples. As expected, once the same network is further trained using transfer learning with these new types of samples, its blind inference performance can be improved, which is illustrated in Figure 6.
Figure 5.
Imaging performance of DL-HPM on new types of birefringent samples. Visualization of birefringent TCA crystals and corn starch samples imaged using DL-HPM method, where the associated deep network is trained with only birefringent MSU crystals. Color bar: from left to top to right, represents π, π/2, 0 Rad in the orientation channel. Retardance is represented by the distance from the center of the color bar, ranging from 0 to 0.4.
Figure 6.
Comparison of two different deep neural networks for imaging TCA samples using DL-HPM. The first network is trained with only MSU samples, and the second network is trained through transfer learning from the original MSU network with a training data set containing TCA samples. Color bar: from left to top to right, represents π, π/2, 0 Rad in the orientation channel. Retardance is represented by the distance from the center of the color bar, ranging from 0 to 0.4.
DISCUSSION
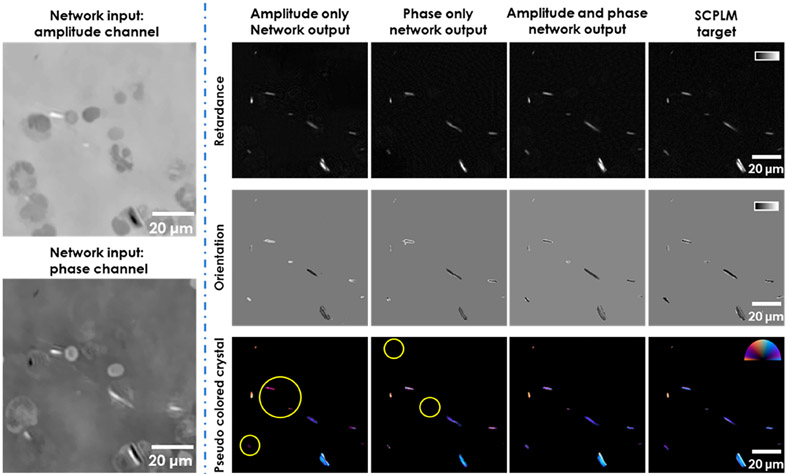
Our results have qualitatively and quantitatively demonstrated the effectiveness of the presented framework using multiple types of samples, also illustrating the capability of the networks to generalize from one sample type to another. However, the black box nature of deep neural networks often makes it challenging to determine how the transformation is actually performed. In this section, we perform an ablation study aiming to partially reveal the physical interpretation of the deep neural network and demonstrate that the network is learning to perform crystal segmentation based on both the morphological information and the physical relationship between the holographic amplitude/phase information and the birefringent retardance/orientation channels. For this analysis, we trained two additional networks using the MSU image data set: (1) using only the holographic amplitude channel as the input to the neural network to blindly perform the retardance/orientation inference; and (2) using only the holographic phase channel as the input to the neural network to blindly perform the retardance/orientation inference. Examples of the blind inference performance of these trained networks are shown in Figure 7.
Figure 7.
DL-HPM reconstruction results using different input channels. The performance of DL-HPM in general degraded when reducing the input channel to amplitude only or phase only information. Color bar for retardance, from black to white, represents 0 to 1 Rad. Color bar for orientation, from black to white, represents −π/2 to π/2. Color bar for pseudo colored crystals, from left to top to right, represents π, π/2, 0 Rad in the orientation channel. Retardance is represented by the distance from the center of the color bar, ranging from 0 to 0.4. The circled crystals for the amplitude only network show that the network is capable of reconstructing the crystal features in the correct location, but the color is inaccurate due to the errors in the orientation channel. The circled crystals for the phase-only network are either entirely missing or have a retardance that is too low, rejected by the pseudo coloring scheme.
In general, using only the amplitude or only the phase channel, as opposed to using both channels together, significantly degrades the inference performance of the network. The amplitude only network tends to accurately predict the crystals but generates images with significant error in the orientation channel, whereas the phase only network tends to predict the locations of the crystals in the retardance channel less accurately. One possible explanation for this observation is that the amplitude only network is learning morphological information to locate the crystals, as the holographic optical system was designed to introduce intensity contrast for birefringent samples19 and the additional phase information is required to fully reconstruct the orientation channel. Hence, both the amplitude and phase information channels are essential to accurately infer the retardance and orientation of birefringent samples. This conclusion is also supported by analyzing the formulation of HPM, which will be discussed next.
The evolution of the polarization state in our optical setup (Figure 1a) can be analyzed using Jones calculus (see Methods), where for each pixel of the reconstructed holographic amplitude and phase images we can write
| (1) |
where atan 2(y, x) is the four-quadrant inverse tangent function for point (x, y), Arecon is the normalized reconstructed amplitude, φrecon is the normalized reconstructed phase (with zero phase in the background), β represents the orientation of the linear polarizer with respect to the x-axis (see Methods), and a and b are defined as
| (2) |
θ represents the orientation of the fast axis of the sample with respect to the x-axis, and η represents the relative phase retardance.
Unlike the SCPLM method, where the retardance, η, and the orientation, θ, are encoded in symmetrical equations with a straightforward analytical solution (detailed in the Supporting Information), eqs 1 and 2 encode the birefringence information in a much more convoluted form. Because of the experimental challenges in obtaining an accurate estimate of β as well as the potential phase wrapping related issues, independently solving eqs 1 and 2 in a pixel-by-pixel manner could result in errors or spatial inconsistencies/artifacts at the output retardance and orientation images. Hence, it elevates the need for a more advanced solution and a robust method such as a deep neural network, which is trained to perform an image-to-image transformation by making use of all the information from multiple pixels within a FOV simultaneously. Stated differently, through image data the deep neural network learns to solve eqs 1 and 2 over an input FOV, where all the pixels within the complex-valued input image (phase and amplitude) are simultaneously processed to generate the desired output image channels, that is, the retardance (η) and the orientation (θ) images.
CONCLUSION
We presented a deep learning-enabled holographic polarization microscope. This framework is advantageous as it only requires the measurement of a single polarization state which can be generated using a simple optical setup and is capable of accurately reconstructing the quantitative birefringent retardance and orientation information of the specimen. These information channels can dramatically simplify the automatic detection, counting, and classification of birefringent objects within complex media. After necessary regulatory testing and approvals, our method can be the basis of a rapid point-of-care crystal detection and analysis instrument with automated crystal identification and classification capabilities, which could significantly simplify the clinical procedures used to diagnose diseases related to birefringent crystals, such as gout and pseudogout. Finally, we also expect our DL-HPM method to benefit a wider range of technical fields for both research and industrial applications, for example, surface defect detection and air quality monitoring.36
METHODS
Lensfree Polarization Imaging Setup.
The presented DL-HPM system utilizes a customized lensfree holographic polarization microscope to capture the input images (Figure 1a). This microscope is able to generate quantitative phase images as well as introduce an intensity contrast to birefringent objects (though it is unable to differentiate high-absorbance nonbirefringent objects19). The microscope uses a laser source filtered by an acousto-optic tunable filter (AOTF) for illumination at 530 nm (~2.5 nm bandwidth). The raw holograms were collected using a CMOS image sensor (IMX 081, Sony, 1.12 μm pixel size) at eight sample-to-sensor heights, which were used for multiheight phase recovery.37 A set of low-resolution holograms were captured at 6 × 6 lateral positions, which were used for pixel-super resolution. Using these images, a high-resolution holographic image was reconstructed and subsequently numerically back-propagated38 to the sample plane using an autofocusing algorithm.39 Finally, the reconstructed hologram was normalized to obtain an average background amplitude of 1 and have an average background phase of 0. These normalized images were then passed through the neural network. Details of the holographic image reconstruction techniques including free space propagation, multiheight phase recovery, super resolution, and autofocusing are presented in the Supporting Information.
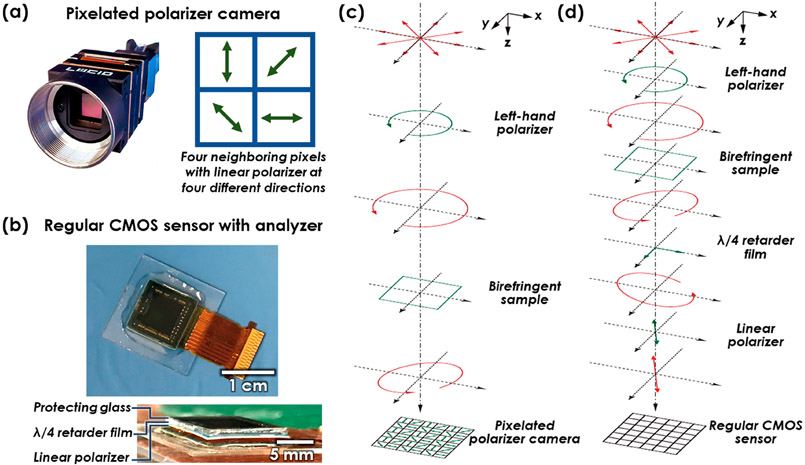
To enable detection of the birefringence within the sample, a left-hand polarizer and a customized analyzer were added in the holographic imaging system.19 Unlike traditional polarization microscopes, where a second circular polarizer (i.e., right-hand polarizer) can be used as the analyzer, holographic imaging systems require background light to form an interference pattern, and the direct use of another circular polarizer would completely reject the background light. Therefore, we designed the analyzer to use a λ/4 retarder film (75 μm thickness, Edmund Optics) and a linear polarizer (180 μm thickness, Edmund Optics) having the fast axis of the λ/4 retarder oriented to 25° with respect to the linear polarizer, creating a holographic polarization microscope. These films were affixed directly to the CMOS image sensor using an ultraviolet (UV)-curable adhesive (NOA 68, Norland Products, Cranbury, NJ) as shown in Figure 8b.
Figure 8.
(a) Photo of the four-channel pixelated polarizer camera. This camera is used in SCPLM. When illuminated with circularly polarized light, four channels with different polarization states are acquired using a single image. (b) Photo of the CMOS image sensor with a customized analyzer. This imager is used for DL-HPM. The analyzer film is directly bound to the CMOS image sensor, allowing a certain amount of background light to form the hologram, while also providing one polarization channel to sense the birefringent sample. (c) Polarization design for SCPLM. The red plot represents the light polarization state at each plane. The green plot represents an optical component that changes the polarization state. (d) Polarization design for DL-HPM..
Polarization Encoding in the Holographic Imaging System.
In the analysis of our holographic imaging system, we assume that the sample, polarizer, and analyzer are thin and have negligible gaps between them. We further assume that the light diffracts from the analyzer onto the image sensor after being converted to linearly polarized light by the last layer of the analyzer. Therefore, after its reconstruction the hologram becomes in-focus at the sample plane (the thicknesses of both the sample and the analyzer are assumed to be negligible).
The evolution of the polarization in our imaging system can be analyzed using Jones calculus.40 The light field in the presented framework was designed to be transmitted through a left-hand polarizer, birefringent sample, λ/4 retardation plate and a linear polarizer (Figure 8d). Each of these optical components can be formulated as
- Input left-hand circularly polarized (LHCP) light:
where i2 = −1, and LHCP is defined from the point of view of the source.(3) - Birefringent sample:
where θ represents the orientation of the fast axis of the sample with respect to the x-axis, and η represents the relative phase retardance.(4) - λ/4 retarder:
where α represents the orientation of the fast axis of the λ/4 retarder with respect to the x-axis.(5) - Linear polarizer:
where β represents the orientation of the linear polarizer with respect to the x-axis.(6)
The output light field can then be expressed as
| (7) |
Equations 1 and 2 reported in Discussion are obtained by rearranging eq 7 and applying a background normalization step (detailed in the Supporting Information).
Data Set Preparation.
The neural networks were trained using image pairs captured using both SCLPM and the holographic imaging systems. We used six clinical MSU samples for training and two additional MSU samples for testing. To ensure that the network training can generalize to new samples, the slides used to train the neural network were chosen to have different concentrations of MSU crystals (example FOVs of each slide are shown in Supporting Information Figure S1). In addition, a single TCA sample was used for both training and testing (where blind testing was performed on new regions); similarly, a single starch sample was used for blind testing. All samples were aligned to have the same angle relative to the polarizer-analyzer pair in each imaging system.
In order to train the neural network to learn the image transformation from a lensfree holographic imaging modality to a lens-based SCPLM system, an accurately coregistered training data set is required. This coregistration begins by bicubic down-sampling the target polarization images by a factor of 0.345/0.373 (obtained with the benchtop microscope) to match the pixel size of the holographic microscope; the ground truth images were created using SCPLM with an effective pixel size of 0.345 μm, whereas the holographic images used as the network input have an effective pixel size of 0.373 μm. Next, a rough matching between the two sets of images is obtained by finding the overlapping area with maximum correlation between the amplitude channels of the images. Once the images have been roughly aligned, global matching is performed by applying an affine transformation calculated using MATLAB’s multimodal image registration framework.41 This framework extracts features from the amplitude channel of the images and matches them with the affine matrix Next, large fields of view were cropped and matched to each other using an elastic pyramidal registration algorithm, which allows for pixel level matching42 based upon the amplitude channel of the images. As discussed above, these holograms were normalized to have an average background amplitude of 1, and an average background phase of 0, before being passed through the neural network. This normalization step helps the neural network to be applied more consistently to different samples. The orientation of areas of the polarization images without any birefringence are set to zero to eliminate noise in the labels. This is done by setting the orientation value of any pixel below a threshold in the corresponding retardance channel to zero.
Neural Network.
A Generative Adversarial Network (GAN) framework was used to perform the image transformation reported in this paper. In addition to this GAN loss, a mean absolute error (L1) loss was used to ensure that the transformation is accurate, and a total variation (TV) loss is used as a regularization term. GANs use two separate networks for their operation. A generator network (G(·)) is used to transform the holographic images into their polarization counterparts. A second network known as the discriminator (D(·)) is used to discriminate between the ground truth images (z) and the generated images (G(x)). The two networks learn from one another with the generator gradually learning how to create images that match the feature distribution of the target data set, while the discriminator gets better at distinguishing between ground truth images and their generated counterparts.
The overall loss function can be described as
| (8) |
where λ1 and λ2 are constants used to balance the various terms of the loss function. The L1 loss, which ensures that the transformation performed by the network is accurate, was balanced to make up ~25% of the total loss function, whereas the total variation loss makes up ~0.5% of the overall loss function. The L1 loss is defined as
| (9) |
where K is the number of image channels (k = 1 represents the retardance channel, and k = 2 represents the orientation channel), M and N are the number of pixels on each axis, and i and j represent the pixel indices of the image. The total variation loss, used to regularize the loss function and reduce noise, is defined as
| (10) |
In order to train the discriminator a separate loss function is used, defined as
| (11) |
Depending on the exact data set being used and the application of interest, the relative weights of the different portions of these loss functions, or even the makeup of the loss function itself can be changed. A comparison, illustrating the impact of using alternate loss functions, is reported in the Supporting Information Figure S2.
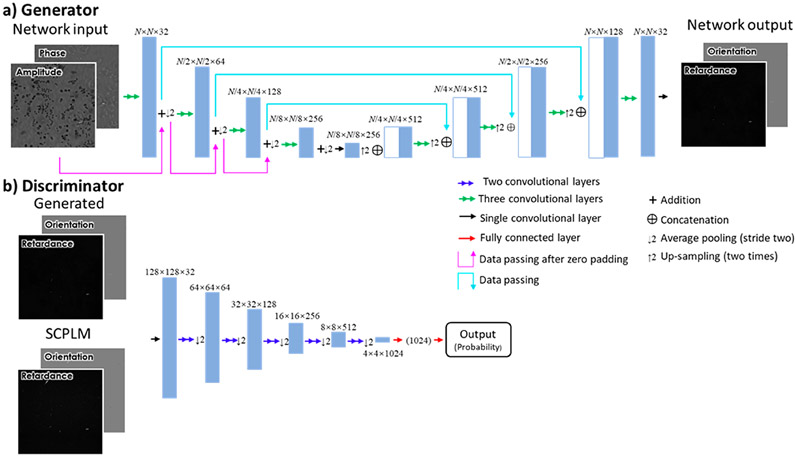
The generator network uses the U-net architecture,43 as shown in Figure 9a. The U-net architecture is selected as this architecture has been shown to be highly effective to transform features at multiple different scales. This U-net begins with a convolutional layer increasing the number of channels to 32 and is made up of four “down-blocks” followed by four “up-blocks”. Each down-block consists of three convolutional layers, which together double the number of channels. These layers are followed by an average pooling layer with a kernel size and stride of 2. After these down-blocks, an equal number of up-blocks are applied. The up-blocks begin by bilinear up-sampling the images and similarly apply three convolutional layers and reduce the number of channels by a factor of 4. Between the two sets of blocks, skip connections are added. The skip connections allow small scale data to pass through the network, avoiding the effects of the down-sampling by concatenating the output of each down-block with the input to each up-block. Following these blocks, a convolutional layer reduces the number of channels to two, which match the two channels of the polarization images.
Figure 9.
Network architecture. (a) Diagram of the generator portion of the network. (b) Diagram of the discriminator portion of the network.
The discriminator network (Figure 9b) receives the generated images or the SCPLM images, and attempts to distinguish between the two. The discriminator is first made up of a convolutional layer which increases the number of channels from 3 to 32. This is followed by five blocks, each made up of two convolutional layers, the second of which doubling the number of channels and using a stride of two. Following these five blocks are two fully connected layers, which reduce the image to a single number which can have a sigmoid function applied to it.
Each convolutional layer uses a kernel size of 3 × 3 and is followed by the leaky rectified linear unit (LeakyReLU) activation function which is defined as
| (12) |
In the training phase, we used the adaptable movement estimation (Adam) optimizer, with a learning rate of 10−4 for the generator and 10−5 for the discriminator. The network begins with the generator being trained 7 times for each training of the discriminator with this ratio being reduced by 1 every 4000 iterations down to a minimum of 3. The network was trained for 30 000 iterations of the discriminator, taking 5 h using a standard consumer GPU. This training was performed using a single 2080 Ti (Nvidia), with Python version 3.6.0 and TensorFlow Version 1.11.0. MATLAB version R2018a was used for preprocessing.
We should also emphasize that training a network model is a one-time effort. For each new application that a new model is required, it can be generated using similar measurement and training procedures. However, once the new model is trained, it is ready to be distributed to a large number of end users without requiring extra cost or resources.
Supplementary Material
ACKNOWLEDGMENTS
The authors acknowledge the support of National Institutes of Health (NIH, R21AR072946).
Footnotes
The authors declare no competing financial interest.
Supporting Information
The Supporting Information is available free of charge at https://pubs.acs.org/doi/10.1021/acsphotonics.0c01051.
Details of the holographic image reconstruction, derivation of the mathematical models for SCPLM and DL-HPM, sources of error in DL-HPM, examples of different fields-of-views for the MSU image data set, as well as the investigation of using different loss functions on network training (PDF)
Contributor Information
Tairan Liu, Electrical and Computer Engineering Department, Department of Bioengineering, and California NanoSystems Institute, University of California, Los Angeles, California 90095, United States.
Kevin de Haan, Electrical and Computer Engineering Department, Department of Bioengineering, and California NanoSystems Institute, University of California, Los Angeles, California 90095, United States.
Bijie Bai, Electrical and Computer Engineering Department, Department of Bioengineering, and California NanoSystems Institute, University of California, Los Angeles, California 90095, United States.
Yair Rivenson, Electrical and Computer Engineering Department, Department of Bioengineering, and California NanoSystems Institute, University of California, Los Angeles, California 90095, United States.
Yi Luo, Electrical and Computer Engineering Department, Department of Bioengineering, and California NanoSystems Institute, University of California, Los Angeles, California 90095, United States.
Hongda Wang, Electrical and Computer Engineering Department, Department of Bioengineering, and California NanoSystems Institute, University of California, Los Angeles, California 90095, United States.
David Karalli, Electrical and Computer Engineering Department, University of California, Los Angeles, California 90095, United States.
Hongxiang Fu, Computational and Systems Biology Department, University of California, Los Angeles, California 90095, United States.
Yibo Zhang, Electrical and Computer Engineering Department, Department of Bioengineering, and California NanoSystems Institute, University of California, Los Angeles, California 90095, United States.
John FitzGerald, Division of Rheumatology, Department of Internal Medicine, David Geffen School of Medicine, University of California, Los Angeles, California 90095, United States.
Aydogan Ozcan, Electrical and Computer Engineering Department, Department of Bioengineering, California NanoSystems Institute, and Department of Surgery, David Geffen School of Medicine, University of California, Los Angeles, California 90095, United States.
REFERENCES
- (1).Wolman M Polarized Light Microscopy as a Tool of Diagnostic Pathology. J. Histochem. Cytochem 1975, 23 (1), 21–50. [DOI] [PubMed] [Google Scholar]
- (2).Arun Gopinathan P; Kokila G; Jyothi M; Ananjan C; Pradeep L; Humaira Nazir S Study of Collagen Birefringence in Different Grades of Oral Squamous Cell Carcinoma Using Picrosirius Red and Polarized Light Microscopy. Scientifica 2015. [DOI] [PMC free article] [PubMed] [Google Scholar]
- (3).Vijaya B; Dalal BS; Manjunath GV Primary Cutaneous Amyloidosis: A Clinico-Pathological Study with Emphasis on Polarized Microscopy. Indian Journal of Pathology and Microbiology 2012, 55 (2), 170. [DOI] [PubMed] [Google Scholar]
- (4).Jin L-W; Claborn KA; Kurimoto M; Geday MA; Maezawa I; Sohraby F; Estrada M; Kaminksy W; Kahr B Imaging Linear Birefringence and Dichroism in Cerebral Amyloid Pathologies. Proc. Natl. Acad. Sci. U. S. A 2003, 100 (26), 15294–15298. [DOI] [PMC free article] [PubMed] [Google Scholar]
- (5).Cornwell GG III; Murdoch WL; Kyle RA; Westermark P; Pitkänen P Frequency and Distribution of Senile Cardiovascular Amyloid: A Clinicopathologic Correlation. Am. J. Med 1983, 75 (4), 618–623. [DOI] [PubMed] [Google Scholar]
- (6).Mccarty DJ; Hollander JL Identification of Urate Crystals in Gouty Synovial Fluid. Ann. Intern. Med 1961, 54, 452–460. [DOI] [PubMed] [Google Scholar]
- (7).McGill NW; Dieppe PA Evidence for a Promoter of Urate Crystal Formation in Gouty Synovial Fluid. Ann. Rheum. Dis 1991, 50 (8), 558–561. [DOI] [PMC free article] [PubMed] [Google Scholar]
- (8).Gatter RA Editorial: The Compensated Polarized Light Microscope in Clinical Rheumatology. Arthritis Rheum. 1974, 17 (3), 253–255. [DOI] [PubMed] [Google Scholar]
- (9).Gordon C; Swan A; Dieppe P Detection of Crystals in Synovial Fluids by Light Microscopy: Sensitivity and Reliability. Ann. Rheum. Dis 1989, 48 (9), 737–742. [DOI] [PMC free article] [PubMed] [Google Scholar]
- (10).Park JW; Ko DJ; Yoo JJ; Chang SH; Cho HJ; Kang EH; Park JK; Song YW; Lee YJ Clinical Factors and Treatment Outcomes Associated with Failure in the Detection of Urate Crystal in Patients with Acute Gouty Arthritis. Korean J. Intern. Med 2014, 29 (3), 361–369. [DOI] [PMC free article] [PubMed] [Google Scholar]
- (11).Oldenbourg R; Mei G New Polarized Light Microscope with Precision Universal Compensator. J. Microsc 1995, 180 (2), 140–147. [DOI] [PubMed] [Google Scholar]
- (12).Colomb T; Dahlgren P; Beghuin D; Cuche E; Marquet P; Depeursinge C Polarization Imaging by Use of Digital Holography. Appl. Opt 2002, 41 (1), 27–37. [DOI] [PubMed] [Google Scholar]
- (13).Oldenbourg R Polarization Microscopy with the LC-PolScope. Live Cell Imaging: A Laboratory Manual; Cold Spring Harbor Laboratory Press: USA, 2005; pp 205–237. [Google Scholar]
- (14).Wang Z; Millet LJ; Gillette MU; Popescu G Jones Phase Microscopy of Transparent and Anisotropic Samples. Opt. Lett 2008, 33 (11), 1270–1272. [DOI] [PubMed] [Google Scholar]
- (15).Kim Y; Jeong J; Jang J; Kim MW; Park Y Polarization Holographic Microscopy for Extracting Spatio-Temporally Resolved Jones Matrix. Opt. Express 2012, 20 (9), 9948–9955. [DOI] [PubMed] [Google Scholar]
- (16).Aknoun S; Bon P; Savatier J; Wattellier B; Monneret S Quantitative Retardance Imaging of Biological Samples Using Quadriwave Lateral Shearing Interferometry. Opt. Express 2015, 23 (12), 16383–16406. [DOI] [PubMed] [Google Scholar]
- (17).Aknoun S; Aurrand-Lions M; Wattellier B; Monneret S Quantitative Retardance Imaging by Means of Quadri-Wave Lateral Shearing Interferometry for Label-Free Fiber Imaging in Tissues. Opt. Commun 2018, 422, 17–27. [Google Scholar]
- (18).Bai B; Wang H; Liu T; Rivenson Y; FitzGerald J; Ozcan A Pathological Crystal Imaging with Single-Shot Computational Polarized Light Microscopy. J. Biophotonics 2020, 13 (1), e201960036. [DOI] [PMC free article] [PubMed] [Google Scholar]
- (19).Zhang Y; Lee SYC; Zhang Y; Furst D; Fitzgerald J; Ozcan A Wide-Field Imaging of Birefringent Synovial Fluid Crystals Using Lens-Free Polarized Microscopy for Gout Diagnosis. Sci. Rep 2016, 6, 28793. [DOI] [PMC free article] [PubMed] [Google Scholar]
- (20).Oh C; Isikman SO; Khademhosseinieh B; Ozcan A On-Chip Differential Interference Contrast Microscopy Using Lensless Digital Holography. Opt. Express 2010, 18 (5), 4717–4726. [DOI] [PMC free article] [PubMed] [Google Scholar]
- (21).Greenbaum A; Luo W; Su T-W; Göröcs Z; Xue L; Isikman SO; Coskun AF; Mudanyali O; Ozcan A Imaging without Lenses: Achievements and Remaining Challenges of Wide-Field on-Chip Microscopy. Nat. Methods 2012, 9 (9), 889–895. [DOI] [PMC free article] [PubMed] [Google Scholar]
- (22).Bishara W; Su T-W; Coskun AF; Ozcan A Lensfree On-Chip Microscopy over a Wide Field-of-View Using Pixel Super-Resolution. Opt. Express 2010, 18 (11), 11181–11191. [DOI] [PMC free article] [PubMed] [Google Scholar]
- (23).Mudanyali O; Tseng D; Oh C; Isikman SO; Sencan I; Bishara W; Oztoprak C; Seo S; Khademhosseini B; Ozcan A Compact, Light-Weight and Cost-Effective Microscope Based on Lensless Incoherent Holography for Telemedicine Applications. Lab Chip 2010, 10 (11), 1417–1428. [DOI] [PMC free article] [PubMed] [Google Scholar]
- (24).Ozcan A; McLeod E Lensless Imaging and Sensing. Annu. Rev. Biomed. Eng 2016, 18 (1), 77–102. [DOI] [PubMed] [Google Scholar]
- (25).Zhu H; Isikman SO; Mudanyali O; Greenbaum A; Ozcan A Optical Imaging Techniques for Point-of-Care Diagnostics. Lab Chip 2013, 13 (1), 51–67. [DOI] [PMC free article] [PubMed] [Google Scholar]
- (26).de Haan K; Rivenson Y; Wu Y; Ozcan A Deep-Learning-Based Image Reconstruction and Enhancement in Optical Microscopy. Proc. IEEE 2020, 108 (1), 30–50. [Google Scholar]
- (27).Barbastathis G; Ozcan A; Situ G On the Use of Deep Learning for Computational Imaging. Optica, OPTICA 2019, 6 (8), 921–943. [Google Scholar]
- (28).Sinha A; Lee J; Li S; Barbastathis G Lensless Computational Imaging through Deep Learning. Optica, OPTICA 2017, 4 (9), 1117–1125. [Google Scholar]
- (29).Rivenson Y; Zhang Y; Günaydin H; Teng D; Ozcan A Phase Recovery and Holographic Image Reconstruction Using Deep Learning in Neural Networks. Light: Sci. Appl 2018, 7 (2), 17141. [DOI] [PMC free article] [PubMed] [Google Scholar]
- (30).Wu Y; Rivenson Y; Zhang Y; Wei Z; Gunaydin H; Lin X; Ozcan A Extended Depth-of-Field in Holographic Imaging Using Deep-Learning-Based Autofocusing and Phase Recovery. Optica 2018, 5 (6), 704–710. [Google Scholar]
- (31).Liu T; Wei Z; Rivenson Y; de Haan K; Zhang Y; Wu Y; Ozcan A Deep Learning-Based Color Holographic Microscopy. Journal of biophotonics 2019, e201900107. [DOI] [PubMed] [Google Scholar]
- (32).Liu T; de Haan K; Rivenson Y; Wei Z; Zeng X; Zhang Y; Ozcan A Deep Learning-Based Super-Resolution in Coherent Imaging Systems. Sci. Rep 2019, 9 (1), 3926. [DOI] [PMC free article] [PubMed] [Google Scholar]
- (33).Rivenson Y; Liu T; Wei Z; Zhang Y; de Haan K; Ozcan A PhaseStain: The Digital Staining of Label-Free Quantitative Phase Microscopy Images Using Deep Learning. Light: Sci. Appl 2019, 8 (1), 23. [DOI] [PMC free article] [PubMed] [Google Scholar]
- (34).Christiansen EM; Yang SJ; Ando DM; Javaherian A; Skibinski G; Lipnick S; Mount E; O’Neil A; Shah K; Lee AK; Goyal P; Fedus W; Poplin R; Esteva A; Berndl M; Rubin LL; Nelson P; Finkbeiner S In Silico Labeling: Predicting Fluorescent Labels in Unlabeled Images. Cell 2018, 173 (3), 792. [DOI] [PMC free article] [PubMed] [Google Scholar]
- (35).Wu Y; Luo Y; Chaudhari G; Rivenson Y; Calis A; de Haan K; Ozcan A Bright-Field Holography: Cross-Modality Deep Learning Enables Snapshot 3D Imaging with Bright-Field Contrast Using a Single Hologram. Light: Sci. Appl 2019, 8 (1), 25. [DOI] [PMC free article] [PubMed] [Google Scholar]
- (36).Intaravanne Y; Chen X Recent Advances in Optical Metasurfaces for Polarization Detection and Engineered Polarization Profiles. Nanophotonics 2020, 9 (5), 1003–1014. [Google Scholar]
- (37).Greenbaum A; Ozcan A Maskless Imaging of Dense Samples Using Pixel Super-Resolution Based Multi-Height Lensfree on-Chip Microscopy. Opt. Express 2012, 20 (3), 3129–3143. [DOI] [PMC free article] [PubMed] [Google Scholar]
- (38).Goodman JW Introduction to Fourier Optics; Roberts and Company Publishers, 2005. [Google Scholar]
- (39).Zhang Y; Wang H; Wu Y; Tamamitsu M; Ozcan A Edge Sparsity Criterion for Robust Holographic Autofocusing. Opt. Lett 2017, 42 (19), 3824–3827. [DOI] [PubMed] [Google Scholar]
- (40).Jones RC A New Calculus for the Treatment of Optical SystemsI. Description and Discussion of the Calculus. J. Opt. Soc. Am 1941, 31 (7), 488–493. [Google Scholar]
- (41).Register Multimodal MRI Images - MATLAB & Simulink Example https://www.mathworks.com/help/images/registering-multimodal-mri-images.html (accessed May 29, 2020).
- (42).Rivenson Y; Ceylan Koydemir H; Wang H; Wei Z; Ren Z; Günaydin H; Zhang Y; Gorocs Z; Liang K; Tseng D; Ozcan A Deep Learning Enhanced Mobile-Phone Microscopy. ACS Photonics 2018, 5 (6), 2354–2364. [Google Scholar]
- (43).Ronneberger O; Fischer P; Brox T U-Net: Convolutional Networks for Biomedical Image Segmentation. arXiv:1505.04597 [cs] 2015. [Google Scholar]
Associated Data
This section collects any data citations, data availability statements, or supplementary materials included in this article.


