

SUMMARY
Due to the rapid emergence of antibiotic-resistant bacteria, there is a growing need to discover new antibiotics. To address this challenge, we trained a deep neural network capable of predicting molecules with antibacterial activity. We performed predictions on multiple chemical libraries and discovered a molecule from the Drug Repurposing Hub – halicin – that is structurally divergent from conventional antibiotics and displays bactericidal activity against a wide phylogenetic spectrum of pathogens, including Mycobacterium tuberculosis and carbapenem-resistant Enterobacteriaceae. Halicin also effectively treated Clostridioides difficile and pan-resistant Acinetobacter baumannii infections in murine models. Additionally, from a discrete set of 23 empirically tested predictions from >107 million molecules curated from the ZINC15 database, our model identified eight antibacterial compounds that are structurally distant from known antibiotics. This work highlights the utility of deep learning approaches to expand our antibiotic arsenal through the discovery of structurally distinct antibacterial molecules.
INTRODUCTION
Since the discovery of penicillin, antibiotics have become the cornerstone of modern medicine. However, the continued efficacy of these essential drugs is uncertain due to the global dissemination of antibiotic-resistance determinants. Moreover, the decreasing development of new antibiotics in the private sector that has resulted from a lack of economic incentives is exacerbating this already dire problem (E. D. Brown and Wright, 2016; PEW, 2019). Indeed, without immediate action to discover and develop new antibiotics, it is projected that deaths attributable to resistant infections will reach 10 million per year by 2050 (O’Neill, 2014).
Historically, antibiotics were discovered largely through screening soil-dwelling microbes for secondary metabolites that prevented the growth of pathogenic bacteria (Clardy et al., 2006; Wright, 2017). This approach resulted in the majority of clinically used classes of antibiotics, including β-lactams, aminoglycosides, polymyxins, and glycopeptides, among others. Semi-synthetic derivatives of these scaffolds have maintained a viable clinical arsenal of antibiotics by increasing potency, decreasing toxicity, and sidestepping resistance determinants. Entirely synthetic antibiotics of the pyrimidine, quinolone, oxazolidinone, and sulfa classes have also found prolonged clinical utility, and continue to be optimized for the same properties.
Unfortunately, the discovery of new antibiotics is becoming increasingly difficult. Natural product discovery is now plagued by the dereplication problem, wherein the same molecules are being repeatedly discovered (Cox et al., 2017). Moreover, given the rapid expansion of chemical spaces that are accessible by the derivatization of complex scaffolds (Ortholand and Ganesan, 2004), engineering next-generation versions of existing antibiotics results in substantially more failures than leads. Therefore, many antibiotic discovery programs have turned to screening large synthetic chemical libraries (Tommasi et al., 2015). However, these libraries, which can contain hundreds of thousands to a few million molecules, are often prohibitively costly to curate, limited in chemical diversity, and fail to reflect the chemistry that is inherent to antibiotic molecules (D. G. Brown et al., 2014). Since the implementation of high-throughput screening in the 1980s, no new clinical antibiotics have been discovered using this method.
Novel approaches to antibiotic discovery are needed to increase the rate at which new antibiotics are identified and simultaneously decrease the associated cost of early lead discovery. Given recent advancements in machine learning (Camacho, et al., 2018), the field is now ripe for the application of algorithmic solutions for molecular property prediction to identify novel structural classes of antibiotics. Indeed, adopting methodologies that allow early drug discovery to be performed largely in silico enables the exploration of vast chemical spaces that is beyond the reach of current experimental approaches.
The idea of analytical exploration in drug design is not new. Decades of prior work in chemoinformatics has developed models for molecular property prediction (Mayr et al., 2018; Wu et al., 2017). However, the accuracy of these models has been insufficient to substantially change the traditional drug discovery pipeline. With recent algorithmic advancements in modelling neural network-based molecular representations, we are beginning to have the opportunity to influence the paradigm of drug discovery. An important development relates to how molecules are represented; traditionally, molecules were represented by their fingerprint vectors, which reflected the presence or absence of functional groups in the molecule, or by descriptors that include computable molecular properties and require expert knowledge to construct (Mauri et al., 2006; Moriwaki et al., 2018; Rogers and Hahn, 2010). Even though the mapping from these representations to properties was learned automatically, the fingerprints and descriptors themselves were designed manually. The innovation of neural network approaches lies in their ability to learn this representation automatically, mapping molecules into continuous vectors which are subsequently used to predict their properties. These designs result in molecular representations that are highly attuned to the desired property, yielding gains in property prediction accuracy over manually crafted representations (K. Yang et al., 2019).
While neural network models narrowed the performance gap between analytical and experimental approaches, a difference still exists. Here, we demonstrate how the combination of in silico predictions and empirical investigations can lead to the discovery of new antibiotics (Figure 1). Our approach consists of three stages. First, we trained a deep neural network model to predict growth inhibition of Escherichia coli using a collection of 2,335 molecules. Second, we applied the resulting model to several discrete chemical libraries, comprising >107 million molecules, to identify potential lead compounds with activity against E. coli. After ranking the compounds according to the model’s predicted score, we lastly selected a list of candidates based on a pre-specified prediction score threshold, chemical structure, and availability.
Figure 1. Machine learning in antibiotic discovery.
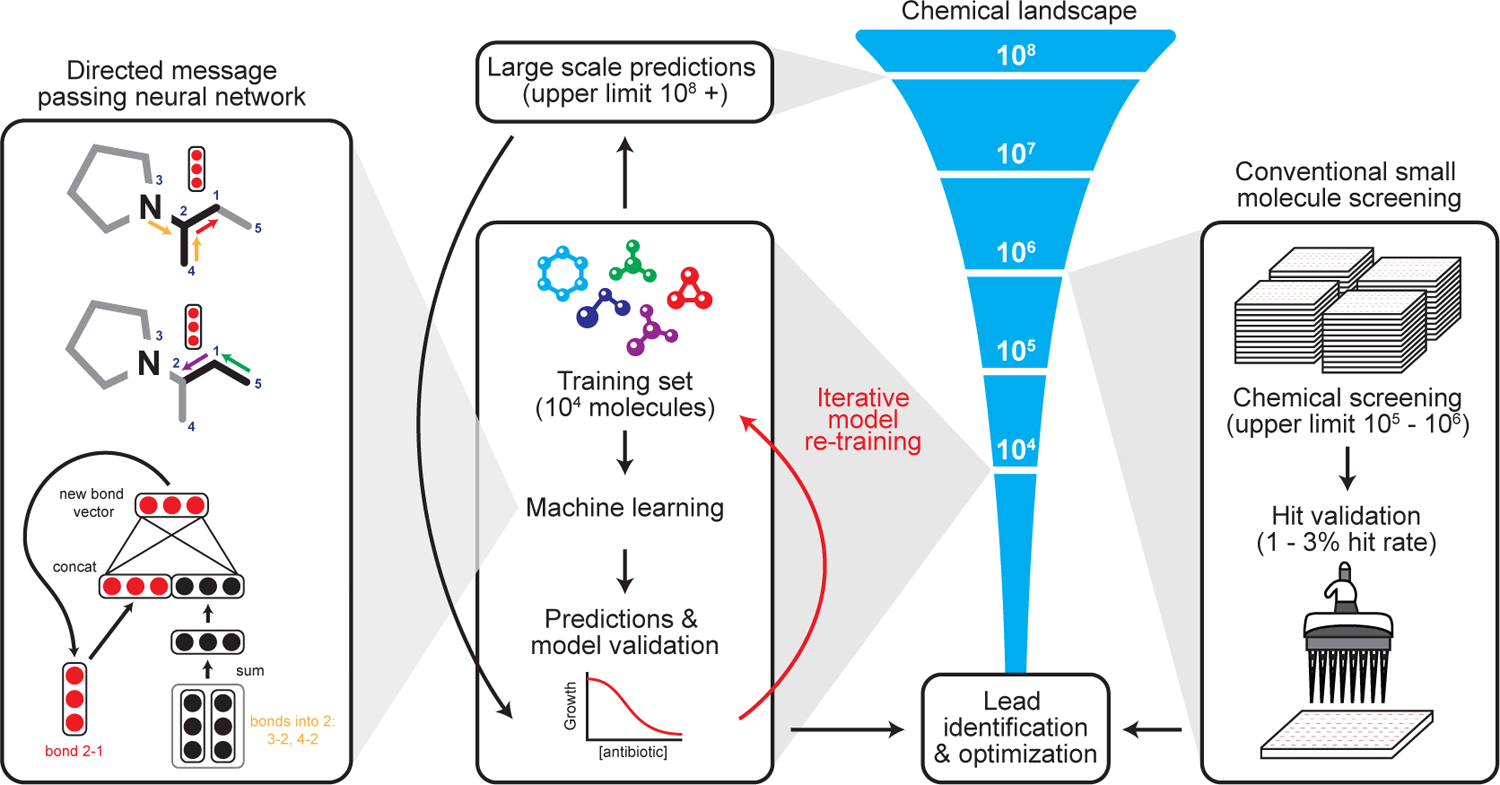
Modern approaches to antibiotic discovery often include screening large chemical libraries for those that elicit a phenotype of interest. These screens, which are upper bound by hundreds of thousands to a few million molecules, are expensive, time consuming, and can fail to capture an expansive breadth of chemical space. In contrast, machine learning approaches afford the opportunity to rapidly and inexpensively explore vast chemical spaces in silico. Our deep neural network model works by building a molecular graph based on a specific property, in our case the inhibition of the growth of E. coli, using a directed message passing approach. We first trained our neural network model using a collection of 2,335 diverse molecules for those that inhibited the growth of E. coli, augmenting the model with a set of molecular features, hyperparameter optimization, and ensembling. Next, we applied the model to multiple chemical libraries, comprising >107 million molecules, to identify potential lead compounds with activity against E. coli. After ranking the candidates according to the model’s predicted score, we selected a list of promising candidates.
Through this approach, from the Drug Repurposing Hub we identified the c-Jun N-terminal kinase inhibitor SU3327 (De et al., 2009; Jang et al., 2015) (renamed halicin herein), which is structurally divergent from conventional antibiotics, as a potent inhibitor of E. coli growth. Further investigations revealed that halicin displays growth inhibitory properties against a wide phylogenetic spectrum of pathogens through selective dissipation of the bacterial transmembrane ∆pH potential. Importantly, halicin shows efficacy against Clostridioides difficile and pan-resistant Acinetobacter baumannii infections in murine models. Of note, the World Health Organization has designated A. baumannii as one of the highest priority pathogens against which new antibiotics are urgently required (Lee et al., 2017; Perez et al., 2007). In addition to halicin, from a distinct set of 23 empirically tested predictions from >107 million molecules found in the ZINC15 database, we readily discovered eight additional antibacterial compounds that are structurally distant from known antibiotics. Remarkably, two of these molecules displayed potent broad-spectrum activity and could overcome an array of antibiotic-resistance determinants in E. coli. This work highlights the significant impact that machine learning can have on early antibiotic discovery efforts by simultaneously increasing the accuracy rate of lead compound identification and decreasing the cost of screening efforts.
RESULTS
Initial model training and the identification of halicin
Initially, we desired to obtain a training dataset de novo that was inexpensive, chemically diverse, and did not require sophisticated laboratory resources. This would allow for the development of a robust model with which new antibiotics could be predicted, without the practical hurdles that can be associated with large-scale antibiotic screening efforts. We screened for growth inhibition against E. coli BW25113 (Zampieri et al., 2017) using a widely available FDA-approved drug library consisting of 1,760 molecules of diverse structure and function. To further increase chemical diversity, we included an additional 800 natural products isolated from plant, animal, and microbial sources, resulting in a primary training set of 2,560 molecules (Figure 2A, Figure S1A, Table S1A) – 2,335 unique compounds when deduplicated (Figure S1B, Table S1B). Using 80% growth inhibition as a hit cut-off, this primary screen resulted in the identification of 120 molecules with growth inhibitory activity against E. coli.
Figure 2. Initial model training and the identification of halicin.
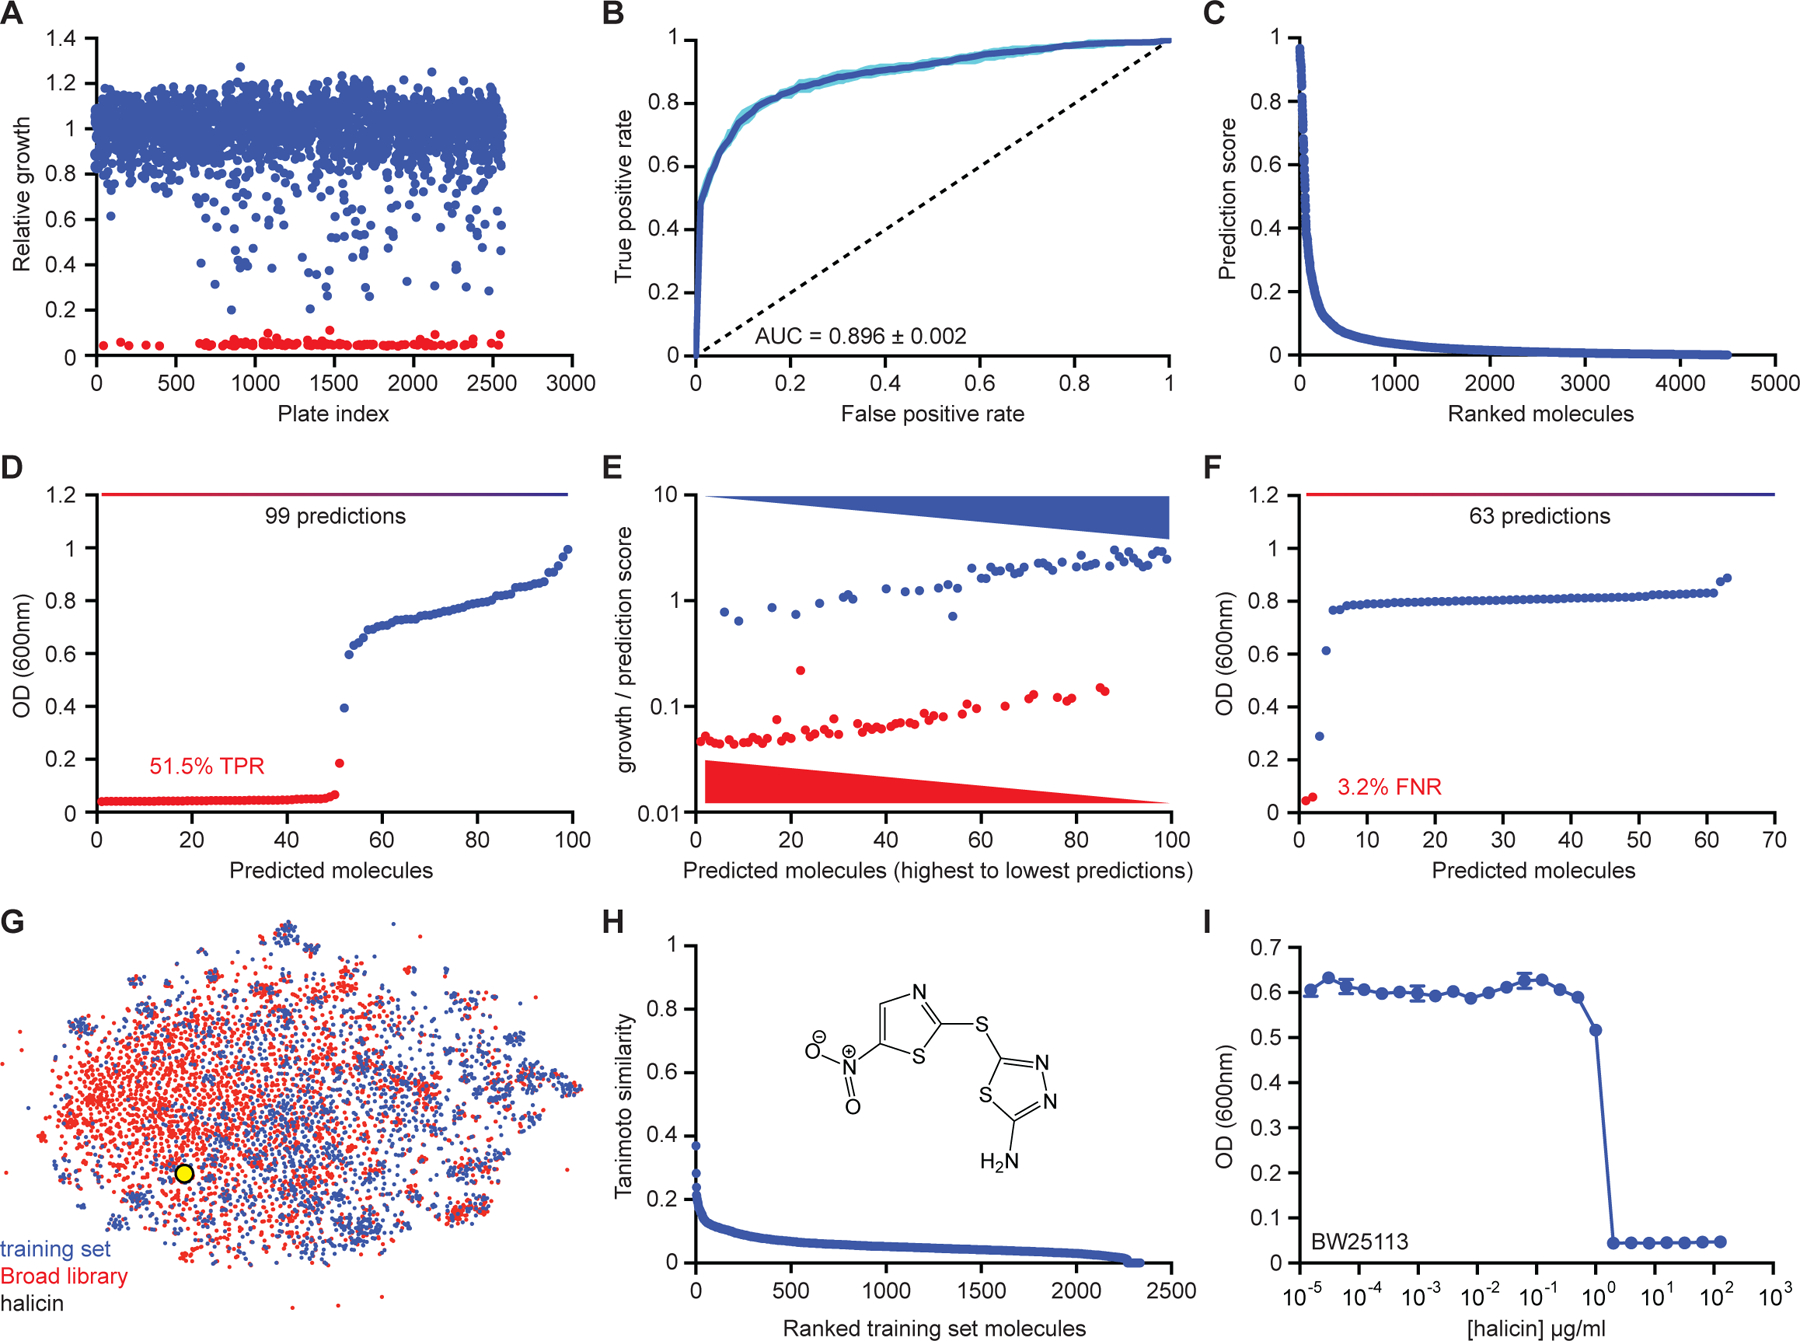
(A) Primary screening data for growth inhibition of E. coli by 2,560 molecules within the FDA-approved drug library supplemented with a natural product collection. Shown is the mean of two biological replicates. Red are growth inhibitory molecules; blue are non-growth inhibitory molecules. (B) ROC-AUC plot evaluating model performance after training. Dark blue is the mean of six individual trials (cyan). (C) Rank-ordered prediction scores of Drug Repurposing Hub molecules that were not present in the training dataset. (D) The top 99 predictions from the data shown in (C) were curated for empirical testing for growth inhibition of E. coli. Fifty-one of 99 molecules were validated as true positives based on a cut-off of OD600 < 0.2. Shown is the mean of two biological replicates. Red are growth inhibitory molecules; blue are non-growth inhibitory molecules. (E) For all molecules shown in (D), ratios of OD600 to prediction score were calculated and these values were plotted based on prediction score for each corresponding molecule. These results show that a higher prediction score correlates with a greater probability of growth inhibition. (F) The bottom 63 predictions from the data shown in (C) were curated for empirical testing for growth inhibition of E. coli. Shown is the mean of two biological replicates. Red are growth inhibitory molecules; blue are non-growth inhibitory molecules. (G) t-SNE of all molecules from the training dataset (blue) and the Drug Repurposing Hub (red), revealing chemical relationships between these libraries. Halicin is shown as a black and yellow circle. (H) Tanimoto similarity between halicin (structure inset) and each molecule in the de-duplicated training dataset. The Tanimoto nearest neighbour is the antiprotozoal drug nithiamide (score ~0.37), with metronidazole being the nearest antibiotic (score ~0.21). (I) Growth inhibition of E. coli by halicin. Shown is the mean of two biological replicates. Bars denote absolute error. See also Figure S1, Table S1, S2.
Next, all 2,335 compounds from the primary training dataset were binarized as hit or non-hit. After binarization, we used these data to train a binary classification model that predicts the probability of whether a new compound will inhibit the growth of E. coli based on its structure. For this purpose, we utilized a directed-message passing deep neural network model (K. Yang et al., 2019), which translates the graph representation of a molecule into a continuous vector via a directed bond-based message passing approach. This builds a molecular representation by iteratively aggregating the features of individual atoms and bonds. The model operates by passing “messages” along bonds which encode information about neighboring atoms and bonds. By applying this message passing operation multiple times, the model constructs higher-level bond messages that contain information about larger chemical substructures. The highest-level bond messages are then combined into a single continuous vector representing the entire molecule. Given the limited amount of data available for training the model, it was important to ensure that the model could generalize without overfitting. Therefore, we augmented the learned representation with molecular features computed by RDKit (Landrum, 2006) (Table S2A), yielding a hybrid molecular representation. We further increased the algorithm’s robustness by utilizing an ensemble of classifiers and estimating hyperparameters with Bayesian optimization. The resulting model achieved a ROC-AUC of 0.896 on the test data (Figure 2B).
After model development and optimization using our training dataset of 2,335 molecules, we subsequently applied an ensemble of models trained on twenty folds to identify potential antibacterial molecules from the Drug Repurposing Hub (Corsello et al., 2017). This library consists of 6,111 molecules at various stages of investigation for human diseases. Here, prediction scores for each compound were determined, molecules were ranked based on their probability of displaying growth inhibition against E. coli, and compounds with molecular graphs common between the training dataset and the Drug Repurposing Hub were removed (Figure 2C; Table S2B). Notably, we compared the molecule prediction ranks from our model (Table S2B) to numerous others, including a learned model without RDKit feature augmentation (Table S2C); a model trained exclusively on RDKit features (Table S2D); a feed-forward deep neural network model using Morgan fingerprints as the molecular representation (Table S2E); a random forest classifier using Morgan fingerprints (Table S2F); and a support-vector machine model using Morgan fingerprints (Table S2G).
Next, we curated the 99 molecules unique to the Drug Repurposing Hub that were most strongly predicted to display antibacterial properties by our model and empirically tested these for growth inhibition. We observed that 51 of the 99 predicted molecules displayed growth inhibition against E. coli, based on a cut-off of OD600 < 0.2 (Figure 2D). Importantly, higher prediction scores correlated with a greater probability of growth inhibition (Figure 2E). Furthermore, empirically testing the lowest predicted 63 molecules that were unique to the Drug Repurposing Hub revealed that only two of these compounds displayed growth inhibitory activity (Figure 2F).
After identifying the 51 molecules that displayed growth inhibition against E. coli, we prioritized these based on clinical phase of investigation, structural similarity to molecules in the primary training dataset, and predicted toxicity using a deep neural network model trained on the ClinTox database (Gayvert et al., 2016; Wu et al., 2017) (Table S2B). Specifically, we prioritized predicted compounds in preclinical or Phase 1/2/3 studies; those with low structural similarity to training set molecules; and those with low predicted toxicity. The compound that satisfied all of these criteria was the c-Jun N-terminal kinase inhibitor SU3327 (De et al., 2009; Jang et al., 2015) (renamed halicin), a preclinical nitrothiazole under investigation as a treatment for diabetes. Excitingly, halicin, which is structurally most similar to a family of nitro-containing antiparasitic compounds (Tanimoto similarity ~ 0.37; Figure 2G, 2H, Table S2H) (Rogers and Hahn, 2010) and the antibiotic metronidazole (Tanimoto similarity ~ 0.21), displayed excellent growth inhibitory activity against E. coli, achieving a minimum inhibitory concentration (MIC) of 2 µg/ml (Figure 2I).
Importantly, we observed that the prediction rank of halicin in our model (position 89) was greater than that in four of the other five models tested (positions ranging from 273 to 1987; Table S2D–S2G). Indeed, only the learned model without RDKit augmentation positioned halicin in a higher prediction rank (position 61; Table S2C). These data highlight the importance of using a directed-message passing deep neural network approach in the discovery of halicin.
Halicin is a broad-spectrum bactericidal antibiotic
Given that halicin displayed potent growth inhibitory activity against E. coli, we next performed time-and concentration-dependent killing assays to determine whether this compound inhibited growth through a bactericidal or bacteriostatic mechanism. In rich growth conditions against an initial cell density of ~106 CFU/ml, we observed bacterial cell killing in the presence of halicin (Figure 3A). The apparent potency of halicin decreased as initial cell density increased (Figure S2A, S2B), likely as a result of dilution of the molecule over a greater number of cells. Next, we considered whether halicin might induce bacterial cell death against E. coli in a metabolically repressed, antibiotic-tolerant state (Balaban et al., 2019; Stokes et al., 2019a; 2019b). Indeed, given that metronidazole is bactericidal against non-replicating cells (Tally et al., 1978), we reasoned that halicin may similarly display this activity. Remarkably, by incubating E. coli in nutrient-free buffer supplemented with halicin, we observed that this molecule retained bactericidal activity (Figure 3B, Figure S2C, S2D). This is in stark contrast to the conventionally bactericidal antibiotic ampicillin, which was unable to eradicate E. coli existing in metabolically repressed states (Figure S2E–G), despite its efficacy against metabolically active cells (Figure S2H–J). Moreover, halicin was able to eradicate E. coli persister cells that remained after treatment with ampicillin (Figure 3C), consistent with its bactericidal activity against cells in nutrient-free buffer conditions.
Figure 3. Halicin is a broad-spectrum bactericidal antibiotic.
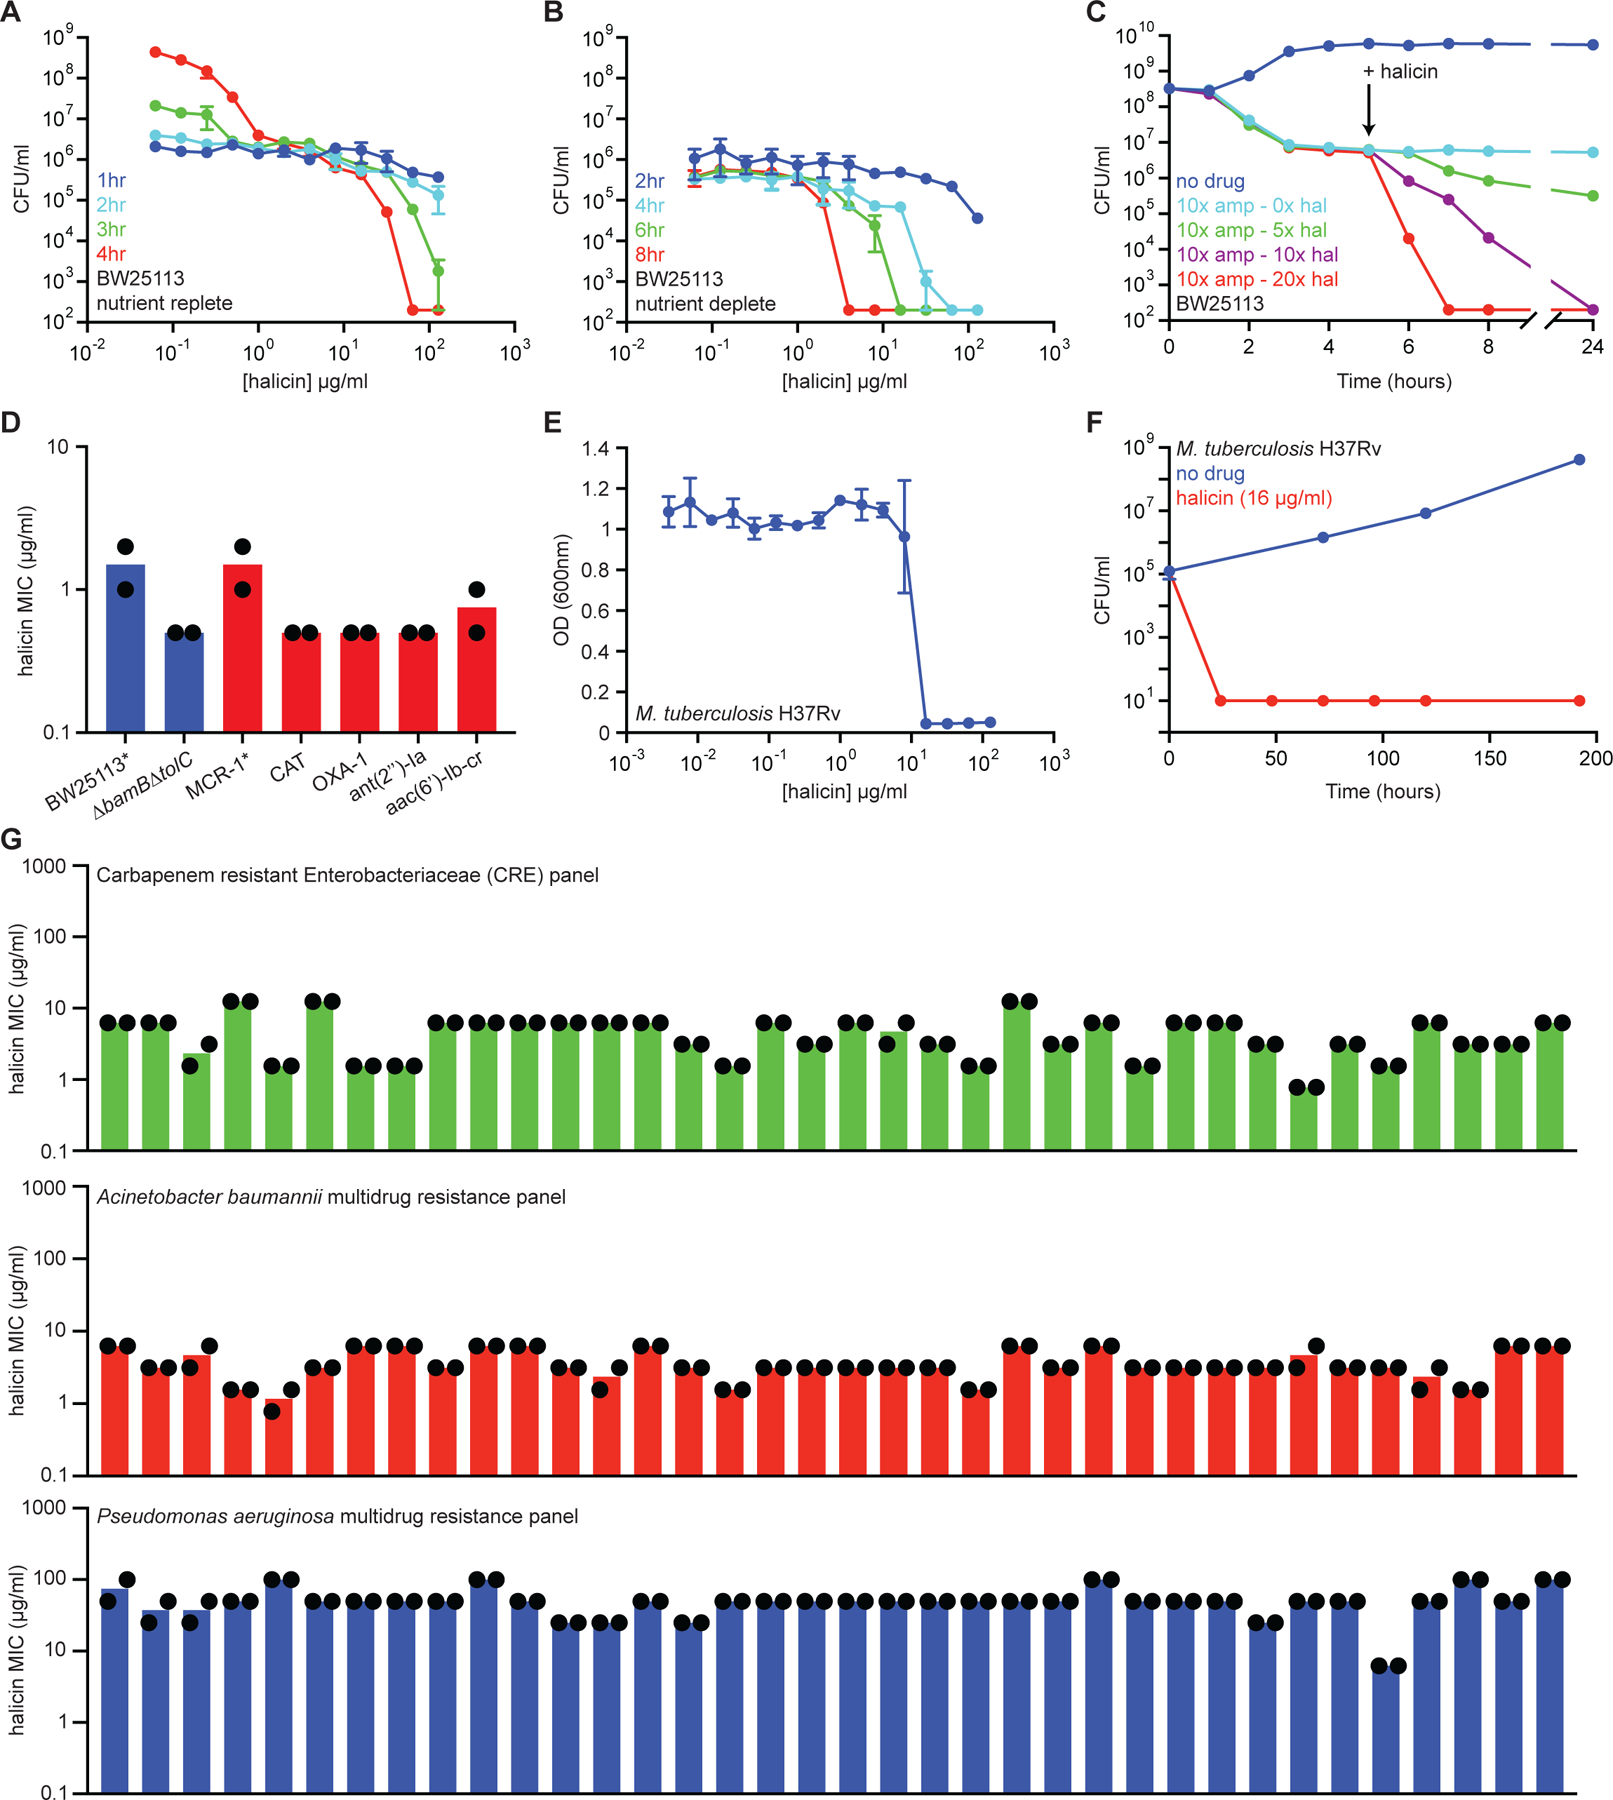
(A) Killing of E. coli in LB media in the presence of varying concentrations of halicin after 1 hr (blue), 2 hr (cyan), 3 hr (green), and 4 hr (red). The initial cell density is ~106 CFU/ml. Shown is the mean of two biological replicates. Bars denote absolute error. (B) Killing of E. coli in PBS in the presence of varying concentrations of halicin after 2 hr (blue), 4 hr (cyan), 6 hr (green), and 8 hr (red). The initial cell density is ~106 CFU/ml. Shown is the mean of two biological replicates. Bars denote absolute error. (C) Killing of E. coli persisters by halicin after treatment with 10 µg/ml (10x MIC) of ampicillin. Light blue is no halicin. Green is 5x MIC halicin. Blue is 10x MIC halicin. Red is 20x MIC halicin. Shown is the mean of two biological replicates. Bars denote absolute error. (D) MIC of halicin against E. coli strains harboring a range of antibiotic-resistance determinants. The mcr-1 gene was expressed in E. coli BW25113. All other resistance genes were expressed in E. coli BW25113 ∆bamB∆tolC. Experiments were conducted with two biological replicates. (E) Growth inhibition of M. tuberculosis by halicin. Shown is the mean of three biological replicates. Bars denote standard deviation. (F) Killing of M. tuberculosis by halicin in 7H9 media at 16 µg/ml (1x MIC). Shown is the mean of three biological replicates. Bars denote standard deviation. (G) MIC of halicin against 36-strain panels of CRE isolates (green), A. baumannii isolates (red), and P. aeruginosa isolates (blue). Experiments were conducted with two biological replicates. See also Figure S2, Table S3.
The efficacy of halicin against antibiotic-tolerant cells represents a significant improvement over the majority of conventional antibiotics (Lobritz et al., 2015; Stokes et al., 2019b). This observation suggested that the molecule could function through an uncommon mechanism of action, and therefore overcome many common resistance determinants. We initially tested halicin against a selection of E. coli strains harboring plasmid-borne antibiotic-resistance genes conferring resistance to polymyxins (MCR-1), chloramphenicol (CAT), β-lactams (OXA-1), aminoglycosides [ant(2”)-Ia], and fluoroquinolones [aac(6’)-Ib-cr]. Here, we observed no change in halicin MIC in the presence of any resistance gene relative to the antibiotic-susceptible parent strains (Figure 3D, Figure S2K). Similarly, the MIC of halicin did not change in E. coli displaying resistance to the nitrofuran antibiotic nitrofurantoin via deletion of nfsA and nfsB (Sandegren et al., 2008) (Figure S2L, S2M).
To more comprehensively assess the ability of halicin to overcome antibiotic-resistance genes, as well as understand phylogenetic spectrum of bioactivity, we assayed for halicin-dependent growth inhibition against Mycobacterium tuberculosis, as well as 36 multidrug-resistant clinical isolates each of carbapenem-resistant Enterobacteriaceae (CRE), A. baumannii, and Pseudomonas aeruginosa. These pathogens are regarded by the World Health Organization as the bacteria that most urgently require new treatments. Excitingly, we observed that halicin was rapidly bactericidal against M. tuberculosis (Figure 3E, 3F) and had strong growth inhibitory activity against CRE and A. baumannii clinical isolates (Figure 3G, Table S3). While it remains to be experimentally elucidated, the lack of efficacy against P. aeruginosa may be explained by insufficient permeability to the cell membrane (Angus et al., 1982; Yoshimura and Nikaido, 1982).
Halicin dissipates the ∆pH component of the proton motive force
The observations that halicin retained bactericidal activity against antibiotic-tolerant E. coli and M. tuberculosis, as well as growth inhibitory properties against multidrug-resistant Gram-negative clinical isolates, suggested that this compound was antibacterial through an unconventional mechanism. Since our model was agnostic to the mechanism of action underlying growth inhibition, we initially attempted to elucidate mechanism through the evolution of halicin-resistant mutants. However, we were unable to isolate spontaneous suppressor mutants after 30 days of serial passaging in liquid media (Figure 4A) or after seven days of continuous halicin exposure on solid media (Figure S3A). As such, we applied RNA sequencing to understand the physiologic response of E. coli to halicin. Here, early-log phase cells were treated with a range of concentrations of compound, and whole-transcriptome sequencing was performed. We observed a rapid downregulation of genes involved in cell motility across all concentrations, as well as the upregulation of genes required for iron homeostasis at sub-lethal concentrations (Figure 4B, Figure S3B, S3C, Table S4A–S4C). Interestingly, previous work has shown that dissipation of the cytoplasmic transmembrane potential results in decreased bacterial locomotion and flagellar biosynthesis (Manson et al., 1977; Paul et al., 2008; Shioi et al., 1982). Moreover, given that cells must maintain an electrochemical transmembrane gradient for viability (Hurdle et al., 2011; Coates and Hu, 2008), dissipation of the proton motive force would result in the death of tolerant cells.
Figure 4. Halicin dissipates the ∆pH component of the proton motive force.
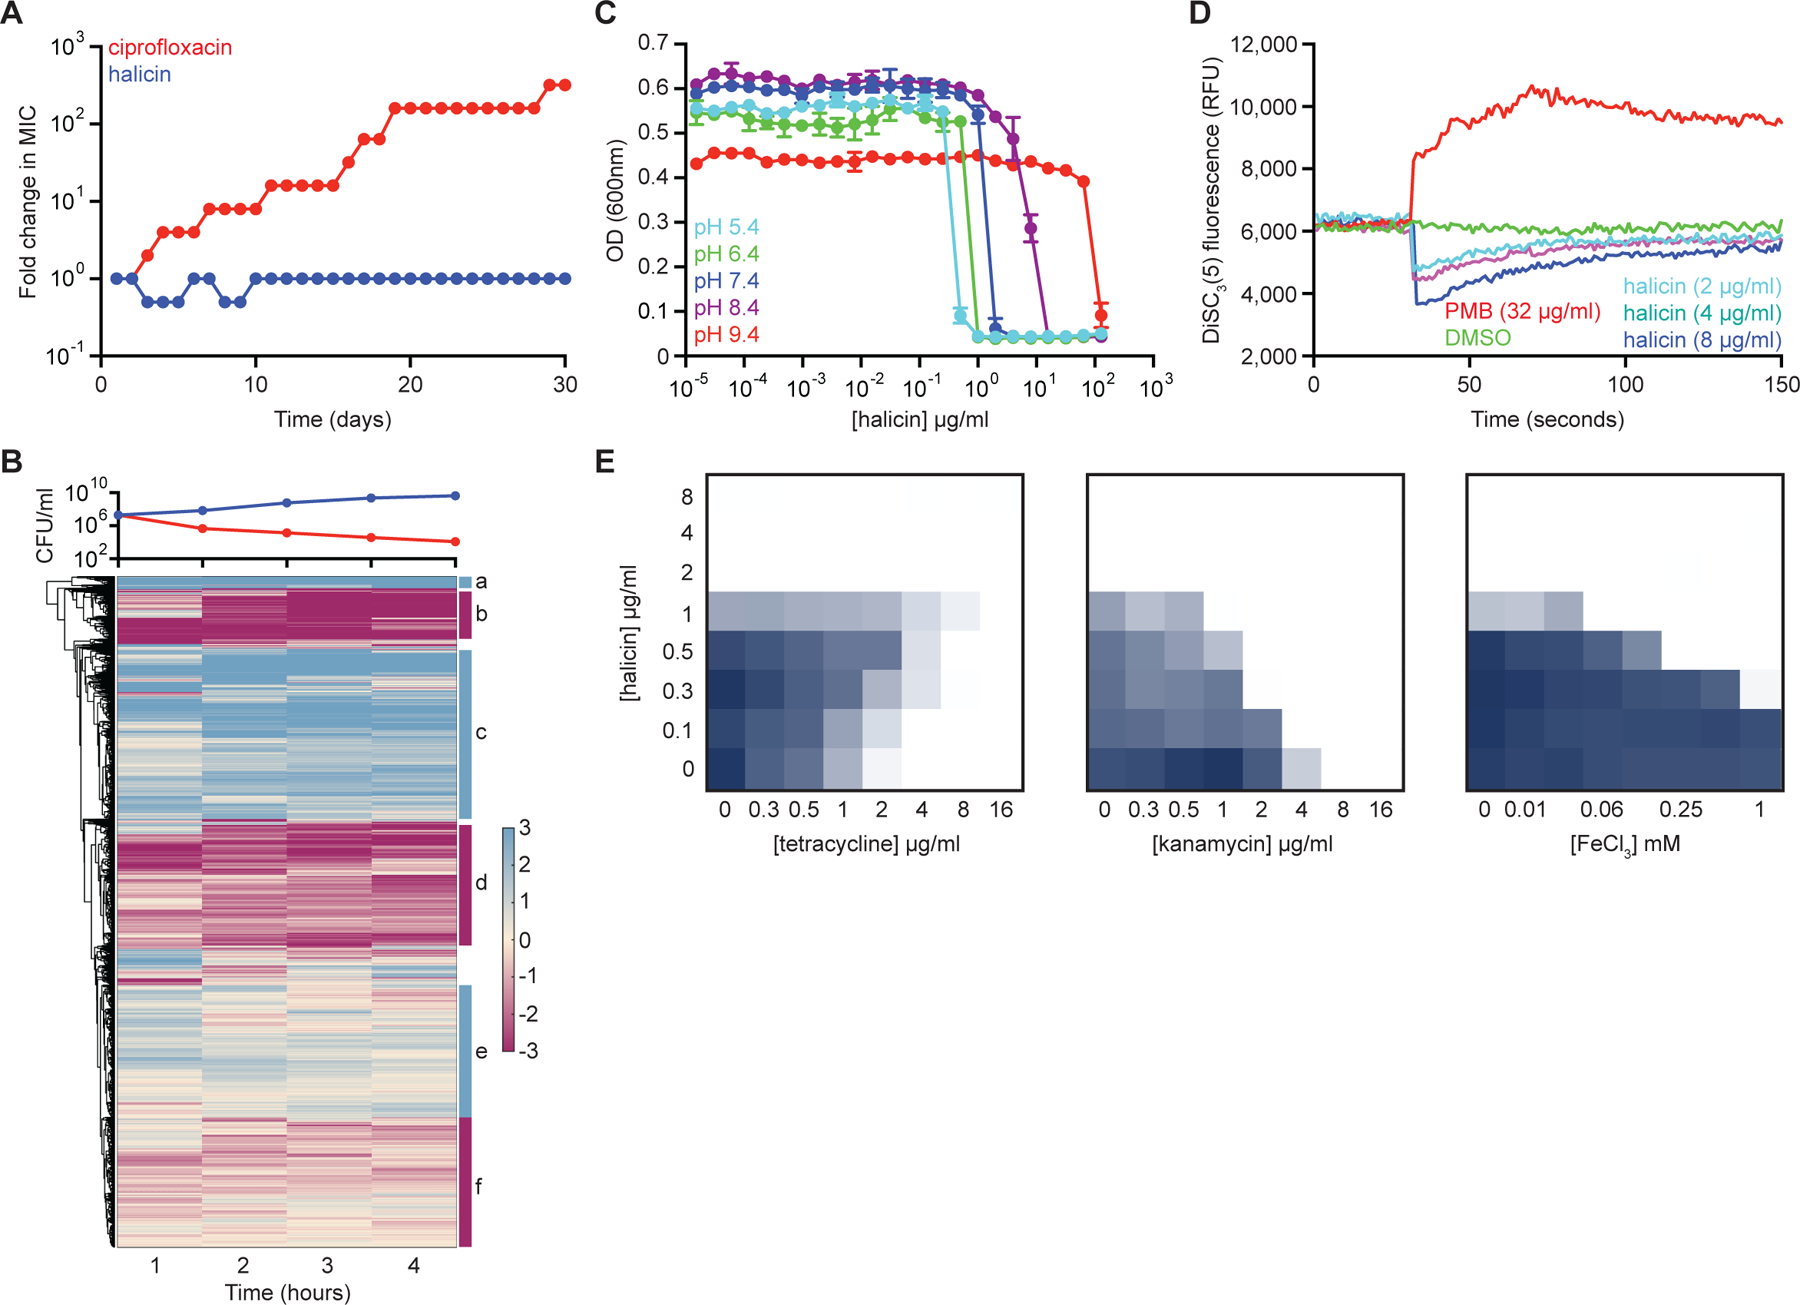
(A) Evolution of resistance to halicin (blue) or ciprofloxacin (red) in E. coli after 30 days of passaging in liquid LB media. Cells were passaged every 24 hours. (B) Whole transcriptome hierarchical clustering of relative gene expression of E. coli treated with halicin at 4x MIC for 1 hr, 2 hr, 3 hr, and 4 hr. Shown is the mean transcript abundance of two biological replicates of halicin-treated cells relative to untreated control cells on a log2-fold scale. Genes enriched in cluster b are involved in locomotion (p~10−20); genes enriched in cluster c are involved in ribosome structure/function (p~10−30); and genes enriched in cluster d are involved in membrane protein complexes (p~10−15). Clusters a, e, and f are not highly enriched for specific biological functions. In the growth curve, blue represents untreated cells; red represents halicin-treated cells. (C) Growth inhibition by halicin against E. coli in pH-adjusted media. Shown is the mean of two biological replicates. Bars denote absolute error. (D) DiSC3(5) fluorescence in E. coli upon exposure to polymyxin B (PMB), halicin, or DMSO. Growth inhibition checkerboards of halicin in combination with tetracycline (left), kanamycin (center), and FeCl3 (right). Dark blue represents greater growth. See also Figure S3, Table S4.
To test the hypothesis that halicin dissipated the proton motive force, we first assayed for changes in halicin MIC against E. coli as a function of media pH. In E. coli (Figure 4C), as well as Staphylococcus aureus (Figure S3D), we observed that halicin potency decreased as pH increased, providing evidence that this compound may be dissipating the ∆pH component of the proton motive force (Farha et al., 2013). Consistent with this observation, the addition of sodium bicarbonate to the growth medium (Farha et al., 2018) antagonized the action of halicin against E. coli (Figure S3E).
To further ascertain that halicin dissipates the transmembrane ∆pH potential in bacteria, we applied the potentiometric fluorophore 3,3’-dipropylthiadicarbocyanine iodide [DiSC3(5)] (Wu et al., 1999). DiSC3(5) accumulates in the cytoplasmic membrane in response to the ∆ψ component of the proton motive force, and self-quenches its own fluorescence. When ∆ψ is disrupted or the membrane is permeabilized, the probe is released into the extracellular milieu resulting in increased fluorescence. Conversely, when ∆pH is disrupted, cells compensate by increasing ∆ψ, resulting in enhanced DiSC3(5) uptake into the cytoplasmic membrane and therefore decreased fluorescence. Here, early-log E. coli cells were washed in buffer and introduced to DiSC3(5) to allow fluorescence equilibration. Cells were then introduced to polymyxin B (Figure 4D), which disrupts the cytoplasmic membrane, causing release of DiSC3(5) from the membrane and a corresponding increase in fluorescence. Next, we introduced cells to varying concentrations of halicin, and observed an immediate decrease in DiSC3(5) fluorescence in a dose-dependent manner (Figure 4D), suggesting that halicin selectively dissipated the ∆pH component of the proton motive force. Similar DiSC3(5) fluorescence changes were observed in S. aureus treated with halicin (Figure S3F, S3G). Moreover, halicin displayed antibiotic antagonism and synergy profiles consistent with ∆pH dissipation. Of note, halicin antagonized the activity of tetracycline in E. coli, and synergized with kanamycin (Figure 4E), consistent with previous work showing that the uptake of tetracyclines is dependent upon ∆pH (Yamaguchi et al., 1991), whereas aminoglycoside uptake is driven largely by ∆ψ (Taber et al., 1987).
Interestingly, our observations that halicin induced the expression of iron acquisition genes at sub-lethal concentrations (Table S4A–S4C) suggested that this compound complexes with iron in solution, thereby dissipating transmembrane ∆pH potential similarly to other antibacterial ionophores, such as daptomycin (Farha et al., 2013). We note here that daptomycin resistance via deletion of dsp1 in S. aureus did not confer cross-resistance to halicin (Figure S3H). We observed enhanced potency of halicin against E. coli with increasing concentrations of environmental Fe3+ (Figure 4E). This is consistent with a mechanism of action wherein halicin may bind iron prior to membrane association and ∆pH dissipation.
Halicin displays efficacy in murine models of infection
Given that halicin displays broad-spectrum bactericidal activity and is not highly susceptible to plasmid-borne antibiotic-resistance elements or de novo resistance mutations at high frequency, we next asked whether this compound might have utility as an antibiotic in vivo. We therefore tested the efficacy of halicin in a murine wound model of A. baumannii infection. On the dorsal surface of neutropenic Balb/c mice, we established a 2 cm2 wound and infected with ~2.5×10⁵ CFU of A. baumannii strain 288 acquired from the Centers for Disease Control and Prevention (CDC). This strain is not susceptible to clinical antibiotics generally used for treatment of A. baumannii, and therefore represents a pan-resistant isolate. Importantly, halicin displayed potent growth inhibition against this strain in vitro (MIC = 1 µg/ml; Figure 5A) and was able to sterilize A. baumannii 288 cells residing in metabolically repressed conditions (Figure 5B, Figure S4A, S4B). After 1 hr of infection establishment, mice were treated with Glaxal Base Moisturizing Cream supplemented with vehicle (0.5% DMSO) or halicin (0.5% w/v). Mice were then treated after 4 hr, 8 hr, 12 hr, 20 hr, and 24 hr of infection, and sacrificed at 25 hr post-infection. We observed that wound-carrying capacity had reached ~108 CFU/g in the vehicle control group, whereas 5 of the 6 mice treated with halicin contained <103 CFU/g (below the limit of detection) and one contained ~105 CFU/g (Figure 5C).
Figure 5. Halicin displays efficacy in murine models of infection.
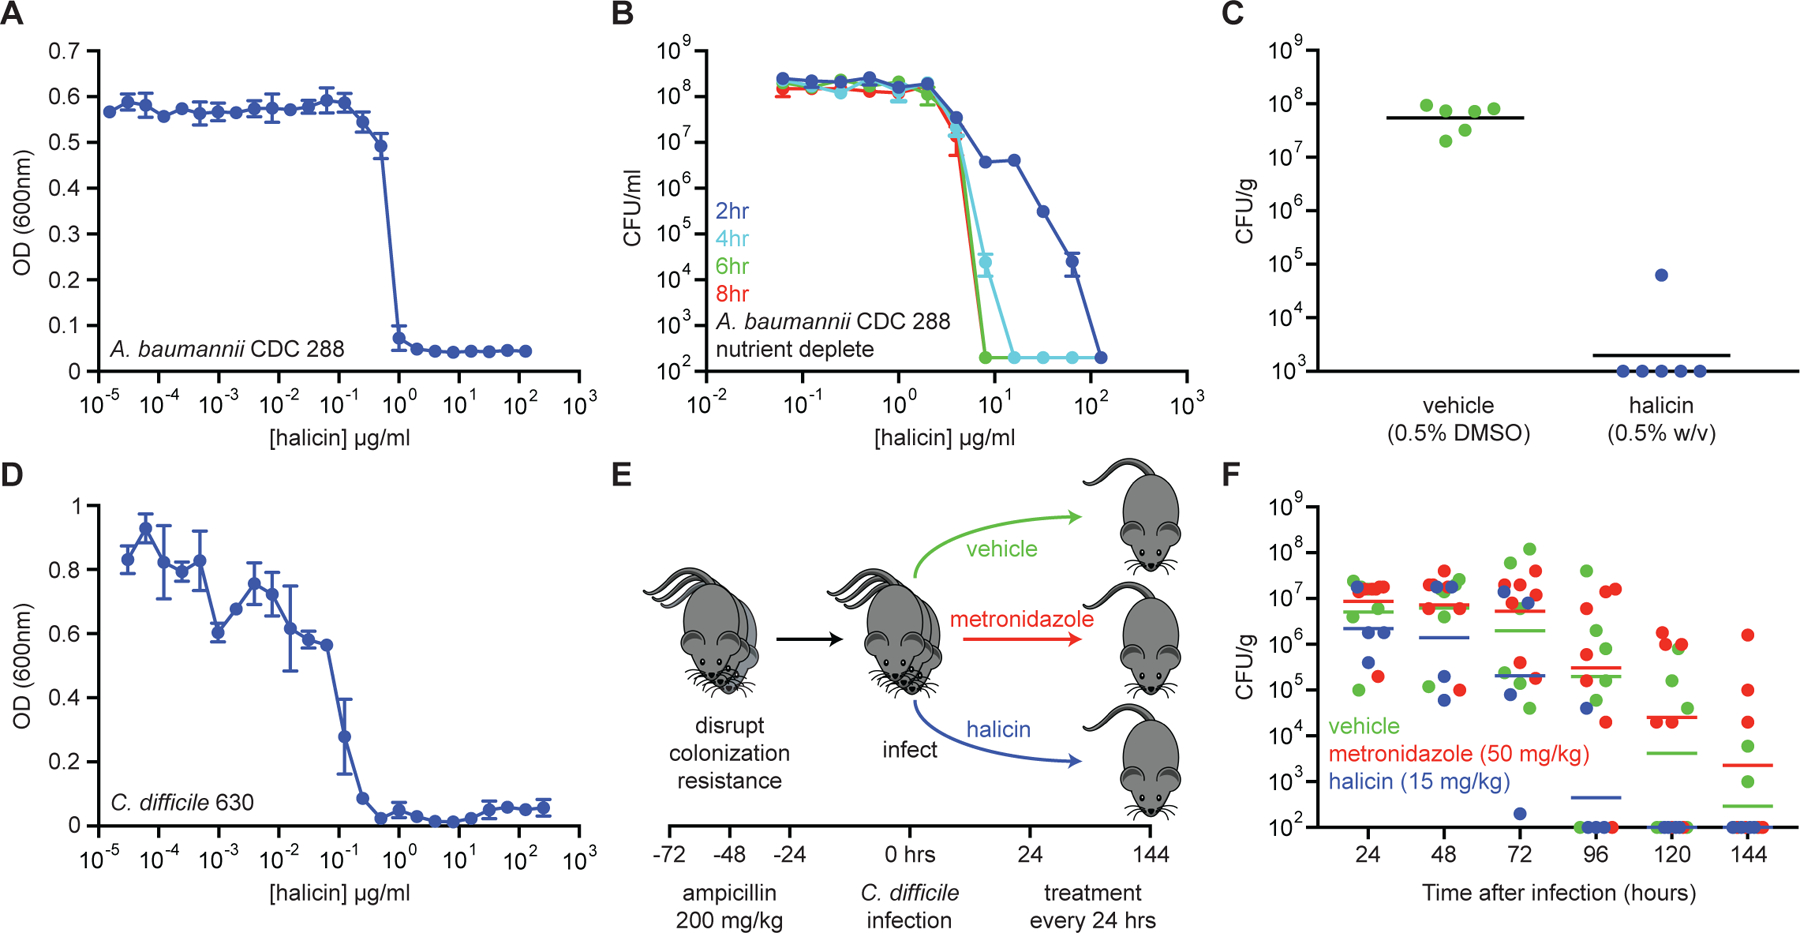
(A) Growth inhibition of pan-resistant A. baumannii CDC 288 by halicin. Shown is the mean of two biological replicates. Bars denote absolute error. (B) Killing of A. baumannii CDC 288 in PBS in the presence of varying concentrations of halicin after 2 hr (blue), 4 hr (cyan), 6 hr (green), and 8 hr (red). The initial cell density is ~108 CFU/ml. Shown is the mean of two biological replicates. Bars denote absolute error. (C) In a wound infection model, mice were infected with A. baumannii CDC 288 for 1 hr and treated with either vehicle (green; 0.5% DMSO; n=6) or halicin (blue; 0.5% w/v; n=6) over 24 hr. Bacterial load from wound tissue after treatment was determined by selective plating. Black lines represent geometric mean of the bacterial load for each treatment group. (D) Growth inhibition of C. difficile 630 by halicin. Shown is the mean of two biological replicates. Bars denote absolute error. (E) Experimental design for C. difficile infection and treatment. (F) Bacterial load of C. difficile 630 in feces of infected mice. Metronidazole (red; 50 mg/kg; n=6) did not result in enhanced rates of clearance relative to vehicle controls (green; 10% PEG 300; n=7). Halicin-treated mice (blue; 15 mg/kg; n=4) displayed sterilization beginning at 72 hr after treatment, with 100% of mice being free of infection at 96 hr after treatment. Lines represent geometric mean of the bacterial load for each treatment group. See also Figure S4.
After showing that halicin displayed efficacy against A. baumannii in a murine wound model, we next sought to investigate whether this molecule may have utility against a phylogenetically divergent pathogen that is increasingly becoming burdensome to healthcare systems – namely, C. difficile. This spore-forming anaerobe causes pseudomembranous colitis, often as a result of dysbiosis following systemic antibiotic administration. Metronidazole or vancomycin are first-line treatments, with failure resulting from antibiotic resistance and/or the presence of metabolically dormant cells (Surawicz et al., 2013). In cases of recurrent infection, fecal bacteriotherapy is required to re-establish the normal colonic microbiota to outcompete C. difficile (Gough et al., 2011), which can be more invasive than antibiotic therapy.
We first assayed for the ability of this molecule to inhibit the growth of C. difficile strain 630 in vitro and observed an MIC of 0.5 µg/ml (Figure 5D). To establish the murine infection, C57BL/6 mice were administered intraperitoneal injections of ampicillin (200 mg/kg) every 24 hr for 72 hr. Mice were then given 24 hr to recover, and subsequently administered 5×10³ spores of C. difficile 630 via oral gavage. Beginning 24 hr after C. difficile gavage, mice were gavaged with antibiotics (50 mg/kg metronidazole or 15 mg/kg halicin) or vehicle (10% PEG 300) every 24 hr for five days, and fecal samples were collected to quantify C. difficile load (Figure 5E). Excitingly, we observed that halicin resulted in C. difficile clearance at a greater rate than vehicle or the antibiotic metronidazole (Figure 5F), which is not only a first-line treatment for C. difficile infection, but also the antibiotic most similar to halicin based on Tanimoto score (Figure 2H, Table S2H). Indeed, halicin resulted in sterilization of 3 out of 4 mice after 72 hr of treatment, and 4 out of 4 mice after 96 hr of treatment.
Predicting new antibiotic candidates from vast chemical libraries
After applying our deep neural network model to identify antibiotic candidates from the Drug Repurposing Hub, we subsequently explored two additional chemical libraries – the WuXi anti-tuberculosis library housed at the Broad Institute that contains 9,997 molecules, and the ZINC15 database, a virtual collection of ~1.5 billion molecules designed for in silico screening (Sterling and Irwin, 2015). The WuXi anti-tuberculosis library served to test our model in chemical spaces that were highly divergent from the training dataset, prior to conducting large-scale predictions in the vast ZINC15 database. We applied our empirical data gathered from the Drug Repurposing Hub molecules to re-train the original model and then applied this new model to the WuXi anti-tuberculosis library. Interestingly, we observed an upper limit prediction score of just ~0.37 for the WuXi anti-tuberculosis library (Figure S5A), which was substantially lower than the highest prediction scores observed for the Drug Repurposing Hub (upper limit ~0.97; Figure 2C). Next, we curated and empirically assayed the 200 WuXi anti-tuberculosis library compounds with the highest prediction scores, and the 100 with the lowest. As expected, none of the 300 molecules that were assayed for growth inhibition against E. coli displayed antibacterial activity (Figure S5B, S5C, Table S5).
After again re-training our model with the empirical data gathered from these 300 WuXi anti-tuberculosis library molecules, we performed predictions on a subset of the ZINC15 database. Here, rather than screening the entire ~1.5 billion-molecule database, we focused specifically on those tranches that contained molecules with physicochemical properties that are observed in antibiotic-like compounds (Figure 6A). This more focused approach resulted in the in silico curation of 107,349,233 molecules; for perspective, this is two orders of magnitude larger than empirical screening permits (D. G. Brown et al., 2014), and our in silico screen of the library could be performed in four days.
Figure 6. Predicting new antibiotic candidates from unprecedented chemical libraries.
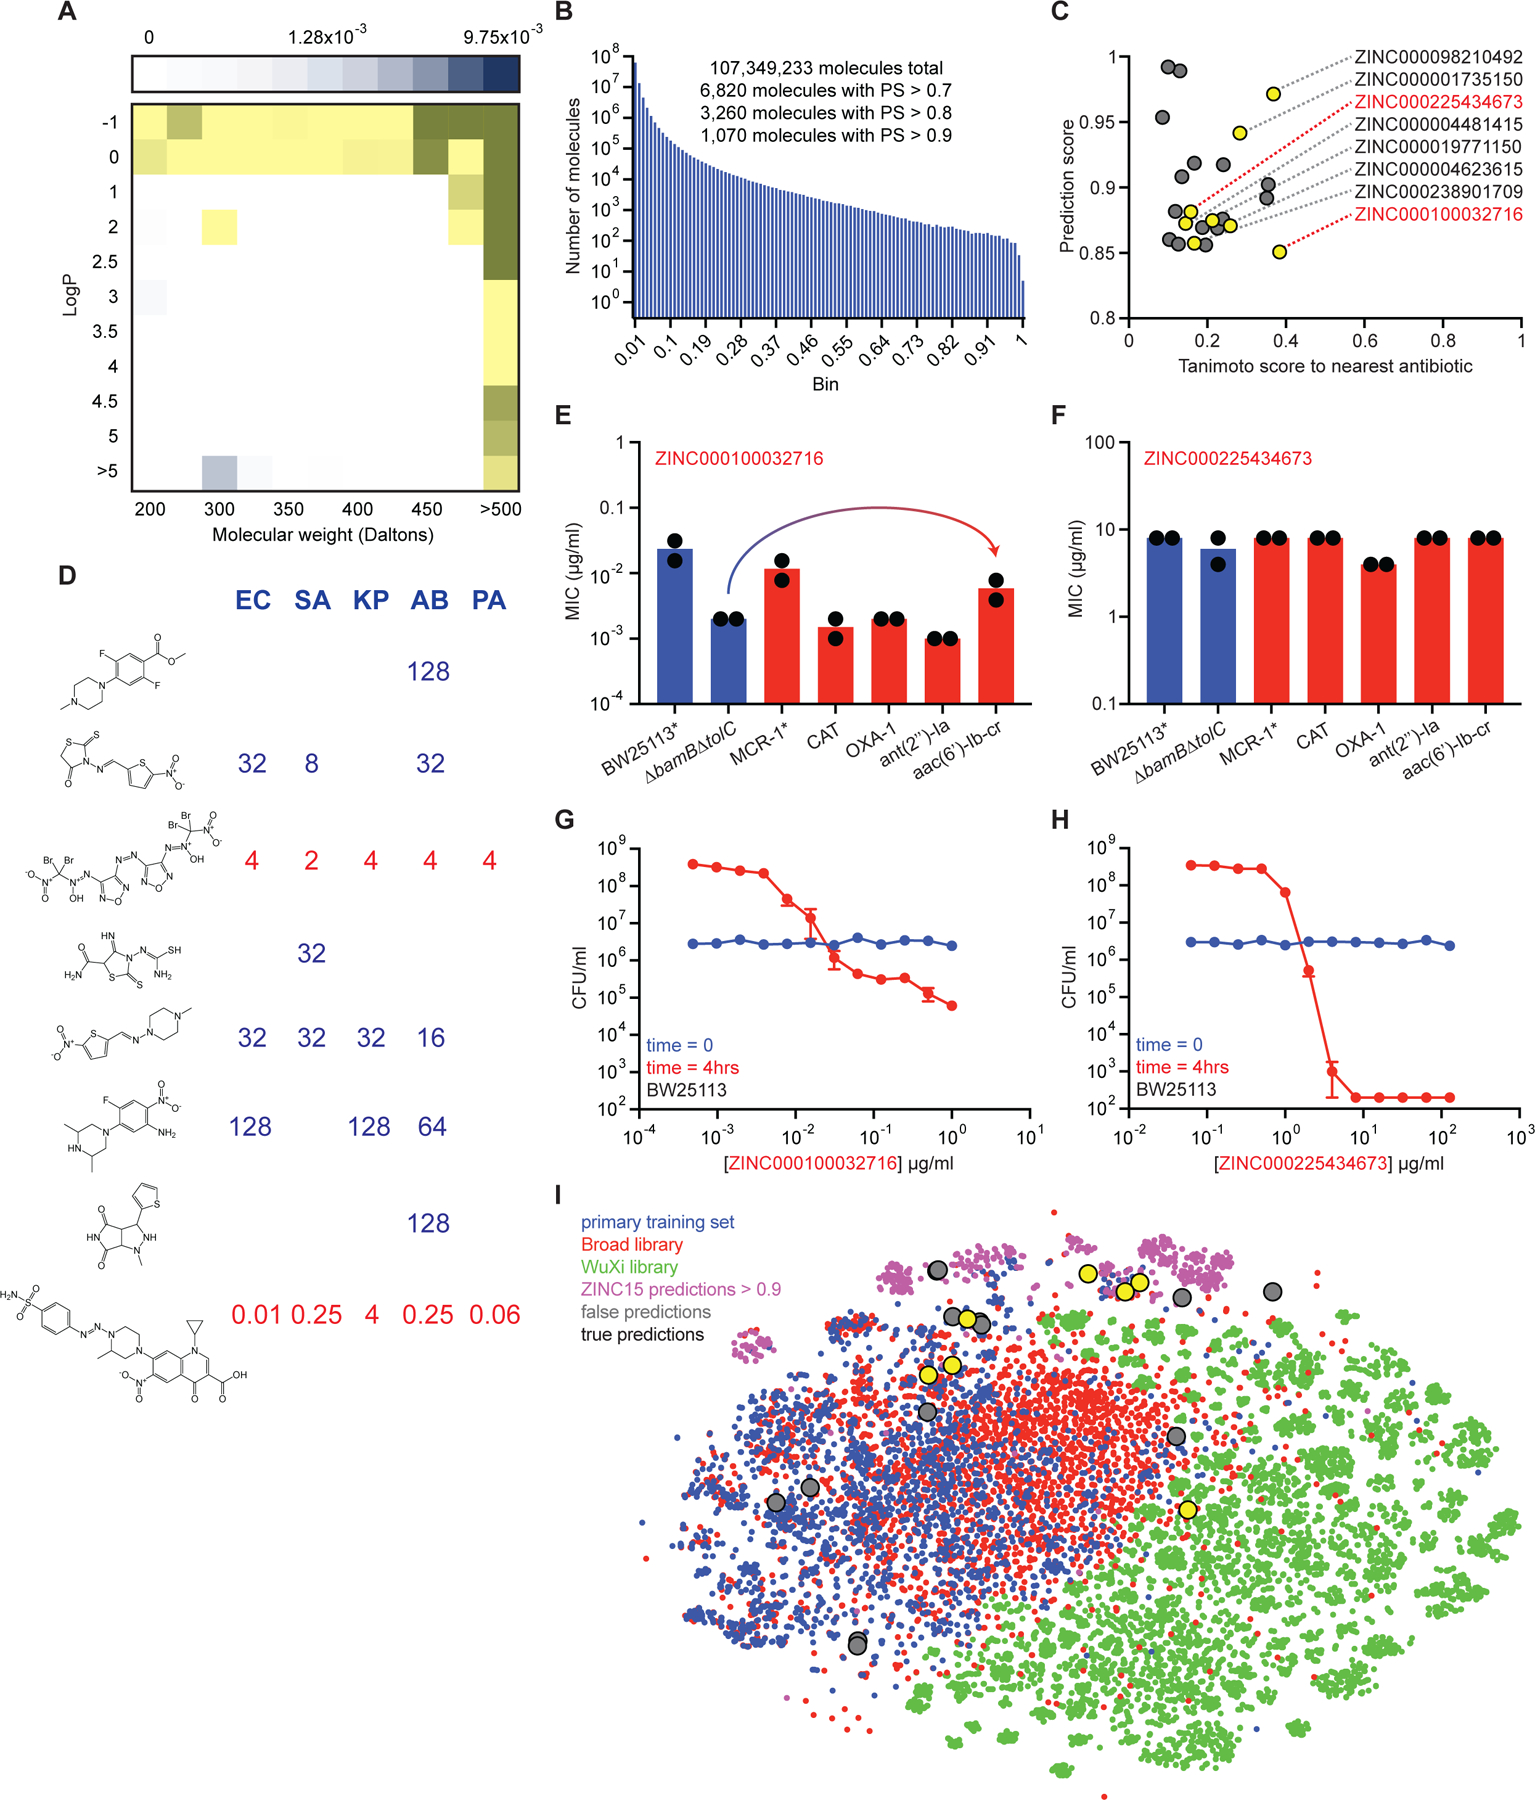
(A) Tranches of the ZINC15 database colored based on the proportion of hits from the original training dataset of 2,335 molecules within each tranche. Darker blue tranches have a higher proportion of molecules that are growth inhibitory against E. coli. Yellow tranches are those selected for predictions. (B) Histogram showing the number of ZINC15 molecules from selected tranches within a corresponding prediction score range. (C) Prediction scores and Tanimoto nearest neighbour antibiotic scores of the 23 predictions that were empirically tested for growth inhibition. Yellow circles represent those molecules that displayed detectable growth inhibition of at least one pathogen. Grey circles represent inactive molecules. ZINC numbers of active molecules are shown on the right. (D) MIC values (µg/ml) of the eight active predictions from the ZINC15 database against E. coli (EC), S. aureus (SA), K. pneumoniae (KP), A. baumannii (AB), and P. aeruginosa (PA). Blank regions represent no detectable growth inhibition at 128 µg/ml. Structures are shown in the same order (top to bottom) as their corresponding ZINC numbers in (C). (E) MIC of ZINC000100032716 against E. coli strains harboring a range of antibiotic-resistance determinants. The mcr-1 gene was expressed in E. coli BW25113. All other resistance genes were expressed in E. coli BW25113 ∆bamB∆tolC. Experiments were conducted with two biological replicates. Note the minor increase in MIC in the presence of aac(6’)-Ib-cr. (F) Same as (E) except using ZINC000225434673. (G) Killing of E. coli in LB media in the presence of varying concentrations of ZINC000100032716 after 0 hr (blue) and 4 hr (red). The initial cell density is ~106 CFU/ml. Shown is the mean of two biological replicates. Bars denote absolute error. (H) Same as (G) except using ZINC000225434673. (I) t-SNE of all molecules from the primary training dataset (blue), the Drug Repurposing Hub (red), the WuXi anti-tuberculosis library (green), the ZINC15 molecules with prediction scores >0.9 (pink), false positive predictions (grey), and true positive predictions (yellow). See also Figure S5, Table S5–S7.
After running predictions on the selected tranches of the ZINC15 database, compounds were binned based on prediction score. This resulted in 6,820 molecules with scores >0.7, 3,260 molecules with scores >0.8, and 1,070 molecules with scores >0.9 (Figure 6B, Table S6A). We compared the top 6,820 ZINC15 prediction ranks from our model (Table S6A) to numerous others, including a learned model without RDKit feature augmentation (Table S6B); a model trained exclusively on RDKit features (Table S6C); a feed-forward deep neural network model using Morgan fingerprints as the molecular representation (Table S6D); a random forest classifier using Morgan fingerprints (Table S6E); and a support-vector machine model using Morgan fingerprints (Table S6F). Next, all molecules were rank ordered based on prediction score using our model and assessed for Tanimoto similarity to all known antibiotics. Since we were interested in identifying antibacterial molecules that were structurally dissimilar from current antibiotics, we prioritized compounds for curation with prediction scores >0.8 and Tanimoto similarities to any known antibiotic <0.4. We were able to curate 23 compounds that met these criteria for empirical testing (Figure 6C, Table S7A).
Next, we assayed these compounds for growth inhibition against E. coli, S. aureus, Klebsiella pneumoniae, A. baumannii, and P. aeruginosa. Indeed, even though our model was trained on growth inhibition against E. coli, since the majority of antibiotics display activity against numerous bacterial species, we reasoned that it could be possible that some of these predictions had bioactivity against diverse pathogens. Excitingly, we observed that eight of the 23 molecules displayed detectable growth inhibitory activity against at least one of the tested species (Figure 6C, 6D, Figure S5D–S5K, Table S7A, S7B).
Of note, we observed two compounds that displayed potent broad-spectrum activity, ZINC000100032716 and ZINC000225434673 (Figure 6D), and overcame an array of common resistance determinants (Figure 6E, 6F). Interestingly, ZINC000100032716 has structural features found in both quinolones and sulfa drugs, yet remains highly divergent from known antibiotics (enrofloxacin nearest neighbour with Tanimoto similarity ~0.39) and was only weakly impacted by plasmid-borne fluoroquinolone resistance via aac(6’)-Ib-cr (Figure 6E) or chromosomal resistance via mutation of gyrA (Figure S5L, S5M). Moreover, both ZINC000100032716 and ZINC000225434673 displayed bactericidal activity against E. coli in rich medium (Figure 6G, 6H), with the latter resulting in complete sterilization after just 4 hours of treatment. Given its novel structure (nitromide nearest neighbour with Tanimoto similarity ~0.16) and low predicted toxicity in humans (Table S7A), we posit that ZINC000225434673 warrants further investigation.
Lastly, upon determining the antibacterial properties of these 23 predicted molecules, we ventured to understand their chemical relationships to the training data. We therefore analyzed the structural relationships between these compounds, ZINC15 molecules with prediction scores >0.9, our primary training set, the Drug Repurposing Hub, and the WuXi anti-tuberculosis library (Figure 6I). Intriguingly, our analysis revealed that the WuXi anti-tuberculosis library contained molecules that largely occupied a distinct chemical space relative to compounds with antibacterial activity, consistent with our results showing that even the highest predicted of these were unable to inhibit the growth of E. coli. Moreover, this analysis emphasized the fact that the predicted compounds resided in varied chemical spaces, suggesting that our model was largely unbiased in enriching for specific chemical moieties – at least below our Tanimoto nearest neighbour threshold of 0.4.
DISCUSSION
The prevalence of antibiotic resistance is rapidly increasing on a global scale. Concurrently, the steadily declining productivity in clinically implementing new antibiotics due to the high risk of early discovery and low return on investment is exacerbating this problem (E. D. Brown and Wright, 2016). Therefore, the development of new approaches that can substantially decrease the cost and increase the rate of antibiotic discovery is essential to reinfuse the pipeline with a steady stream of candidates that show promise as next-generation therapeutics. The adoption of machine learning approaches is ideally suited to address these hurdles. Indeed, modern neural molecular representations have the potential to: (1) decrease the cost of lead molecule identification since screening is limited to gathering appropriate training data, (2) increase the true positive rate of identifying structurally novel compounds with the desired bioactivity, and (3) decrease the time and labor required to find these ideal compounds from months or years to weeks.
In this study, we applied neural molecular representations to predict antibacterial compounds in silico from a collection of >107 million compounds. We first trained a deep neural network model with empirical data analyzing E. coli growth inhibition by molecules from a widely available FDA-approved drug library supplemented with a modest natural product library, totalling 2,335 molecules. Next, we applied the resulting model to predict antibacterial compounds from the Drug Repurposing Hub. Excitingly, amongst the most highly predicted molecules, our model performed well (51.5% accuracy) and ultimately resulted in identifying halicin as a broad-spectrum bactericidal antibiotic with exceptional in vivo efficacy. The low structural similarity of halicin to its nearest neighbour antibiotic, metronidazole (Tanimoto similarity ~ 0.21), showed that our approach was capable of generalization, thus permitting access to new antibiotic chemistry.
We subsequently expanded our prediction space to include the WuXi anti-tuberculosis library, as well as a subset of the ZINC15 database comprising 107,349,233 molecules, in order to identify additional candidate antibacterial molecules. We did not observe growth inhibition from any molecules empirically tested from the WuXi library, in agreement with the correspondingly low model prediction scores (upper limit ~0.37). However, from amongst the 23 molecules from the ZINC15 database that we curated for empirical testing, we observed that eight of these validated as true positives in at least one of the tested pathogens. Importantly, these compounds were curated based on high prediction scores and low Tanimoto similarities to known antibiotics, providing further support that our model was able to generalize to new chemistries. Remarkably, two of these eight molecules, ZINC000100032716 and ZINC000225434673, displayed broad-spectrum activity and maintained activity against E. coli harboring an array of resistance determinants.
It is important to emphasize that machine learning is imperfect. Therefore, the success of deep neural network model-guided antibiotic discovery rests heavily on the coupling of these approaches to appropriate experimental designs. The first consideration should be the assay design for training: what is the biological outcome that is desired after cells are exposed to compounds? In the proof-of-concept described herein, we selected growth inhibition as the biological property on which we would gather training data, since this generally results in a reasonable proportion of active compounds relative to the size of the screening library, and quite easily generates reproducible data. However, the number of bacterial phenotypes that could theoretically result in efficacious antibiotics is expansive (Farha and E. D. Brown, 2015; Kohanski et al., 2010), and so long as it is possible to gather a sufficient quantity of reproducible hit compounds from a primary screen, deep neural network approaches would be well-suited to predict additional molecules with the desired biological property. Indeed, where our screen was largely mechanism of action agnostic, future applications could incorporate phenotypic screening conditions that enrich for molecules against specific biological targets (Stokes and Brown, 2015; Stokes et al., 2016; 2017; J. H. Yang et al., 2019).
The second consideration is the composition of the training data itself: on what chemistry should the model be trained? It is important to use training data that have sufficient chemical diversity in both active and inactive compounds, as well as appropriate pharmacology/ADME/toxicity properties for in vivo application. If all active molecules are structurally similar, the model will be unable to generalize to new scaffolds. Moreover, model accuracy deteriorates as the training set and prediction set diverge. As such, there exists a tension of sorts between prediction accuracy and chemical generalization, and it is advantageous to have the broadest structural variation possible in the training phase to maximize the probability of successful generalization in new chemical spaces. In our case, the desire to train on a supplemented FDA-approved drug library was to offer the capability of performing a small screen and simultaneously capturing substantial chemical diversity with desired pharmacology/ADME/toxicity properties. While mining pre-existing screening datasets could have been implemented, we reasoned that at this early stage in the application of machine learning for antibiotic discovery, a carefully controlled training set would allow for more tractable predictions that avoided potentially unfavorable molecules. Nevertheless, given the increasing volume of screening data that exists (Wang et al., 2017), carefully leveraging these resources could result in millions of molecular graph-biological property relationships, provided that the data are of adequate quality and methodological uniformity so that erroneous predictions could be minimized.
The third consideration is in prediction prioritization: what is the most appropriate approach to selecting tens of molecules for follow-up investigation from thousands of strongly predicted compounds? Since we aimed to identify new antibacterial candidates, our prioritization scheme involved the selection of molecules that were (1) given a high prediction score, (2) structurally unique relative to clinical antibiotics based on Tanimoto nearest neighbour analyses, and in some cases (3) unlikely to display toxicity. Indeed, this approach allowed us to identify halicin, as well as numerous attractive compounds from the ZINC15 database. It should be noted here, however, that investigators can encounter limitations in acquiring predicted compounds in quantities sufficient to perform experiments. This can be due to the inability to synthesize predicted molecules, prohibitive costs of synthesizing those that can, and/or compound instability in aqueous solution. However, emerging models in retrosynthesis and physicochemical property prediction may overcome these limitations in the near future (Coley et al., 2019; Gao et al., 2018).
Where our deep neural network model was trained using a targeted dataset, future endeavors could aim to assemble chemical libraries designed for model training on a task-by-task basis, which may contain on the order of perhaps ~105 compounds of diverse structure. In the context of antibacterial discovery, these training libraries should contain molecules with physicochemical properties consistent with antibacterial drugs (Tommasi et al., 2015), yet sufficiently diverse such that the model can generalize to unconventional chemistry. Furthermore, with repeated training cycles across phylogenetically diverse species, it may be possible to predict molecules with antibacterial activity against a specified spectrum of pathogens. This has the promise to result in narrow-spectrum agents that can be administered systemically without damaging the host microbiota. Moreover, by training on multidrug-resistant pathogens, it may be possible to identify scaffolds that overcome pre-existing resistance determinants. Overall, our results suggest that the time is ripe for the application of modern machine learning approaches for antibiotic discovery ‒ such efforts could increase the rate at which new molecular entities are discovered, decrease the resources required to identify these molecules, and decrease associated costs. Deep learning approaches could therefore enable us to expand our antibiotic arsenal and help outpace the dissemination of resistance.
STAR METHODS
LEAD CONTACT AND MATERIALS AVAILABILITY
Further information and requests for resources and reagents should be directed to James J. Collins (jimjc@mit.edu). All unique/stable reagents generated in this study are available from the Lead Contact with a completed Materials Transfer Agreement.
METHODS DETAILS
Model training and predictions.
A directed-message passing neural network (Chemprop), like other message passing neural networks, learns to predict molecular properties directly from the graph structure of the molecule, where atoms are represented as nodes and bonds are represented as edges. For every molecule, we reconstructed the molecular graph corresponding to each compound’s SMILES string and determined the set of atoms and bonds using the open-source package RDKit (Landrum, 2006). Next, we initialized a feature vector, as described in Yang et al. (K. Yang et al., 2019), for each atom and bond based on computable features:
Atom features: atomic number, number of bonds for each atom, formal charge, chirality, number of bonded hydrogens, hybridization, aromaticity, atomic mass.
Bond features: bond type (single/double/triple/aromatic), conjugation, ring membership, stereochemistry.
The model applies a series of message passing steps where it aggregates information from neighboring atoms and bonds to build an understanding of local chemistry. In Chemprop, on each step of message passing, each bond’s featurization is updated by summing the featurization of neighbouring bonds, concatenating the current bond’s featurization with the sum, and then applying a single neural network layer with non-linear activation. After a fixed number of message-passing steps, the learned featurizations across the molecule are summed to produce a single featurization for the whole molecule. Finally, this featurization is fed through a feed-forward neural network that outputs a prediction of the property of interest. Since the property of interest in our application was the binary classification of whether a molecule inhibits the growth of E. coli, the model is trained to output a number between 0 and 1, which represents its prediction about whether the input molecule is growth inhibitory.
In addition to the basic D-MPNN architecture described above, we employed three model optimizations (K. Yang et al., 2019):
Additional molecule-level features:
While the message passing paradigm is excellent for extracting features that depend on local chemistry, it can struggle to extract global molecular features. This is especially true for large molecules, where the longest path through the molecule may be longer than the number of message-passing iterations performed, meaning information from one side of the molecule does not inform the features on the other side of the molecule. For this reason, we chose to concatenate the molecular representation that is learned via message passing with 200 additional molecule-level features computed with RDKit.
Hyperparameter optimization:
The performance of machine learning models is known to depend critically on the choice of hyperparameters, such as the size of the neural network layers, which control how and what the model is able to learn. We used the Bayesian hyperparameter optimization scheme, with 20 iterations of optimization to improve the hyperparameters of our model (see table below). Baysian hyperparameter optimization learns to select optimal hyperparameters based on performance using prior hyperparameter settings, allowing for rapid identification of the best set of hyperparameters for any model.
| Hyperparameter | Range | Value |
|---|---|---|
| Number of message-passing steps | [2, 6] | 5 |
| Neural network hidden size | [300, 2400] | 1600 |
| Number of feed-forward layers | [1, 3] | 1 |
| Dropout probability | [0, 0.4] | 0.35 |
Ensembling:
Another standard machine learning technique used to improve performance is ensembling, where several copies of the same model architecture with different random initial weights are trained and their predictions are averaged. We used an ensemble of 20 models, with each model trained on a different random split of the data (Dietterich, 2000).
Our initial training dataset consisted of 2,335 molecules, with 120 compounds (5.14%) showing growth inhibitory activity against E. coli, as defined by endpoint OD600 < 0.2. We performed predictions on the Drug Repurposing Hub, consisting of 6,111 unique molecules; the WuXi anti-tuberculosis library, consisting of 9,997 unique molecules; and tranches of the ZINC15 database. The ZINC15 tranches that we used for molecular predictions were selected based on their likelihood to contain antibiotic-like molecules; these tranches included: ‘AA’, ‘AB’, ‘BA’, ‘BB’, ‘CA’, ‘CB’, ‘CD’, ‘DA’, ‘DB’, ‘EA’, ‘EB’, ‘FA’, ‘FB’, ‘GA’, ‘GB’, ‘HA’, ‘HB’, ‘IA’, ‘IB’, ‘JA’, ‘JB’, ‘JC’, ‘JD’, ‘KA’, ‘KB’, ‘KC’, ‘KD’, ‘KE’, ‘KF’, ‘KG’, ‘KH’, ‘KI’, ‘KJ’, and ‘KK’, constituting a dataset of 107,349,233 unique molecules.
Our experimental procedure consisted of four phases: (1a) a training phase to evaluate the optimized but non-ensembled model and (1b) training the ensemble of optimized models; (2) a prediction phase; (3) a retraining phase; and (4) a final prediction phase. We began by evaluating our model on the training set of 2,335 molecules using all optimizations except for ensembling, in order to determine the best performance of a single model. Here, we randomly split the dataset into 80% training data, 10% validation data, and 10% test data. We trained our model on the training data for 30 epochs, where an epoch is defined as a single pass through all of the training data, and we evaluated it on the validation data at the end of each epoch. After training was complete, we used the model parameters that performed best on the validation data and tested the model with those parameters on the test data. We repeated this procedure with 20 different random splits of the data and averaged the results. After we were satisfied with model performance, we conducted predictions on new datasets. Since we wanted to maximize the amount of training data and were no longer interested in measuring performance on the test set, we trained new models on the training data from each of 20 random splits, each with 90% training data, 10% validation data, and no test data.
The ensemble consisting of these 20 models is the model that was applied first to the Drug Repurposing Hub, and then the WuXi anti-tuberculosis library. After empirically testing the highest and lowest predicted molecules from these libraries for growth inhibition against E. coli, we included all these data into our original training sets to create a new training set. The updated training set contained 2,911 unique molecules, with 232 (7.97%) showing growth inhibitory activity. We next used our retrained model to make predictions on the aforementioned subset of the ZINC15 database. We selected all molecules with a prediction score >0.7, which resulted in 6,820 compounds. All molecules selected for curation were subsequently cross-referenced with SciFinder to ensure that these were not clinical antibiotics.
We lastly compared the prediction outputs of our augmented D-MPNN with a D-MPNN without RDKit features; a feedforward DNN model with the same depth as our D-MPNN model with hyperparameter optimization using RDKit features only; the same DNN instead using Morgan fingerprints (radius 2) as the molecular representation; and RF and SVM models using the same Morgan fingerprint representations. We used the scikit-learn implementation of a random forest classifier with all of the default parameters except for the number of trees, where we used 500 instead of 10. When making predictions, we output the growth inhibition probability for each molecule according to the random forest, which is the proportion of trees in the model that predict a 1 for that molecule. Similarly, we used the scikit-learn implementation of a support vector machine with all of the default parameters. When making predictions, we output the signed distance between the Morgan fingerprint of the molecule and the separating hyperplane that is learned by the SVM. This number represents how much the model predicts a molecule is antibacterial, with large positive distances meaning most likely antibacterial and large negative distances meaning most likely not. Although the signed distance is not a probability, it can still be used to rank the molecules according to how likely they are to be antibacterial.
To predict the toxicity of molecules for possible in vivo applications, we trained a Chemprop model on the ClinTox dataset. This dataset consisted of 1,478 molecules, each with two binary properties: (a) clinical trial toxicity and (b) FDA-approval status. Of these 1,478 molecules, 94 (6.36%) had clinical toxicity and 1,366 (92.42%) were FDA approved. Using the same methodology as described in phase (1) of our experimental procedure, the Chemprop model was trained on both properties simultaneously and learned a single molecular representation that was used by the feed-forward neural network layers to predict toxicity. We utilized the same RDKit features as in our other models, except for that the ClinTox model was an ensemble of five models and used the following optimal hyperparameters: message-passing steps = 6; neural network hidden size = 2200; number of feed-forward layers = 3; and dropout probability = 0.15. This ensemble of models was subsequently used to make toxicity predictions on our candidate molecules.
Chemical analyses.
We utilized Tanimoto similarity to quantify the chemical relationship between molecules predicted in our study. The Tanimoto similarity of two molecules is a measure of the proportion of shared chemical substructures in the molecules. To compute Tanimoto similarity, we first determined Morgan fingerprints (computed using RDKit) for each molecule using a radius of 2 and 2048-bit fingerprint vectors. Tanimoto similarity was then computed as the number of chemical substructures contained in both molecules divided by the total number of unique chemical substructures in either molecule. The Tanimoto similarity is thus a number between 0 and 1, with 0 indicating least similar (no substructures are shared) and 1 indicating most similar (all substructures are shared). Morgan fingerprints with radius R and B bits are generated by looking at each atom and determining all of the substructures centered at that atom that include atoms up to R bonds away from the central atom. The presence or absence of these substructures is encoded as 1 and 0 in a vector of length B, which represents the fingerprint. For t-SNE analyses, plots were created using scikit-learn’s implementation of t-Distributed Stochastic Neighbor Embedding. Here, we first used RDKit to compute Morgan fingerprints for each molecule using a radius of 2 and 2048-bit fingerprint vectors. We then used t-SNE with the Jaccard distance metric to reduce the data points from 2048 dimensions to the two dimensions that are plotted. Note that Jaccard distance is another name for Tanimoto distance, and Tanimoto distance is defined as: Tanimoto distance = 1 - Tanimoto similarity. Thus, the distance between points in the t-SNE plots is an indication of the Tanimoto similarity of the corresponding molecules, with greater distance between molecules indicating lower Tanimoto similarity. We used scikit-learn’s default values for all t-SNE parameters besides the distance metric.
Chemical screening.
E. coli BW25113 was grown overnight in 3 ml Luria-Bertani (LB) medium and diluted 1/10,000 into fresh LB. 99 µl of cells was added to each well of a 96-well flat-bottom plate (Corning) using a multichannel pipette. Next, 1 µl of a 5 mM stock of each molecule from an FDA-approved drug library supplemented with a natural product library (2,560 molecules total; MicroSource Discovery Systems) was added, in duplicate, using an Agilent Bravo liquid handler. The final screening concentration was 50 µM. Plates were then incubated in sealed plastic bags at 37°C without shaking for 16 hr, and subsequently read at 600 nm using a SpectraMax M3 plate reader (Molecular Devices) to quantify cell growth. Plate data were normalized based on the interquartile mean of each plate.
Growth inhibition assays.
Cells were grown overnight in 3 ml LB medium and diluted 1/10,000 into fresh LB. In 96-well flat-bottom plates (Corning), cells were then introduced to compound at a final concentration of 50 µM, or to compound at two-fold serial dilutions, in final volumes of 100 μl. Plates were then incubated at 37°C without shaking until untreated control cultures reached stationary phase, at which time they were read at 600 nm using a SpectraMax M3 plate reader. We note here that the incubation time required to reach stationary phase differed between species but was generally between 12 hr and 18 hr. For ZINC15 compound validation, the strains were E. coli BW25113, S. aureus USA 300, K. pneumoniae ATCC 700721, A. baumannii ATCC 17978, and P. aeruginosa PA01. C. difficile 630 growth inhibition was performed as described above, except cells were grown in BHI + 0.1% taurocholate for 18 hr in an anaerobic chamber (Coy Laboratory Products). M. tuberculosis H37Rv was grown at 37°C in Middlebrook 7H9 broth supplemented with 10% OADC (oleic acid-albumin-dextrose complex, vol/vol), 0.2% glycerol, and 0.05% Tween-80, or on Middlebrook 7H10 plates supplemented with 10% OADC and 0.5% glycerol. Cells were grown to mid-log phase, then added to 96-well plates at OD600 = 0.0025, in a total of 50 µl of 7H9 medium. In addition, each well contained 45 µl of 7H9 medium and varying compound concentrations diluted in a total of 5 µl of medium. Plates were incubated at 37°C in a humidified container for 14 days. OD600 was measured using a SpectraMax M5 plate reader.
Bacterial cell killing assays.
Cells were grown overnight in 3 ml LB medium and diluted 1/10,000 into fresh LB. In 96-well flat-bottom plates (Corning), cells were grown to the required density, at which time antibiotic was added at the indicated concentration and cultures were incubated for the required duration. Cells were then pelleted in plates by centrifugation at 4000 x g for 15 min at 4°C and washed in ice cold PBS. After washing, cells were 10-fold serially diluted in PBS and plated on LB to quantify cell viability. In experiments where cells were incubated with antibiotic in nutrient-deplete conditions, cells were grown to the required density in LB media, washed in PBS, and subsequently resuspended in PBS prior to the addition of antibiotic. After cultures were incubated for the required duration, cells were pelleted in plates by centrifugation at 4000 x g for 15 min at 4°C and washed in ice cold PBS. After washing, cells were 10-fold serially diluted in PBS and plated on LB to quantify cell viability. M. tuberculosis M37Rv was grown to mid-log phase, then 30,000 cells were added to a 24 well plate in 1 ml of 7H9 medium. A sample from each well was taken as time=0, prior to halicin addition, then halicin was added to each well at the 16 µg/ml (1x MIC). At the indicated time points, samples were taken from each well and plated on 7H10. Control wells contained the relevant DMSO concentration without halicin. Plates were incubated at 37°C and counted twice after 4 and 6 weeks.
Mutant generation.
For serial passage evolution, E. coli BW25113 was grown overnight in 3 ml LB medium and diluted 1/10,000 into fresh LB. Cells were grown in 96-well flat-bottom plates (Corning), in the presence of varying concentrations of halicin (or ciprofloxacin) at two-fold serial dilutions, in final volumes of 100 μl. Plates were incubated at 37°C without shaking for 24 hr, at which time they were read at 600 nm using a SpectraMax M3 plate reader. After 24 hr, cells that grew in the presence of the highest concentration of halicin (or ciprofloxacin) were diluted 1/10,000 into fresh LB, and once again introduced to varying concentrations of halicin at two-fold serial dilutions. This procedure was performed every 24 hr over the course of 30 days. For spontaneous suppressor generation, ~109 CFU of E. coli BW25113 grown in LB media was spread onto LB agar in 10 cm petri dishes, either without antibiotics or supplemented with ciprofloxacin (Millipore Sigma) or halicin (TCI Chemicals) at the indicated concentrations. Plates were subsequently incubated at 37°C for seven days, at which time colonies from each plate were re-streaked onto LB and LB supplemented with antibiotics at the same concentration on which the colonies were originally grown. These plates were grown at 37°C overnight to monitor re-growth. For strain engineering, E. coli BW25113 ∆nsfA::kan ∆nfsB::cat was derived from BW25113 ∆nsfA::kan via introduction of a cat gene to disrupt the nfsB ORF using the Lambda Red method (Datsenko and Wanner, 2000). Briefly, 2 ml 2x YT media with BW25113 ∆nsfA::kan carrying the temperature-sensitive plasmid pKD46 at 30°C was induced with 20 mM arabinose. Upon reaching mid-log phase (OD600~0.5), cells were pelleted at 6000 x g for 2 min, then washed three times with 1 ml 15% glycerol. The final pellet was resuspended in 200 µl of 15% glycerol, and 50 µl was mixed with 300 ng of disruption fragment (generated using primers AB5044 and AB5045 on pKD32 to amplify the FRT-flanked cat cassette). Cells were electroporated at 1800 kV, then allowed to recover overnight in 5 ml 2x YT at 30°C. Cells were then pelleted at 6000 x g for 2 min, resuspended in 200 µl deionized water and plated on 2x YT agar plates with 15 µg/ml kanamycin (Millipore Sigma) and 20 µg/ml chloramphenicol (Millipore Sigma). Plates were incubated at 37°C for 24–48 hr. Single colonies were PCR checked (primers AB5046, AB5047) for loss of the nfsB gene (1069 bp) and appearance of the cat gene insertion (1472 bp). Finally, positive colonies were assayed for loss of pKD46 at 37°C by replica plating on 15 µg/ml kanamycin and 20 µg/ml chloramphenicol with or without 50 µg/ml carbenicillin (Millipore Sigma). AB5044
TAGCCGGGCAGATGCCCGGCAAGAGAGAATTACACTTCGGTTAAGGTGATATTCCGGGGATCCGTCGACC
AB5045
ACCTTGTAATCTGCTGGCACGCAAAATTACTTTCACATGGAGTCTTTATGTGTAGGCTGGAGCTGCTTCG
AB5046
tgcaaaataatatgcaccacgacggcggtcagaaaaataa
AB5047
gaagcgttacttcgcgatctgatcaacgattcgtggaatc
RNA sequencing.
Cells were grown overnight in 3 ml LB medium and diluted 1/10,000 into 50 ml fresh LB. When cultures reached ~107 CFU/ml, halicin was added at 0.25x MIC (0.5 µg/ml), 1x MIC (2 µg/ml), or 4x MIC (8 µg/ml) and cells were incubated for the noted durations. After incubation, cells were harvested via centrifugation at 15,000 x g for 3 min at 4°C, and RNA was purified using the Zymo Direct-zol 96-well RNA purification kit (R2056). Briefly, ~107-108 CFU pellets were lysed in 500 µl hot Trizol reagent (Life Technologies). 200 µl chloroform (Millipore Sigma) was added, and samples were centrifuged at 15,000 x g for 3 min at 4°C. 200 µl of the aqueous phase was added to 200 µl anhydrous ethanol (Millipore Sigma), and RNA was purified using a Zymo-spin plate as per the manufacturer’s instructions. After purification, Illumina cDNA libraries were generated using a modified version of the RNAtag-seq protocol (Shishkin et al., 2015). Briefly, 500 ng – 1 μg of total RNA was fragmented, depleted of genomic DNA, dephosphorylated, and ligated to DNA adapters carrying 5’-AN8-3’ barcodes of known sequence with a 5’ phosphate and a 3’ blocking group. Barcoded RNAs were pooled and depleted of rRNA using the RiboZero rRNA depletion kit (Epicentre). Pools of barcoded RNAs were converted to Illumina cDNA libraries in two main steps: (1) reverse transcription of the RNA using a primer designed to the constant region of the barcoded adaptor with addition of an adapter to the 3’ end of the cDNA by template switching using SMARTScribe (Clontech), as previously described (Zhu et al., 2018); and (2) PCR amplification using primers whose 5’ ends target the constant regions of the 3’ or 5’ adaptors and whose 3’ ends contain the full Illumina P5 or P7 sequences. cDNA libraries were sequenced on the Illumina NextSeq 500 platform to generate paired end reads. Following sequencing, reads from each sample in a pool were demultiplexed based on their associated barcode sequence. Up to one mismatch in the barcode was allowed, provided it did not make assignment of the read to a different barcode possible. Barcode sequences were removed from the first read, as were terminal G’s from the second read that may have been added by SMARTScribe during template switching. Next, reads were aligned to the E. coli MG1655 genome (NC_000913.3) using BWA (Li et al., 2009) and read counts were assigned to genes and other genomic features. Differential expression analysis was conducted with DESeq2 (Love et al., 2014) and/or edgeR (Robinson et al., 2010). To verify coverage, visualization of raw sequencing data and coverage plots in the context of genome sequences and gene annotations was conducted using GenomeView (Abeel et al., 2012). To determine biological response of cells as a function of halicin exposure, we performed hierarchical clustering of the gene expression profiles using the clustergram function in Matlab 2016a. We selected the Euclidean distance as the metric to define the pairwise distance between observations, which measures a straight-line distance between two points. The use of Euclidian distance has been considered as the most appropriate to cluster log-ratio data (D’haeseleer, 2005). With a metric defined, we next selected the average linkage as the clustering method. The average linkage uses the algorithm called unweighted pair group method with arithmetic mean (UPGMA), which is the most popular and preferred algorithm for hierarchical data clustering (Jaskowiak et al., 2014; Loewenstein et al., 2008). UPGMA uses the mean similarity across all cluster data points to combine the nearest two clusters into a higher-level cluster. UPGMA assumes there is a constant rate of change among species (genes) analyzed. We tested all alternative clustering metrics available (i.e., Spearman, Hamming, cosine, etc.) in the pdist function within the clustergram function in Matlab and concluded that the Euclidean metric together with the average linkage allow the clearest and probably most meaningful definition of clusters for our data set. Transcript cluster enrichment was performed using EcoCyc Pathway Tools (Karp, 2001; Karp et al., 2016; Keseler et al., 2013). P values were calculated using Fisher’s exact test.
DiSC3(5) assays.
S. aureus USA300 and E. coli MC1061 were streaked onto LB agar and grown overnight at 37°C. Single colonies were picked and used to inoculate 50 ml LB in 250 ml baffled flasks, which were incubated for 3.5 hr in a 37°C incubator shaking at 250 rpm. Cultures were pelleted at 4000 x g for 15 min and washed three times in buffer. For E. coli, the buffer was 5 mM HEPES with 20 mM glucose (pH 7.2). For S. aureus, the buffer was 50 mM HEPES with 300 mM KCl and 0.1% glucose (pH 7.2). Both cell densities were normalized to OD600~0.1, loaded with 1 µM DiSC3(5) dye (3,3’-dipropylthiadicarbocyanine iodide), and left to rest for 10 min in the dark for probe fluorescence to stabilize. Fluorescence was measured in a cuvette-based fluorometer with stirring (Photon Technology International) at 620 nm excitation and 670 nm emission wavelengths. A time-course acquisition was performed, with compounds injected after 60 sec of equilibration to measure increases or decreases in fluorescence. For E. coli, polymyxin B was used as a control to monitor ∆ψ dissipation. For S. aureus, valinomycin was used as a ∆ψ control and nigiricin was used as a ∆pH control. Upon addition of antibiotic, fluorescence was read continuously for 3 min and at an endpoint of 4 hr.
EXPERIMENTAL MODEL AND SUBJECT DETAILS
A. baumannii mouse infection model.
Experiments were conducted according to guidelines set by the Canadian Council on Animal Care, using protocols approved by the Animal Review Ethics Board at McMaster University under Animal Use Protocol #17–03-10. Before infection, mice were relocated at random from a housing cage to treatment or control cages. No animals were excluded from analyses, and blinding was considered unnecessary. Six- to eight-week old Balb/c mice were pretreated with 150 mg/kg (day −4) and 100 mg/kg (day −1) of cyclophosphamide to render mice neutropenic. Mice were then anesthetized using isofluorane and administered the analgesic buprenorphine (0.1 mg/kg) intraperitoneally. A 2 cm2 abrasion on the dorsal surface of the mouse was inflicted through tape-stripping to the basal layer of epidermis using approximately 25–30 pieces of autoclave tape. Mice were infected with ~2.5×10⁵ CFU A. baumannii CDC 288 directly pipetted on the wounded skin. The infection was established for 1 hr prior to treatment with Glaxal Base supplemented with vehicle (0.5% DMSO) or halicin (0.5% w/v). Groups of mice were treated 1 hr, 4 hr, 8 hr, 12 hr, 20 hr, and 24 hr post-infection. Mice were euthanized at the experimental endpoint of 25 hr and the wounded tissue collected, homogenized, and plated onto LB to quantify bacterial load.
C. difficile mouse infection model.
Experiments were conducted according to protocol IS00000852–3, approved by Harvard Medical School Institutional Animal Care and Use Committee and the Committee on Microbiological Safety. C. difficile 630 spores were prepared from a single batch and stored long term at 4°C, as previously reported (Edwards and McBride, 2016). To disrupt colonization resistance and enable infection with C. difficile, four colonies (n=20) of six- to eight-week-old C57BL/6 mice were administered 200 mg/kg ampicillin every 24 hr for 72 hr via intraperitoneal injection. Antibiotic-treated mice were given 24 hr to recover prior to infection with C. difficile. A total of 5×10³ spores of C. difficile strain 630 was delivered via oral gavage and mice were randomly assigned to three treatment groups: 50mg/kg metronidazole (n=7), 15 mg/kg halicin (n=7) and 10% PEG 300 vehicle (n=6). We note here that three mice from the halicin treatment group failed to display C. difficile colonization. Beginning at 24 hr after C. difficile challenge, mice were gavaged with antibiotics or vehicle control every 24 hr for five days. To monitor C. difficile colonization, fecal samples were collected, weighed and diluted under anaerobic conditions with anaerobic PBS. CFUs were quantified using TCCFA plates supplemented with 50 μg/ml erythromycin at 37°C under anaerobic conditions, as previously described (Winston et al., 2016).
Supplementary Material
Table S5. Related to Figure 6. Prediction scores and optical density values of the top 200 (yellow) and bottom 100 (blue) WuXi molecules against E. coli.
Table S1A. Related to Figure 2. Primary screening data of the 2,560-molecule training library.
Table S1B. Related to Figure 2. Rank-ordered de-duplicated primary screening dataset.
Table S4A. Related to Figure 4. Whole transcriptome sequencing of E. coli treated with halicin at 0.25x MIC.
Table S4B. Related to Figure 4. Whole transcriptome sequencing of E. coli treated with halicin at 1x MIC.
Table S4C. Related to Figure 4. Whole transcriptome sequencing of E. coli treated with halicin at 4x MIC.
Table S7A. Related to Figure 6. ZINC15 predictions used for empirical validation.
Table S7B. Related to Figure 6. Ranks of the 8 correctly predicted ZINC15 molecules across different models.
Table S3. Related to Figure 3. Antibiotic-resistant CDC strains used for halicin efficacy assays.
Table S2A. Related to Figure 2. List of RDKit molecular features used to augment the D-MPNN.
Table S2B. Related to Figure 2. Prediction scores of molecules from the Drug Repurposing Hub that were not found in the training dataset.
Table S2C. Related to Figure 2. Prediction scores of molecules from the Drug Repurposing Hub that were not found in the training dataset (learned features only).
Table S2D. Related to Figure 2. Prediction scores of molecules from the Drug Repurposing Hub that were not found in the training dataset (RDKit features only).
Table S2E. Related to Figure 2. Prediction scores of molecules from the Drug Repurposing Hub that were not found in the training dataset (feed forward DNN using Morgan fingerprints).
Table S2F. Related to Figure 2. Prediction scores of molecules from the Drug Repurposing Hub that were not found in the training dataset (random forest classifier using Morgan fingerprints).
Table S2G. Related to Figure 2. Prediction scores of molecules from the Drug Repurposing Hub that were not found in the training dataset (SVM model using Morgan fingerprints).
Table S2H. Related to Figure 2. Tanimoto similarity of training dataset molecules to halicin.
Table S6A. Related to Figure 6. ZINC15 molecules with prediction score >0.7.
Table S6B. Related to Figure 6. Prediction scores of the top 6,820 molecules from the ZINC15 database (learned features only).
Table S6C. Related to Figure 6. Prediction scores of the top 6,820 molecules from the ZINC15 database (RDKit features only).
Table S6D. Related to Figure 6. Prediction scores of the top 6,820 molecules from the ZINC15 database (feed forward DNN using Morgan fingerprints).
Table S6E. Related to Figure 6. Prediction scores of the top 6,820 molecules from the ZINC15 database (random forest classifier using Morgan fingerprints).
Table S6F. Related to Figure 6. Prediction scores of the top 6,820 molecules from the ZINC15 database (SVM model using Morgan fingerprints).
Figure S1. Related to Figure 2. Primary screening and initial model training. (A) Primary screening data for growth inhibition of E. coli by 2,560 molecules within the FDA-approved drug library supplemented with a natural product collection. Red are growth inhibitory molecules; blue are non-growth inhibitory molecules. (B) Rank-ordered de-duplicated screening data containing 2,335 molecules. Shown is the mean of two biological replicates. Red are growth inhibitory molecules; blue are non-growth inhibitory molecules.
Figure S2. Related to Figure 3. Activity of halicin. (A) Killing of E. coli in LB media in the presence of varying concentrations of halicin after 1 hr (blue), 2 hr (cyan), 3 hr (green), and 4 hr (red). The initial cell density is ~108 CFU/ml. Shown is the mean of two biological replicates. Bars denote absolute error. (B) Same as (A), with initial cell density ~107 CFU/ml. (C) Killing of E. coli in PBS in the presence of varying concentrations of halicin after 2 hr (blue), 4 hr (cyan), 6 hr (green), and 8 hr (red). The initial cell density is ~108 CFU/ml. Shown is the mean of two biological replicates. Bars denote absolute error. (D) Same as (C), with initial cell density ~107 CFU/ml. (E) Killing of E. coli in PBS in the presence of varying concentrations of ampicillin after 2 hr (blue), 4 hr (cyan), 6 hr (green), and 8 hr (red). The initial cell density is ~108 CFU/ml. Shown is the mean of two biological replicates. Bars denote absolute error. (F) Same as (E), with initial cell density ~107 CFU/ml. (G) Same as (E), with initial cell density ~106 CFU/ml. (H) Killing of E. coli in LB media in the presence of varying concentrations of ampicillin after 1hr (blue), 2 hr (cyan), 3 hr (green), and 4 hr (red). The initial cell density is ~108 CFU/ml. Shown is the mean of two biological replicates. Bars denote absolute error. (I) Same as (H), except with initial cell density ~107 CFU/ml. (J) Same as (H), except with initial cell density ~106 CFU/ml. (K) MIC of various antibiotics against E. coli strains harboring a range of plasmid-borne, functionally diverse, antibiotic-resistance determinants. The mcr-1 gene was expressed in E. coli BW25113. All other resistance genes were expressed in E. coli BW25113 ∆bamB∆tolC. WT is wildtype E. coli. R is E. coli harboring a resistance plasmid. Chlor is chloramphenicol. Amp is ampicillin. Gent is gentamicin. Levo is levofloxacin. Experiments were conducted with two biological replicates. (L) Growth inhibition of wildtype E. coli (blue) and ∆nfsA∆nfsB E. coli (green) by halicin. Shown is the mean of two biological replicates. Bars denote absolute error. (M) Growth inhibition of wildtype E. coli (blue) and ∆nfsA∆nfsB E. coli (green) by nitrofurantoin. Shown is the mean of two biological replicates. Bars denote absolute error.
Figure S3. Related to Figure 4. Mechanistic investigations into halicin. (A) Evolution of spontaneous resistance against halicin (top) or ciprofloxacin (bottom). E. coli BW25113 (~109 CFU) was plated onto non-selective or selective media and incubated for 7 days prior to imaging, and re-streaking of colonies onto fresh non-selective or selective media. 20 µg/ml halicin and 20 ng/ml ciprofloxacin, respectively, were used for suppressor mutant evolution. Note that the colonies that emerged at the edge of halicin-supplemented plates after 7 days grew well on LB non-selective media but did not re-streak onto halicin-supplemented media. All seven selected ciprofloxacin-resistant colonies grew on both non-selective and ciprofloxacin-supplemented media. (B) Whole transcriptome hierarchical clustering of E. coli treated with halicin at 0.25x MIC for 1hr, 2 hr, 3 hr, and 4 hr. Shown is the mean transcript abundance of two biological replicates of halicin-treated cells relative to untreated control cells on a log2-fold scale. In the growth curve, blue represents untreated cells; red represents halicin-treated cells. (C) Same as (B), except cells were treated with 1x MIC halicin. (D) Growth inhibition by halicin against S. aureus USA300 in pH-adjusted media. Shown is the mean of two biological replicates. Bars denote absolute error. (E) Growth inhibition by halicin against E. coli in LB (blue) or LB supplemented with 25 mM sodium bicarbonate (red), which dissipates the ∆pH component of the proton motive force. Shown is the mean of two biological replicates. Bars denote absolute error. (F) DiSC3(5) fluorescence in S. aureus upon exposure to valinomycin (64 µg/ml; dissipates ∆ψ), nigericin (16 µg/ml; dissipates ∆pH), halicin (4 µg/ml), or DMSO. Halicin induced fluorescence changes more similar to nigericin relative to valinomycin, suggesting that halicin dissipates the ∆pH component of the proton motive force. The right panel is a magnified image of the drug-induced decrease in fluorescence shown in the left. (G) DiSC3(5) fluorescence in S. aureus upon exposure to valinomycin, nigericin, halicin, or DMSO after 4 hr of exposure. (H) Growth inhibition by daptomycin (left) and halicin (right) against S. aureus RN4220 (blue) or a daptomycin-resistant RN4220 strain (∆dsp1; red) in LB media. Shown is the mean of two biological replicates. Bars denote absolute error.
Figure S4. Related to Figure 5. Activity of halicin against A. baumannii CDC 288. (A) Killing of A. baumannii in PBS in the presence of varying concentrations of halicin after 2 hr (blue), 4 hr (cyan), 6 hr (green), and 8 hr (red). The initial cell density is ~107 CFU/ml. Shown is the mean of two biological replicates. Bars denote absolute error. (B) Same as (A), with initial cell density ~106 CFU/ml.
Figure S5. Related to Figure 6. Model predictions from the WuXi anti-tuberculosis library and the ZINC15 database. (A) Rank-ordered prediction scores of WuXi anti-tuberculosis library molecules. Note the overall low prediction scores. (B) The top 200 predictions from the data shown in (A) were curated for empirical testing for growth inhibition of E. coli. None were growth inhibitory, in agreement with their low prediction scores. Shown is the mean of two biological replicates. (C) The bottom 100 predictions from the data shown in (A) were curated for empirical testing for growth inhibition of E. coli. None were growth inhibitory, in agreement with their low prediction scores. Shown is the mean of two biological replicates. (D-K) Growth inhibition by eight empirically validated ZINC15 predictions against E. coli (blue), S. aureus (green), K. pneumoniae (purple), A. baumannii (pink), and P. aeruginosa (red) in LB media. Shown is the mean of two biological replicates. Bars denote absolute error. (L) Growth inhibition by ZINC000100032716 against E. coli BW25113 (blue) or a ciprofloxacin-resistant gyrA S83A mutant of BW25113 (red). Shown is the mean of two biological replicates. Bars denote absolute error. (M) Same as (L) except using ciprofloxacin. Note the 4-fold smaller change in MIC with ZINC000100032716 between the gyrA mutant and wildtype E. coli relative to ciprofloxacin.
KEY RESOURCES TABLE
| REAGENT or RESOURCE | SOURCE | IDENTIFIER |
|---|---|---|
| Bacterial and Virus Strains | ||
| Escherichia coli BW25113 | CGSC | 7636 |
| Staphylococcus aureus USA 300 | ATCC | 25904 |
| Klebsiella pneumoniae ATCC 700721 | ATCC | 700721 |
| Acinetobacter baumannii ATCC 17978 | ATCC | 17978 |
| Pseudomonas aeruginosa PA01 | ATCC | 47085 |
| Clostridioides difficile 630 | ATCC | BAA-1382 |
| Mycobacterium tuberculosis H37Rv | ATCC | 25618 |
| Antibiotic-resistant isolates from CDC | CDC AR Isolate Bank | See Table S3 for unique identifiers |
| Chemicals, Peptides, and Recombinant Proteins | ||
| SU3327 (halicin) | TCI chemicals | A2940 |
| ZINC000013517522 | Vitas-M | STL439768 |
| ZINC000006719085 | Vitas-M | STK708267 |
| ZINC000101675810 | Vitas-M | STK940888 |
| ZINC000101676256 | Vitas-M | STK929481 |
| ZINC000018090096 | Specs | AP-216/15652011 |
| ZINC000169457956 | Specs | AP-216/15652003 |
| ZINC000004481415 | IBScreen | STOCK1S-22001 |
| ZINC000019771150 | ChemBridge | 5773027 |
| ZINC000001387673 | ChemBridge | 5253687 |
| ZINC000005510605 | TimTec | ST50999405 |
| ZINC000022865640 | TimTec | ST50990898 |
| ZINC000015134557 | TimTec | ST4019615 |
| ZINC000098210492 | KeyOrganics | AS-8081 |
| ZINC000100506795 | TimTec | ST50222762 |
| ZINC000238901709 | TimTec | ST100643 |
| ZINC000004623615 | TimTec | ST4104620 |
| ZINC000100032716 | TimTec | ST45053787 |
| ZINC000584578353 | PI Chemicals | PI-31452 |
| ZINC000006661600 | Ambeed | A107950 |
| ZINC000225434673 | Ambinter | Amb22349288 |
| ZINC000006599408 | Ambinter | Amb17836664 |
| ZINC000038586996 | Ambinter | Amb19958926 |
| ZINC000001735150 | NCI Plated 2007 | 200689 |
| Deposited Data | ||
| RNA sequencing datasets | This study | BioProject ID: PRJNA598708 |
| Experimental Models: Organisms/Strains | ||
| Mouse: BALB/c | Charles River | 028 |
| Mouse: C57BL/6 | Charles River | C57BL/6NCrl |
| Oligonucleotides | ||
| TAGCCGGGCAGATGCCCGGCAAGAGAGAATTACAC TTCGGTTAAGGTGATATTCCGGGGATCCGTCGACC |
This study | AB5044 |
| ACCTTGTAATCTGCTGGCACGCAAAATTACTTTCAC ATGGAGTCTTTATGTGTAGGCTGGAGCTGCTTCG |
This study | AB5045 |
| tgcaaaataatatgcaccacgacggcggtcagaaaaataa | This study | AB5046 |
| gaagcgttacttcgcgatctgatcaacgattcgtggaatc | This study | AB5047 |
| Software and Algorithms | ||
| Chemprop | K. Yang et al, 2019 | https://github.com/swansonk14/chemprop |
| RDKit | Landrum, 2006 | https://github.com/rdkit |
| BWA | Li et al, 2009 | https://github.com/lh3/bwa |
| DESeq2 | Love et al, 2014 | https://bioconductor.org/packages/release/bioc/html/DESeq2.html |
| edgeR | Robinson et al, 2010 | https://bioconductor.org/packages/release/bioc/html/edgeR.html |
| GenomeView | Abeel et al, 2012 | https://genomeview.org |
| EcoCyc Pathway Tools | Keseler et al, 2013 | https://ecocyc.org |
ACKNOWLEDGEMENTS
We thank Caleb Bashor from Rice University for valuable discussions, Gerry Wright from McMaster University for antibiotic-resistant strains of E. coli, and Michael Gilmore from Harvard Medical School for S. aureus RN4220 and Δdsp1. This work was supported by the Abdul Latif Jameel Clinic for Machine Learning in Health; by grants to J.J.C. from the Defence Threat Reduction Agency (HDTRA1–15-1–0051) and the Broad Institute of MIT and Harvard; by grants to T.S.J. and R.B. from the DARPA Make-It program under contract Army Research Office (W911NF-16–2-0023) and the Defence Threat Reduction Agency (HR00111920025); by grants to E.D.B. from the Canadian Institutes of Health Research (FRN 143215), the Canadian Foundation for Innovation, and the Canada Research Chairs Program (Tier 1); by a fellowship to J.M.S. from the Banting Fellowships Program (393360); by a scholarship to C.R.M. from the Canadian Institutes of Health Research; by a fellowship to Z.B-A. from the Human Frontier Science Program (LT000975/2016-L); by grants supporting Z.B-A. and V.M.T. from The Broad Institute Tuberculosis Donor Group and the Pershing Square Foundation; by a fellowship to A.C-P. from the Swiss National Science Foundation (P2ELP2_181884); by grants to A.H.B. from the Broad Institute of MIT and Harvard and the NIH Early Investigator Award (DP5-OD-024590); by a fellowship to I.W.A. from the National Science Foundation Graduate Research Fellowship Program (1122374); and by a generous gift from Anita and Josh Bekenstein.
Footnotes
DECLARATION OF INTERESTS
J.J.C. is scientific co-founder and SAB chair of EnBiotix, an antibiotic drug discovery company.
ADDITIONAL RESOURCES
Online model availability. A web-based version of the antibiotic prediction model described herein is available at: http://chemprop.csail.mit.edu/.
DATA AND CODE AVAILABILITY
Code availability. Chemprop code is available at: https://github.com/swansonk14/chemprop.
RNA sequencing data. RNA sequencing data is available at the NCBI Sequence Read Archive under accession PRJNA598708.
REFERENCES
- Abeel T, Van Parys T, Saeys Y, Galagan J, Van de Peer Y, 2012. GenomeView: a next-generation genome browser. Nucleic Acids Res 40, e12. [DOI] [PMC free article] [PubMed] [Google Scholar]
- Angus BL, Carey AM, Caron DA, Kropinski AM, Hancock RE, 1982. Outer membrane permeability in Pseudomonas aeruginosa: comparison of a wild-type with an antibiotic-supersusceptible mutant. Antimicrob. Agents Chemother 21, 299–309. [DOI] [PMC free article] [PubMed] [Google Scholar]
- Balaban NQ, Helaine S, Lewis K, Ackermann M, Aldridge B, Andersson DI, Brynildsen MP, Bumann D, Camilli A, Collins JJ, Dehio C, Fortune S, Ghigo JM, Hardt WD, Harms A, Heinemann M, Hung DT, Jenal U, Levin BR, Michiels J, Storz G, Tan MW, Tenson T, Van Melderen L, Zinkernagel A, 2019. Definitions and guidelines for research on antibiotic persistence. Nat. Rev. Microbiol 17, 441–448. [DOI] [PMC free article] [PubMed] [Google Scholar]
- Brown DG, May-Dracka TL, Gagnon MM, Tommasi R, 2014. Trends and exceptions of physical properties on antibacterial activity for Gram-positive and Gram-negative pathogens. J. Med. Chem 57, 10144–10161. [DOI] [PubMed] [Google Scholar]
- Brown ED, Wright GD, 2016. Antibacterial drug discovery in the resistance era. Nature 529, 336–343. [DOI] [PubMed] [Google Scholar]
- Camacho DM, Collins KM, Powers RK, Costello JC, Collins JJ, 2018. Next-generation machine learning for biological networks. Cell 173, 1581–1592. [DOI] [PubMed] [Google Scholar]
- Clardy J, Fischbach MA, Walsh CT, 2006. New antibiotics from bacterial natural products. Nat. Biotechnol 24, 1541–1550. [DOI] [PubMed] [Google Scholar]
- Coley CW, Jin W, Rogers L, Jamison TF, Jaakkola TS, Green WH, Barzilay R, Jensen KF, 2019. A graph-convolutional neural network model for the prediction of chemical reactivity. Chem. Sci 10, 370–377. [DOI] [PMC free article] [PubMed] [Google Scholar]
- Corsello SM, Bittker JA, Liu Z, Gould J, McCarren P, Hirschman JE, Johnston SE, Vrcic A, Wong B, Khan M, Asiedu J, Narayan R, Mader CC, Subramanian A, Golub TR, 2017. The Drug Repurposing Hub: a next-generation drug library and information resource. Nat. Med 23, 405–408. [DOI] [PMC free article] [PubMed] [Google Scholar]
- Cox G, Sieron A, King AM, De Pascale G, Pawlowski AC, Koteva K, Wright GD, 2017. A common platform for antibiotic dereplication and adjuvant discovery. Cell Chem. Biol 24, 98–109. [DOI] [PubMed] [Google Scholar]
- D’haeseleer P, 2005. How does gene expression clustering work? Nat. Biotechnol 23, 1499–1501. [DOI] [PubMed] [Google Scholar]
- Datsenko KA, Wanner BL, 2000. One-step inactivation of chromosomal genes in Escherichia coli K-12 using PCR products. Proc. Natl. Acad. Sci. USA 97, 6640–6645. [DOI] [PMC free article] [PubMed] [Google Scholar]
- De SK, Stebbins JL, Chen LH, Riel-Mehan M, Machleidt T, Dahl R, Yuan H, Emdadi A, Barile E, Chen V, Murphy R, Pellecchia M, 2009. Design, synthesis, and structure−activity relationship of substrate competitive, selective, and in vivo active triazole and thiadiazole inhibitors of the c-Jun N-terminal kinase. J. Med. Chem 52, 1943–1952. [DOI] [PMC free article] [PubMed] [Google Scholar]
- Dietterich TG, 2000. Ensemble Methods in Machine Learning: Multiple Classifier Systems Springer, Berlin, Heidelberg. [Google Scholar]
- Edwards AN, McBride SM, 2016. Isolating and purifying Clostridium difficile spores. Methods Mol. Biol 1476, 117–128. [DOI] [PMC free article] [PubMed] [Google Scholar]
- Farha MA, French S, Stokes JM, Brown ED, 2018. Bicarbonate alters bacterial susceptibility to antibiotics by targeting the proton motive force. ACS Infect Dis 4, 328–390. [DOI] [PubMed] [Google Scholar]
- Farha MA, Brown ED, 2015. Unconventional screening approaches for antibiotic discovery. Ann. N. Y. Acad. Sci 1354, 54–66. [DOI] [PubMed] [Google Scholar]
- Farha MA, Verschoor CP, Bowdish D, Brown ED, 2013. Collapsing the proton motive force to identify synergistic combinations against Staphylococcus aureus. Chem. Biol 20, 1168–1178. [DOI] [PubMed] [Google Scholar]
- Gao H, Struble TJ, Coley CW, Wang Y, Green WH, Jensen KF, 2018. Using machine learning to predict suitable conditions for organic reactions. ACS Cent. Sci 4, 1465–1476. [DOI] [PMC free article] [PubMed] [Google Scholar]
- Gayvert KM, Madhukar NS, Elemento O, 2016. A data-driven approach to predicting successes and failures of clinical trials. Cell Chem. Biol 23, 1294–1301. [DOI] [PMC free article] [PubMed] [Google Scholar]
- Gough E, Shaikh H, Manges AR, 2011. Systematic review of intestinal microbiota transplantation (fecal bacteriotherapy) for recurrent Clostridium difficile infection. Clin. Infect. Dis 53, 994–1002. [DOI] [PubMed] [Google Scholar]
- Hurdle JG, O’Neill AJ, Chopra I, Lee RE, 2011. Targeting bacterial membrane function: an underexploited mechanism for treating persistent infections. Nat. Rev. Microbiol 9, 62–75. [DOI] [PMC free article] [PubMed] [Google Scholar]
- Jang S, Yu LR, Abdelmegeed MA, Gao Y, Banerjee A, Song BJ, 2015. Critical role of c-jun N-terminal protein kinase in promoting mitochondrial dysfunction and acute liver injury. Redox Biol 6, 552–564. [DOI] [PMC free article] [PubMed] [Google Scholar]
- Jaskowiak PA, Campello RJ, Costa IG, 2014. On the selection of appropriate distances for gene expression data clustering. BMC Bioinformatics 15, Suppl 2:S2. [DOI] [PMC free article] [PubMed] [Google Scholar]
- Karp PD, 2001. Pathway databases: a case study in computational symbolic theories. Science 293, 2040–2044. [DOI] [PubMed] [Google Scholar]
- Karp PD, Latendresse M, Paley SM, Krummenacker M, Ong QD, Billington R, Kothari A, Weaver D, Lee T, Subhraveti P, Spaulding A, Fulcher C, Keseler LM, Caspi R, 2016. Pathway Tools version 19,0 update: software for pathway/genome informatics and systems biology. Brief. Bioinform 17, 877–890. [DOI] [PMC free article] [PubMed] [Google Scholar]
- Keseler IM, Mackie A, Peralta-Gil M, Santos-Zavaleta A, Gama-Castro S, Bonavides-Martínez C, Fulcher C, Huerta AM, Kothari A, Krummenacker M, Latendresse M, Muñiz-Rascado L, Ong Q, Paley S, Schröder I, Shearer AG, Subhraveti P, Travers M, Weerasinghe D, Weiss V, Collado-Vides J, Gunsalus RP, Paulsen I, Karp PD, 2013. EcoCyc: fusing model organism databases with systems biology. Nucleic Acids Res 41, D605–D612. [DOI] [PMC free article] [PubMed] [Google Scholar]
- Kohanski MA, Dwyer DJ, Collins JJ, 2010. How antibiotics kill bacteria: from targets to networks. Nat. Rev. Microbiol 8, 423–435. [DOI] [PMC free article] [PubMed] [Google Scholar]
- Landrum G, 2006. RDKit: Open-source cheminformatics https://rdkit.org/docs/index.html.
- Lee CR, Lee JH, Park M, Park KS, Bae IK, Kim YB, Cha CJ, Jeong BC, Lee SH, 2017. Biology of Acinetobacter baumannii: pathogenesis, antibiotic resistance mechanisms, and prospective treatment options. Front. Cell Infect. Microbiol 7:55. [DOI] [PMC free article] [PubMed] [Google Scholar]
- Li H, Durbin R, 2009. Fast and accurate short read alignment with Burrows-Wheeler transform. Bioinformatics 25, 1754–1760. [DOI] [PMC free article] [PubMed] [Google Scholar]
- Lobritz MA, Belenky P, Porter CB, Gutierrez A, Yang JH, Schwarz EG, Dwyer DJ, Khalil AS, Collins JJ, 2015. Antibiotic efficacy is linked to bacterial cellular respiration. Proc. Natl. Acad. Sci. USA 112, 8173–8180. [DOI] [PMC free article] [PubMed] [Google Scholar]
- Loewenstein Y, Portugaly E, Fromer M, Linial M, 2008. Efficient algorithms for accurate hierarchical clustering of huge datasets: tackling the entire protein space. Bioinformatics 24, i41–i49. [DOI] [PMC free article] [PubMed] [Google Scholar]
- Love MI, Huber W, Anders S, 2014. Moderated estimation of fold change and dispersion for RNA-seq data with DESeq2. Genome Biol 15:550. [DOI] [PMC free article] [PubMed] [Google Scholar]
- Manson MD, Tedesco P, Berg HC, Harold FM, Van der Drift C, 1977. A protonmotive force drives bacterial flagella. Proc. Natl. Acad. Sci. USA 74, 3060–3064. [DOI] [PMC free article] [PubMed] [Google Scholar]
- Mauri A, Consonni V, Pavan M, Todeschini R, 2006. Dragon software: an easy approach to molecular descriptor calculations. MATCH Commun. Math. Comput. Chem 56, 237–248. [Google Scholar]
- Mayr A, Klambauer G, Unterthiner T, Steijaert M, Wegner JK, Ceulemans H, Clevert DA, Hochreiter S, 2018. Large-scale comparison of machine learning methods for drug target prediction on ChEMBL. Chem. Sci 9, 5441–5451. [DOI] [PMC free article] [PubMed] [Google Scholar]
- Moriwaki H, Tian YS, Kawashita N, Takagi T, 2018. Mordred: a molecular descriptor calculator. J. Cheminform 10:4. [DOI] [PMC free article] [PubMed] [Google Scholar]
- O’Neill J, 2014. Antimicrobial resistance: tackling a crisis for the health and wealth of nations. Review on Antimicrobial Resistance
- Ortholand JY, Ganesan A, 2004. Natural products and combinatorial chemistry: back to the future. Curr. Opin. Chem. Biol 8, 271–280. [DOI] [PubMed] [Google Scholar]
- Paul K, Erhardt M, Hirano T, Blair DF, Hughes KT, 2008. Energy source of flagellar type III secretion. Nature 451, 489–492. [DOI] [PubMed] [Google Scholar]
- Perez F, Hujer AM, Hujer KM, Decker BK, Rather PN, Bonomo RA, 2007. Global challenge of multidrug-resistant Acinetobacter baumannii. Antimicrob. Agents Chemother 51, 3471–3484. [DOI] [PMC free article] [PubMed] [Google Scholar]
- Trusts PEW, 2019. Five-year analysis shows continued deficiencies in antibiotic development https://www.pewtrusts.org/en/research-and-analysis/data-visualizations/2019/five-year-analysis-shows-continued-deficiencies-in-antibiotic-development
- Robinson MD, McCarthy DJ, Smyth GK, 2010. edgeR: a Bioconductor package for differential expression analysis of digital gene expression data. Bioinformatics 26, 139–140. [DOI] [PMC free article] [PubMed] [Google Scholar]
- Rogers D, Hahn M, 2010. Extended-connectivity fingerprints. J. Chem. Inf. Model 50, 742–754. [DOI] [PubMed] [Google Scholar]
- Sandegren L, Lindqvist A, Kahlmeter G, Andersson DI, 2008. Nitrofurantoin resistance mechanism and fitness cost in Escherichia coli. J. Antimicrob. Chemother 62, 495–503. [DOI] [PubMed] [Google Scholar]
- Shioi JI, Galloway RJ, Niwano M, Chinnock RE, Taylor BL, 1982. Requirement of ATP in bacterial chemotaxis. J. Biol. Chem 257, 7969–7975. [PubMed] [Google Scholar]
- Shishkin AA, Giannoukos G, Kucukural A, Ciulla D, Busby M, Surka C, Chen J, Bhattacharyya RP, Rudy RF, Patel MM, Novod N, Hung DT, Gnirke A, Garber M, Guttman M, Livny J, 2015. Simultaneous generation of many RNA-seq libraries in a single reaction. Nat. Methods 12, 323–325. [DOI] [PMC free article] [PubMed] [Google Scholar]
- Sterling T, Irwin JJ, 2015. ZINC 15--ligand discovery for everyone. J. Chem. Inf. Model 55, 2324–2337. [DOI] [PMC free article] [PubMed] [Google Scholar]
- Stokes JM, Brown ED, 2015. Chemical modulators of ribosome biogenesis as biological probes. Nat. Chem. Biol 11, 924–932. [DOI] [PubMed] [Google Scholar]
- Stokes JM, French S, Ovchinnikova OG, Bouwman C, Whitfield C, Brown ED, 2016. Cold stress makes Escherichia coli susceptible to glycopeptide antibiotics by altering outer membrane integrity. Cell Chem. Biol 23, 267–277. [DOI] [PubMed] [Google Scholar]
- Stokes JM, Gutierrez A, Lopatkin AJ, Andrews IW, French S, Matic I, Brown ED, Collins JJ, 2019a. A multiplexable assay for screening antibiotic lethality against drug-tolerant bacteria. Nat. Meth 16, 303–306. [DOI] [PubMed] [Google Scholar]
- Stokes JM, Lopatkin AJ, Lobritz MA, Collins JJ, 2019b. Bacterial Metabolism and Antibiotic Efficacy. Cell Metab 30, 251–259. [DOI] [PMC free article] [PubMed] [Google Scholar]
- Stokes JM, MacNair CR, Ilyas B, French S, Cote JP, Bouwman C, Farha MA, Sieron AO, Whitfield C, Coombes BK, Brown ED, 2017. Pentamidine sensitizes Gram-negative pathogens to antibiotics and overcomes acquired colistin resistance. Nat. Microbiol 2:17028. [DOI] [PMC free article] [PubMed] [Google Scholar]
- Surawicz CM, Brandt LJ, Binion DG, Ananthakrishnan AN, Curry SR, Gilligan PH, McFarland LV, Mellow M, Zuckerbraun BS, 2013. Guidelines for diagnosis, treatment, and prevention of Clostridium difficile infections. Am. J. Gasteroenterol 108, 478–498. [DOI] [PubMed] [Google Scholar]
- Taber HW, Mueller JP, Miller PF, Arrow AS, 1987. Bacterial uptake of aminoglycoside antibiotics. Microbiol. Rev 51, 439–457. [DOI] [PMC free article] [PubMed] [Google Scholar]
- Tally FP, Goldin BR, Sullivan N, Johnston J, Gorbach SL, 1978. Antimicrobial activity of metronidazole in anaerobic bacteria. Antimicrob. Agents Chemother 13, 460–465. [DOI] [PMC free article] [PubMed] [Google Scholar]
- Coates AR, Hu Y, 2008. Targeting non-multiplying organisms as a way to develop novel antimicrobials. Trends Pharmacol. Sci 29, 143–150. [DOI] [PubMed] [Google Scholar]
- Tommasi R, Brown DG, Walkup GK, Manchester JI, Miller AA, 2015. ESKAPEing the labyrinth of antibacterial discovery. Nat. Rev. Drug. Discov 14, 529–542. [DOI] [PubMed] [Google Scholar]
- Wang Y, Bryant SH, Cheng T, Wang J, Gindulyte A, Shoemaker BA, Thiessen PA, He S, Zhang J, 2017. PubChem BioAssay: 2017 update. Nucleic Acids Res 45, D955–D963. [DOI] [PMC free article] [PubMed] [Google Scholar]
- Winston JA, Thanissery R, Montgomery SA, Theriot CM, 2016. Cefoperazone-treated mouse model of clinically-relevant Clostridium difficile strain R20291. J. Vis. Exp e54850. [DOI] [PMC free article] [PubMed]
- Wright GD, 2017. Opportunities for natural products in 21st century antibiotic discovery. Nat. Prod. Rep 34, 694–701. [DOI] [PubMed] [Google Scholar]
- Wu M, Maier E, Benz R, Hancock RE, 1999. Mechanism of interaction of different classes of cationic antimicrobial peptides with planar bilayers and with the cytoplasmic membrane of Escherichia coli. Biochemistry 38, 7235–7242. [DOI] [PubMed] [Google Scholar]
- Wu Z, Ramsundar B, Feinberg EN, Gomes J, Geniesse C, Pappu AS, Leswing K, Pande V, 2017. MoleculeNet: a benchmark for molecular machine learning. Chem. Sci 9, 513–530. [DOI] [PMC free article] [PubMed] [Google Scholar]
- Yamaguchi A, Ohmori H, Kaneko-Ohdera M, Nomura T, Sawai T, 1991. Delta pH-dependent accumulation of tetracycline in Escherichia coli. Antimicrob. Agents Chemother 35, 53–56. [DOI] [PMC free article] [PubMed] [Google Scholar]
- Yang JH, Wright SN, Hamblin M, McCloskey D, Alcantar MA, Schrubbers L, Lopatkin AJ, Satish S, Nili A, Palsson BO, Walker GC, Collins JJ, 2019. A white-box machine learning approach for revealing antibiotic mechanisms of action. Cell 177, 1649–1661. [DOI] [PMC free article] [PubMed] [Google Scholar]
- Yang K, Swanson K, Jin W, Coley C, Eiden P, Gao H, Guzman-Perez A, Hopper T, Kelley B, Mathea M, Palmer A, Settels V, Jaakkola T, Jensen K, Barzilay R, 2019. Analyzing learned molecular representations for property prediction. J. Chem. Inf. Model 13: 10.1021/acs/jcim.9b00237. [DOI] [PMC free article] [PubMed] [Google Scholar]
- Yoshimura F, Nikaido H, 1982. Permeability of Pseudomonas aeruginosa outer membrane to hydrophilic solutes. J. Bacteriol 152, 636–642. [DOI] [PMC free article] [PubMed] [Google Scholar]
- Zampieri M, Zimmermann M, Claassen M, Sauer U, 2017. Nontargeted metabolomics reveals the multilevel response to antibiotic perturbations. Cell Rep 6, 1214–1228. [DOI] [PubMed] [Google Scholar]
- Zhu YY, Machleder EM, Chenchik A, Li R, Siebert PD, 2018. Reverse transcriptase template switching: a SMART approach for full-length cDNA library construction. Biotechniques 30, 892–897. [DOI] [PubMed] [Google Scholar]
Associated Data
This section collects any data citations, data availability statements, or supplementary materials included in this article.
Supplementary Materials
Table S5. Related to Figure 6. Prediction scores and optical density values of the top 200 (yellow) and bottom 100 (blue) WuXi molecules against E. coli.
Table S1A. Related to Figure 2. Primary screening data of the 2,560-molecule training library.
Table S1B. Related to Figure 2. Rank-ordered de-duplicated primary screening dataset.
Table S4A. Related to Figure 4. Whole transcriptome sequencing of E. coli treated with halicin at 0.25x MIC.
Table S4B. Related to Figure 4. Whole transcriptome sequencing of E. coli treated with halicin at 1x MIC.
Table S4C. Related to Figure 4. Whole transcriptome sequencing of E. coli treated with halicin at 4x MIC.
Table S7A. Related to Figure 6. ZINC15 predictions used for empirical validation.
Table S7B. Related to Figure 6. Ranks of the 8 correctly predicted ZINC15 molecules across different models.
Table S3. Related to Figure 3. Antibiotic-resistant CDC strains used for halicin efficacy assays.
Table S2A. Related to Figure 2. List of RDKit molecular features used to augment the D-MPNN.
Table S2B. Related to Figure 2. Prediction scores of molecules from the Drug Repurposing Hub that were not found in the training dataset.
Table S2C. Related to Figure 2. Prediction scores of molecules from the Drug Repurposing Hub that were not found in the training dataset (learned features only).
Table S2D. Related to Figure 2. Prediction scores of molecules from the Drug Repurposing Hub that were not found in the training dataset (RDKit features only).
Table S2E. Related to Figure 2. Prediction scores of molecules from the Drug Repurposing Hub that were not found in the training dataset (feed forward DNN using Morgan fingerprints).
Table S2F. Related to Figure 2. Prediction scores of molecules from the Drug Repurposing Hub that were not found in the training dataset (random forest classifier using Morgan fingerprints).
Table S2G. Related to Figure 2. Prediction scores of molecules from the Drug Repurposing Hub that were not found in the training dataset (SVM model using Morgan fingerprints).
Table S2H. Related to Figure 2. Tanimoto similarity of training dataset molecules to halicin.
Table S6A. Related to Figure 6. ZINC15 molecules with prediction score >0.7.
Table S6B. Related to Figure 6. Prediction scores of the top 6,820 molecules from the ZINC15 database (learned features only).
Table S6C. Related to Figure 6. Prediction scores of the top 6,820 molecules from the ZINC15 database (RDKit features only).
Table S6D. Related to Figure 6. Prediction scores of the top 6,820 molecules from the ZINC15 database (feed forward DNN using Morgan fingerprints).
Table S6E. Related to Figure 6. Prediction scores of the top 6,820 molecules from the ZINC15 database (random forest classifier using Morgan fingerprints).
Table S6F. Related to Figure 6. Prediction scores of the top 6,820 molecules from the ZINC15 database (SVM model using Morgan fingerprints).
Figure S1. Related to Figure 2. Primary screening and initial model training. (A) Primary screening data for growth inhibition of E. coli by 2,560 molecules within the FDA-approved drug library supplemented with a natural product collection. Red are growth inhibitory molecules; blue are non-growth inhibitory molecules. (B) Rank-ordered de-duplicated screening data containing 2,335 molecules. Shown is the mean of two biological replicates. Red are growth inhibitory molecules; blue are non-growth inhibitory molecules.
Figure S2. Related to Figure 3. Activity of halicin. (A) Killing of E. coli in LB media in the presence of varying concentrations of halicin after 1 hr (blue), 2 hr (cyan), 3 hr (green), and 4 hr (red). The initial cell density is ~108 CFU/ml. Shown is the mean of two biological replicates. Bars denote absolute error. (B) Same as (A), with initial cell density ~107 CFU/ml. (C) Killing of E. coli in PBS in the presence of varying concentrations of halicin after 2 hr (blue), 4 hr (cyan), 6 hr (green), and 8 hr (red). The initial cell density is ~108 CFU/ml. Shown is the mean of two biological replicates. Bars denote absolute error. (D) Same as (C), with initial cell density ~107 CFU/ml. (E) Killing of E. coli in PBS in the presence of varying concentrations of ampicillin after 2 hr (blue), 4 hr (cyan), 6 hr (green), and 8 hr (red). The initial cell density is ~108 CFU/ml. Shown is the mean of two biological replicates. Bars denote absolute error. (F) Same as (E), with initial cell density ~107 CFU/ml. (G) Same as (E), with initial cell density ~106 CFU/ml. (H) Killing of E. coli in LB media in the presence of varying concentrations of ampicillin after 1hr (blue), 2 hr (cyan), 3 hr (green), and 4 hr (red). The initial cell density is ~108 CFU/ml. Shown is the mean of two biological replicates. Bars denote absolute error. (I) Same as (H), except with initial cell density ~107 CFU/ml. (J) Same as (H), except with initial cell density ~106 CFU/ml. (K) MIC of various antibiotics against E. coli strains harboring a range of plasmid-borne, functionally diverse, antibiotic-resistance determinants. The mcr-1 gene was expressed in E. coli BW25113. All other resistance genes were expressed in E. coli BW25113 ∆bamB∆tolC. WT is wildtype E. coli. R is E. coli harboring a resistance plasmid. Chlor is chloramphenicol. Amp is ampicillin. Gent is gentamicin. Levo is levofloxacin. Experiments were conducted with two biological replicates. (L) Growth inhibition of wildtype E. coli (blue) and ∆nfsA∆nfsB E. coli (green) by halicin. Shown is the mean of two biological replicates. Bars denote absolute error. (M) Growth inhibition of wildtype E. coli (blue) and ∆nfsA∆nfsB E. coli (green) by nitrofurantoin. Shown is the mean of two biological replicates. Bars denote absolute error.
Figure S3. Related to Figure 4. Mechanistic investigations into halicin. (A) Evolution of spontaneous resistance against halicin (top) or ciprofloxacin (bottom). E. coli BW25113 (~109 CFU) was plated onto non-selective or selective media and incubated for 7 days prior to imaging, and re-streaking of colonies onto fresh non-selective or selective media. 20 µg/ml halicin and 20 ng/ml ciprofloxacin, respectively, were used for suppressor mutant evolution. Note that the colonies that emerged at the edge of halicin-supplemented plates after 7 days grew well on LB non-selective media but did not re-streak onto halicin-supplemented media. All seven selected ciprofloxacin-resistant colonies grew on both non-selective and ciprofloxacin-supplemented media. (B) Whole transcriptome hierarchical clustering of E. coli treated with halicin at 0.25x MIC for 1hr, 2 hr, 3 hr, and 4 hr. Shown is the mean transcript abundance of two biological replicates of halicin-treated cells relative to untreated control cells on a log2-fold scale. In the growth curve, blue represents untreated cells; red represents halicin-treated cells. (C) Same as (B), except cells were treated with 1x MIC halicin. (D) Growth inhibition by halicin against S. aureus USA300 in pH-adjusted media. Shown is the mean of two biological replicates. Bars denote absolute error. (E) Growth inhibition by halicin against E. coli in LB (blue) or LB supplemented with 25 mM sodium bicarbonate (red), which dissipates the ∆pH component of the proton motive force. Shown is the mean of two biological replicates. Bars denote absolute error. (F) DiSC3(5) fluorescence in S. aureus upon exposure to valinomycin (64 µg/ml; dissipates ∆ψ), nigericin (16 µg/ml; dissipates ∆pH), halicin (4 µg/ml), or DMSO. Halicin induced fluorescence changes more similar to nigericin relative to valinomycin, suggesting that halicin dissipates the ∆pH component of the proton motive force. The right panel is a magnified image of the drug-induced decrease in fluorescence shown in the left. (G) DiSC3(5) fluorescence in S. aureus upon exposure to valinomycin, nigericin, halicin, or DMSO after 4 hr of exposure. (H) Growth inhibition by daptomycin (left) and halicin (right) against S. aureus RN4220 (blue) or a daptomycin-resistant RN4220 strain (∆dsp1; red) in LB media. Shown is the mean of two biological replicates. Bars denote absolute error.
Figure S4. Related to Figure 5. Activity of halicin against A. baumannii CDC 288. (A) Killing of A. baumannii in PBS in the presence of varying concentrations of halicin after 2 hr (blue), 4 hr (cyan), 6 hr (green), and 8 hr (red). The initial cell density is ~107 CFU/ml. Shown is the mean of two biological replicates. Bars denote absolute error. (B) Same as (A), with initial cell density ~106 CFU/ml.
Figure S5. Related to Figure 6. Model predictions from the WuXi anti-tuberculosis library and the ZINC15 database. (A) Rank-ordered prediction scores of WuXi anti-tuberculosis library molecules. Note the overall low prediction scores. (B) The top 200 predictions from the data shown in (A) were curated for empirical testing for growth inhibition of E. coli. None were growth inhibitory, in agreement with their low prediction scores. Shown is the mean of two biological replicates. (C) The bottom 100 predictions from the data shown in (A) were curated for empirical testing for growth inhibition of E. coli. None were growth inhibitory, in agreement with their low prediction scores. Shown is the mean of two biological replicates. (D-K) Growth inhibition by eight empirically validated ZINC15 predictions against E. coli (blue), S. aureus (green), K. pneumoniae (purple), A. baumannii (pink), and P. aeruginosa (red) in LB media. Shown is the mean of two biological replicates. Bars denote absolute error. (L) Growth inhibition by ZINC000100032716 against E. coli BW25113 (blue) or a ciprofloxacin-resistant gyrA S83A mutant of BW25113 (red). Shown is the mean of two biological replicates. Bars denote absolute error. (M) Same as (L) except using ciprofloxacin. Note the 4-fold smaller change in MIC with ZINC000100032716 between the gyrA mutant and wildtype E. coli relative to ciprofloxacin.
Data Availability Statement
Code availability. Chemprop code is available at: https://github.com/swansonk14/chemprop.
RNA sequencing data. RNA sequencing data is available at the NCBI Sequence Read Archive under accession PRJNA598708.