

Abstract
The hyoid bone and the hyomandibular complex subserve the functions of respiration, deglutition, and speech. This study quantified the growth of the hyoid bone and the hyomandibular relationships in males and females from birth to 19 years. Using 97 computed tomography (CT) scans, from a previous study on mandibular growth from 49 individuals (16 with longitudinal scans; Kelly et al., 2017), landmarks were placed on 3D CT models and used to calculate four distance, and three angular measurements. A general increase in growth trend was observed in hyoid bone linear measurements –length, width, and depth– as well as relational mandible-to-hyoid distance, throughout the developmental ages examined in both males and females, with most variables having larger measurements for females up to age 10 years. A general decrease in all three angular measurements was observed in both males and females up to approximately age 12 years, at which time male angular measurements gradually increased with significant sexual dimorphism emerging after age 15 years. As expected, postpubertal males had greater hyoid angle than females; they also had greater hyoid angle of inclination than mandible body inclination (with inclination relative to the anterior-posterior nasal plane), likely related to hyo-laryngeal descent. This study contributes to normative data on hyoid bone and hyomandibular relational growth in typically developing individuals and provides a baseline against which structural and functional influences on anatomic growth may be examined by clinical disciplines that address the aerodigestive and speech functions, as well as the fields of anatomy, forensics, and anthropology.
Keywords: Hyoid bone, hyomandibular complex, computed tomography, growth and development, sex differences
I. INTRODUCTION
The hyoid bone is a small U-shaped free-floating bone that does not articulate with any osseous structures, yet maintains attachments to the mandible, tongue, styloid processes, thyroid cartilage, cricoid cartilage, clavicles, and sternum (O’Halloran and Lundy, 1987; Phoenix et al., 2011; Cotter et al., 2015). The hyoid bone plays an important role in supporting the functions of respiration, mastication and deglutition, and speech. Throughout the course of the human lifespan, the hyoid bone descends with the hyoid body ultimately fusing with the greater cornua, although the timing and extent of fusion varies among individuals (O’Halloran and Lundy, 1987; Devlin, 2002; Ha, et al., 2013; Fisher et al., 2016). Deviations in the placement of the hyoid bone relative to other functionally related structures can have ramifications on one or more of the aerodigestive and vocal tract functions (Harun et al., 2007; Kanetaka et al., 2011; Vieira, et al., 2014). However, quantitative knowledge regarding the growth of the hyoid bone (Vohra and Kulkarni, 2017; Okasi et al., 2018) and knowledge of its growth in relation to functionally related structures, such as the mandible and larynx, is limited (Mitani et al., 1992; Feng et al., 2014).
The growth and development of the craniofacial complex, which houses the aerodigestive and the vocal tract structures, is currently understood to be regulated by genetically predetermined factors, as well as by intrinsic and extrinsic epigenetic factors such as mechanical forces, function, and trauma, that activate the expression of regulatory genes (Enlow and Hans, 1996; Moss, 1997; Carlson, 2005; Standerwick and Roberts, 2009; Lieberman, 2011; Castaldo and Cerritelli, 2015). Since the hyoid bone lacks osseous articulation, it does not have the same structural constraints as the mandible or the bone and cartilage bound pharynx, but it is functionally related to the mandible and the larynx. Its growth, therefore, may be influenced more by its functional demands than by its structural constraints (Orsbon et al., 2018).
An additional consideration is the role of embryologic origin on growth. The lesser cornua and the upper portion of the hyoid body are derived from the second pharyngeal cartilage, whereas the greater cornua and the caudal portion of the hyoid body are derived from the third pharyngeal cartilage (Lieberman et al., 2001; Devlin, 2002; Sadler, 2006; Soerdjbalie-Maikoe and van Rijn, 2008; Rodriguez-Vazques et al., 2011; Frisdal, 2014). In contrast, the mandible develops almost exclusively from the first pharyngeal arch but depends on the interaction between the oral ectoderm and the cranial neural crest mesenchyme to develop properly (Chai and Maxson, 2006). Even though the mandible has a single embryologic origin, its growth and development are influenced by its structural and functional relationships to the neurocranium, and to the aerodigestive and vocal tract (Kelly et al., 2017). Thus, growth is governed by structural and functional, or genetic and epigenetic, factors that likely result in variation in growth types (Carlson, 2005).
The two primary growth types for the craniofacial complex that are relevant to the growth of the hyoid bone and the mandible, include the somatic growth type (with its name related to its mesodermal/somite embryologic origin, but also referred to as general or skeletal growth type), found in the majority of the skeleton and the facial anatomy, and the neural growth type, found in the majority of the neurocranium (with its embryologic origin of ectoderm, mesoderm, and neural crest). A major distinction between the two, as first described by Scammon (1930), is that while both growth types have a rapid period of growth during early childhood, neural growth almost reaches the adult size by about age six, whereas somatic growth is more limited during this early period, but followed by a second period of accelerated growth during adolescence. He also noted that a combination, composite or hybrid growth type in the neck region is likely, due to the influence of both the facial structures and the neurocranium (Scammon, 1930). Indeed, the vocal tract has been quantified to have a hybrid growth type (Vorperian et al., 2009) where growth of the pharyngeal region in the vertical plane has a predominantly somatic growth type, whereas growth of the oral cavity in the horizontal plane has a predominantly neural growth type. Similar findings relating the vertical versus horizontal growth planes to predominantly somatic versus neural growth types respectively have also been reported for individual structures from a single embryologic origin such as the mandible (Kelly et al., 2017) and the cervical spines (Miller et al., 2020).
In typically developing infants, the hyoid bone is situated at the level of the second and third vertebral junction at birth. It descends gradually relative to the skull such that by age two years the superior margin of the hyoid bone is at the level of the third and fourth vertebral junction (Crelin, 1973; Laitman et al., 1976; and Liberman et al., 2001). This is followed by additional descent during adolescence to young adulthood (Fitch and Giedd, 1999; Doual et al., 2003; Sheng et al., 2009). The descent of the hyoid bone is crucial for the normal functioning of the aerodigestive and vocal tract, specifically for the progression from the simultaneous sucking and deglutition while breathing in infants, to alternating functions in older infants, as well as for normal respiration during infant and adult sleep (Wilson and Green, 2009, Laitman and Reidenberg, 2013). Structurally, the hyoid body fuses to the right and left greater cornua after a protracted period of time in most individuals (Kanetaka et al., 2011, Fisher et al., 2016). Though hyoid bone fusion is typically absent prior to age twenty, it does not occur in everyone during older adulthood, for unknown reasons (Fisher et al., 2016; Ichijo et al., 2016). While the sex-specific timing of hyoid bone fusion and hyoid bone density has been explored across the lifespan (e.g. Fisher et al., 2016), knowledge on the three-dimensional growth of the hyoid body and its greater cornua, particularly during early childhood, is scant (Harun et al., 2007; Sheng et al., 2009; Vohra and Kulkarni, 2017; Sameera and Rao, 2019). Also, although the hyoid bone responds to surgical intervention of mandibular deformities by adapting to the mandible’s new placement (Kamano et al., 2017), given its functional relationship to the mandible as mediated by their attachments to the tongue, knowledge on how the position of the hyoid bone relative to the mandible changes across typical development is limited (Mitani and Sato, 1992; Ichijo et al., 2016; Okasi et al., 2018). Thus, the study and quantification of the growth of the hyoid bone and the relational growth of the hyomandibular complex in typically developing individuals is warranted.
The purpose of this study was to quantify the typical growth and development of the hyoid bone during the first two decades of life, and to examine typical developmental relational changes between the hyoid bone and the mandible using in vivo retrospective CT scans in which the hyoid bone’s relation to other structures is retained. More specifically, the primary goal of this study was to quantitatively characterize the growth trend, growth rate, and growth type (neural and somatic) of the hyoid bone in males and females from birth to nineteen years of age. Also, to begin quantifying hyo-mandibular relational growth. Given that the hyoid bone, a free-floating bone, and the mandible have morphologic similarity (Doual et al., 2003; Sheng et al., 2009) and are functionally related; also, based on our findings on the mandible, specifically its directional growth, and the presence of prepubertal and pubertal sexual dimorphism in the inferior border of the mandible, specifically Gonion width, Gonion angle and Gnathion angle (Kelly et al., 2017), we hypothesize that: (i) the hyoid bone, despite its complex embryological origin, will have growth trends similar to the mandible and display a predominantly somatic growth in the vertical or sagittal plane, including its distance from the mandible, and a predominantly neural growth in the horizontal or transverse plane; (ii) the hyoid bone will display the emergence of prepubertal or pubertal sexual dimorphism particularly in the hyoid body angle, and the width between the greater cornua.
II. MATERIALS AND METHODS
Medical Imaging Scans and Image Acquisition
The imaging scans included in this analysis came from a large retrospective imaging database of head and neck CT scans from typically and atypically developing individuals spanning from birth to 99 years. This anonymized lifespan imaging database was curated by the Vocal Tract Development Laboratory at the University of Wisconsin for the purpose of studying the development of the different vocal tract structures, as done in this study, was approved by the University of Wisconsin Health Sciences Institutional Review Board (IRB Study # 2016–1052). All scans were screened by a collaborating radiologist prior to inclusion in the database and classified as ‘typically developing’ if they had no documented diagnoses in their medical records that affect growth, showed no signs of medical conditions that alter the typical growth and development of the vocal tract, the mandible or skull base, and if the patient had a typical normognathic bite. Scans were excluded if all the vocal tract structures could be not be visualized.
For this study, 97 head and neck computed tomography (CT) scans, ages birth to nineteen, were included in our analysis. The scans were from 49 typically developing individuals, 16 of which had repeat scans at different ages with scan frequency ranging between 2 to 8 per individual (see Supplemental Table). The scans included all races based on our findings of no race effect on growth (Durtchi et al., 2009). All the cases in this study had been used by Kelly et al. (2017), to characterize mandibular growth, and were similarly divided into four age cohorts to assess the emergence of sexual dimorphism (Kelly, 2017; Miller, 2019). Each age cohort spanned five years (years.months) and roughly matched Fitch and Giedd’s (1999) grouping that was based on Tanner’s (1962) standardized rating system of pubertal stages. The distribution of scans (n=number of scans, M=males, F=females) per age cohort was as follows: Prepubertal cohort I ages birth to 4.11 (n=26, 16M, 10F); and cohort II ages 5.00 to 9.11 (n=19, 8M, 11F); pubertal cohort III ages 10.0 to 14.11 (n=22, 12M, 10F); and postpubertal cohort IV ages 15.00 to 19.11 (n=30, 15M, 15F).
Additional inclusion criteria, described in detail in Cotter et al. (2015) included: Scanner parameters set at 14.0 cm FOV, 100.0 mÅ, 80 kV and slice thickness of 0.625 mm, 1.25 mm, and 2.50 mm. The 97 CT scans used in this study were acquired at 2.5 mm slice thickness using a General Electric LightSpeed 16 MSCT scanner. All cases were scanned in the supine body position with the head in midline, during quiet breathing, using the University of Wisconsin Hospital’s head and neck imaging protocol. The CT images were reconstructed using the GE Standard or Soft tissue algorithms, set to be anonymous using the General Electric Advantage Windows workstation and saved in a Digital Imaging and Communications in Medicine (DICOM) format. For additional information regarding the acquisition of images and the scanning procedures, see Vorperian et al. (2009) and Kelly et al. (2017).
Procedures
Image segmentation.
DICOM CT scan files were opened with Analyze 11.0 software, which was used for all visualization, modeling, and landmarking of the hyoid and mandible bones. The three-dimensional (3D) hyoid bone models were created with the Volume Edit tool using the standard algorithm. The Volume Edit tool allows for slice-by-slice tracing and stacking on the hyoid bone from the 2D images in order to create a 3D model. The volume threshold was manually adjusted by visual inspection on a per slice basis.
Landmarking and measurement.
After creation of a 3D model for each of the 97 scans, 7 landmarks were placed on the hyoid bone to quantify hyoid bone growth and 3 landmarks were placed on their respective mandibles (Kelly et al., 2017) to preliminarily quantify hyomandibular growth (see Fig. 1). Using similar methodology as Kelly et al. (2017) to place landmarks on the mandibles, the Fabricate tool in Analyze was used to place hyoid bone landmarks using the multiplanar orthogonal slices, to ensure correct landmark placement, as well the 3D model to guide landmark placement. For each landmark, the x, y, and z coordinates were recorded and used for the calculation of the distance and angular measurements. Table 1 defines the seven variables used in this study and describes how the measurements were calculated from the landmarks. The linear distances and the angular values were calculated using the formulas reported in Kelly et al. (2017). The ANS-PNS plane was used as the reference line for the angle of inclination measures, since the sella and the nasion landmarks could not be consistently visualized due to the field of view limitations of our retrospective CT scans. Interrater reliability was verified by having two raters place landmarks, measure distances and calculate the average relative error. The averages were confirmed to be less than 5% and considered to be acceptable (Whyms et al., 2013, Cotter et al., 2015).
Figure 1.
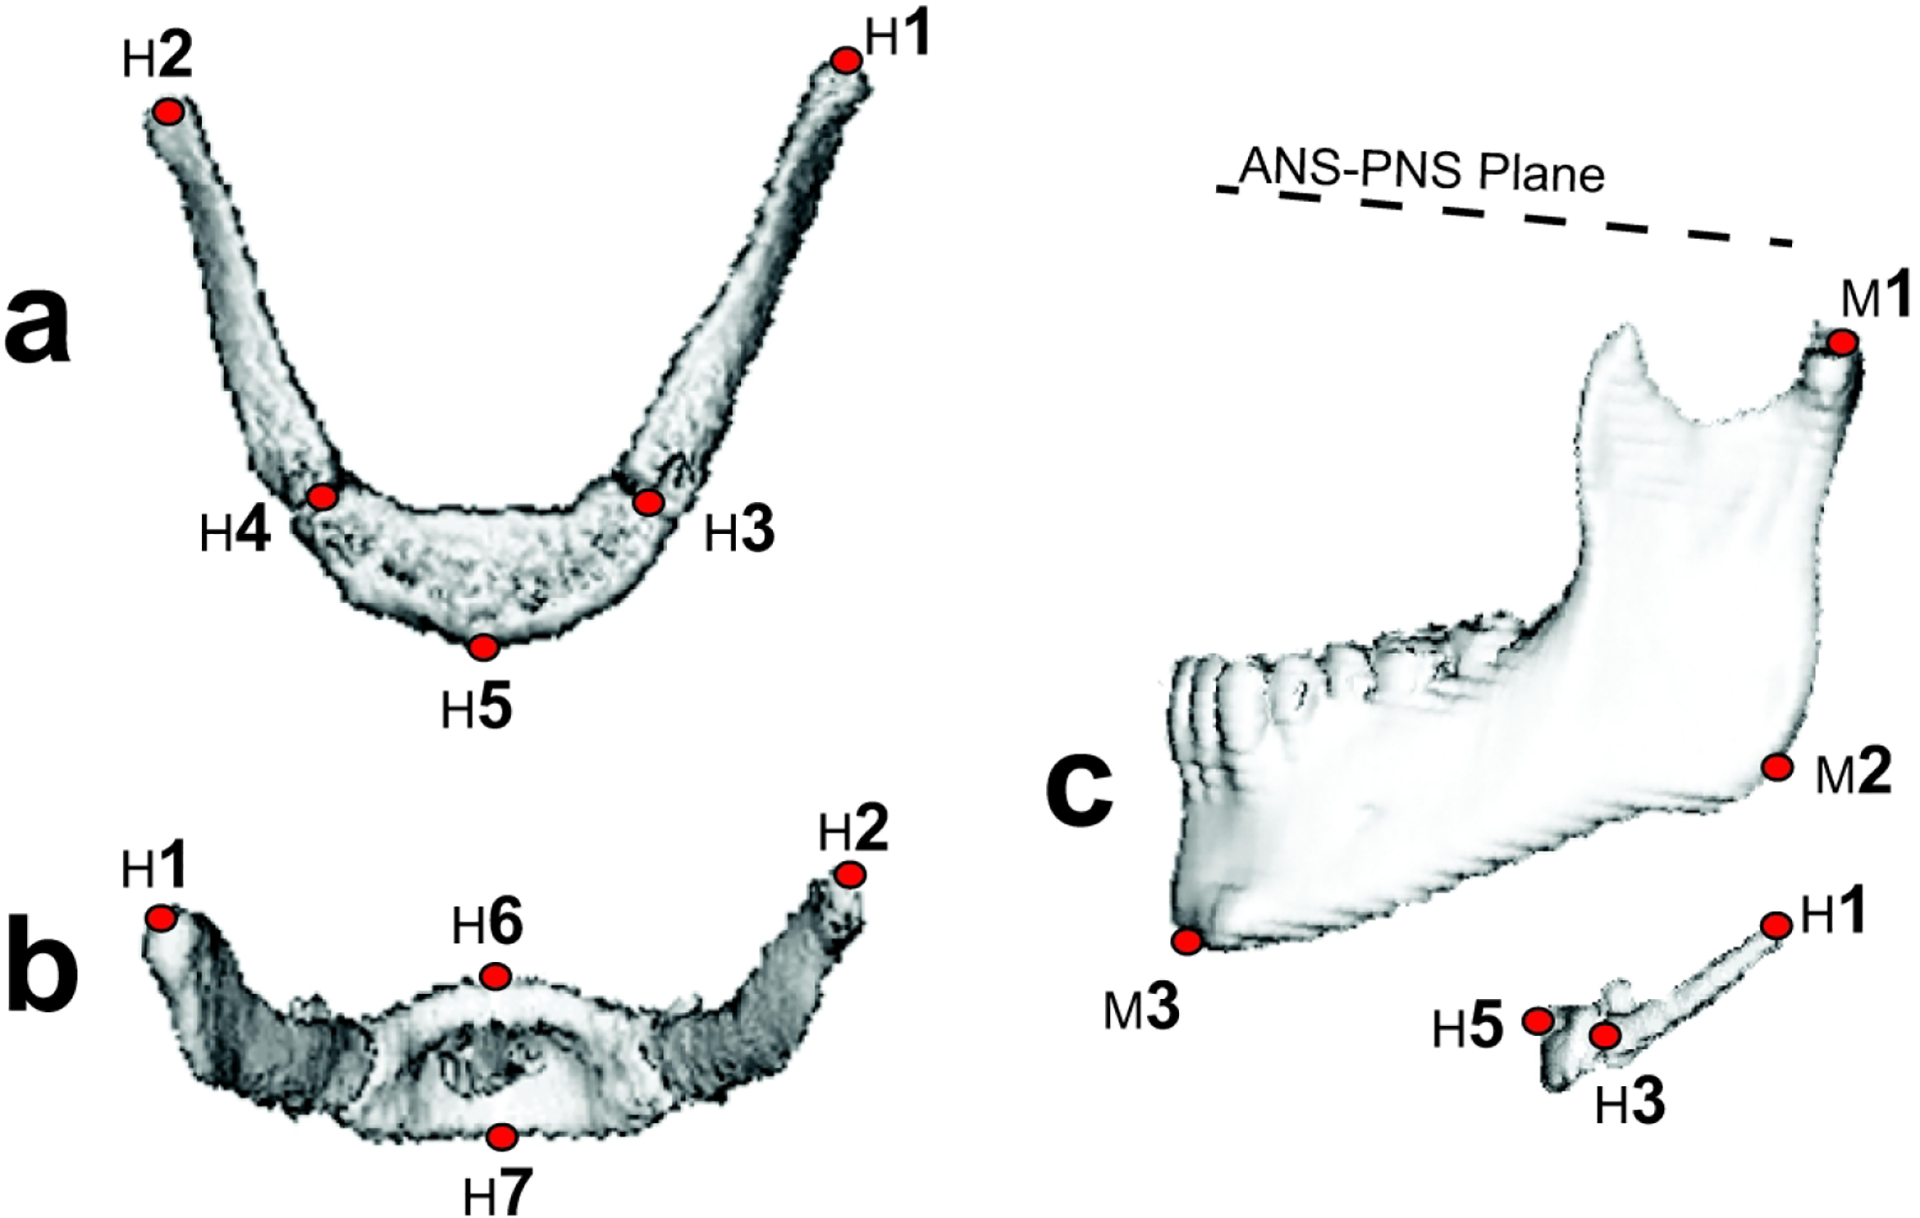
Landmark placement on the hyoid bone and the mandible: (a) hyoid bone superior view, (b) posterior view, and (c) left lateral view including the ANS-PNS plane and the mandible. The ‘H’ landmarks denote the hyoid bone greater cornu apex left (H1) and right (H2), greater cornu base left (H3) and right (H4), hyoidale (H5), hyoid body most superior posterior point (H6), and hyoid body most inferior anterior point (H7). The ‘M’ landmarks denote the mandible left superior condyle (M1), gonion (M2), and gnathion (M3).
Table 1.
Hyoid bone and hyomandibular relational variable descriptions and landmark associations.
| Variable # | Description | Variable Name (Landmarks) | Abbreviation (Figure #) |
|---|---|---|---|
| 1 | Distance from the most posterior and distal endpoint of left greater cornu to most posterior and distal endpoint of right greater cornu. | Greater Cornu Width (H1-H2) | GrCorW (Fig. 2) |
| 2 | Distance from the most posterior and distal endpoint of left greater cornu to the most superior and anterior point on the hyoid body (hyoidale) | Greater Cornu to Hyoidale Length (H1-H5) | GrCorHyL (Fig. 3) |
| 3 | Distance from the most superior and posterior point to the most inferior point of hyoid body. | Hyoid Body Depth (H6-H7) | HyBD (Fig. 4) |
| 4 | Angle created by the intersection of a line passing through the most superior and distal endpoint of left greater cornu to the hyoidale and a line passing through the most superior and distal endpoint of right greater cornu to the hyoidale. | Hyoid Angle (H1-H5-H2) | HyAng (Fig. 5) |
| 5 | Distance from the most posterior and distal endpoint of the left greater cornu to the most superior point of left condylar head | Mandibular Condyle to Greater Cornu Distance (H1-M1) | ConCorD (Fig. 6) |
| 6 | The angle of inclination of the hyoid bone from the angulation of the nasal spine at the midline | Hyoid angle of inclination (Angle btw H5-H1 & ANS-PNS) | HyInc (Fig. 7) |
| 7 | The angle of inclination of the mandible from the angulation of the nasal spine at the midline | Mandible angle of inclination (Angle btw M3-M2 & ANS-PNS) | ManInc (Fig. 8) |
Statistical analysis.
The growth data for all the variables were evaluated separately for males and females using the fourth-degree polynomial fit and its first derivative to determine growth rate. Goodness-of-fit tests in the form of likelihood ratio tests were performed among the polynomial fits. The fourth-degree polynomial fit optimally characterized the growth of variables examined despite the limitation of the polynomial models being sensitive to the smaller number of measurements at the extreme ages (De Boor, 1978). Outliers were identified with respect to the externally studentized residuals of the fixed-effects models that exceeded 2.6 standard deviations of the t distribution and removed from further analyses. The data removed for each variable (less than 1%) are denoted as ‘Out’ in Table 3. After the outliers were removed, a mixed-effects fourth-degree polynomial model was fitted for growth trend and its first derivative calculated for growth rate, accounting for the dependency among the longitudinal data since, as noted above, some of the scans were repeated on the same individual at different ages.
Table 3.
Sex differences for each of the seven variables with the first column showing the χ2 p-value for overall sex effect. Significant p-values, based on Bonferroni correction, are denoted in bold with an asterisk (*). The remaining columns displays the summary t-test results for sex effect comparing the discrete age cohorts I–IV for each of the seven variables. Significant p-values, based on the Bonferroni correction, are similarly denoted in bold and with an asterisk (*). The remaining columns specify for each age cohort the n = number of cases in each age cohort; Out = number of outliers; Mean value; and SEM = standard error of the mean in Males and Females.
| Variable | Male | Female | ||||||||||
|---|---|---|---|---|---|---|---|---|---|---|---|---|
| χ2 p | Age Cohort | n | Out | Mean | SEM | n | Out | Mean | SEM | t | df | p |
| GrCorW | I | 16 | 0 | 25.84 | 0.443 | 10 | 0 | 26.08 | 0.959 | 0.23 | 13 | 0.8247 |
| 0.0147* | II | 8 | 1 | 31.89 | 1.16 | 11 | 1 | 33.63 | 0.775 | 1.25 | 11 | 0.2385 |
| III | 12 | 0 | 37.03 | 0.926 | 10 | 0 | 33.83 | 1.025 | −2.32 | 19 | 0.0316 | |
| IV | 15 | 0 | 42.79 | 0.632 | 15 | 0 | 34.18 | 0.605 | −9.84 | 28 | 0.0000* | |
| GrCorHyL | I | 16 | 1 | 24.89 | 0.268 | 10 | 0 | 23.96 | 1.076 | −0.84 | 10 | 0.4199 |
| 0.5034 | II | 8 | 0 | 28.6 | 0.951 | 11 | 1 | 29.92 | 0.856 | 1.03 | 15 | 0.317 |
| III | 12 | 0 | 34.42 | 0.58 | 10 | 0 | 35.02 | 0.863 | 0.58 | 16 | 0.5706 | |
| IV | 15 | 0 | 39.32 | 0.425 | 15 | 0 | 38.1 | 0.781 | −1.37 | 22 | 0.1854 | |
| HyBD | I | 16 | 0 | 9.01 | 0.331 | 10 | 0 | 8.99 | 0.762 | −0.02 | 12 | 0.9846 |
| 0.8061 | II | 8 | 0 | 9.88 | 0.427 | 11 | 0 | 9.82 | 0.422 | −0.09 | 16 | 0.9333 |
| III | 12 | 1 | 12.33 | 0.446 | 10 | 0 | 12.96 | 0.818 | 0.68 | 14 | 0.51 | |
| IV | 15 | 0 | 13.59 | 0.388 | 15 | 0 | 13.19 | 0.446 | −0.68 | 27 | 0.5049 | |
| HyAng | I | 16 | 1 | 63.26 | 1.315 | 10 | 0 | 67.35 | 1.599 | 1.97 | 20 | 0.0628 |
| 0.0440* | II | 8 | 1 | 68.05 | 1.05 | 11 | 0 | 68.79 | 2.418 | 0.28 | 13 | 0.7824 |
| III | 12 | 0 | 65.96 | 1.608 | 10 | 0 | 58.35 | 2.548 | −2.53 | 16 | 0.0228 | |
| IV | 15 | 0 | 66.55 | 1.138 | 15 | 0 | 53.86 | 1.706 | −6.19 | 24 | 0.0000* | |
| ConCorD | I | 16 | 0 | 49 | 0.788 | 10 | 0 | 49.2 | 1.683 | 0.11 | 13 | 0.9142 |
| 0.1207 | II | 8 | 0 | 63.59 | 1.222 | 11 | 0 | 58.17 | 1.582 | −2.71 | 17 | 0.0149 |
| III | 12 | 1 | 66.12 | 2.239 | 10 | 0 | 67.85 | 2.432 | 0.52 | 19 | 0.6079 | |
| IV | 15 | 0 | 80.96 | 0.767 | 15 | 1 | 74.52 | 0.778 | −5.9 | 27 | 0.0000* | |
| HyAngInc | I | 16 | 1 | 48.44 | 1.513 | 10 | 0 | 44.72 | 2.126 | −1.43 | 18 | 0.1711 |
| 0.7284 | II | 8 | 0 | 44.31 | 2.256 | 10 | 0 | 39.21 | 1.251 | −1.98 | 11 | 0.0735 |
| III | 12 | 0 | 39.54 | 1.037 | 10 | 1 | 36.46 | 2.132 | −1.3 | 12 | 0.2181 | |
| IV | 15 | 0 | 46.74 | 1.485 | 15 | 0 | 34.06 | 0.9 | −7.3 | 23 | 0.0000* | |
| ManAngInc | I | 16 | 0 | 47.58 | 0.816 | 10 | 0 | 46 | 0.953 | −1.26 | 20 | 0.2212 |
| 0.1072 | II | 8 | 0 | 46.37 | 1.362 | 10 | 0 | 38.99 | 1.171 | −4.11 | 15 | 0.0009* |
| III | 12 | 1 | 41.77 | 1.259 | 10 | 1 | 36.59 | 1.654 | −2.49 | 16 | 0.0245 | |
| IV | 15 | 0 | 42.72 | 0.732 | 15 | 0 | 37.99 | 0.63 | −4.9 | 27 | 0.0000* |
To determine the percent contribution of the primary growth types to overall growth, the composite growth model comprised of linear combination of two growth types – neural and somatic– was applied to the raw data (Wang et al., 2013). As described earlier, neural growth is characterized as reaching 80% of adult size during early childhood, whereas somatic growth reaches only 25–40% of the adult size during early childhood, with the remaining growth occurring during adolescence (Scammon, 1930).
Global sex differences in each variable were assessed through a likelihood ratio test assessing the significance of the sex effect in the fourth-degree polynomial fit on the growth of each variable. In addition, to assess sexual dimorphism in localized age ranges, the measurements for each variable were divided into four age cohorts described previously: age cohort I (n=26), age cohort II (n=17), age cohort III (n=22), and age cohort IV (n=30). Sex differences were examined using a two-sample t-test within each of the age cohorts to assess localized growth differences between males and females during the different time periods of development. The Bonferroni correction (Bland and Altman, 1995) was applied at the 0.05 level of significance to account for multiple comparisons across the four age cohorts.
III. RESULTS
Growth Trend and Growth Rate
Figure 2–8 show sex-specific non-uniform growth trends (2a–8a) and growth rates (2b–8b) for the seven variables listed in Table 1. The growth trend plots (2a–8a) also show the percent of adult growth on the right y-axis marking the percentage of overall growth that has been completed based on the growth trend lines. The value of 100% is denoted as the growth trend at its minimum or maximum after age 15 years. Hyoid bone measurements displayed in Figures 2–5, and hyomandibular positional/relational measures shown in Figures 6–8 reveal similar trends for distance versus angular measurements. In general, distance measurements (Greater Cornu Width, Fig. 2; Greater Cornu-Hyoidale Length, Fig. 3; Hyoid Body Depth, Fig. 4; and Condyle-Greater Cornu Distance, Fig. 6) show increasing growth trends in both males and females throughout development; whereas angular measurements (Hyoid Angle, Fig 5; Hyoid Angle of Inclination, Fig. 7); and Mandible Angle of Inclination, Fig. 8) reveal decreasing growth trends in both males and females up to about age 13–15 years following which distinctive sex-specific differences emerge with female values continuing to decrease, while male values increase.
Figure 2.

Variable Greater Cornu Width growth over the course of development. The top panel (a) shows measurements in mm as a function of age in years for males (open blue triangles) and females (shaded red circles). The data are fitted with a fourth-degree polynomial to display growth trend for males (blue solid line) and females (red dashed line). The second y-axis reflects the percent growth to adult mature size for males (blue, outward ticks) and females (red, inward ticks). The middle panel (b) displays the growth rate as a function of age for males (solid blue line) and females (dashed red line), as derived from the polynomial fit in top panel. The bottom panel (c) displays box-plots for males (blue open boxes) and females (red diagonal filled boxes) for each of the four age cohorts [Cohort I = ages birth 4;11 (years;months); Cohort II = ages 5;00–9;11; Cohort III ages 10;00–14;11; and Cohort IV = ages 15;00–19;11]. The box plots display the 25th to 75th percentile scores and the mean (solid line). The whiskers display the 5th and 95th percentile scores, and outliers are displayed as dots. Age cohorts with significant sex differences, using theBonferroni corrected .05 level of significance, are marked with an asterisk. The numeric values for overall sex differences as well as for each age cohort are listed in Table 4.
Figure 8.

Variable Mandibular Angle of Inclination over the course of development in males (blue) and females (red). As detailed in Figure 2 caption, top panel (a) displays growth trend, middle panel (b) growth rate, and lower panel (c) age cohort sex differences.
Figure 5.

Variable Hyoid Angle over the course of development in males (blue) and females (red). As detailed in Figure 2 caption, top panel (a) displays growth trend, middle panel (b) growth rate, and lower panel (c) age cohort sex differences.
Figure 6.

Variable mandibular Condyle-to-Greater Cornu Distance-left over the course of development in males (blue) and females (red). As detailed in Figure 2 caption, top panel (a) displays growth trend, middle panel (b) growth rate, and lower panel (c) age cohort sex differences.
Figure 3.

Variable Greater Cornu-to-Hyoidale Length over the course of development in males (blue) and females (red). As detailed in Figure 2 caption, top panel (a) displays growth trend, middle panel (b) growth rate, and lower panel (c) age cohort sex differences.
Figure 4.

Variable Hyoid Body Depth over the course of development in males (blue) and females (red). As detailed in Figure 2 caption, top panel (a) displays growth trend, middle panel (b) growth rate, and lower panel (c) age cohort sex differences.
Figure 7.

Variable Hyoid Body Angle of Inclination over the course of development in males (blue) and females (red). As detailed in Figure 2 caption, top panel (a) displays growth trend, middle panel (b) growth rate, and lower panel (c) age cohort sex differences.
Hyoid bone growth was characterized by changes in width, length, depth and angle with female values being greater than male values up to age 10 years where the pattern reversed at the onset of puberty (Figures 2–5). As seen in Figure 2a, during early childhood, before age 10, the growth trend of the Greater Cornu Width was steeper in females than males, but leveled off at a much earlier age in females than in males while male hyoid bone growth continued. Similarly, both Greater Cornu-Hyoidale Length (Fig. 3a) and Hyoid Body Depth (Fig. 4a) displayed rapid growth in females early on, however both males and females displayed a secondary growth during puberty where growth rate, more rapid in males than females, increased for both variables at about ages 5–12 years in males and ages 7–13 years in females (Fig 3b and 4b). Regarding Hyoid Angle, the angular measurements for females continued to decrease past age 10 years whereas male growth rate increased and subsequently angular measurements increased (Figs. 5a–b),
As for hyomandibular relational growth (Figures 6–8), in general male measurements were larger than female measurements with differences becoming more pronounced after age 15 during the postpubertal period. The Condyle-to-Greater Cornu Distance (Fig. 6a), displays two periods of rapid growth with males having greater increases in growth rate than females from ages seven to 15 years (Fig. 6b), resulting in males having growth trends with distinctly greater increases in distance during puberty and postpuberty. As noted above, the growth trend of the Hyoid Angle of Inclination (Fig. 7a) and Mandible Angle of Inclination (Fig. 8a) for both males and females decreased with age up to about age 15 years, after which the degree of inclination continued to decrease in females (smaller angles) after ages 13–15 years, while both male Hyoid and Mandible Angles of Inclination increased during postpuberty (Fig 7a and 8a) with their respective growth rates increasing during puberty around age 13 years (Fig 7b and 8b).
Growth Type
Table 2 shows the calculated percentage somatic and neural growth type for all the variable measures in Table 1. As hypothesized, the Greater Cornu Width and Greater Cornu-Hyoidale Length measurements in females had a predominantly neural growth type. However, the males had a hybrid growth type (52.31% somatic and 47.69% neural) for Greater Cornu Width, and somatic growth type for Greater Cornu-Hyoidale Length (94.32% somatic and 5.68% neural). The Hyoid Body Depth measurement, as expected, displayed a somatic growth type (99.6% and 100% for females and males respectively). The Hyoid Angle, however, displayed a hybrid growth type (55.69% neural and 44.31% somatic) in males but a predominantly somatic growth type in females (94.66% somatic and 5.34% neural). The relational measures of Condyle to Greater Cornu Distance, Mandibular Angle of Inclination, and Hyoid Angle of Inclination were predominantly the neural growth type in both females and males, though the Hyoid Angle of Inclination in males can be considered to be hybrid (56.83% neural and 43.17% somatic).
Table 2.
Percent somatic versus neural growth type contributions in males and females for each of the seven variables studied.
| Male | Female | |||
|---|---|---|---|---|
| Neural | Somatic | Neural | Somatic | |
| GrCorW | 47.69 | 52.31 | 76.88 | 23.12 |
| GrCorHyL | 5.68 | 94.32 | 65.59 | 34.41 |
| HyBD | 0 | 100 | 0.40 | 99.6 |
| HyAng | 55.69 | 44.31 | 5.34 | 94.66 |
| ConCorD | 73.63 | 26.37 | 77.16 | 22.84 |
| HyAngInc | 56.83 | 43.17 | 98.35 | 1.65 |
| ManAngInc | 79.81 | 20.19 | 96.64 | 3.36 |
Sexual Dimorphism
Sex differences in the four age cohorts for the seven variables listed in Table 1 are shown in Table 3, and in Figures 2c to 8c. For all the variables listed in Table 1 on hyoid bone and the hyomandibular relational measurements, the first column in Table 3 presents the p-values of the likelihood ratio test assessing global sex differences with significant p-values, based on Bonferroni correction at a .05 level of significance, marked in bold and with an asterisk (*). The remaining columns in Table 3, present the age-cohort specific t-test measures with significant p-values, again based on Bonferroni correction, similarly marked in bold and with an asterisk (*). Of the variables examined, significant global sex differences were present for hyoid bone measurements in only the following two variables Greater Cornu Width (p=.0147) and Hyoid Angle (p=.044), with males having wider Greater Cornu Width measurements than females and subsequently larger Hyoid Angle measures (Figures 2c and 5c respectively). The age-cohort comparisons also revealed that both the Greater Cornu Width and the Hyoid Angle have significant sex differences but only during postpubertal age cohort IV, not earlier developmentally, with the males being significantly larger than the females (mean width=42.79 vs 34.18 mm; and mean angle= 66.55 vs 53.86 degrees in males and females respectively). As for the remaining hyoid bone variables, Greater Cornu-Hyoidale Length (Figure 3c) and Hyoid Body Depth (Figure 4c) did not display either global or localized age-cohort significant sex differences. However, the hyomandibular relational measures, Condyle-to-Greater Cornu Distance (Figure 6c), Hyoid Angle of Inclination (Figure 7c), and Mandible Angle of Inclination (Figure 8c) showed localized sexual dimorphism during age cohort IV with the male measurements being larger than the female measurements (mean distance=80.96 vs 74.52mm; mean hyoid inclination angle= 46.74 vs 34.06 degrees; mean mandible inclination angle=42.72 vs 37.99 degrees in males and females respectively). In addition, Mandible Angle of Inclination also exhibited localized sexual dimorphism during age cohort II, with the male Angle of Inclination measurements being greater than the female mean measurements (46.37 vs 38.99 degrees).
IV. DISCUSSION
This study documents the sex-specific growth trend, rate and type of the hyoid bone in width, length, depth and inclination in typically developing males and females ages birth to 19 years using in vivo CT scans. Given the distinct advantage of in vivo CT scans where the hyomandibular relationship is preserved, this study used the in vivo CT scans previously used to characterize mandibular growth (Kelly et al., 2017) to characterize developmental changes in hyomandibular relations. The hypothesized directional growth type of the hyoid bone following a similar pattern as the mandibular growth type, to synchronize with mandibular growth type, was only supported to a limited extent by females. The mixed growth type was the most common growth type for both sexes. As for the predicted prepubertal or pubertal sex-differences in hyoid bone growth, our findings confirmed significant sexual dimorphism in four of the six hyoid bone variables studied. However, despite the general growth trend of females having larger measurements than males during approximately the first decade of life (Figs. 2–5), sexual dimorphism was significant only during postpubertal age cohort IV with males having larger measurements than females (see Table 3). This study offers baseline measurements on hyoid bone and hyomandibular growth, and provides insight and guidance in characterizing hyomandibular growth. To our knowledge, this is the first study to report findings that cover the entire developmental age range up to 20 years. This study is also the first to examine the hyoid bone both individually and in conjunction with the mandible from early childhood through late adolescence.
Growth Trend and Growth Rate
A general increasing growth trend was observed in hyoid bone length, width, depth and distance measurements throughout the developmental ages examined in both males and females with many of the variables having larger measurements for females up to about age 10 years (Figs 2a–5a). We also observed a general decrease in the three angular measurements in both males and females up to approximately age 12 years, at which time male angular measurements gradually increased. Such findings reflect changes in size and shape during the course of development that possibly extend into adulthood (Urbanova et al., 2013). Growth rate differences between males and females in terms of magnitude (Figs 2b–7b) appear to affect not only the emergence of sexual dimorphism, but also the divergence in growth type between males and females, as discussed below.
As for relational growth, the morphologic similarity of the hyoid bone to the mandible (Doual et al., 2003; Sheng et al., 2009) is evident and striking in the concurrent overall growth of distance and angular measurements of the hyoid bone (present study) and the mandible (Kelly et al., 2017). Such a comparison is valid, given that this study used the same imaging dataset and methodology. Using the ANS-PNS plane as a common reference line within the hyomandibular functional unit, examples of concurrent relational growth include the findings in this study of increased Hyoid and Mandible Angles of Inclination in males after age 13, as well the increased Hyoid Angle in males that parallel the increased mandibular angles: Gnathion Angle and Lingual Angle reported in Kelly et al. (2017). Noteworthy of mention is that the Hyoid and Mandible Angles of Inclination measures also embed the developmental rotation and shape changes of the nasal floor during development (Bjork, 1969; Bjork and Skieller, 1983). Similarly, for the anterior aspect of the hyoid bone (hyoidale region), the smaller Hyoid Angle in females than males after age 13 years in this study are paralleled by the respectively smaller mandibular Gnathion and Lingual angles (Kelly et al., 2017). Furthermore, the wider Greater Cornu Width in males than females after age 13 years in this study is paralleled by the wider mandibular measures of Lateral Condyle Width and Gonion Width in males as reported by Kelly et al. (2017). In contrast, Mitani and Sato (1992), conclude that, despite the morphological resemblance between the mandible and the hyoid bone, their growth did not display a high degree of similarity in the 9 to 14-year-old Japanese girls they studied, but state that the hyoid bone and the mandible likely had early synchronized development (before ager 9 years) for functional reasons. While this is likely the case, we contend that rather than basing such a conclusion on correlation of a single measure, antero-posterior measurement from lateral cephalograms, it would be optimal to base such conclusions on assessments in multiple planes, given planar growth trend and type differences. The current study also indicates that it is necessary to account for growth rate differences, which can affect and possibly alter growth type.
The above noted findings of Hyoid Angle and Hyoid Angle of Inclination being less acute in males than females is likely related to laryngeal descent, and implicate a combination of hyo-mandibular and hyo-laryngeal relations –likely a combination of structural and functional relations– to be influencing the growth and positioning of hyoid bone. The hyoid bone’s unique disarticulation to other bony structures, and its unfused components prior to age 20, allow a greater influence on its growth and positions by its structural and functional needs in relation to the mandible and the larynx (Orsbon et al., 2018). In a 3D CT study of Japanese cadavers (ages 67 to 102 years), Ichijo et al., (2016) reported a strong significant correlation between size (length and width) of the hyoid bone and the mandible in cadavers with nonfused hyoid bones, and only moderate correlation in those in which the hyoid bone had completely fused.
Undoubtedly, the assessment of additional sex-specific developmental hyoid bone, as well as hyomandibular and hyolaryngeal relational measures in typically developing individuals across the lifespan would provide better insight on the nature of structural and functional relations affecting the growth of the hyoid bone. Furthermore, having such developmental normative data across the lifespan to compare against a number of clinical observations and/or disorders with compromised aerodigestive and/or speech functions will be instrumental in gaining insight on the relation between compromised structure and function for the advancement of potential treatment approaches.
Growth Type: Neural and Somatic Contributions
Despite the concurrent overall growth trend patterns in males and females described above, as well as the noted synchronous hyomandibular relational growth, most variables showed apparent differences in the growth rate between the two sexes, with discrete divergence in growth type. In contrast, the variables that had similarity in growth rate, also had similar growth types. Thus, our findings do not fully support our hypothesized predominantly neural growth type for hyoid bone measurements in the horizontal or transverse plane, and predominantly somatic growth type for measurements in the vertical or sagittal plane, as was observed with mandibular growth. Instead, our findings indicate an intricate sex-specific growth rate and growth type relationship that appears to be mostly supportive of a combination (neural and somatic) growth type for structures in the neck region (Scammon,1930). Our findings implicate the need to also account for the hyolaryngeal structural and functional connections, as noted by Orsbon et al. (2018). It is likely that the differences in the growth type between males and females is related to the lower placement of the hyolaryngeal complex in males as compared to females.
Sexual Dimorphism
Based on previous findings of pubertal sexual dimorphism for the variables Gnathion Angle and Gonion Width in the inferior border of the mandible (Kelly et al., 2017), we hypothesized that two hyoid bone variables, Hyoid Angle and Greater Cornu Width, would reveal prepubertal and/or pubertal sexual dimorphism. However, while those two variables showed significant overall sexual dimorphism, significant localized sexual dimorphism was only evident during postpubertal age cohort IV. In fact, with the exception of two variables (Greater Cornu-to-Hyoidale Length and Hyoid Body Depth) that were not sexually dimorphic, all the remaining hyoid bone variables examined revealed postpubertal sexual dimorphism during age cohort IV.
Hyoid bone morphometry is one of the tools that anatomists and anthropologists use to identify sex (Vohra and Kulkarni, 2017; Okasi et al., 2018). Sexual dimorphism in size and shape have been reported (Urbanova, 2013; Fakhry, et al., 2013), with a number of studies confirming that the dimensions of the male hyoid bone are larger in males than females, but such findings are based on postpubertal hyoid bone measurements (Urbanova et al., 2013; Okasi et al., 2018; Sameera and Rao, 2019). Overall, our findings are generally consistent with sex-specific differences reported that include the following dimensions: wider distance between the two greater cornua with males having greater width (Urbanova et al., 2013); wider hyoid body in males (distance between the left and right central points of junction of the greater cornu and the hyoid body) (Vohra and Kulkarni, 2017; Okasi et al., 2018); greater length of the greater cornu in males (Vohra and Kulkarni, 2017), specifically the left greater cornu (Okasi et al., 2018); and the common V-shaped hyoid angle in females (Urbanova et al., 2013), formed by the intersection of lines extending between the two greater cornu, despite inconsistencies in findings on significance (Okasi et al., 2018; Ichijo et al., 2016).
This study focused more on overall hyoid bone measurements, not the specific measurements of the individual parts of the hyoid bone such as the length of the greater cornu and the width of the hyoid body. Sex differences in the shape of the hyoid bone (Urbanova et al. 2013) are supported by our findings that the variable Greater Cornu-to-Hyoidale Length was not sensitive to sex differences but that the variables Greater Cornu Width and the Hyoid Angle at the hyoidale were sexually dimorphic. It appears that such sex differences are based on sexual dimorphism of the individual measurements of the parts of the hyoid bone, specifically the greater cornu length and hyoid body width. Of the limited developmental studies on hyoid bone growth, Vohra and Kulkarni (2017) reported that, despite considerable increases in measurements between the ages birth to twelve years in both males and females, sexual differences were insignificant up to age 12 years, with differences becoming more apparent at ages 13 to 80 years. Indeed, our findings based on age-cohort comparisons confirm that sexual dimorphism of the hyoid bone does not become evident until postpuberty. However, our findings revealed that a number of the hyoid bone variables examined had larger dimensions for females than males prior to age 10 years, but that growth rate differences between the two sexes during puberty and postpuberty contributed to the emergence of sexual dimorphism as males’ growth outpaced females for most variables addressed in this study (Figs 2–5). Vohra and Kulkarni (2017) also report that the growth of the hyoid bone persisted in males until 25 years, whereas no increases in size were evident in females beyond age 20 years.
The finding of postpubertal sex differences in the Mandible and Hyoid Angles of Inclination implicate structural and/or functional differences that affect the positioning of the hyoid bone. Male/female growth trends in Condyle-to-Greater Cornu distance (Fig 6) were almost identical until about age 13 years, after which a systematic divergence occurred, and the measurements in males exceeded that of females by more 15mm by about age 20 years. Such divergence corresponds to the greater increase in mandibular ramus depth in males (Kelly et al., 2017; p.33) with the posterior aspect of the hyoid bone retaining a position inferior to the mandible. Closer examination of the divergence of the angular measures of inclinations between males and females during age cohort IV reveals the angle of inclination differences to be larger for the hyoid bone than the mandible in males which, given the hyoid bone’s structural attachments to the larynx via the thyrohyoid, is likely related to the secondary descent of the larynx in males during the same time period (Fitch and Giedd, 1999). Noteworthy of mention, is that such inclination measures embed changes in the nasal floor given use of the ANS-PNS reference plane. Also, the differences between and variability within the two inclination measures using the lower border of the mandible/hyoid, are likely also affected by mandibular rotation which was not assessed in this study (Bjork, 1969; Bjork and Skieller, 1983).
The important role of structural relations of the hyomandibular and hyolaryngeal complexes in safely carrying out uninterrupted functions becomes evident in clinical cases. For example, Kamano et al., (2017) reported that mandibular setback surgery to correct for mandibular prognathism resulted in posterior positioning of the hyoid, with increased likelihood of patients experiencing obstructive sleep apnea. Hirai et al., (2009) assessed the effect of neck dissection for the treatment of cancer on dysphagia and reported that neck dissection altered the hyoid bone’s position, both at rest and during swallow, such that its position at rest was displaced forward and downward, and the distance it traversed during swallow decreased, with resultant increase in laryngeal penetration/dysphagia. In addition, a smaller size of the hyoid body in infants has been associated with sudden infant death syndrome (Gray, 2006). While many additional clinical examples can be found in the literature, it is sufficient to affirm the importance of having thorough and in-depth knowledge of the sex-specific growth of the hyoid bone and the relational growth of the hyo-mandibular and hyo-laryngeal complexes.
Future Direction
This study, to our knowledge, is the first to quantitatively examine the typical growth of the hyoid bone both individually and in conjunction with the mandible from early childhood through late adolescence. This knowledge contributes to the body of normative data on the growth of the hyoid bone and hyomandibular relations during typical development, while meeting the intact functions of respiration, deglutition and speech. Obtaining additional CT scans, particularly longitudinal scans, of typically developing individuals across the same age range studied, as well as across the lifespan, with the inclusion of angular measures using the sella-to-nasion as a more stable reference line for development, particularly during puberty (Bjork and Skieller, 1983) would be optimal for future studies on development to better control for the variability noted in some of the measures, such as Hyoid Body Depth, Hyoid Angle, Hyoid Angle of Inclination, and Mandible Angle of Inclination where some extreme values or split in values at select ages were present. Additionally, the sella-to-nasion reference line could be used to examine the rotation of the mandible relative to the cranial base during growth and whether the rotation of the mandible is mirrored by a similar rotation in the position of the hyoid bone. Also, it would be useful to confirm the age of maturity by determining when all the different measures plateau, and to determine if some measures have a protracted growth period. Furthermore, surface-based morphometry to identify regions of growth (Chung et al., 2020 and 2015) can be used to guide the placement of additional landmarks on the hyoid bone for the purpose of obtaining developmental measures of additional variables, as well as for greater detail in the assessment of form (size and shape) and shape using geometric morphometry. Developmental measures, particularly for the individual components of the hyoid bone, including the lesser cornu, will further contribute towards establishing age-specific normative growth data of the components of the hyoid bone as a single structure, as well as its development and position relative to the mandible and the larynx. Furthermore, such detailed measures will permit assessments on the role of embryologic origin, structure and function on development (Esteve-Altava et al., 2015). The assessment of form and shape, using geometric morphometry, could provide additional information on the composite changes with and without size as a factor (Mitteroecker and Gunz, 2009). By controlling for size, this approach would assist in examining changes in developmental morphology, also in identifying when sexual dimorphism emerges. In addition, inclusion of soft tissue data, such as the typical developmental changes of the muscle and ligament attachments to the hyoid, the mandible, and the larynx, would allow for a more detailed understanding of the aerodigestive and vocal tract functional unit. For example, Coquerelle et al. (2012) report findings relating the prominence of the mental region of the mandible to the developmental relocation (downward and forward displacements) of the tongue, the geniohyoid and the anterior digastric muscle insertions; also, findings that suggest the downward and forward development of the lingual side of the symphyseal inferior border to the packaging of the tongue and suprahyoid muscle insertion at the lingual side of the symphysis to preserve the aerodigestive and speech functions of the laryngopharynx. Thus, adding soft tissue data would further our current theoretical understanding of craniofacial growth (Carlson 2005). Finally, including scans from atypically developing children, such as individuals with Down syndrome, who have a wide range of variability in compromised functions including reduced speech intelligibility (Kumin, 1994; Price and Kent, 2008; Fawcett and Peralego, 2009; Kent and Vorperian, 2013), feeding difficulties with oral and pharyngeal dysphagia (Jackson et al., 2016), and obstructive sleep apnea (Delabar et al., 2016), and subjecting their scans to similar analyses would elucidate on the nature of severity of function on anatomic similarity and/or differences and provide insight on structural and functional relations in shaping the anatomy during the course of development. Our characterization of typical hyoid bone growth and hyomandibular relations has implications for a number of disciplines that address the aerodigestive and speech functions clinically, as well as the fields of anatomy, forensics, and anthropology.
Supplementary Material
Supplemental Table. Allocation of the 97 scans from the 49 typically developing individuals into the four age-cohorts, as defined in text, with the 16 individuals with repeat scans denoted in gray highlight. For each age-cohort, the individual subject identification number is followed by sex and chronological age in months at time of imaging.
ACKNOWLEDGMENTS
This research was funded by the National Institutes of Health Grant R01 DC6282 from the National Institute on Deafness and Other Communication Disorders (NIDCD), and Core Grant U54 HD090256 from the National Institute of Child Health and Human Development (NICHD). There was no involvement of the funding sources in the research design, data collection, analysis, interpretation, writing of this paper or submission for publication. All authors declare there was no conflict of interest in the research reported in this study/paper. We thank Ying Ji Chuang and Ellie Fisher for assisting with 3D modeling and landmark placement, Sophie D. Blankenheim for assistance with references, and Jacqueline Houtman for comments on an earlier version of this manuscript. We also thank Lindell R. Gentry, MD for his assistance in establishing the Vocal Tract Development Laboratory’s imaging database, and Prof. Moo K. Chung for his guidance with statistical analyses. At last but not least, we thank the two anonymous reviewers for their critical and thorough review of this study as their comments undoubtedly helped enrich this paper.
Grant sponsor(s):
National Institutes of Health, National Institute on Deafness and Other Communicative Disorders; Grant number R01 DC6282; and National Institute of Child Health and Human Development; Grant number U54 HD090256.
LITERATURE CITED
- Bland JM, Altman DG. 1995. “Comparing methods of measurement: why plotting difference against standard method is misleading.” Lancet 346(8982):1085–1087. doi: 10.1016/s0140-6736(95)91748-9 [DOI] [PubMed] [Google Scholar]
- Björk A 1969. “Prediction of mandibular growth rotation.” Am. J. Orthodontics: 585–599. [DOI] [PubMed] [Google Scholar]
- Björk A and Skieller V 1983. “Normal and abnormal growth of the mandible. A synthesis of longitudinal cephalometric implant studies over a period of 25 years.” European Journal of Orthodontics 5:1–46. [DOI] [PubMed] [Google Scholar]
- Carlson DS. 2005. “Theories of craniofacial growth in the postgenomic era.” Seminars in Orthodontics 11(4):172–183. doi: 10.1053/j.sodo.2005.07.002 [DOI] [Google Scholar]
- Castaldo G, and Cerritelli F. 2015. “Craniofacial growth: evolving paradigms.” The Journal of Craniomandibular and Sleep Practice 33(1):23–31. doi: 10.1179/0886963414Z.00000000042 [DOI] [PubMed] [Google Scholar]
- Chai Y, and Maxson RE. 2006. “Recent Advances in Craniofacial Morphogenesis.” Developmental Dynamics 235(9):2353–2375. doi: 10.1002/dvdy.20833 [DOI] [PubMed] [Google Scholar]
- Chung MK, Adluru N, Vorperian HK. 2020. “Heat Kernel Smoothing on Manifolds and Its Application to Hyoid Bone Growth Modeling.” In Zhao Y., Chen DG . (eds) Statistical Modeling in Biomedical Research. Emerging Topics in Statistics and Biostatistics, 235–261. Springer, Cham. doi: 10.1007/978-3-030-33416-1_12 [DOI] [Google Scholar]
- Chung MK, Qi A, Seo S, and Vorperian HK. 2015. “Unified heat kernel method for diffusion, kernel smoothing and wavelets on manifolds and its application to mandible growth modeling in CT images.” Medical Image Analysis 22:63–76. doi: 10.1016/j.media.2015.02.003. [DOI] [PMC free article] [PubMed] [Google Scholar]
- Cotter MM, Whyms BJ, Kelly MP, Doherty BM, Gentry LR, Bersu ET, Vorperian HK. 2015. “Hyoid Bone Development: An Assessment of Optimal CT Scanner Parameters and Three-Dimensional Volume Rendering Techniques.” The Anatomical Record 298(8):1408–1415. doi: 10.1002/ar.23157 [DOI] [PMC free article] [PubMed] [Google Scholar]
- Coquerelle M, Prados-Frutos JC, Benazzi S, Bookstein FL, Senck S, Mitteroecker P, Weber GW. 2012. “Infant growth patterns of the mandible in modern humans: a closer exploration of the developmental interactions between the symphyseal bone, the teeth, and the suprahyoid and tongue muscle insertion sites.” Journal of Anatomy 222:178–192. doi: 10.1111/joa.12008 [DOI] [PMC free article] [PubMed] [Google Scholar]
- Crelin ES. 1973. Functional anatomy of the newborn. Yale University Press. [Google Scholar]
- De Boor C 1978. “A Practical Guide to Splines.” New York: Springer-Verlag. [Google Scholar]
- Delabar JM, Allinquant B, Bianchi D, Blumenthal T, Dekker A, Edgin J, O’Bryan J, Dierssen M, Potier MC, Wiseman F, Guedj F, Créau N, Reeves R, Gardiner K, and Busciglio J. 2016. “Changing Paradigms in Down Syndrome: The First International Conference of the Trisomy 21 Research Society.” Molecular Syndromology 7(5):251–261. doi: 10.1159/000449049 [DOI] [PMC free article] [PubMed] [Google Scholar]
- Devlin JL. 2002. “Morphological Considerations of the Human Hyoid Bone.” PhD Dissertation, University of Tennessee Knoxville: ProQuest. [Google Scholar]
- Doual A, Léger JL, Doual JM, and Hadjiat F. 2003. “The hyoid bone and vertical dimension.” L’Orthodontie française 74(3): 333–363. [PubMed] [Google Scholar]
- Durtschi RB, Chung D, Gentry LR, Chung MK, Vorperian HK. 2009. “Developmental craniofacial anthropometry: Assessment of race effects” Clinical Anatomy 22(7): 800–808. doi: 10.1002/ca.20852 [DOI] [PMC free article] [PubMed] [Google Scholar]
- Esteve-Altava B, Diogo R, Smith C, Boughner JC, Rasskin-Gutman D. 2015. “Anatomical networks reveal the musculoskeletal modularity of the human head.” Scientific reports 5:8298. doi: 10.1038/srep08298 [DOI] [PMC free article] [PubMed] [Google Scholar]
- Enlow DH, and Hans MG. (Eds.). Essentials of facial growth. WB Saunders Company, 1996. [Google Scholar]
- Fakhry N, Puymerail L, Michel J, Santini L, Lebreton-Chakour C, Giovanni A, Adalian P, Robert D, Dessi P. 2013. “Analysis of hyoid bone using 3D geometric morphometrics: an anatomical study and discussion of potential clinical implications.” Dysphagia 28(3):435–445. doi: 10.1007/s00455-013-9457-x [DOI] [PubMed] [Google Scholar]
- Fawcett S, and Peralego J. 2009. “Speech in Individuals With Down Syndrome.” Perspectives on Language Learning and Education 16(3):109. doi: 10.1044/lle16.3.109 [DOI] [Google Scholar]
- Feng X, Todd T, Hu Y, Lintzenich CR, Carr JJ, Browne JD, Kritchevsky SB, Butler SG. 2014. “Age-Related Changes of Hyoid Bone Position in Healthy Older Adults with Aspiration.” The Laryngoscope 124(6):E231–6. doi: 10.1002/lary.24453 [DOI] [PubMed] [Google Scholar]
- Fisher E, Austin D, Werner HM, Chuang YJ, Bersu E, Vorperian HK. 2016. “Hyoid bone fusion and bone density across the lifespan: prediction of age and sex.” Forensic science, medicine, and pathology 12(2):146–157. doi: 10.1007/s12024-016-9769-x [DOI] [PMC free article] [PubMed] [Google Scholar]
- Fitch WT, and Giedd J. 1999. “Morphology and development of the human vocal tract: A study using magnetic resonance imaging.” The Journal of the Acoustical Society of America 106:1511. doi: 10.1121/1.427148 [DOI] [PubMed] [Google Scholar]
- Frisdal A, Trainor PA. 2014. “Development and evolution of the pharyngeal apparatus.” WIREs Developmental Biology. 3(6):403–18. doi: 10.1002/wdev.147 [DOI] [PMC free article] [PubMed] [Google Scholar]
- Gray AA. “The Hyoid: A Comprehensive Study of Hyoid Morphology Including Sexual Dimorphism in Humans, Early Identification of Sudden Infant Death Syndrome Victims and Forensic Applications.” PhD Dissertation, University of California Riverside, 2006. [Google Scholar]
- Ha JG, Min HJ, Ahn SH, Kim CH, Yoon JH, Lee JG, Cho HJ. 2013. “The Dimension of Hyoid Bone Is Independently Associated with the Severity of Obstructive Sleep Apnea.” PLoS ONE 8(12):e81590. doi: 10.1371/journal.pone.0081590 [DOI] [PMC free article] [PubMed] [Google Scholar]
- Harun WARW, Zainul AR, Izhar AA, and Abdul RS. “3D Modelling and Evaluation of the Morphology of Hyoid Bone.” In World Congress on Medical Physics and Biomedical Engineering 2006, pp. 2320–2323. Springer, Berlin, Heidelberg, 2007. [Google Scholar]
- Hirai H, Omura K, Harada H, Tohara H. 2009. “Sequential Evaluation of Swallowing Function in Patients with Unilateral Neck Dissection.” Head & Neck 32(7):896–904. doi: 10.1002/hed.21275 [DOI] [PubMed] [Google Scholar]
- Ichijo Y, Takahashi Y, Tsuchiya M, Marushita Y, Sato T, Sugawara H, Hayashi S, Itoh M, Takahashi T. 2016. “Relationship between morphological characteristics of hyoid bone and mandible in Japanese cadavers using three-dimensional computed tomography.” Anatomical Science International 91(4):371–381. doi: 10.1007/s12565-015-0312-z [DOI] [PubMed] [Google Scholar]
- Jackson A, Maybee J, Moran MK, Wolter-Warmerdam K, and Hickey F. 2016. “Clinical Characteristics of Dysphagia in Children with Down Syndrome.” Dysphagia 31(5): 663–671. doi: 10.1007/s00455-016-9725-7 [DOI] [PubMed] [Google Scholar]
- Kamano E, Terajima M, Kitahara T, Takahashi I. 2017. “Three-dimensional analysis of changes in pharyngeal airway space after mandibular setback surgery.” Orthodontic Waves 76(1):1–8. doi: 10.1016/j.odw.2016.10.009 [DOI] [Google Scholar]
- Kanetaka H, Shimizu Y, Kano M, Kikuchi M. 2011. “Synostosis of the Joint Between the Body and the greater Cornu of the Human Hyoid Bone.” Clinical Anatomy 24(7):837–42. doi: 10.1002/ca.21183 [DOI] [PubMed] [Google Scholar]
- Kelly MP, Vorperian HK, Wang Y, Tillman KK, Werner HM, Chung MK, and Gentry LR. 2017. “Characterizing mandibular growth and development using three-dimensional imaging techniques and anatomic landmarks.” Archives of Oral Biology 77:27–38. doi: 10.1016/j.archoralbio.2017.01.018. [DOI] [PMC free article] [PubMed] [Google Scholar]
- Kent R, and Vorperian H. 2013. “Speech Impairment in Down Syndrome: A Review.” Journal of Speech Language and Hearing Research 56(1):178–210. doi: 10.1044/1092-4388(2012/12-0148) [DOI] [PMC free article] [PubMed] [Google Scholar]
- Kumin L 1994. “Intelligibility of speech in children with Down syndrome in natural settings: parents’ perspective.” Perceptual and Motor Skills 78(1): 307–313. doi: 10.2466/pms.1994.78.1.307 [DOI] [PubMed] [Google Scholar]
- Laitman JT, Phil M, and Crelin ES. 1976. “Postnatal development of the basicranium and vocal tract region in man.” In Symposium on Development of the Basicranium 206–219. US Govt Printing Office. [Google Scholar]
- Laitman JT, Reidenberg JS. 2013. “The evolution and development of human swallowing: the most important function we least appreciate.” Otolaryngologic Clinicals of North America 46(6):923–935. doi: 10.1016/j.otc.2013.09.005 [DOI] [PubMed] [Google Scholar]
- Lieberman Daniel. The evolution of the human head. Harvard University Press, 2011. [Google Scholar]
- Lieberman DE, McCarthy RC, Hiiemae KM, Palmer JB. 2001. “Ontogeny of postnatal hyoid and larynx descent in humans.” Archives of Oral Biology 46(2):117–28. doi: 10.1016/s0003-9969(00)00108-4 [DOI] [PubMed] [Google Scholar]
- Miller CA, Hwang SJ, Cotter MM, Vorperian HK. 2019. “Cervical vertebral body growth and emergence of sexual dimorphism: a developmental study using computed tomography.” Journal of Anatomy. 234(6): 764–777. doi: 10.1111/joa.12976 [DOI] [PMC free article] [PubMed] [Google Scholar]
- Miller CA, Hwang SJ, Cotter MM, Vorperian HK. 2020. “Developmental morphology of the cervical vertebrae and the emergence of sexual dimorphism in size and shape: A computed tomography study.” The Anatomical Record. doi: 10.1002/ar.24559 [DOI] [PMC free article] [PubMed] [Google Scholar]
- Mitani H, and Sato K. 1992. “Comparison of mandibular growth with other variables during puberty.” The Angle Orthodontist 62(3):217–222. doi: 10.1043/0003-219(1992)062<0217:COMGWO>2.0.CO;2 [DOI] [PubMed] [Google Scholar]
- Mitteroecker P, and Gunz P 2009. “Advances in Geometric Morphometrics.” Evolutionary Biology 36:235–247 (2009). doi: 10.1007/s11692-009-9055-x [DOI] [Google Scholar]
- Moss ML, and Rankow RM. 1968. “The role of the functional matrix in mandibular growth.” The Angle Orthodontist 38(2): 95–103. doi: 10.1043/0003-3219(1968)038<0095:TROTFM>2.0.CO;2 [DOI] [PubMed] [Google Scholar]
- Moss ML. 1997. “The functional matrix hypothesis revisited. 4. The epigenetic antithesis and the resolving synthesis.” American Journal of Orthodontics and Dentofacial Orthopedics 112(4): 410–417. doi: 10.1016/S0889-5406(97)70049-0 [DOI] [PubMed] [Google Scholar]
- O’Halloran RL, Lundy JK. 1987. “Age and ossification of the hyoid bone: forensic implications.” Journal of Forensic Sciences 32(6):1655–9. doi: 10.1520/JFS11223J [DOI] [PubMed] [Google Scholar]
- Okasi A, Sadeghian MH, Behnoush B, Shakori Rad A. 2018. “Sex Identification by Morphometric Study of Hyoid Bone.” International Journal of Medical Toxicology and Forensic Medicine 8(4):145–150. doi: 10.22037/ijmtfm.v8i4(Autumn).23034 [DOI] [Google Scholar]
- Orsbon CP, Gidmark NJ, Ross CF. 2018. “Dynamic Musculoskeletal Functional Morphology: Integrating diceCT and XROMM” The Anatomical Record 301:378–406. doi: 10.1002/ar.23714 [DOI] [PMC free article] [PubMed] [Google Scholar]
- Phoenix A, Valiathan M, Nelson S, Strohl KP, Hans M. 2011. “Changes in hyoid bone position following rapid maxillary expansion in adolescents.” Angle Orthodontist 81(4):632–8. doi: 10.2319/060710-313.1 [DOI] [PMC free article] [PubMed] [Google Scholar]
- Price J, and Kent R. 2008. “Increasing Speech Intelligibility in Down Syndrome and Fragile X Syndrome.” In Speech and language development and intervention in Down syndrome and fragile X syndrome (Ed.), (pp. 219–231): Paul H. Brookes Publishing Co., Inc. [Google Scholar]
- Rodriguez-Vazques JF, Kim JH, Verdugo-Lopez S, Murakami G, Cho KH, Asakawa S, Abe SI. 2011. “Human fetal hyoid body origin revisited.” Journal of Anatomy 219(2):143–9. doi: 10.1111/j.1469-7580.2011.01387.x [DOI] [PMC free article] [PubMed] [Google Scholar]
- Sadler TW. “Third to eight weeks: The embryonic period.” Langman’s Medical Embryology, 10th edn. Sadler TW, ed. Lippincott Williams & Wilkins, Philadelphia: (2006): 67–87. [Google Scholar]
- Sameera SS, Rao KEV. 2019. “Morphometric analysis and sexual dimorphism of hyoid bone in Telegana population.” International Journal of Anatomy and Research 7(4.1):7038–7041. doi: 10.16965/ijar.2019.298 [DOI] [Google Scholar]
- Scammon Richard E. “The measurement of body in childhood.” The measurement of man (1930). [Google Scholar]
- Sheng CM, Lin LH, Su Y, and Tsai HH. 2009. “Developmental changes in pharyngeal airway depth and hyoid bone position from childhood to young adulthood.” Angle Orthodontist 79(3): 484–490. doi: 10.2319/062308-328.1 [DOI] [PubMed] [Google Scholar]
- Soerdjbalie-Maikoe V, van Rijn RR. 2008. “Embryology, normal anatomy, and imaging techniques of the hyoid and larynx with respect to forensic purposes: a review article.” Forensic Science and Medical Pathology 4(2):132–9. doi: 10.1007/s12024-008-9032-1. [DOI] [PubMed] [Google Scholar]
- Standerwick RG, and Roberts WE. 2009. “The aponeurotic tension model of craniofacial growth in man.” The open dentistry journal 3:100. doi: 10.2174/1874210600903010100. [DOI] [PMC free article] [PubMed] [Google Scholar]
- Tanner JM (1962). Growth at Adolescence, 2nd ed. Blackwell Scientific, Oxford. [Google Scholar]
- Urbanova P, Hejna P, Zatopkova L, Safr M. 2013. “The morphology of human hyoid bone in relation to sex, age and body proportions.” HOMO-Journal of Comparative Human Biology 64(3):190–204. doi: 10.1016/j.jchb.2013.03.005 [DOI] [PubMed] [Google Scholar]
- Vieira BB, Itikawa CE, de Aleida LA, Sander HH, Aragon DC, Anselmo-Lima WT, Matsumoto M, Valera FCP. 2014. “Facial features and hyoid bone position in preschool children with obstructive sleep apnea syndrome.” European Archives of OtoRhino-Laryngology 271(5):1305–1309. doi: 10.1007/s00405-013-2770-z [DOI] [PubMed] [Google Scholar]
- Vohra P, Kulkarni P. 2017. “Sexual dimorphism of human hyoid bone.” International Journal of Anatomy and Research 5(1):3607–3610. doi: 10.16965/ijar.2017.118 [DOI] [Google Scholar]
- Vorperian HK, Wang S, Chung MK, Schimek EM, Durtschi RB, Kent RD, Ziegert AJ, Gentry LR. 2009. “Anatomic development of the oral and pharyngeal portions of the vocal tract: an imaging study.” Journal of the Acoustical Society of America 125(3):1666–1678. doi: 10.1121/1.3075589 [DOI] [PMC free article] [PubMed] [Google Scholar]
- Wang Y, Chung MK, Vorperian HK. 2013. “Composite growth model applied to human oral and pharyngeal structures and identifying the contribution of growth types.” Statistical methods in medical research 25(5):1975–1990. doi: 10.1177/0962280213508849 [DOI] [PMC free article] [PubMed] [Google Scholar]
- Whyms BJ, Vorperian HK, Gentry LR, Schimek EM, Bersu ET, Chung MK. 2013. “The effect of computed tomographic scanner parameters and 3-dimensional volume rendering techniques on the accuracy of linear, angular, and volumetric measurements of the mandible.” Oral surgery, oral medicine, oral pathology and oral radiology 115(5):682–691. doi: 10.1016/j.oooo.2013.02.008 [DOI] [PMC free article] [PubMed] [Google Scholar]
- Wilson EM, Green JR. 2009. “The development of jaw motion for mastication.” Early human development 85(5):303–311. doi: 10.1016/j.earlhumdev.2008.12.003 [DOI] [PMC free article] [PubMed] [Google Scholar]
Associated Data
This section collects any data citations, data availability statements, or supplementary materials included in this article.
Supplementary Materials
Supplemental Table. Allocation of the 97 scans from the 49 typically developing individuals into the four age-cohorts, as defined in text, with the 16 individuals with repeat scans denoted in gray highlight. For each age-cohort, the individual subject identification number is followed by sex and chronological age in months at time of imaging.