Abstract
In multimodal radiologic imaging, contrast-enhanced ultrasound (CEUS) is increasingly used. One of the advantages of CEUS is the possibility of repeated application of contrast media without decreasing renal function or affecting the thyroid gland. Small solid liver lesions can be diagnosed and detected with high accuracy. Moreover, solid lesions in other abdominal organs can also be characterized. Frequent applications for solid lesions in the near field concern thyroid tumors and lymph nodes. For prostate diagnostics, CEUS can be used with an endorectal probe and perfusion imaging. This review explains how the additional (semi-)quantitative perfusion analysis, especially time–intensity curve (TIC) analyses, and wash-in/wash-out kinetics of integrated or external perfusion software programs facilitate new options in dynamic assessment of microvascularization during tumor follow-up care and even minimally invasive tumor therapy.
Keywords: Ultrasonography, Diagnostics, Quantification software (VueBox), Microvascularization, Tumor detection
Abstract
Kontrastmittelultraschall (CEUS) und auch die Perfusionsdiagnostik finden in der multimodalen radiologischen Diagnostik immer mehr Verbreitung und Anwendungsgebiete. Einer der Vorteile ist die wiederholte Applikation von (intravasalem) Kontrastmittel ohne Beeinträchtigung der Nierenfunktion oder der Schilddrüse. Bereits kleinste solide Leberläsionen lassen sich mit hoher diagnostischer Sicherheit detektieren und charakterisieren. Es können aber auch solide Läsionen anderer abdominaler Organe beurteilt werden. Häufige Anwendungen bezüglich solider Läsionen im Nahfeldbereich sind Schilddrüsentumoren und Lymphknoten. Bei der Prostatadiagnostik kommt CEUS mit endoluminalen Sonden und Perfusionsauswertung zum Einsatz. In der vorliegenden Übersichtsarbeit wird erläutert, wie mit ergänzender (semi)quantitativer Perfusionsauswertung, insbesondere Wash-in- und Wash-out-Kinetik oder Time-Intensity-Curve(TIC)-Analysen, durch parametrische geräteinterne und externe Perfusionssoftware neue Optionen einer dynamischen Mikrovaskularisationsbeurteilung eröffnet werden, insbesondere beim Therapiemonitoring oder auch bei der Durchführung gezielter Interventionen zur Tumortherapie.
Schlüsselwörter: Sonographie, Diagnostik, Software zur Quantifizierung (VueBox), Mikrovaskularisation, Tumordetektion
Contrast-enhanced ultrasound (CEUS) enables a high spatial and temporal resolution as well as a dynamic assessment of macro- and microvascularization down to the capillaries. First-generation contrast agents, such as Levovist® (Bayer Vital, Germany), are no longer used for abdominal organs. The contrast media in current use are sulfur hexafluoride microbubbles (SonoVue®, Bracco, Italy) with a diameter of 2–10 µm. When enhanced with ultrasound, the oscillation enables an amplification of the echo signal.
Mostly bolus injections of 1.0–2.4 ml are used via a cubital vein and are typically followed by a flush of 10 ml sodium chloride. The bubbles remain strictly intravascular unlike gadolinium-chelates used as vascular contrast agent in magnetic resonance imaging (MRI) or iodinated contrast media in computed tomography (CT). The second-generation echo-signal enhancers are used with low mechanical index (MI < 0.2) and reduced transmission power [1, 2].
Contrast-enhanced ultrasound enables a dynamic evaluation of microvascularization in solid lesions from the early arterial phase (10–15 s), the arterial phase (15–45 s), the portal venous or parenchymatous phase (45–70 s), and the venous phase up to 120 s after the injection. For evaluation of the late phase, the microbubbles can be observed up to 5 min after the injection. Even though some lesions might show a specific CEUS pattern, e.g., a spoke wheel pattern, it might sometimes be crucial for the detection and characterization of solid lesions to evaluate the wash-in and wash-out kinetics [3, 4].
Mostly benign lesions tend to show a more regular perfusion pattern, whereas malignant lesions typically have a more chaotic pattern. With CEUS perfusion, a quantification of these wash-in patterns can be achieved using digitally stored cine loops. These cine loops are stored continuously for 1 min after bolus injection of the contrast media. Parameters such as time to peak (TTP) and area under the curve (AUC) can be calculated and time–intensity curve analyses (TIC) can be drawn. Perfusion quantification is mostly performed by integrated software by the manufacturer on high-end ultrasound machines. The results of the integrated software can then be digitally stored in the picture archiving and communication system (PACS). Although only relative units (rU) and seconds are used and thus only a semiquantitative analysis is possible, the AUC can estimate the perfusion volume. Hyperperfused solid lesions typically show a short TTP (s) and high rU for AUC, as they are most frequently used for integrated perfusion software [1, 5].
When treating malignant solid lesions, the aim of the treatment is a significant decrease in the AUC, especially in the areas of tumor neovascularization with an increase in TTP. Additionally to AUC and TTP, integrated perfusion software is now able to calculate parameters such as mean transit time (mTT) and peak enhancement (PE). These results can then be displayed using pseudo or false colors. Using false colors, red for instance, shows fast and high contrast media enhancement, decreasing from yellow to orange down to green, blue and purple shades, which show lower perfusion, according to European Federation of Societies for Ultrasound in Medicine and Biology (EFSUMB) guidelines [1]. By using additional parameters, such as wash-in rate, rise time (RT), and wash-out rate, local perfusion changes of solid lesions can be detected [3, 6].
With external perfusion software such as VueBox® (Bracco, Italy), an integrated motion correction enables an even more detailed evaluation of microvascularization concerning wash-in and wash-out kinetics, since cine loops for up to 2 min can be evaluated and more parameters are calculated compared to integrated software. A homogeneous arterial perfusion shows benign lesions. On the other hand, an irregular fast and high hypervascularization is typical for malignant lesions. For the evaluation of wash-out kinetics, the time course as well the extent and the amount of the wash-out are important for determining whether it is a benign or malignant lesion. The main criteria for malignant liver lesions are, in particular, a loss of contrast enhancement/a wash-out starting in the portal venous phase increasing to the late phase. Benign lesions, on the other hand, tend not to show a wash-out until the late phase or only a very circumscribed wash-out as seen in a central scar such as in focal nodular hyperplasia (FNH).
When using CEUS perfusion the amount of wash-out kinetics can be assessed in a more detailed way. A fast wash-out, for example, is more likely to be a cholangiocellular carcinoma, whereas a hepatocellular carcinoma shows prolonged wash-out kinetics until the late phase (up to 4–5 min after the injection; [7]). For follow-up of chemotherapy, evaluation of the wash-out is also important. Directly after minimally invasive ablation therapy (microwave ablation, radiofrequency ablation, irreversible electroporation, or transarterial chemoembolization), a local hyperperfusion at the ablation margins and in the surrounding tissue can be observed that shows reactive changes and not treatment failure. In the follow-up, necrosis and an avascular scar should be visible. An early local nodular hyperenhancement together with a wash-out in the late phase shows remaining tumor or recurrence during follow-up. All these changes can be assessed with external perfusion software and parametric imaging [3].
Worldwide, the majority of all CEUS examinations are performed to assess liver lesions with recently updated guidelines [1, 4]. However, CEUS is more and more frequently applied in non-hepatic dynamic examinations [8]. For these non-hepatic indications, CEUS perfusion is applied. Regarding the evaluation of early therapy success in gastrointestinal tumors, CEUS perfusion has been successfully evaluated [4, 6, 9].
When using SonoVue® as ultrasound contrast media, in very rare cases a contrast media intolerance can be observed [10]. Adverse events were reported in 0.13% and severe adverse events in 0.04% of all cases [1, 11–13]. These sulfur hexafluoride microbubbles do not decrease kidney function even after repeated application, neither do they affect the function of the thyroid gland, which is an important advantage over other contrast media such as those applied for CT and MRI. Here, the most important applications of CEUS perfusion for detecting and characterizing lesions within solid abdominal organs will be addressed, based on the recent literature and the authors’ own clinical studies.
Equipment for CEUS
For abdominal imaging, high-resolution multifrequency convex probes from 1 to 6 MHz are most commonly used. For the near field and for many non-abdominal examinations, linear probes are used for CEUS, most frequently between 6 and 9 MHz. With the option of virtual convex scanning, the scanning field is increased in depth. Deeper penetration is possible by reducing the frequencies, even though the resolution decreases. Conversely, by adjusting the frequencies to higher frequencies the local resolution is increased; however, the depth of scanning is equally decreased. For lesions that are close to the liver surface or to the liver capsule, less than 4 cm deep, high-frequency probes (at least 10–15 MHz) can be used, especially when used intraoperatively.
Dynamic CEUS with SonoVue® requires a significant reduction of the transmission power and of the mechanical index (MI < 0.2). The imaging is performed in a shared screen mode, with B‑mode and CEUS visible at the same time. High-end ultrasound machines are required, because only then can an adequate resolution be achieved with low transmission energy in B‑mode.
Digital imaging and communication in medicine (DICOM) videos of up to 3 min long should be stored and transferred to PACS. It is recommended to store DICOM raw data on the ultrasound machines, because then all types of imaging optimization and perfusion analyses are also possible retrospectively.
Contrast media application
After obtaining written informed consent, the application of sulfur hexafluoride microbubbles (SonoVue®) should be performed if possible via a cubital vein. A large cannula should be used (18–20G). If small peripheral cannulas are employed, the microbubbles might be destroyed and a higher dose of contrast media might be necessary. Before the examination, the risk of allergic reactions, which is reported to be 1:10,000 up to 1:400,000, should be mentioned. A strong allergic disposition toward contrast media, cardiac insufficiency, and pulmonary hypertension are the most frequent risk factors for ultrasound contrast media intolerance. In some cases of severe cardiac insufficiency and pulmonary hypertension, an additional application of oxygen seems to minimize the risk of allergic reaction. The standard contrast agent dose of 2.4 ml has to be adjusted to the examination circumstances and the patient’s weight. For children the dose can be reduced to 0.5 ml. If possible, the injection should be performed with a three-way stopcock, where the contrast medium is injected through a straight arm to reduce the destruction of the bubbles. Sodium chloride is subsequently applied via a side arm, and a dose of 10 ml of saline solution is usually applied.
During the initial preparation of the contrast medium, the microbubbles are formed by shaking. Before each subsequent application, the container for contrast medium must be shaken again, to avoid sedimentation of bubbles and carrier solution before the injection. For more superficial lesions and for higher-frequency transducers (> 10 MHz), higher doses of contrast agent must be used, as this leads to increased destruction of the bubbles and a higher MI must be selected in order to stimulate the bubbles to vibrate. On the other hand, the higher doses of contrast agent dose can cause shadowing in the depth. In particular, in the case of liver lesions and an underlying hepatic steatosis, which already limits CEUS diagnosis, a higher dose of contrast agent can lead to a further deterioration in the diagnostic usability. If possible, attention should be paid to an interval-like examination scheme, also for perfusion measurements, since a continuous examination of an individual area for too long leads to excessive local bubble destruction, which in view of the late phase often does not allow for sufficient assessment. This phenomenon is most pronounced in the near field. An incorrect examination in this regard can lead to a “pseudo-washout phenomenon,” e.g., in the case of hemangiomas. Another influencing factor that can lead to an early reduction of the contrast agent in the examination area is excessive pressure on the transducer. Therefore, during breaks in the examination, care should be taken to ensure that the examiner relieves the pressure on the area to be examined. In addition, if possible, care should be taken to ensure that the transducer is in a vertical position during the CEUS, as sound beams incident at an angle to the surface of the organ increasingly scatter and accelerate the local bubble destruction.
In patients on a ventilation machine and during intraoperative CEUS examination, a bolus injection with up to 5 ml of contrast media can be applied mostly via a central venous catheter. Continuous application with a special contrast media pump is the exception. This kind of application is mostly used for perfusion kinetics in tumor research.
Furthermore, there is also the possibility of a “destruction burst,” when all the bubbles in the field that has just been exposed to the ultrasound waves are destroyed by a high-energy impulse. Thus, there is the possibility of renewed observation of contrast media wash-in.
Hepatocellular carcinoma
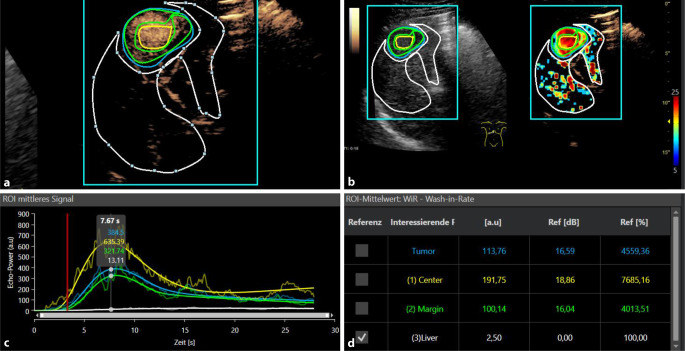
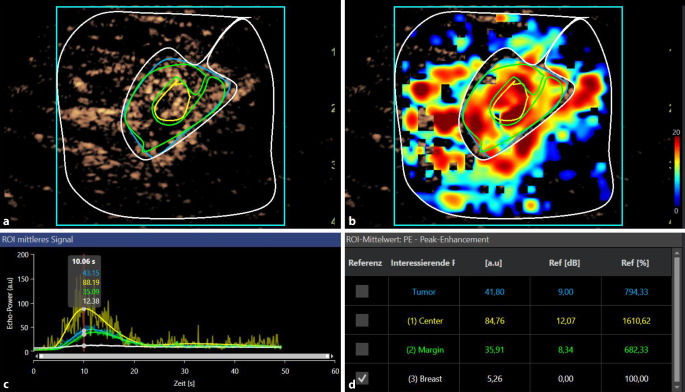
Contrast-enhanced ultrasound perfusion allows for a continuous local dynamic assessment of wash-in and wash-out kinetics using continuously stored cine loops for a duration of 3 min. Typically, hepatocellular carcinoma (HCC) lesions of more than 1.5 cm in diameter show an early and high irregular hypervascularization in the center with low values for TTP and high values for AUC as well as for peak enhancement (Fig. 1). For small lesions with a diameter of maximum 10 mm, the wash-out might be incomplete or even non-existent. For lesions less than 3 cm, there is a partial hypoperfused necrosis in the center. Poorly differentiated HCC lesions less than 1.5 cm might even show a late wash-out after 4 min. Hence, the CEUS LI-RADS (Liver Imaging Reporting and Data System) classification was established. This classification was adjusted to MRI and CT as reference imaging [7].
Fig. 1.
Contrast-enhanced ultrasound perfusion imaging with VueBox® (Bracco, Italy) of a small histopathologically proven hepatocellular carcinoma. a Irregular arterial hypervascularization in the tumor center and at the tumor margin with wash-out beginning in the portal venous phase. b False colors for parametric imaging: red and yellow for the tumor hyperenhancement. c Evaluation of the wash-in rate. d Numeric values of the TIC analysis (c), VueBox® Screenshot with permission of Bracco Imaging, Italy
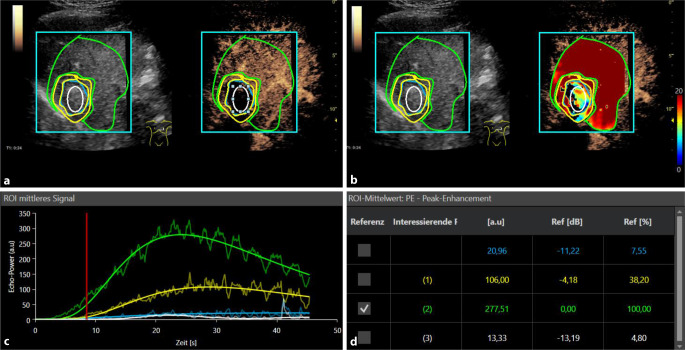
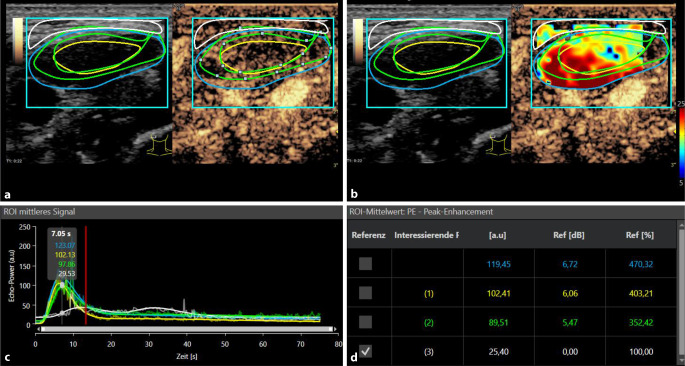
In comparison with a cholangiocellular carcinoma, HCCs often show a delayed wash-out kinetic with different values for mTT and RT. After a successful resection, an avascular scar should be observed. Also for the follow-up after ablation therapy, with microwave ablation (Fig. 2), radiofrequency ablation, or irreversible electroporation, there should be a complete avascular defect. After percutaneous embolization treatments such as TACE (transarterial chemoembolization), there should be a clear devascularization visible with a decrease in AUC and peak enhancement.
Fig. 2.
Contrast-enhanced ultrasound perfusion imaging after microwave ablation therapy (MWA) of a small histopathologically proven hepatocellular carcinoma. a No arterial hypervascularization in the ablation area is visible after the treatment. Dynamic curve analysis up to 60 s and perfusion analysis using VueBox®,(Bracco, Italy). b False colors for parametric imaging showing yellow and blue shades for the ablation area as a sign of a central devascularization. c Evaluation of the peak enhancement with highest level (green) for the surrounding healthy liver tissue in time–intensity curve analysis. d Numeric values of the TIC analysis (c), VueBox® Screenshot with permission of Bracco Imaging, Italy
It is important to keep in mind that the differentiation of regenerative or dysplastic nodules or early stages of HCC in small hypervascularized lesions with a diameter of a maximum of 10 mm might be difficult or even impossible to safely detect when using SonoVue®, because this is a strictly intravascular contrast medium. Even though these contrast media have not yet been approved, in vivo tumor-specific contrast media like BR 55® or even liver-specific ultrasound contrast media (analogously to MRI) are in trials [3, 7, 14–16].
Liver metastases
For the most frequent intrahepatic metastasis of colorectal carcinoma, CEUS is superior to normal B‑mode ultrasound, when it comes to the detection and characterization of especially small solid nodules (less than 10 mm). Typically, there is an early arterial hypervascularization at the margins and a wash-out starting from the portal venous phase. This enhancement pattern can also be seen in metastasis of breast cancer, thyroid cancer, and kidney cancer. Neuroendocrine tumors show an irregular arterial hypervascularization; however, they do not necessarily have to show a wash-out, especially if there are only small metastases. Intraoperatively, CEUS with linear probes is ideal for solid tumors, which in daily routine are often diagnosed with contrast-enhanced CT or MRI. The TIC analysis shows a wash-out after arterial enhancement for metastases. During chemotherapy the AUC should be reduced, while TTP is normalized again. External perfusion software can additionally calculate wash-in and wash-out kinetics. This is how a diagnostic accuracy of 98% can be achieved under ideal conditions.
With CEUS perfusion, safe monitoring after operative and interventional treatment of metastasis is possible. The aim of every treatment is devascularization or wherever possible a complete resection. During systemic chemotherapy and after a local application of chemotherapy, there should be a significant reduction in AUC and peak enhancement. However, changes in MTT, RT, and TTP can be seen with a prolonged wash-in kinetics [9].
Benign liver lesions
The most frequent benign solid liver lesions are hemangiomas, FNH, and adenomas. The most important characteristic for benign lesions is a regular enhancement from the arterial phase, which can be observed as nodular enhancement in hemangioma, a wheel-like pattern from the center to the margins in FNH and a regular enhancement from the margins to the center in adenomas. This enhancement pattern can be assessed when using parametric imaging. Of note, benign lesions tend not to show a wash-out. However, in cases of FNH, a hypo-enhancing central scar might be visible.
The diagnosis of atypical or partially necrotic adenoma might be more difficult. Firstly, there is an incomplete arterial enhancement and an additional partial wash-out. Even with CEUS perfusion, it might be difficult to differentiate between a malignant lesion and an adenoma. More studies need to be conducted, especially concerning non-strictly intravascular or tumor-specific ultrasound contrast media. Especially if the reference imaging with CT or MRI does not show typical features of a benign lesion, a histologic specimen collection might be necessary. This might be conducted with the help of (CE-) US guidance [17].
Kidney lesions
For the characterization of complicated cystic kidney lesions (Bosniak IIF and III) CEUS as an additional imaging method for CT or MRI is increasingly used [18].
According to recent clinical evaluations [19], the high resolution of details allows for the early recognition of complicated cystic lesions or small papillomas. Malignant kidney lesions are mostly characterized by irregular hypervascularization. However, it is important to mention that not all malignant lesions show a portal-venous wash-out in the late phase after 3–5 min, especially in small lesions. In angiomyolipomas there is a partial early enhancement.
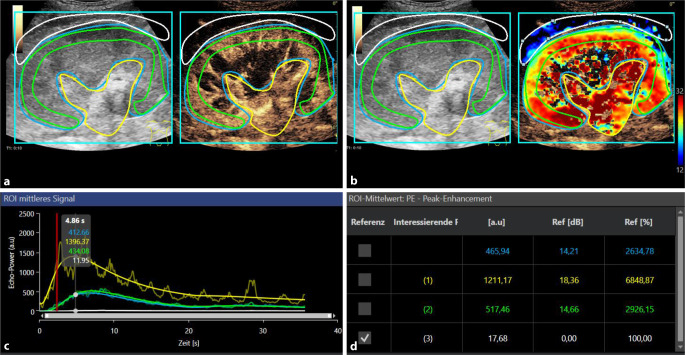
This early enhancement can be displayed with parametric imaging, TIC analysis, or external perfusion software. Hypoperfusion and infarcts in the original kidneys, as well as a rejection reaction after kidney transplantation, can be displayed and quantified with CEUS perfusion ([19–22]; Fig. 3).
Fig. 3.
Contrast-enhanced ultrasound perfusion imaging of a kidney. a Early arterial hypervascularization at the center with wash-out beginning in the venous phase. b Evaluation of the peak enhancement with lower levels at the kidney cortex in a case of reduced peripheral microvascularization (green/blue). c Dynamic curve analysis up to 60 s. d Numeric values of the TIC analysis (c), VueBox® Screenshot with permission of Bracco Imaging, Italy
Prostate carcinoma
For diagnostics of prostate lesions, endoluminal and special three-dimensional (3D) CEUS multifrequency probes are used with frequencies of between 1 and 8 MHz. For the diagnosis of prostate cancer, CEUS perfusion can help to identify especially aggressive tumors and allow for a focused biopsy or even a fusion biopsy with MRI to guarantee a greater success rate [23]. Typical for aggressive tumors is a fast irregular hyperenhancement with a partial wash-out. This is how malignant tumors that are rapidly enhancing show red and yellow colors at the margins in parametric imaging with internal or external software evaluation with false colors in comparison to the surrounding healthy tissue. It might be more challenging to detect tumors in the apical and dorsal areas, which may require a 3D technique or also endoluminal probes. Clearly, CEUS perfusion allows for better monitoring after radiologic interventional treatment of prostate cancer, for example, irreversible electroporation [24, 25]. Contrast-enhanced ultrasound perfusion can help to detect reactive changes like prostatitis. This is when a prolonged contrast media enhancement without early wash-out can be seen. For differentiation between prostate cancer and prostatitis or benign lesions such as adenomas, the calculation of TTP, AUC, RT, and mTT are helpful. Prostatitis tends to show a more spacious and prolonged hyperenhancement, but with a prolonged wash-out. On the other hand, aggressive prostate cancer lesions show a rapid nodular enhancement and wash-out in the venous phase ([25–27]; Fig. 4).
Fig. 4.
a Fusion contrast-enhanced ultrasound with magnetic resonance imaging (left) and perfusion imaging (CEUS, right) of a small histopathologically proven prostate cancer. Irregular arterial hypervascularization at the tumor margin with wash-out beginning in the venous phase. b Dynamic curve analysis up to 60 s. False colors for parametric imaging, red and yellow for the tumor hyperenhancement. Evaluation of the peak enhancement with highest level (green) on the peripheral part (green circle)
Thyroid lesions
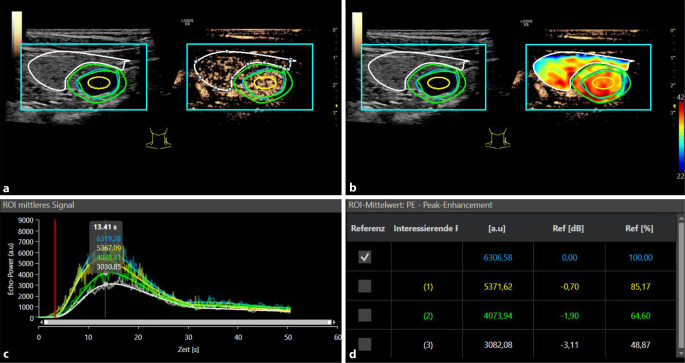
For CEUS diagnostics, ideally multifrequency linear probes should be used with frequencies between 6 and 9 MHz. The TI-RADS (Thyroid Imaging Reporting and Data System) classification contains B‑mode criteria and the detection of macro-vascularization with Color-coded duplex sonography (CCDS) for classification of benign and malignant lesions of the thyroid, as well as the assessment of the necessity of histological specimen collection. In TI-RADS III lesions, CEUS is used to differentiate whether it is an early-stage malignant tumor [2]. In adenomas, there is a hypervascularization at the margins and the typical wash-out in late phase is missing. By contrast, in thyroid carcinoma there is a reduced or irregular vascularization with a typical wash-out. Contrast-enhanced ultrasound perfusion with the evaluation of TTP, AUC, peak enhancement, mTT, and RT can better differentiate between benign and malignant lesions, when comparing the center with the margins and the surrounding tissue (Fig. 5). This allows for a focused ultrasound-guided biopsy [28–30].
Fig. 5.
a Contrast-enhanced ultrasound perfusion imaging of a small histopathologically proven thyroid adenoma. b Irregular early arterial hypervascularization at the tumor margin with wash-out beginning in the venous phase. c Evaluation of the peak enhancement with higher levels at the margin in comparison with the surrounding tissue. d Numeric values of the TIC analysis (c), VueBox® Screenshot with permission of Bracco Imaging, Italy
Breast lesions
Fundamental B‑mode ultrasound is the primary diagnostic tool as part of multimodal imaging for diagnosis of breast cancer. Ultrasound can be helpful for assessment of focal BI-RADS (Breast Imaging Reporting and Data System) III lesions during screening with mammography as the primary imaging method. During the imaging process of familial breast cancer with MRI as primary imaging method, ultrasound can help in the assessment of lesions and for ultrasound-guided biopsy. Moreover, CEUS is an additional tool that can be used as an supplementary assessment method [2]. With CEUS and perfusion, initial studies have reported successful monitoring of neoadjuvant therapy and improved diagnostics of small tumors with partial neovascularization, for example, in ductal carcinoma in situs. When using peak enhancement and AUC, irregular dynamic microvascularization can be observed in the margins of the breast cancer and can be displayed when using parametric imaging (Fig. 6). The first experimental studies have dealt with the application of tumor-specific ultrasound contrast media in combination with CEUS perfusion for improved diagnosis in early stages of breast cancer and multifocal suspicious lesions [31–33].
Fig. 6.
a Contrast-enhanced ultrasound perfusion imaging of a small histopathologically proven breast cancer. b Irregular early arterial hypervascularization in the tumor margin with wash-out beginning in the late phase. c Evaluation of the peak enhancement with highest level (yellow) in the tumor center (bottom left). d Numeric values of the TIC analysis (c), VueBox® Screenshot with permission of Bracco Imaging, Italy
Lymph node diagnostics
In the abdomen, multifrequency convex probes from 1 to 6 MHz are used for lymph node diagnostics. For peripheral lymph nodes, multifrequency linear probes up to 20 MHz are used. The primary detection and characterization of the lymph nodes is performed by high-resolution B‑mode sonography. However, CEUS with perfusion is use with increasing frequency for preselected indications [1]. There are, for example, possibilities for focused therapy monitoring in lymphoma or metastasis of a malignant melanoma. The aim is the reduction of irregular tumor microvascularization, especially at the margins of the lymph node metastasis. Furthermore, there are trials for the improved detection of the sentinel lymph node in breast cancer with CEUS or of cervical lymph node metastasis preoperatively in ear–nose–throat tumors. According to initial results, typical for malignant lymph nodes is a fast wash-in with short TTP and early wash-out with the corresponding values for RT and mTT. This might be seen in the sentinel lymph nodes in breast cancer ([34]; Fig. 7).
Fig. 7.
a Contrast-enhanced ultrasound perfusion imaging of a small histopathologically proven lymph node metastasis. b Irregular early arterial hypervascularization at the tumor margin with wash-out beginning in the late phase. c Evaluation of the peak enhancement with significantly higher levels (yellow and green curve) in comparison with the surrounding tissue (white curve) in time–intensity curve analysis (bottom left). d Screenshot with permission of VueBox (Bracco, Italy)
Contrast-enhanced ultrasound perfusion adds excellent value to a regular B‑mode and CEUS examination for evaluation of solid organs. Even during the Covid-19 pandemic, CEUS offers an excellent possibility of monitoring critically ill patients at the bedside [35].
Practical conclusion
Contrast-enhanced ultrasound (CEUS) with perfusion analysis extends diagnostic possibilities especially for the monitoring of tumor therapy.
Integrated or external perfusion software enable the assessment of dynamic microvascularization with calculation of Time to Peak, Area Under the Curve, Peak Enhancement, Mean Transit Time, and Rise Time.
For the subtle analysis, digitally stored cine loops and special equipment are needed. A variety of new indications are possible; however, standardization of perfusion analysis is still needed.
The main indications for CEUS are the evaluation of malignant liver lesions, focused preoperative assessment, and minimally invasive ablation therapy.
Declarations
Conflict of interest
E.-M. Jung, M.-A. Weber and I. Wiesinger declare that they have no competing interests.
For this article no studies with human participants or animals were performed by any of the authors. All studies performed were in accordance with the ethical standards indicated in each case.
The supplement containing this article is not sponsored by industry.
Footnotes

Scan QR code & read article online
References
- 1.Dietrich CF, Nolsøe CP, Barr RG, et al. Guidelines and good clinical practice recommendations for contrast-enhanced ultrasound (CEUS) in the liver-update 2020 WFUMB in cooperation with EFSUMB, AFSUMB, AIUM, and FLAUS. Ultrasound Med Biol. 2020;46:2579–2604. doi: 10.1016/j.ultrasmedbio.2020.04.030. [DOI] [PubMed] [Google Scholar]
- 2.Sidhu PS, Cantisani V, Dietrich CF, et al. The EFSUMB guidelines and recommendations for the clinical practice of contrast-enhanced ultrasound (CEUS) in non-hepatic applications: update 2017 (long version) Ultraschall Med. 2018;39:e2–e44. doi: 10.1055/a-0586-1107. [DOI] [PubMed] [Google Scholar]
- 3.Wiesinger I, Wiggermann P, Zausig N, et al. Percutaneous treatment of malignant liver lesions: evaluation of success using contrast—enhanced ultrasound (CEUS) and perfusion software. Ultraschall Med. 2018;39:440–447. doi: 10.1055/s-0043-119353. [DOI] [PubMed] [Google Scholar]
- 4.Dietrich CF, Averkiou MA, Correas JM, et al. An EFSUMB introduction into dynamic contrast-enhanced ultrasound (DCE-US) for quantification of tumour perfusion. Ultraschall Med. 2012;33:344–351. doi: 10.1055/s-0032-1313026. [DOI] [PubMed] [Google Scholar]
- 5.Săftoiu A, Gilja OH, Sidhu PS, et al. The EFSUMB guidelines and recommendations for the clinical practice of elastography in non-hepatic applications: update 2018. Ultraschall Med. 2019;40:425–453. doi: 10.1055/a-0838-9937. [DOI] [PubMed] [Google Scholar]
- 6.Wiesinger I, Jung F, Jung EM. Contrast-enhanced ultrasound (CEUS) and perfusion imaging using VueBox. Clin Hemorheol Microcirc. 2021 doi: 10.3233/ch-201040. [DOI] [PubMed] [Google Scholar]
- 7.Schellhaas B, Bernatik T, Bohle W, et al. Contrast-enhanced ultrasound algorithms (CEUS-LIRADS/ESCULAP) for the noninvasive diagnosis of hepatocellular carcinoma—a prospective multicenter DEGUM study. Ultraschall Med. 2020 doi: 10.1055/a-1198-4874. [DOI] [PubMed] [Google Scholar]
- 8.Sidhu PS, Cantisani V, Dietrich CF, et al. The EFSUMB guidelines and recommendations for the clinical practice of contrast-enhanced ultrasound (CEUS) in non-hepatic applications: update 2017 (short version) Ultraschall Med. 2018;39:154–180. doi: 10.1055/s-0044-101254. [DOI] [PubMed] [Google Scholar]
- 9.Lassau N, Chebil M, Chami L, et al. Dynamic contrast-enhanced ultrasonography (DCE-US): a new tool for the early evaluation of antiangiogenic treatment. Target Oncol. 2010;5:53–58. doi: 10.1007/s11523-010-0136-7. [DOI] [PubMed] [Google Scholar]
- 10.Piscaglia F, Bolondi L. The safety of sonovue in abdominal applications: retrospective analysis of 23188 investigations. Ultrasound Med Biol. 2006;32:1369–1375. doi: 10.1016/j.ultrasmedbio.2006.05.031. [DOI] [PubMed] [Google Scholar]
- 11.Fischer C, Kunz P, Strauch M, et al. Safety profile of musculoskeletal contrast-enhanced ultrasound with sulfur hexafluoride contrast agent. Ther Clin Risk Manag. 2020;16:269–280. doi: 10.2147/TCRM.S235235. [DOI] [PMC free article] [PubMed] [Google Scholar]
- 12.Wilson SR, Burns PN. Microbubble-enhanced US in body imaging: what role? Radiology. 2010;257:24–39. doi: 10.1148/radiol.10091210. [DOI] [PubMed] [Google Scholar]
- 13.Dietrich CF, Averkiou M, Nielsen MB, et al. How to perform contrast-enhanced ultrasound (CEUS) Ultrasound Int Open. 2018;4:E2–e15. doi: 10.1055/s-0043-123931. [DOI] [PMC free article] [PubMed] [Google Scholar]
- 14.Bitterer F, Hornung M, Platz Batista da Silva N, et al. In vivo detection of breast cancer liver metastases in humanized tumour mice using tumour specific contrast agent BR55. Clin Hemorheol Microcirc. 2020;76:559–572. doi: 10.3233/CH-200898. [DOI] [PubMed] [Google Scholar]
- 15.Schwarze V, Marschner C, Völckers W, et al. Diagnostic value of contrast-enhanced ultrasound versus computed tomography for hepatocellular carcinoma: a retrospective, single-center evaluation of 234 patients. J Int Med Res. 2020;48:300060520930151. doi: 10.1177/0300060520930151. [DOI] [PMC free article] [PubMed] [Google Scholar]
- 16.Wiesinger I, Beyer LP, Zausig N, et al. Evaluation of integrated color-coded perfusion analysis for contrast-enhanced ultrasound (CEUS) after percutaneous interventions for malignant liver lesions: first results. Clin Hemorheol Microcirc. 2018;69:59–67. doi: 10.3233/CH-189131. [DOI] [PubMed] [Google Scholar]
- 17.Müller-Peltzer K, Rübenthaler J, Negrao de Figueiredo G, et al. CEUS-diagnosis of benign liver lesions. Radiologe. 2018;58:521–527. doi: 10.1007/s00117-018-0390-8. [DOI] [PubMed] [Google Scholar]
- 18.Rübenthaler J, Mueller-Peltzer K, Negrão de Figueiredo G, et al. CEUS-diagnostic workup of cystic renal lesions. Radiologe. 2018;58:545–552. doi: 10.1007/s00117-018-0394-4. [DOI] [PubMed] [Google Scholar]
- 19.Cantisani V, Bertolotto M, Clevert DA, et al. EFSUMB 2020 proposal for a contrast-enhanced ultrasound-adapted Bosniak cyst categorization—position statement. Ultraschall Med. 2020 doi: 10.1055/a-1300-1727. [DOI] [PubMed] [Google Scholar]
- 20.Lerchbaumer MH, Putz FJ, Rübenthaler J, et al. Contrast-enhanced ultrasound (CEUS) of cystic renal lesions in comparison to CT and MRI in a multicenter setting. Clin Hemorheol Microcirc. 2020;75:419–429. doi: 10.3233/CH-190764. [DOI] [PubMed] [Google Scholar]
- 21.Müller-Peltzer K, Negrão de Figueiredo G, Schwarze V, et al. Reliable diagnosis of cystic renal lesions. Radiologe. 2018;58:887–893. doi: 10.1007/s00117-018-0444-y. [DOI] [PubMed] [Google Scholar]
- 22.Geyer T, Schwarze V, Marschner C, et al. Diagnostic performance of contrast-enhanced ultrasound (CEUS) in the evaluation of solid renal masses. Medicina (Kaunas) 2020;56(11):624. doi: 10.3390/medicina56110624. [DOI] [PMC free article] [PubMed] [Google Scholar]
- 23.Maxeiner A, Fischer T, Stephan C, et al. Use of TDI during MRI/US fusion-guided biopsy for suspected prostate cancer. Clin Hemorheol Microcirc. 2021 doi: 10.3233/ch-201035. [DOI] [PubMed] [Google Scholar]
- 24.Niessen C, Jung EM, Beyer L, et al. Percutaneous irreversible electroporation (IRE) of prostate cancer: contrast-enhanced ultrasound (CEUS) findings. Clin Hemorheol Microcirc. 2015;61:135–141. doi: 10.3233/CH-151985. [DOI] [PubMed] [Google Scholar]
- 25.Jung EM, Engel M, Wiggermann P, et al. Contrast enhanced ultrasound (CEUS) with parametric imaging after irreversible electroporation (IRE) of the prostate to assess the success of prostate cancer treatment. Clin Hemorheol Microcirc. 2020 doi: 10.3233/ch-201000. [DOI] [PubMed] [Google Scholar]
- 26.Jung EM, Wertheimer T, Putz FJ, et al. Contrast enhanced ultrasound (CEUS) with parametric imaging and time intensity curve analysis (TIC) for evaluation of the success of prostate arterial embolization (PAE) in cases of prostate hyperplasia. Clin Hemorheol Microcirc. 2020;76:143–153. doi: 10.3233/CH-209202. [DOI] [PubMed] [Google Scholar]
- 27.Schlenker B, Clevert DA, Salomon G. Sonographic imaging of the prostate. Urologe A. 2014;53:1052–1060. doi: 10.1007/s00120-014-3533-1. [DOI] [PubMed] [Google Scholar]
- 28.Zhang J, Zhang X, Meng Y, et al. Contrast-enhanced ultrasound for the differential diagnosis of thyroid nodules: an updated meta-analysis with comprehensive heterogeneity analysis. PLoS ONE. 2020;15:e0231775. doi: 10.1371/journal.pone.0231775. [DOI] [PMC free article] [PubMed] [Google Scholar]
- 29.Xu Y, Qi X, Zhao X, et al. Clinical diagnostic value of contrast-enhanced ultrasound and TI-RADS classification for benign and malignant thyroid tumors: one comparative cohort study. Medicine. 2019;98:e14051. doi: 10.1097/MD.0000000000014051. [DOI] [PMC free article] [PubMed] [Google Scholar]
- 30.Wiesinger I, Kroiss E, Zausig N, et al. Analysis of arterial dynamic micro-vascularization with contrast-enhanced ultrasound (CEUS) in thyroid lesions using external perfusion software: first results. Clin Hemorheol Microcirc. 2016;64:747–755. doi: 10.3233/CH-168044. [DOI] [PubMed] [Google Scholar]
- 31.Balleyguier C, Opolon P, Mathieu MC, et al. New potential and applications of contrast-enhanced ultrasound of the breast: own investigations and review of the literature. Eur J Radiol. 2009;69:14–23. doi: 10.1016/j.ejrad.2008.07.037. [DOI] [PubMed] [Google Scholar]
- 32.Du YR, Wu Y, Chen M, et al. Application of contrast-enhanced ultrasound in the diagnosis of small breast lesions. Clin Hemorheol Microcirc. 2018;70:291–300. doi: 10.3233/CH-170368. [DOI] [PubMed] [Google Scholar]
- 33.Lee SC, Tchelepi H, Grant E, et al. Contrast-enhanced ultrasound imaging of breast masses: adjunct tool to decrease the number of false-positive biopsy results. J Ultrasound Med. 2019;38:2259–2273. doi: 10.1002/jum.14917. [DOI] [PMC free article] [PubMed] [Google Scholar]
- 34.Mori N, Mugikura S, Miyashita M, et al. Perfusion contrast-enhanced ultrasound to predict early lymph-node metastasis in breast cancer. Jpn J Radiol. 2019;37:145–153. doi: 10.1007/s11604-018-0792-6. [DOI] [PubMed] [Google Scholar]
- 35.Jung EM, Stroszczynski C, Jung F. Contrast enhanced ultrasonography (CEUS) to detect abdominal microcirculatory disorders in severe cases of COVID-19 infection: first experience. Clin Hemorheol Microcirc. 2020;74:353–361. doi: 10.3233/CH-209003. [DOI] [PMC free article] [PubMed] [Google Scholar]


