

Abstract
Objective
Results from previous studies on the dose-dependent effect of adhering to multiple lifestyle factors on all-cause mortality in patients with chronic kidney disease (CKD) are inconsistent, despite the reported dose-dependent effect in the general population. This study aimed to examine whether CKD modifies the dose-dependent effect of adhering to multiple lifestyle factors on mortality.
Methods
This population-based prospective cohort study targeted 262,011 men and women aged 40-74 years at baseline. Of these, 18.5% had CKD, which was defined as GFR <60 mL/min/1.73 m2, ≥1+ proteinuria on urinalysis, or both. The following lifestyle behaviors were considered healthy: no smoking, body mass index <25 kg/m2, moderate or lower alcohol consumption, regular exercise, and healthy eating habits. Healthy lifestyle scores were calculated by adding the total number of lifestyle factors for which each participant was at low risk. Cox proportional hazards models were used to examine associations between healthy lifestyle scores and all-cause, cancer, and cardiovascular mortality, and whether CKD modified these associations.
Results
During a median follow-up of 4.7 years, 3,471 participants died. The risks of all-cause and cancer mortality decreased as the number of five healthy lifestyle factors that were adhered to increased, irrespective of the CKD status. The risk of cardiovascular mortality, however, was modified by CKD (interaction p=0.07), and an unhealthy lifestyle and CKD synergistically increased cardiovascular mortality.
Conclusion
A healthy lifestyle can reduce the risk of all-cause and cancer death in patients with or without CKD, while the prevention of CKD is essential for reducing the risk of cardiovascular death.
Keywords: cancer, cardiovascular, chronic kidney disease, epidemiology, survival analysis, population attributable fraction
Introduction
Adopting multiple healthy lifestyle behaviors, such as no smoking, maintaining a healthy diet, body weight, and physical activity, and limited alcohol consumption, interact synergistically and result in strong inverse associations with mortality in the general population (1). However, whether this relationship also applies to patients with chronic kidney disease (CKD) remains unclear. Only three cohort studies (2-4) have provided epidemiologic data pertaining to the dose-dependent effect of adhering to multiple healthy lifestyle factors on all-cause mortality in patients with CKD, with conflicting results. A cohort study using data from the Chronic Renal Insufficiency Cohort (CRIC) Study found a dose-dependent effect of adhering to multiple lifestyle factors on all-cause mortality (2), while a study using data from the Third National Health and Nutrition Examination Survey (NHANES III) found no additional benefit of adhering to more than one factor (3). The population-based Reasons for Geographic and Racial Differences in Stroke (REGARDS) Study found that the association between the number the American Heart Association's Life's Simple 7 factors adhered to and all-cause mortality was no longer present after adjusting for albuminuria and estimated glomerular filtration rate (eGFR) (4). These findings raise the question of whether CKD modifies the dose-dependent effect of adhering to multiple lifestyle factors on mortality.
To our knowledge, interactions between CKD and adhering to multiple lifestyle factors in the context of mortality have not yet been investigated. Three previous cohort studies (2-4) examined only CKD participants and could not analyze whether the strength of associations between the number of healthy lifestyle factors to which participants adhered and mortality differ between CKD and non-CKD participants. Moreover, since those studies (2-4) only evaluated all-cause mortality, the possibility that CKD may modify the associations for cause-specific mortality remains unaddressed. In the present large population-based prospective study, we examined whether CKD modifies the association between five previously reported lifestyle factors (5-7) [smoking, body mass index (BMI), physical activity, eating habits, and alcohol consumption] and all-cause, cancer, and cardiovascular mortality in participants with and without CKD.
Materials and Methods
Data source and study design
This study was part of an ongoing cohort study, entitled “Research on design of the comprehensive health care system for CKD based on individual risk assessment by a Specific Health Checkup for all Japanese citizens aged 40-74 years old.” The details of this cohort study and the Specific Health Checkup program have been published previously (5-10). Briefly, the Japanese government initiated a new annual health check program (Specific Health Checkup) in 2008 to support the early diagnosis of and intervention for metabolic syndrome for all insured persons and their dependents aged 40-74 years throughout Japan. Participants of the Specific Health Checkup program answer a self-administered questionnaire that covers their medical history, smoking habits, alcohol intake, exercise habits, and eating habits. Trained staff members measure the height, weight, and blood pressure of each participant. Serum and spot urine samples are collected to measure chemical data. The present study included participants who underwent the Specific Health Checkup in 2008 in seven prefectures (Fukushima, Ibaraki, Niigata, Osaka, Fukuoka, Miyazaki, and Okinawa). We followed up all participants until the date of death, the date of censoring, or the end of follow-up, whichever came first. The end of follow-up differed by study site and ranged from the end of June 2013 to the end of April 2015. Those who moved out of the study site or who changed insurance were censored.
The study was conducted according to the principles of the Declaration of Helsinki, as well as the Ethical Guidelines for Medical and Health Research Involving Human Subjects published by the Ministry of Education, Science, and Culture and the Ministry of Health, Labour, and Welfare in 2015. The study protocol was approved by the Ethics Committee of Fukushima Medical University. The need for informed consent was waived due to the use of de-identified information.
Healthy lifestyle score
Data available from the Specific Health Checkup program on smoking status, BMI, physical activity, eating habits, and alcohol intake were used to generate a healthy lifestyle score. For each of the five lifestyle factors, we created a binary low-risk variable for which participants were given a score of 1 if they met the criteria for low risk (they were given a score of 0 if this was not the case), based on previous studies (5-7,11-21). The healthy lifestyle score was calculated by adding the total number of lifestyle factors for which each participant was at low risk. Scores ranged from 0 (least healthy) to 5 (most healthy), in accordance with previous studies (5-7,11-21).
For smoking, low risk was defined as not currently smoking (5-7). The optimal body weight was defined as BMI <25 kg/m2, the standard World Health Organization cut-off for healthy weight, in agreement with previous studies (5-7,11-13). For exercise habits, two questions were posed: ‘Are you in the habit of exercising to light sweat for more than 30 minutes at a time, 2 times weekly, for over a year?’ and ‘In your daily life, do you walk or do any equivalent amount of physical activity for longer than one hour a day?’ (5-7). Those who answered ‘Yes’ to both questions were considered ‘low risk’ based on current Japanese guidelines (22). Healthy eating habits were defined as eating breakfast and not eating snacks after dinner because our dataset did not include specific nutrition or foot data. The following two questions were posed: ‘Do you skip breakfast more than 3 times per week?’ and ‘Do you eat snacks after supper more than 3 times a week?’. Those who answered ‘No’ to both questions were considered low risk (5-7). For alcohol consumption, low risk was defined as an average daily alcohol consumption <20 g (5-7).
Baseline covariates
eGFR was calculated using the eGFR formula for Japanese individuals (23). Proteinuria was defined as a dipstick urinalysis score of 1+ or greater (equivalent to ≥30 mg/dL). CKD was defined as the presence of proteinuria, GFR <60 mL/min/1.73 m2, or both at baseline (24). An absence of proteinuria with eGFR ≥60 mL/min/1.73 m2 was defined as “non-CKD.” CKD participants were further categorized as follows: stage 1-2 (eGFR ≥60 mL/min/1.73 m2 with proteinuria), G3a (eGFR 45-59), G3b (eGFR 30-44), and G4-5 (eGFR <30). Hypertension was defined as the use of antihypertensive medication, a systolic blood pressure ≥140 mmHg and/or a diastolic blood pressure ≥90 mmHg, or both. Diabetes mellitus was defined as HbA1c of 6.5% or higher, self-reported use of anti-hyperglycemic drugs, or both (25). The value for HbA1c was estimated as a National Glycohemoglobin Standardization Program equivalent value calculated with the following equation (25): HbA1c (%) = HbA1c (JDS) (%) +0.4%. Hypercholesterolemia was defined as the use of cholesterol-lowering medication, a low-density lipoprotein (LDL) cholesterol level ≥140 mg/dL, or both.
Outcome measurement
The primary outcome was time to all-cause death. Secondary outcomes included time to cancer death and cardiovascular death, since both cancer and cardiovascular disease are leading causes of death among non-dialysis dependent CKD patients (26-28). Information about the underlying cause of death was obtained using information about sex, date of birth, date of death, and place of death by linkage to a database containing death certificates for all deaths that occurred between 2008 and 2015 after obtaining permission from the Ministry of Health, Labour, and Welfare (9). The cause of death was classified using the 10th revision of the International Statistical Classification of Diseases and Related Health Problems (ICD-10). We modified the groupings using ICD-10 codes from a previous study (26) and added the group “kidney disease.” Specific codes are listed in Supplemental material 1.
Statistical analyses
To investigate the association between CKD and mortality, sex- and age-standardized mortality rate ratios (SMR) were calculated by indirect standardization, with the non-CKD group as the reference. We then examined associations between healthy lifestyle score, CKD status, and mortality using Cox proportional hazards models. The assumption of proportional hazards was checked using Schoenfeld residuals and evaluated graphically and found to be not in violation. All models were analyzed unadjusted and adjusted for potential covariates identified a priori. The initial model tested the main effect of healthy lifestyle score as a categorical variable on mortality, after adjusting for age and sex. The second, fully adjusted model added terms for CKD, hypertension, diabetes mellitus, hypercholesterolemia, history of myocardial infarction, history of stroke, and study site. Baseline healthy lifestyle scores 0, 1, and 2 were combined into one category due to the limited number of cases. We conducted subgroup analyses according to age (<65 and ≥65) and sex in the entire study population. To assess the impact of the healthy lifestyle score and CKD on mortality, we calculated population attributable risk fractions (PAF), which are estimates of the percentage of deaths that would not have occurred if all participants had been in the healthiest lifestyle group or non-CKD group, assuming that the observed associations represent causal effects.
Kaplan-Meier survival curves and log rank tests were used to compare mortality according to the healthy lifestyle score stratified by CKD status. To investigate whether CKD modified the associations observed between the healthy lifestyle score and mortality, we generated Cox proportional hazards models using the cross-product of CKD status and healthy lifestyle score categories.
Sensitivity analyses were conducted to evaluate the robustness of the results. First, we repeated the analysis using eGFR and proteinuria, instead of CKD. Second, the analyses were repeated after excluding participants with BMI<18.5 kg/m2 to set a lower limit of optimal BMI. Third, to minimize the possibility that lifestyle factors had changed in response to subclinical disease, the analyses were repeated after excluding the first two years of mortality follow-up. Fourth, results of the complete case analysis were compared to those using imputed missing data. A multiple imputation analysis was performed to fill in the missing values of the baseline covariates by creating five imputed datasets. To examine the association between each component of the healthy lifestyle score and mortality, we ran Cox proportional hazards models using each lifestyle factor as exposures. Finally, to highlight the effect of adopting multiple lifestyle factors, PAF was calculated using different combinations of healthy lifestyle factors. We ran analyses using a healthy lifestyle score comprising four factors, excluding alcohol consumption due to the possibility of opposite associations with cancer and cardiovascular mortality (29). We also used a healthy lifestyle score which comprised only lifestyle factors that were significantly associated with all-cause mortality. All reported p values were two-sided, and values <0.05 were considered statistically significant except for tests of interaction. To account for the lower power of interactions, all interactive effects were considered significant at p <0.10. All statistical analyses were performed using Stata 15 (StataCorp, College Station, USA).
Results
Participant flow and characteristics
Of the 378,791 individuals aged 40-74 years who participated in the Specific Health Checkup program in 2008, we excluded those with missing information on lifestyle factors (n=85,281), serum creatinine (n=31,419), and urinalysis (n=80), leaving 262,011 for the present analysis (Fig. 1). Of those, 246,798 participants were included for a complete case analysis (Supplemental material 2). The characteristics of excluded participants were similar to those of included participants (Supplemental material 3). Among the 262,011 included participants, 48,462 participants (18.5%) had CKD, of which the majority (70.9%) had an eGFR in the range of 45-59 mL/min/1.73 m2 (Table 1). Compared to those in the non-CKD group, participants of the CKD group were more likely to be older, be male, have a higher BMI, have hypertension, have diabetes mellitus, and have a history of stroke or heart disease. There were no substantial differences in baseline healthy lifestyle scores between the two groups. Those with higher healthy lifestyle scores at baseline were more likely to be older, have hypercholesterolemia, and have a lower eGFR, and were less likely to be male and have hypertension and diabetes mellitus (Supplemental material 4).
Figure 1.
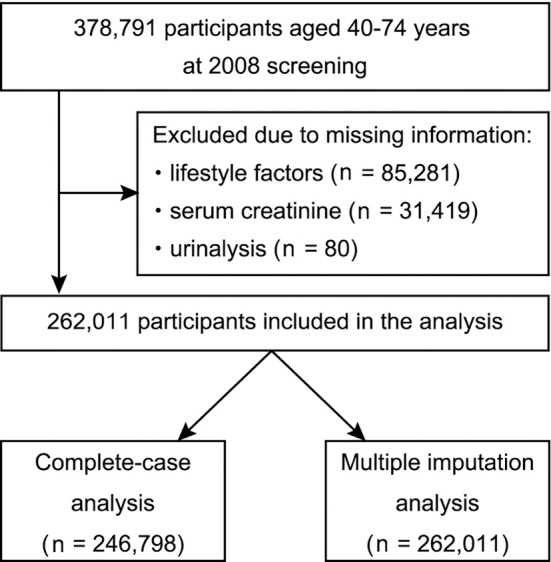
Flowchart of the participant selection.
Table 1.
Baseline Characteristics of Participants by CKD Status (n=262,011).
| Characteristic | No. of Missing Values (%) |
Non-CKD (n=213,549) |
CKD (n=48,462) |
|---|---|---|---|
| Age, years | 0 | 63.5±8.2 | 66.4±6.5 |
| Males (%) | 0 | 79,374 (37.2) | 25,106 (51.8) |
| Healthy lifestyle score (%) | 0 | ||
| 0 | 575 (0.3) | 137 (0.3) | |
| 1 | 5,775 (2.7) | 1,300 (2.7) | |
| 2 | 23,283 (10.9) | 5,626 (11.6) | |
| 3 | 57,470 (26.9) | 13,476 (27.8) | |
| 4 | 91,371 (42.8) | 19,411 (40.1) | |
| 5 | 35,075 (16.4) | 8,512 (17.6) | |
| Current smoker (%) | 0 | 28,400 (13.3) | 6,097 (12.6) |
| Body mass index, kg/m2 | 0 | 22.9±3.2 | 23.7±3.4 |
| Alcohol>20 g/day (%) | 0 | 32,495 (15.2) | 7,645 (15.8) |
| Regular exercise | 0 | ||
| Exercise to light sweat (%) | 90,374 (42.3) | 23,983 (49.5) | |
| Walking>1 hr/day (%) | 109,777 (51.4) | 25,847 (53.3) | |
| Eating habit | 0 | ||
| Snacks after supper (%) | 29,292 (13.7) | 6,200 (12.8) | |
| Skipping breakfast (%) | 20,363 (9.5) | 4,224 (8.7) | |
| History | |||
| Stroke (%) | 11,877 (4.5%) | 6,849 (3.3) | 2,832 (6.3) |
| Heart disease (%) | 12,021 (4.6%) | 11,942 (5.8) | 4,510 (10.0) |
| Comorbidity | |||
| Hypertension (%) | 115 (<0.1%) | 90,796 (42.5) | 27,961 (57.7) |
| Systolic BP, mmHg | 146 (<0.1%) | 128±17 | 132±18 |
| Diastolic BP, mmHg | 158 (<0.1%) | 76±11 | 77±11 |
| Anti-hypertensive medication (%) | 1 (<0.1%) | 56,813 (26.6) | 20,061 (41.4) |
| Diabetes | 11,175 (4.3%) | 18,857 (9.2) | 6,418 (14.1) |
| Hemoglobin A1c, % | 11,174 (4.3%) | 5.8±0.7 | 5.9±0.8 |
| Anti-diabetic medication (%) | 1 (<0.1%) | 9,213 (4.3) | 3,639 (7.5) |
| Hypercholesterolemia | 29 (<0.1%) | 90,017 (42.2) | 22,716 (46.9) |
| LDL cholesterol, mg/dL | 35 (<0.1%) | 126±30 | 126±31 |
| Cholesterol-lowering medication (%) | 1 (<0.1%) | 31,608 (14.8) | 9,577 (19.8) |
| Proteinuria (%) | 0 | 0 (0) | 14,262 (29.4) |
| Serum Cr, mg/dL | 0 | 0.67±0.13 | 0.94±0.42 |
| eGFR, ml/min/1.73 m2 | 0 | 79±15 | 58±14 |
| CKD stage 1-2 (%) | - | 10,047 (20.7%) | |
| G3a (%) | - | 34,357 (70.9%) | |
| G3b (%) | - | 3,373 (7.0%) | |
| G4-5 (%) | - | 685 (1.4%) |
Data are presented as mean±standard deviation or number (percentage). All percentages may not total 100% due to rounding.
BP: blood pressure, CKD: chronic kidney disease, Cr: creatinine, eGFR: estimated glomerular filtration rate, LDL: low-density lipoprotein
The definitions of the clinical characteristics are provided in the text.
Mortality and causes of death by CKD status
During a median follow-up of 4.7 years (25th percentile: 3.3; 75th percentile: 5.2), 3,471 participants (948 CKD and 2,523 non-CKD participants) died. This corresponded to a crude mortality rate of 304.2 (CKD, 476.5; non-CKD, 267.8) per 100,000 person-years (Table 2). In both CKD and non-CKD groups, cancer was the leading cause of death and accounted for roughly half of all deaths. Cardiovascular disease was the second leading cause of death, accounting for roughly one-fifth of all deaths. SMRs for all-cause, cancer, and cardiovascular mortality were 1.32, 1.15, and 1.94, respectively, for the CKD group, with the non-CKD group as the reference. When excluding cases for which information on the cause of death was missing, all cause-specific SMRs for the CKD group were significantly elevated, with the non-CKD group as the reference. When calculating SMRs according to CKD category, SMRs for all-cause mortality increased as eGFR decreased. In the cause-specific evaluation, highly elevated SMR values were observed for kidney disease and cardiovascular disease (Supplemental material 5).
Table 2.
Number of Deaths, Crude Mortality Rates, and Sex- and Age-standardized Mortality Ratios (SMR).
| Cause of death | Non-CKD | CKD | SMRb (95% CI) |
||||
|---|---|---|---|---|---|---|---|
| No. of deaths (%) |
Crude mortalitya |
No. of deaths (%) |
Crude mortalitya |
||||
| All-cause deaths | 2,523 (100.0) | 267.8 | 948 (100.0) | 476.5 | 1.32 (1.24, 1.41) | ||
| Cause-specific | |||||||
| Cancer | 1,389 (55.1) | 147.4 | 465 (49.1) | 233.7 | 1.15 (1.05, 1.26) | ||
| Cardiovascular disease | 418 (16.6) | 44.4 | 229 (24.2) | 115.1 | 1.94 (1.69, 2.20) | ||
| Infection | 116 (4.6) | 12.3 | 42 (4.4) | 21.1 | 1.15 (1.05, 1.26) | ||
| Kidney disease | 10 (0.4) | 1.1 | 13 (1.4) | 6.5 | 3.84 (2.04, 6.56) | ||
| Other | 574 (22.8) | 60.9 | 196 (20.7) | 98.5 | 1.28 (1.11, 1.48) | ||
| Missing | 16 (0.6) | 1.7 | 3 (0.3) | 1.5 | 0.94 (0.19, 2.74) | ||
aMortality rate per 100,000 person-years
bSMR=[No. of actual deaths (rate in participants with CKD) / No. of age- and sex- adjusted expected deaths (age- and sex-adjusted rate in those without CKD)]
CI: confidence interval, CKD: chronic kidney disease
Association between healthy lifestyle scores and mortality in the entire study population
Overall, both lifestyle factors and CKD were associated with an increased risk of all-cause, cancer, and cardiovascular mortality (Table 3). The risk of mortality decreased in a dose-dependent manner with increasing healthy lifestyle scores. A similar dose-dependent relationship was observed between healthy lifestyle scores and mortality for both sexes (Supplemental material 6) and for those aged ≤65 years and >65 years (Supplemental material 7).
Table 3.
Hazard Ratios and Population Attributable Risk Fraction (PAF) for All Cause, Cardiovascular, and Cancer Mortality according to Healthy Lifestyle Score and CKD Status.
| No. of subjects |
All-cause mortality | Cancer mortality | Cardiovascular mortality | ||||||
|---|---|---|---|---|---|---|---|---|---|
| No. of deaths |
HR (95% CI) | No. of deaths |
HR (95% CI) | No. of deaths |
HR (95% CI) | ||||
| Healthy lifestyle score | |||||||||
| Linear | 246,798 | 3,263 | 0.84 (0.81 to 0.87) | 1,744 | 0.83 (0.79 to 0.87) | 609 | 0.86 (0.79 to 0.93) | ||
| Categories | |||||||||
| 0-2 | 34,935 | 670 | 1.00 (ref) | 354 | 1.00 (ref) | 127 | 1.00 (ref) | ||
| 3 | 67,167 | 977 | 0.80 (0.72 to 0.88) | 518 | 0.78 (0.68 to 0.89) | 190 | 0.82 (0.65 to 1.02) | ||
| 4 | 104,219 | 1,220 | 0.71 (0.64 to 0.78) | 653 | 0.68 (0.59 to 0.77) | 211 | 0.68 (0.54 to 0.85) | ||
| 5 (healthiest) | 42,477 | 396 | 0.55 (0.48 to 0.62) | 219 | 0.53 (0.45 to 0.63) | 81 | 0.64 (0.48 to 0.85) | ||
| HR for trend | 0.83 (0.80 to 0.86) | 0.82 (0.78 to 0.86) | 0.85 (0.78 to 0.93) | ||||||
| PAF (%) | 27.2 (20.4 to 33.3) | 27.0 (17.9 to 35.2) | 16.4 (-2.0 to 31.5) | ||||||
| CKD status | |||||||||
| Non-CKD | 202,349 | 2,376 | 1.00 (ref) | 1,308 | 1.00 (ref) | 392 | 1.00 (ref) | ||
| CKD | 44,449 | 887 | 1.36 (1.21 to 1.51) | 436 | 1.23 (1.10 to 1.38) | 217 | 1.83 (1.54 to 2.18) | ||
| PAF (%) | 7.2 (5.8 to 8.8) | 4.8 (2.5 to 7.0) | 16.2 (12.8, 19.5) | ||||||
Multivariate adjustment for age, sex, hypertension, diabetes mellitus, hypercholesterolemia, history of myocardial infarction, history of stroke, and study site.
HR for trend indicates the change in HR by one lifestyle category change towards healthiest.
CI: confidence interval, CKD: chronic kidney disease, HR: hazard ratio
Association between healthy lifestyle scores and mortality by CKD status
A clear inverse dose-dependent relationship was observed between baseline healthy lifestyle scores and all-cause mortality in both non-CKD (Fig. 2A) and CKD groups (Fig. 2B). Relative to the least healthy category (i.e., number of healthy lifestyle factors =0 to 2), there were marked decreases in HRs for all-cause, cancer, and cardiovascular mortality in both CKD and non-CKD groups (Table 4). A significant interaction between the healthy lifestyle score and CKD was observed for cardiovascular mortality (interaction p=0.07) but not for all-cause or cancer mortality (interaction p=0.13 for all-cause mortality and p=0.25 for cancer mortality). When all groups were compared to a single combined non-CKD group with the least healthy category as the reference, CKD participants had a higher mortality risk than non-CKD participants who had the same healthy lifestyle score (Fig. 3). To calculate the measures of biological interaction, we constructed Cox regression models for different ‘exposure’ groups. The association between unhealthy lifestyle and cardiovascular mortality was stronger in the CKD participants (Supplementary material 8).
Figure 2.

Kaplan-Meier curves of cumulative all-cause mortality according to the number of healthy lifestyle factors adhered to in non-CKD (A) and CKD (B) groups.
Table 4.
Cox Proportional Hazards Models of Associations between Healthy Lifestyle Score and All-cause, Cancer, and Cardiovascular Mortality, Stratified by CKD Status.
| No. of subjects |
All-cause mortality | Cancer mortality | Cardiovascular mortality | ||||||
|---|---|---|---|---|---|---|---|---|---|
| No. of deaths |
HR (95% CI) | No. of deaths |
HR (95% CI) | No. of deaths |
HR (95% CI) | ||||
| Non-CKD | |||||||||
| Linear | 202,349 | 2,376 | 0.84 (0.81 to 0.88) | 1,308 | 0.83 (0.79 to 0.88) | 392 | 0.87 (0.78 to 0.96) | ||
| Categories | |||||||||
| 0-2 | 28,325 | 487 | 1.00 (ref) | 265 | 1.00 (ref) | 79 | 1.00 (ref) | ||
| 3 | 54,708 | 686 | 0.77 (0.68 to 0.87) | 377 | 0.75 (0.64 to 0.88) | 108 | 0.74 (0.55 to 0.99) | ||
| 4 | 86,455 | 923 | 0.73 (0.64 to 0.82) | 509 | 0.69 (0.59 to 0.81) | 152 | 0.76 (0.57 to 1.01) | ||
| 5 (healthiest) | 32,861 | 280 | 0.53 (0.46 to 0.62) | 157 | 0.50 (0.41 to 0.62) | 53 | 0.66 (0.46 to 0.95) | ||
| HR for trend | 0.84 (0.80 to 0.87) | 0.82 (0.77 to 0.87) | 0.89 (0.80 to 0.99) | ||||||
| CKD | |||||||||
| Linear | 44,449 | 887 | 0.85 (0.79, 0.90) | 436 | 0.83 (0.76, 0.91) | 217 | 0.84 (0.74, 0.96) | ||
| Categories | |||||||||
| 0-2 | 6,610 | 183 | 1.00 (ref) | 89 | 1.00 (ref) | 48 | 1.00 (ref) | ||
| 3 | 12,459 | 291 | 0.88 (0.73, 1.06) | 141 | 0.87 (0.67, 1.14) | 82 | 0.93 (0.65, 1.33) | ||
| 4 | 17,764 | 297 | 0.68 (0.56, 0.82) | 144 | 0.64 (0.49, 0.84) | 59 | 0.54 (0.37, 0.81) | ||
| 5 (healthiest) | 7,616 | 116 | 0.60 (0.48, 0.77) | 62 | 0.62 (0.44, 0.86) | 28 | 0.62 (0.38, 0.99) | ||
| HR for trend | 0.83 (0.77, 0.89) | 0.83 (0.75, 0.92) | 0.80 (0.68, 0.91) | ||||||
| p for interaction | 0.13 | 0.25 | 0.07 | ||||||
Multivariate adjustment for age, sex, hypertension, diabetes mellitus, hypercholesterolemia, history of myocardial infarction, history of stroke, and study site.
HR for trend indicates the change in HR by one lifestyle category change towards healthiest.
p for interaction shows the results of fitting an interaction term between the healthy lifestyle score category and CKD.
Figure 3.
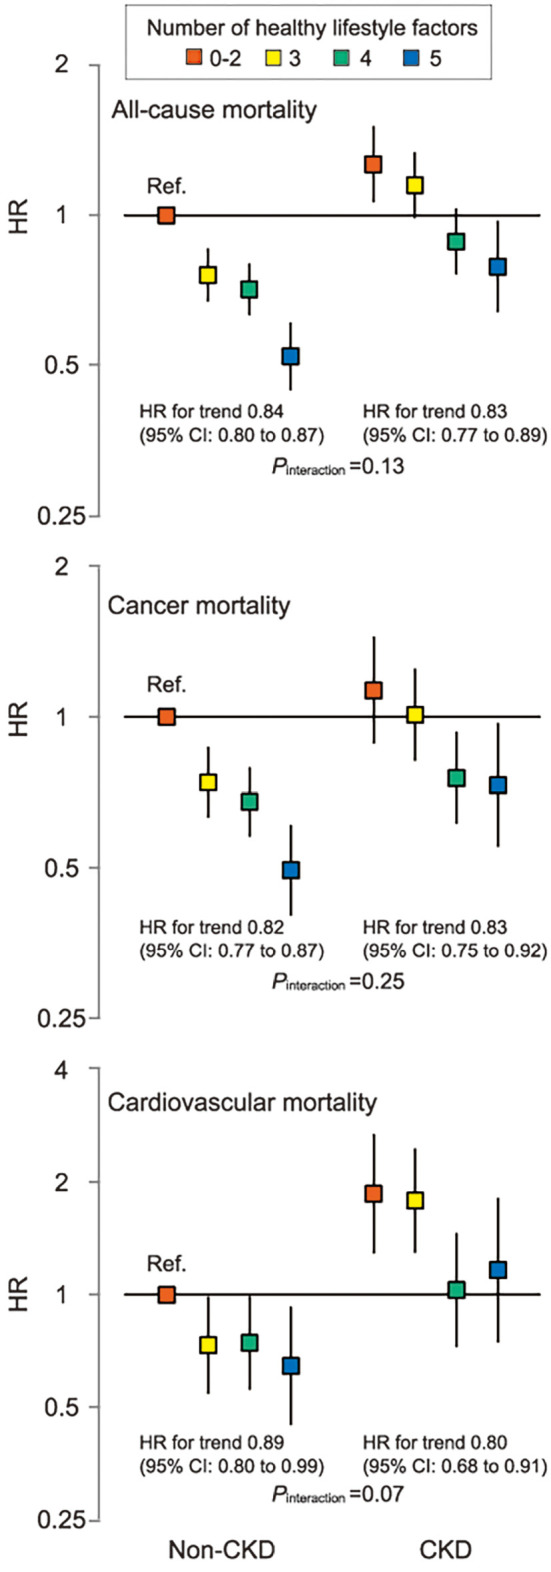
Cox proportional hazards models of associations between the number of healthy lifestyle factors adhered to, CKD status, and all-cause, cancer, and cardiovascular mortality. Adjusted for age, sex, hypertension, diabetes mellitus, hypercholesterolemia, history of myocardial infarction, history of stroke, and study site. Least healthy, non-CKD group is the reference group. HR for trend indicates the change in HR by one lifestyle category change towards healthiest. CI: confidence interval, HR: hazard ratio. Error bars indicate 95% CIs.
When stratified by CKD category, a similar association was found between healthy lifestyle factors and all-cause mortality (Supplemental material 9). A similar relationship, albeit non-significant, was observed for cancer and cardiovascular mortality.
Sensitivity analyses showed similar dose-dependent associations between lifestyle factors and mortality, with no significant interaction for the CKD status. Adjusting for eGFR and proteinuria instead of CKD did not change the HRs (Supplemental material 10). Excluding participants with BMI<18.5 kg/m2 produced similar results (Supplemental material 11). Excluding the first two years of follow-up also produced similar results, albeit with wider CIs than the analyses that included the first two years of follow-up (Supplemental material 12). Imputing missing data did not change the HRs (Supplemental material 13).
Association between each component of the healthy lifestyle score and mortality
Among each component of the healthy lifestyle score, no smoking, recommended physical activity, and healthy eating habits were significantly associated with a decreased risk of all-cause mortality in the entire study population (Supplemental material 14). No smoking and recommended physical activity were also significantly associated with a decreased risk of cancer and cardiovascular mortality. The presence of CKD modified the associations between no smoking and mortality (interaction p=0.005 for all-cause, p=0.04 for cancer, and p=0.008 for cardiovascular mortality) (Table 5). When stratified by CKD status, there was an independent association between no smoking and cardiovascular mortality in the non-CKD group, but not in the CKD group. In contrast, an independent association between eating habits and cardiovascular mortality was observed only in the CKD group (interaction p=0.04). When all groups were compared to a single combined non-CKD group with unhealthy lifestyle category as the reference, healthy eating habits attenuated the increased risk of cardiovascular death in the CKD group, although CKD participants had a higher mortality risk than non-CKD participants (Fig. 4). When stratified by CKD category, there was a similar, albeit non-significant, relationship between each component of the healthy lifestyle score and mortality (Supplemental material 15).
Table 5.
Hazard Ratio and 95% CI for All-cause, Cancer, and Cardiovascular Mortality by Each Component of the Healthy Lifestyle Score, Stratified by CKD Status.
| No smoking | BMI <25 kg/m2 | Physically active | Healthy eating habits |
Alcohol <20 g/day |
|
|---|---|---|---|---|---|
| All-cause mortality | |||||
| Non-CKD | 0.55 (0.49 to 0.60) | 1.05 (0.95 to 1.16) | 0.79 (0.72 to 0.86) | 0.88 (0.79 to 0.97) | 1.12 (1.01 to 1.25) |
| CKD | 0.71 (0.59 to 0.84) | 1.11 (0.96 to 1.28) | 0.71 (0.61 to 0.82) | 0.79 (0.67 to 0.93) | 1.01 (0.85 to 1.20) |
| p for interaction | 0.005 | 0.92 | 0.17 | 0.36 | 0.53 |
| Cancer mortality | |||||
| Non-CKD | 0.54 (0.47 to 0.62) | 1.00 (0.88 to 1.14) | 0.84 (0.75 to 0.95) | 0.88 (0.76 to 1.01) | 1.01 (0.88 to 1.17) |
| CKD | 0.70 (0.55 to 0.89) | 0.88 (0.72 to 1.07) | 0.76 (0.62 to 0.93) | 0.93 (0.73 to 1.18) | 0.95 (0.74 to 1.21) |
| p for interaction | 0.04 | 0.34 | 0.36 | 0.64 | 0.62 |
| Cardiovascular mortality | |||||
| Non-CKD | 0.43 (0.34 to 0.56) | 1.13 (0.89 to 1.43) | 0.79 (0.63 to 0.98) | 1.11 (0.85 to 1.45) | 1.24 (0.95 to 1.62) |
| CKD | 0.83 (0.58 to 1.20) | 1.13 (0.85 to 1.51) | 0.69 (0.51 to 0.92) | 0.68 (0.50 to 0.93) | 0.96 (0.68 to 1.36) |
| p for interaction | 0.008 | 0.46 | 0.45 | 0.04 | 0.94 |
The ‘unhealthy’ category (e.g., current smoker) was used as the reference category for each lifestyle factor.
Adjusted for age, sex, hypertension, diabetes mellitus, hypercholesterolemia, history of myocardial infarction, history of stroke, study site, and other lifestyle factors.
p for interaction shows the results of fitting an interaction term between each component of the healthy lifestyle score and CKD (i.e., each component * CKD).
CI: confidence interval
Figure 4.

Cox proportional hazards models of associations between each component of the healthy lifestyle score, CKD status, and all-cause, cancer, and cardiovascular mortality. Adjusted for age, sex, hypertension, diabetes mellitus, hypercholesterolemia, history of myocardial infarction, history of stroke, study site, and other lifestyle factors. P for interaction shows the results of fitting an interaction term between each component of the healthy lifestyle score and CKD (i.e., each component * CKD). The unhealthy, non-CKD group is the reference group. BMI: body mass index, CI: confidence interval, HR: hazard ratio. Error bars indicate 95% CIs.
Sensitivity analyses using three significant lifestyle factors (i.e., no smoking, recommended physical activity, and healthy eating habits) produced similar dose-dependent associations in both CKD and non-CKD groups (Supplemental material 16). Analyses using four lifestyle factors excluding alcohol intake also showed a significant dose-dependent association between healthy lifestyle score and reduced risk of mortality, although the presence of CKD modified the association between healthy lifestyle score and cardiovascular mortality (interaction p=0.01). When using any combination of healthy lifestyle factors, similar point estimates of PAF were obtained in both the CKD and non-CKD groups (Table 6).
Table 6.
PAF and 95% CI of Mortality according to Different Combinations of Lifestyle Factors, Stratified by CKD Status.
| All-cause mortality | Cancer mortality | Cardiovascular mortality | |||
|---|---|---|---|---|---|
| Three significant factors: no smoking, physically active, and healthy eating habits | |||||
| Non-CKD | 28.8 (23.3 to 33.9) | 25.9 (18.4 to 32.8) | 26.9 (12.3 to 39.0) | ||
| CKD | 28.2 (19.7 to 35.8) | 19.2 (6.0 to 30.5) | 33.5 (15.8 to 47.5) | ||
| Four factors: above three factors and BMI<25 kg/m2 | |||||
| Non-CKD | 30.5 (23.9 to 36.6) | 29.1 (20.2 to 37.1) | 25.9 (7.4 to 40.7) | ||
| CKD | 24.7 (12.9 to 34.9) | 20.0 (2.6 to 34.3) | 20.7 (-7.4 to 41.5) | ||
| Five factors: above four factors and alcohol<20 g/day | |||||
| Non-CKD | 28.9 (21.0 to 36.0) | 30.0 (19.5 to 39.1) | 15.2 (-8.5 to 33.7) | ||
| CKD | 22.1 (8.1 to 33.9) | 18.2 (-2.4 to 34.7) | 17.6 (-15.7 to 41.3) | ||
BMI: body mass index, CI: confidence interval, PAF: population attributable risk fraction
Discussion
In this large-scale Japanese population-based cohort study, we found that the CKD group had higher age- and sex-standardized all-cause, cancer, and cardiovascular mortality rates compared to the non-CKD group. Moreover, the risk of all-cause and cancer mortality decreased as the number of five healthy lifestyle factors adhered to increased, regardless of CKD status, with no effect modification by CKD. The risk of cardiovascular mortality, however, was modified by CKD, and unhealthy lifestyle and CKD synergistically increased cardiovascular mortality. The healthy lifestyle factors of no smoking, regular physical activity, and healthy eating habits were significantly associated with a lower risk of all-cause mortality in both CKD and non-CKD groups, whereas healthy eating habits were independently associated with cardiovascular mortality only in the CKD group. Our results suggest that adhering to an increasing number of the five healthy lifestyle factors can effectively reduce the risk of all-cause and cancer mortality in both CKD and non-CKD groups, although CKD itself is associated with a higher mortality risk. Moreover, the association between unhealthy lifestyle and cardiovascular mortality was stronger in CKD participants, suggesting that both adhering to an increasing number of five healthy lifestyle factors and preventing CKD itself may effectively reduce the risk of cardiovascular mortality.
Prior to the present study, only three cohort studies (2-4) have previously reported epidemiologic data on the dose-dependent effect of adhering to multiple lifestyle factors on mortality in patients with CKD, with conflicting results. These inconsistencies across studies may be attributed to the different definitions of lifestyle factors used in each study. One of the three studies used Life's Simple 7 (4), which includes not only four lifestyle factors but also three medical factors. The remaining two studies used the same four lifestyle factors (smoking, obesity, physical activity, and diet), although their results conflicted with each other. Specifically, one of the studies found a dose-dependent effect on mortality (2), while the other did not (3). The inconsistent results might reflect differences in the weight assigned to each factor. The study which did not find a dose-dependent effect (3) used a weighted healthy lifestyle score based on multivariable Cox proportional hazards regression coefficients. In contrast, the study which found a dose-dependent effect (2), as well as the present study, gave equal weight to each lifestyle factor as in many previous studies which targeted the general population and reported clear linear relationships between risk reduction and the number of healthy lifestyle factors adhered to (5-7,11-21). Equal weighting of factors can amplify the effect of some lifestyle factors, the individual effects of which could be weak or insignificant.
Inconsistencies across studies might alternatively be explained by differences in the proportion of cardiovascular deaths to all deaths in each study population. We observed a significant interaction between the healthy lifestyle score and CKD for cardiovascular mortality but not for cancer mortality. In the present study, no significant interaction was observed between the healthy lifestyle score and CKD for all-cause mortality, possibly because cardiovascular deaths accounted for only roughly 20% of all deaths. That is, if the proportion of cardiovascular deaths in the entire study population was higher, the results might have been different (i.e., a significant interaction between lifestyle factors and CKD might have been observed for all-cause mortality as well). Although those studies (2-4) only evaluated all-cause mortality, the proportion of cardiovascular deaths to all deaths is reportedly higher in Western countries than in Japan. In Canada (26), the US (27), and Sweden (28), 30% of all-cause deaths were attributed to cardiovascular diseases in non-dialysis-dependent CKD patients, and this proportion increased with progressing CKD stages (26-28). Thus, differences in the study population with respect to CKD stage might also affect results in each study.
Although two previous studies (2,3), which used a healthy diet score adapted from the American Heart Association's recommendations for cardiovascular health promotion in the general population (30), did not find an independent association between healthy eating habits and all-cause mortality, we observed this association in both CKD and non-CKD groups. Moreover, an independent association between healthy eating habits and cardiovascular mortality was observed only in the CKD group. To the best of our knowledge, no other study has evaluated the association between skipping breakfast and/or eating snacks after dinner and mortality among patients with CKD. Previous studies targeting the general population have reported that skipping breakfast is associated with cardiometabolic risk factors including obesity (31), hypertension (31,32), type 2 diabetes (33), dyslipidemia (34), and metabolic syndrome (31). According to a recent meta-analysis of cohort studies, skipping breakfast was found to be associated with an elevated risk of cardiovascular disease and all-cause mortality, compared with eating breakfast regularly, in the general population (35). Although few studies have assessed the association between snacking after dinner and cardiovascular mortality, snacking beyond the three main meals (breakfast, lunch, and dinner) has been found to be associated with increased type 2 diabetes risk via increases in BMI (36). Thus, eating patterns are closely associated with cardiometabolic risk factors and may be pronounced in patients with CKD, who are at higher risk of developing cardiovascular disease (37). Further studies will be needed to investigate the adverse effect of skipping breakfast and/or eating snacks after dinner on patients with CKD.
There was no independent association between smoking and cardiovascular mortality in the CKD group, which is inconsistent with previous studies that consistently reported smoking as an independent risk factor for death in patients with CKD (2,3,38). One potential explanation for this is that many of our CKD patients who were non-smokers were former smokers, and thus, the impact of current smoking on mortality may have been attenuated. Former smokers are at higher risk of mortality compared to never smokers (2,3,38). Unfortunately, however, the available data in the present study did not allow us to distinguish between never smokers and former smokers.
Our findings provide meaningful contributions to efforts on tackling the burden of CKD. Although the disease is a global killer (39), many people are unaware of their CKD status given the low awareness of the disease (40). Raising awareness of CKD is certainly important, but our findings suggest that simply adopting a healthy lifestyle provides a survival advantage of similar magnitude in both those with and without CKD. In this regard, combining five lifestyle factors (smoking, obesity, alcohol consumption, physical activity, and diet) has been found to be associated with a significant risk reduction for several diseases, such as coronary heart disease (11,12), type 2 diabetes mellitus (13), stroke (14), dementia (15), sudden cardiac death (16), cancer (17-19), and incidence of proteinuria (5,7) in the general population. Some of these diseases are associated with the incidence of CKD, suggesting that adhering to an increasing number of these lifestyle factors may reduce the incidence of CKD. Moreover, given that unhealthy lifestyle and CKD synergistically increase cardiovascular mortality, the prevention of CKD in and of itself is also important in reducing the risk of cardiovascular death.
The strengths of our study include the large number of outcome events assessed, the representative study population from throughout Japan, detailed information on many lifestyle factors, and confirmation of the underlying causes of death by linkage to a database containing death certificates. Moreover, the assessed factors were dichotomized into healthy or unhealthy, allowing for the healthy behavior of each participant to be evaluated quantitatively.
This study also has several limitations that should be noted. First, healthy lifestyle scores, with the exception of BMI, were determined from self-reported questionnaires, raising the possibility of misclassification. However, in prospective studies, misclassification is typically considered nondifferential and therefore is expected to result in an underestimation of risk. Second, we did not update information on lifestyle factors during follow-up because updated information was not available for all participants. Third, CKD was defined on the basis of a single measurement of eGFR and proteinuria, which can lead to misclassification. Fourth, each healthy lifestyle factor was assigned equal weight, as was done in previous studies (5-7,11-21). This may have resulted in an imperfect approximation of the underlying biological relationships between lifestyle and mortality; however, this would make the study a clear cut message for the prevention of death. Fifth, despite adjusting for potential confounding factors, residual confounding remains possible. For instance, we did not have information about socioeconomic status (SES). In Japan, however, the disparity in SES is relatively small (41), and education level, which is considered one of the most powerful factors affecting the health of individuals among the components of SES, does not modify the association between the number of healthy lifestyle factors adhered to and cardiovascular and all-cause mortality (42). Finally, this study was conducted in Japan, and thus the results might not be generalizable to other populations. However, the dose-dependent effect of adhering to multiple lifestyle factors on mortality in the general population has been observed across different populations (1).
Conclusion
This large-scale cohort study of a Japanese population revealed that the risks of all-cause and cancer mortality decreased as the number of five healthy lifestyle factors adhered to increased, irrespective of the CKD status. The risk of cardiovascular mortality, however, was modified by CKD, and unhealthy lifestyle and CKD synergistically increased cardiovascular mortality. Our results strongly suggest that a healthy lifestyle can reduce the risk of all-cause and cancer death in patients with or without CKD, while the prevention of CKD is essential in reducing the risk of cardiovascular death.
The authors state that they have no Conflict of Interest (COI).
Financial Support
This work was supported by a Health and Labour Sciences Research Grant for “Study on the design of the comprehensive health care system for chronic kidney disease (CKD) based on the individual risk assessment by Specific Health Checkup” from the Ministry of Health, Labour and Welfare of Japan, and a Grant-in-Aid for “Research on Advanced Chronic Kidney Disease (REACH-J), Practical Research Project for Renal Diseases” from the Japan Agency for Medical Research and Development (AMED).
Supplementary Materials
ICD-10 codes used to classify cause of death
Baseline characteristics of participants by CKD status (n = 246,798, complete case analysis)
Baseline characteristics of included and excluded participants
Baseline characteristics of participants by healthy lifestyle score
Sex- and age-standardized mortality ratio (SMR) according to CKD category
Subgroup analysis of Cox proportional hazards models by sex
Subgroup analysis of Cox proportional hazards models by age category
A chart showing the relative risk of cardiovascular mortality with contributions from different ‘exposures.’
Cox proportional hazards models of associations between the number of healthy lifestyle factors adhered to, CKD category, and all-cause, cancer, and cardiovascular mortality
Associations between healthy lifestyle score and all-cause, cancer, and cardiovascular mortality by CKD status, adjusting for eGFR and proteinuria
Associations between healthy lifestyle score and all-cause, cancer, and cardiovascular mortality by CKD status, excluding BMI <18.5 kg/m2
Associations between healthy lifestyle score and all-cause, cancer, and cardiovascular mortality by CKD status, excluding early death
Associations between healthy lifestyle score and all-cause, cancer, and cardiovascular mortality by CKD status, with imputed missing data
Hazard ratio and 95% CI for all-cause, cancer, and cardiovascular mortality according to each component of the healthy lifestyle score in the entire study population
Cox proportional hazards models of associations between each component of the healthy lifestyle score, CKD category, and all-cause, cancer, and cardiovascular mortality
Hazard ratio and 95% CI for all-cause, cancer, and cardiovascular mortality according to different combinations of lifestyle factors, stratified by CKD status
References
- 1.Loef M, Walach H. The combined effects of healthy lifestyle behaviors on all cause mortality: a systematic review and meta-analysis. Prev Med 55: 163-170, 2012. [DOI] [PubMed] [Google Scholar]
- 2.Ricardo AC, Anderson CA, Yang W, et al. Healthy lifestyle and risk of kidney disease progression, atherosclerotic events, and death in CKD: findings from the Chronic Renal Insufficiency Cohort (CRIC) Study. Am J Kidney Dis 65: 412-424, 2015. [DOI] [PMC free article] [PubMed] [Google Scholar]
- 3.Ricardo AC, Madero M, Yang W, et al. Adherence to a healthy lifestyle and all-cause mortality in CKD. Clin J Am Soc Nephrol 8: 602-609, 2013. [DOI] [PMC free article] [PubMed] [Google Scholar]
- 4.Muntner P, Judd SE, Gao L, et al. Cardiovascular risk factors in CKD associate with both ESRD and mortality. J Am Soc Nephrol 24: 1159-1165, 2013. [DOI] [PMC free article] [PubMed] [Google Scholar]
- 5.Wakasugi M, Kazama JJ, Yamamoto S, et al. A combination of healthy lifestyle factors is associated with a decreased incidence of chronic kidney disease: a population-based cohort study. Hypertens Res 36: 328-333, 2013. [DOI] [PubMed] [Google Scholar]
- 6.Wakasugi M, Kazama JJ, Narita I, et al. Association between combined lifestyle factors and non-restorative sleep in Japan: a cross-sectional study based on a Japanese health database. PLoS One 9: e108718, 2014. [DOI] [PMC free article] [PubMed] [Google Scholar]
- 7.Wakasugi M, Kazama J, Narita I, et al. Association between overall lifestyle changes and the incidence of proteinuria: a population-based, cohort study. Intern Med 56: 1475-1484, 2017. [DOI] [PMC free article] [PubMed] [Google Scholar]
- 8.Iseki K, Asahi K, Yamagata K, et al. Mortality risk among screened subjects of the specific health check and guidance program in Japan 2008-2012. Clin Exp Nephrol 21: 978-985, 2017. [DOI] [PubMed] [Google Scholar]
- 9.Iseki K, Konta T, Asahi K, et al. Impact of metabolic syndrome on the mortality rate among participants in a specific health check and guidance program in Japan. Intern Med 59: 2671-2678, 2020. [DOI] [PMC free article] [PubMed] [Google Scholar]
- 10.Iseki K, Konta T, Asahi K, et al. Higher cardiovascular mortality in men with persistent dipstick hematuria. Clin Exp Nephrol 25: 150-156, 2021. [DOI] [PubMed] [Google Scholar]
- 11.Stampfer MJ, Hu FB, Manson JE, et al. Rimm EB, Willett WC. Primary prevention of coronary heart disease in women through diet and lifestyle. N Engl J Med 343: 16-22, 2000. [DOI] [PubMed] [Google Scholar]
- 12.Chiuve SE, McCullough ML, Sacks FM, et al. Healthy lifestyle factors in the primary prevention of coronary heart disease among men: benefits among users and nonusers of lipid-lowering and antihypertensive medications. Circulation 114: 160-167, 2006. [DOI] [PubMed] [Google Scholar]
- 13.Hu FB, Manson JE, Stampfer MJ, et al. Diet, lifestyle, and the risk of type 2 diabetes mellitus in women. N Engl J Med 345: 790-797, 2001. [DOI] [PubMed] [Google Scholar]
- 14.Kurth T, Moore SC, Gaziano JM, et al. Healthy lifestyle and the risk of stroke in women. Arch Intern Med 166: 1403-1409, 2006. [DOI] [PubMed] [Google Scholar]
- 15.Elwood P, Galante J, Pickering J, et al. Healthy lifestyles reduce the incidence of chronic diseases and dementia: evidence from the Caerphilly cohort study. PLoS One 8: e81877, 2013. [DOI] [PMC free article] [PubMed] [Google Scholar]
- 16.Chiuve SE, Fung TT, Rexrode KM, et al. Adherence to a low-risk, healthy lifestyle and risk of sudden cardiac death among women. JAMA 306: 62-69, 2011. [DOI] [PMC free article] [PubMed] [Google Scholar]
- 17.Platz EA, Willett WC, Colditz GA, et al. Proportion of colon cancer risk that might be preventable in a cohort of middle-aged US men. Cancer Causes Control 11: 579-588, 2000. [DOI] [PubMed] [Google Scholar]
- 18.Jiao L, Mitrou PN, Reedy J, et al. A combined healthy lifestyle score and risk of pancreatic cancer in a large cohort study. Arch Intern Med 169: 764-770, 2009. [DOI] [PMC free article] [PubMed] [Google Scholar]
- 19.Sasazuki S, Inoue M, Iwasaki M, et al. Combined impact of five lifestyle factors and subsequent risk of cancer: the Japan Public Health Center Study. Prev Med 54: 112-116, 2012. [DOI] [PubMed] [Google Scholar]
- 20.van Dam RM, Li T, Spiegelman D, et al. Combined impact of lifestyle factors on mortality: prospective cohort study in US women. BMJ 337: a1440, 2008. [DOI] [PMC free article] [PubMed] [Google Scholar]
- 21.Liu K, Daviglus ML, Loria CM, et al. Healthy lifestyle through young adulthood and the presence of low cardiovascular disease risk profile in middle age: the Coronary Artery Risk Development in (Young) Adults (CARDIA) Study. Circulation 125: 996-1004, 2012. [DOI] [PMC free article] [PubMed] [Google Scholar]
- 22. The Office for Lifestyle-Related Diseases Control GAD, Health Service Bureau, Ministry of Health, Labour and Welfare of Japan. Exercise and physical activity guide for health promotion 2006- to prevent lifestyle-related diseases-<exercise guide 2006> prepared in August, 2006 [Internet]. [cited 2019 Jul 19]. Available from: http://www.nibiohn.go.jp/files/exercise_guide.pdf
- 23.Japanese Society of Nephrology. Essential points from evidence-based clinical practice guidelines for chronic kidney disease 2018. Clin Exp Nephrol 23: 1-15, 2019. [DOI] [PMC free article] [PubMed] [Google Scholar]
- 24.Levey AS, de Jong PE, Coresh J, et al. The definition, classification, and prognosis of chronic kidney disease: a KDIGO controversies conference report. Kidney Int 80: 17-28, 2011. [DOI] [PubMed] [Google Scholar]
- 25.Seino Y, Nanjo K, Tajima N, et al. Report of the committee on the classification and diagnostic criteria of diabetes mellitus. J Diabetes Investig 1: 212-228, 2010. [DOI] [PMC free article] [PubMed] [Google Scholar]
- 26.Thompson S, James M, Wiebe N, et al. Cause of death in patients with reduced kidney function. J Am Soc Nephrol 26: 2504-2511, 2015. [DOI] [PMC free article] [PubMed] [Google Scholar]
- 27.Navaneethan SD, Schold JD, Arrigain S, et al. Cause-specific deaths in non-dialysis-dependent CKD. J Am Soc Nephrol 26: 2512-2520, 2015. [DOI] [PMC free article] [PubMed] [Google Scholar]
- 28.Runesson B, Qureshi AR, Xu H, et al. Causes of death across categories of estimated glomerular filtration rate: the Stockholm CREAtinine Measurements (SCREAM) project. PLoS One 14: e0209440, 2019. [DOI] [PMC free article] [PubMed] [Google Scholar]
- 29.GBD 2016 Alcohol Collaborators. Alcohol use and burden for 195 countries and territories, 1990-2016: a systematic analysis for the Global Burden of Disease Study 2016. Lancet 392: 1015-1035, 2018. [DOI] [PMC free article] [PubMed] [Google Scholar]
- 30.Lloyd-Jones DM, Hong Y, Labarthe D, et al. Defining and setting national goals for cardiovascular health promotion and disease reduction: the American Heart Association's strategic impact goal through 2020 and beyond. Circulation 121: 586-613, 2010. [DOI] [PubMed] [Google Scholar]
- 31.Odegaard AO, Jacobs DR Jr, Steffen LM, et al. Breakfast frequency and development of metabolic risk. Diabetes Care 36: 3100-3106, 2013. [DOI] [PMC free article] [PubMed] [Google Scholar]
- 32.Lee TS, Kim JS, Hwang YJ, et al. Habit of eating breakfast is associated with a lower risk of hypertension. J Lifestyle Med 6: 64-67, 2016. [DOI] [PMC free article] [PubMed] [Google Scholar]
- 33.Ballon A, Neuenschwander M, Schlesinger S. Breakfast skipping is associated with increased risk of type 2 diabetes among adults: a systematic review and meta-analysis of prospective cohort studies. J Nutr 149: 106-113, 2019. [DOI] [PubMed] [Google Scholar]
- 34.Farshchi HR, Taylor MA, Macdonald IA. Deleterious effects of omitting breakfast on insulin sensitivity and fasting lipid profiles in healthy lean women. Am J Clin Nutr 81: 388-396, 2005. [DOI] [PubMed] [Google Scholar]
- 35.Chen H, Zhang B, Ge Y, et al. Association between skipping breakfast and risk of cardiovascular disease and all cause mortality: a meta-analysis. Clin Nutr 39: 2982-2988, 2020. [DOI] [PubMed] [Google Scholar]
- 36.Mekary RA, Giovannucci E, Willett WC, et al. Eating patterns and type 2 diabetes risk in men: breakfast omission, eating frequency, and snacking. Am J Clin Nutr 95: 1182-1189, 2012. [DOI] [PMC free article] [PubMed] [Google Scholar]
- 37.Go AS, Chertow GM, Fan D, et al. Chronic kidney disease and the risks of death, cardiovascular events, and hospitalization. N Engl J Med 351: 1296-1305, 2004. [DOI] [PubMed] [Google Scholar]
- 38.Staplin N, Haynes R, Herrington WG, et al. Smoking and adverse outcomes in patients with CKD: the Study of Heart and Renal Protection (SHARP). Am J Kidney Dis 68: 371-380, 2016. [DOI] [PMC free article] [PubMed] [Google Scholar]
- 39.GBD Chronic Kidney Disease Collaboration. Global, regional, and national burden of chronic kidney disease, 1990-2017: a systematic analysis for the Global Burden of Disease Study 2017. Lancet 395: 709-733, 2020. [DOI] [PMC free article] [PubMed] [Google Scholar]
- 40.Jha V, Garcia-Garcia G, Iseki K, et al. Chronic kidney disease: global dimension and perspectives. Lancet 382: 260-272, 2013. [DOI] [PubMed] [Google Scholar]
- 41.Hanibuchi T, Nakaya T, Murata C. Socio-economic status and self-rated health in East Asia: a comparison of China, Japan, South Korea and Taiwan. Eur J Public Health 22: 47-52, 2012. [DOI] [PubMed] [Google Scholar]
- 42.Eguchi E, Iso H, Honjo K, et al. No modifying effect of education level on the association between lifestyle behaviors and cardiovascular mortality the Japan Collaborative. Sci Rep 7: 39820, 2017. [DOI] [PMC free article] [PubMed] [Google Scholar]
Associated Data
This section collects any data citations, data availability statements, or supplementary materials included in this article.
Supplementary Materials
ICD-10 codes used to classify cause of death
Baseline characteristics of participants by CKD status (n = 246,798, complete case analysis)
Baseline characteristics of included and excluded participants
Baseline characteristics of participants by healthy lifestyle score
Sex- and age-standardized mortality ratio (SMR) according to CKD category
Subgroup analysis of Cox proportional hazards models by sex
Subgroup analysis of Cox proportional hazards models by age category
A chart showing the relative risk of cardiovascular mortality with contributions from different ‘exposures.’
Cox proportional hazards models of associations between the number of healthy lifestyle factors adhered to, CKD category, and all-cause, cancer, and cardiovascular mortality
Associations between healthy lifestyle score and all-cause, cancer, and cardiovascular mortality by CKD status, adjusting for eGFR and proteinuria
Associations between healthy lifestyle score and all-cause, cancer, and cardiovascular mortality by CKD status, excluding BMI <18.5 kg/m2
Associations between healthy lifestyle score and all-cause, cancer, and cardiovascular mortality by CKD status, excluding early death
Associations between healthy lifestyle score and all-cause, cancer, and cardiovascular mortality by CKD status, with imputed missing data
Hazard ratio and 95% CI for all-cause, cancer, and cardiovascular mortality according to each component of the healthy lifestyle score in the entire study population
Cox proportional hazards models of associations between each component of the healthy lifestyle score, CKD category, and all-cause, cancer, and cardiovascular mortality
Hazard ratio and 95% CI for all-cause, cancer, and cardiovascular mortality according to different combinations of lifestyle factors, stratified by CKD status