

Abstract
Secondary lymphoid organs (SLO) are underpinned by fibroblastic reticular cells (FRC) that form dedicated microenvironmental niches to secure induction and regulation of innate and adaptive immunity. Distinct FRC subsets are strategically positioned in SLOs to provide niche factors and govern efficient immune cell interaction. In recent years, the use of specialized mouse models in combination with single‐cell transcriptomics has facilitated the elaboration of the molecular FRC landscape at an unprecedented resolution. While single‐cell RNA‐sequencing has advanced the resolution of FRC subset characterization and function, the high dimensionality of the generated data necessitates careful analysis and validation. Here, we reviewed novel findings from high‐resolution transcriptomic analyses that refine our understanding of FRC differentiation and activation processes in the context of infection and inflammation. We further discuss concepts, strategies, and limitations for the analysis of single‐cell transcriptome data from FRCs and the wide‐ranging implications for our understanding of stromal cell biology.
Keywords: cell‐fate mapping, fibroblastic reticular cells, lymphoid tissue organizer cell, single‐cell RNA‐sequencing, stromal cells, transcriptomics
1. LYMPHOID ORGAN FIBROBLASTS
Innate and adaptive immune responses are initiated and coordinated in secondary lymphoid organs (SLOs) that are strategically positioned throughout the body to sample antigens from pathogens, commensal organisms, tumors, or any other environmental sources. In addition, innate immunological signals from inflamed tissues or the body surfaces are relayed to SLOs to amplify or atone immune reactions. Diligent processes in SLOs guide the cellular interactions that generate protective immunity while minimizing immunopathological damage in the tissues. The decision‐making processes that determine the strength, breadth, and specificity of adaptive immune responses occur in dedicated niches within SLOs. Specialized lymphoid organ fibroblasts, commonly referred to as fibroblastic reticular cells (FRCs), form the scaffold of SLOs and determine the microenvironmental conditions for lymphocyte activation and differentiation.1, 2, 3 Thus, the knowledge of FRC biology is fundamental for the understanding and therapeutic manipulation of innate and adaptive immune processes in infection, cancer, and other inflammatory diseases.
The splenic white pulp, evolutionarily the earliest SLO,4 monitors blood‐borne antigens. A network of lymph nodes distributed throughout the body collects lymph‐borne antigen transported via lymphatic vessels draining each organ, while Peyer's patches surveil the intestinal lumen. Despite diverse location and anatomy, all SLOs need to achieve three pivotal functions: (a) receive and process innate immunological signals from a dedicated sampling site, (b) sample and distribute antigen to lymphocytes and antigen‐presenting cells, and (c) promote the efficient activation and interaction of cognate T and B lymphocytes.5 To this end, all SLOs adopt a similar structural patterning with an antigen‐sampling zone filled with specialized myeloid cell subsets, and dedicated B cell follicles and adjoining T cell regions to initiate and direct lymphocyte priming and differentiation. Activated lymphocytes must then converge within the B cell follicle or the T cell zone to achieve, for example, the generation of high‐affinity antibody responses or effector CD8+ T cells, respectively. This series of “combinatorial decision processes” guiding myeloid cell and lymphocyte homing and compartmentalization is orchestrated by chemokines secreted by FRCs.6, 7 CXCL13‐expressing FRCs govern B cell clustering and follicle formation,8, 9 while CCL19/CCL21‐expressing FRC orchestrate dendritic cell and T cell homing and homeostasis.10, 11, 12 Within each zone, specialized FRC subsets coordinate the directed movement of myeloid cells and activated lymphocytes or the display of antigens to harmoniously secure efficient adaptive immunity.
Several terms have been used to describe the fibroblastic stromal cells underpinning SLOs, including myofibroblasts, pericytes, and FRCs.13 In 1968, the term reticular cells was first used to describe the elongated fibroblastic cells surrounding thin filamentous processes, a reticulum, traversing the B cell follicle of the lymph node,14 and the spleen.15 This topological property is also conserved by FRCs in Peyer's patches,16 and the formation of a reticulum is a feature not only of fibroblastic cells in the B cell follicle but also in the T cell zone.13, 17 More recently, FRCs have been characterized by the expression of podoplanin (PDPN, also referred to as gp38) and lack of the endothelial marker CD31 (platelet endothelial cell adhesion molecule‐1, PECAM‐1).11 Although PDPN+ CD31− FRCs have often been associated with the T cell zone,11, 18, 19 the term FRC is now well‐accepted to broadly demarcate immune‐interacting fibroblastic stromal cells within SLOs. Additional topological and functional attributes characterize distinct FRC subsets, such as those in the B cell follicle or the T cell zone.
While CCL19‐secreting FRCs, as well as a subset of CXCL13‐secreting, antigen‐presenting cells termed follicular dendritic cells (FDCs), have prevailed in our knowledge of FRC subsets, in recent years, major advances in genetic models paired with the advent of single‐cell transcriptomics have created novel means to resolve FRC heterogeneity and function. New, highly specialized FRC subsets have been defined and implicated in the fine‐tuned coordination of lymphocyte migration and priming. In this review, we will discuss recent findings delineating FRC differentiation and activation obtained by genetic targeting in mouse models and discuss important strategies and limitations of high dimensional data analysis for the understanding of FRC biology.
2. IN VIVO TARGETING OF FRCs IN GENETIC MOUSE MODELS
The most basic and still frequently used approach to identify FRCs has been based on the expression of PDPN and an extracellular matrix protein that is recognized by the antibody ER‐TR7.11, 20 However, PDPN‐negative FRCs populate several sites in lymph nodes,21 and PDPN expression in the spleen is largely restricted to the T cell zone.22, 23 Thus, tracking changes in the relative abundance, phenotype, or transcriptional profile of non‐hematopoietic CD31– PDPN+ cells only offers a very limited insight into the nature of FRCs in the classical SLOs (lymph nodes, splenic white pulp, or Peyer's patches) or non‐classical SLOs such as fat‐associated lymphoid clusters (FALCs). Genetic targeting of particular cell types in vivo using specific promoters to drive the expression of real‐time reporters or the Cre recombinase has offered novel means to elaborate origin, phenotype, and function of FRCs.
In contrast to T and B cells, FRC‐secreted factors are not readily or sensitively assayed by traditional methods such as flow cytometry or histology. Over the last 10 years, several strains of reporter mice and lineage tracing models expressing Cre recombinase and/or fluorescent proteins (eg, the enhanced yellow fluorescent protein, EYFP) under the promoter of key FRC signature genes have been developed, revolutionizing FRC immunobiology (Table 1). Two such transgenic mouse models that take advantage of FRC chemokine expression are the Ccl19‐Cre24 and the Cxcl13‐Cre/TdTomato25 mouse models. In either model, bacterial artificial chromosome (BAC)‐encoded Cre recombinase expression falls under the control of the chemokine promoter. Cre recombinase activity leads to the permanent expression of EYFP under the control of the constitutive Rosa26 promoter following the excision of an upstream stop‐flox cassette when the Cre‐driver strain has been crossed to the R26R‐EYFP reporter strain.26 EYFP‐labeled cells are those with current Ccl19 or Cxcl13 expression, cells with past chemokine expression, or are the progeny of chemokine‐expressing cells. In the Cxcl13‐Cre/TdTomato R26R‐EYFP mouse model, the red fluorescent protein TdTomato is additionally expressed under the control of the Cxcl13 promoter, serving as a reporter of current Cxcl13 expression. The pivotal function of these two chemokines in lymphocyte compartmentalization and LN development makes these two models well‐suited for FRC lineage tracing across SLOs. The Ccl19‐Cre transgene is expressed in FRC precursor cells during embryonic development (lymph node at embryonic day (E) 16.5,24 Peyer's patch at E18.5,27 spleen at E19.523) thereby targeting FRCs in lymph nodes,21, 24, 28 the splenic white pulp,29 and Peyer's patches.30 Similarly, in lymph node anlagen, the Cxcl13‐Cre transgene is expressed at E14 in mesenchymal stromal cells, marking all major lymph node FRC subsets in adult mice.25 In contrast, Cxcl13‐expressing, TdTomato+ FRCs are largely confined to the B cell follicles.25, 31 Targeting of this transgene in the splenic white pulp and Peyer's patches remains to be studied in detail.
TABLE 1.
Overview of genetic models facilitating in vivo FRC targeting
| Strain designation | Promoter | Transgenic systema | Cre recombinaseb | Direct reporterc | Tansgene expression in mLTo cellsd | Patterning in adult SLOse | References | ||||
|---|---|---|---|---|---|---|---|---|---|---|---|
| Lymph node | Splenic WP | Peyer's patch | Lymph node | Splenic WP | Peyer's patch | ||||||
| DM2 | Fap | BAC | None | LUC, DTR, mCherry | n.d. | n.d | n.d | TRC | Absent | n.d. | 32, 33 |
| Ccl19‐Cre | Ccl19 | BAC | Constitutive | None | E16.5 | E19.5 | E18.5 | All FRC subsets | All FRC subsets | All FRC subsets | 23, 24, 27 |
| Cxcl13‐Cre/TdTom | Cxcl13 | BAC | Constitutive | TdTom | E14 | n.d. | n.d. | All FRC subsets (lineage), BRCs, MedRCs (current) | All FRC subsets (lineage), BRCs (current) | All FRC subsets (lineage), BRCs (current) | 25, 31, unpublished |
| Col6a1‐Cre | Col6a1 | Short promoter | Constitutive | None | n.d. | n.d. | E18.5 | PRCs | PRCs | FDCs, MRCs | 27, 34, 35 |
| Cd21‐Cre | Cd21 | BAC | Constitutive | None | n.d | n.d | n.d | FDCs, few TRCs | FDCs | n.d. | 37, 42, 133 |
| Fap‐tTA | Fap | BAC | Inducible | None | E15.5 | n.d. | n.d. | All FRC subsets | PRCs | TRCs | 39 |
| Ccl19‐tTA/TdTom | Ccl19 | BAC | Inducible | TdTom | E16.5 | E19.5 | E18.5 | All FRC subsets (lineage), TRCs (current) | All FRC subsets (lineage), MRCs, TRCs (current) | All FRC subsets (lineage), TRCs (current) | 23, 24, 27, unpublished |
Abbreviation: N.d., not determined.
Models described here were generated by random integration from either bacterial artificial chromosomes (BAC) or short promoter sequences.
Cre recombinase expression facilitates lineage tracing by permanent reporter expression through excision of an upstream stop‐flox cassette. Inducible Cre recombinase systems enable fate mapping by utilizing a tetracycline transactivator (tTA)‐inducible Cre recombinase.
Direct reporter models monitor current promoter expression of firefly luciferase (LUC), diphtheria toxin receptor (DTR), or red fluorescent proteins mCherry or tdTomato (tdTom).
Embryonic day (E) of first transgene detection in mesenchymal lymphoid tissue organizer (mLTo) cells in the individual SLOs.
FRC targeting through either Cre recombinase‐mediated lineage tracing or identification of current promoter activity.
In addition to these signature chemokine‐based FRC‐targeting models, a number of transgenic strains permit the lineage tracing of a particular FRC repertoire. The DM2 BAC transgenic model harbors a multiple reporter construct containing the diphtheria toxin receptor (DTR), firefly luciferase, and the fluorescent reporter mCherry under the control of the fibroblast activation protein‐α (Fap) promoter.32 The absence of a Cre recombinase‐driven labeling of transgene‐targeted cells does not make this particular model suitable for lineage tracing but rather acts as a direct reporter of current FAP expression. The BAC‐encoded DTR permits the inducible deletion of FAP‐expressing cells following DT administration. In lymph nodes and Peyer's patches, FAP expression is primarily restricted to FRCs in the T cell zone but is detected in a low frequency of cells in the splenic white pulp.33 The Col6a1‐Cre crossed to the R26 mT/mG reporter allows for targeting and lineage tracing of cells expressing, or having expressed Col6a1.34 This model predominantly targets FDCs and marginal zone reticular cells (MRCs) in Peyer's patches but does not readily target FRCs in the splenic white pulp or lymph nodes.35 The Cd21‐Cre R26R‐tdRFP mouse model was designed as a reporter and lineage tracing model of FDCs, based on the high expression of CD21 (murine complement receptor 2) by these cells.36 However, CD21 is also expressed by mature B cells, and while bone marrow chimeras can be used to avoid targeting cells of hematopoietic origin, the Cd21‐Cre model targets FDCs as well as T cell zone FRCs in lymph nodes.37
While reporter mice and lineage tracing models have been instrumental to study FRC heterogeneity and function, they are limited in their capability to delineate the developmental origin and differentiation pathways of FRCs. To this end, cell‐fate mapping tools have been developed to identify progeny‐progenitor relationships during SLO development. The currently available models rely on a tetracycline transactivator (tTA)‐inducible Cre recombinase, whereby the tTA is expressed concomitantly with the target gene and binds to a tetracycline response element upstream of the Cre recombinase promoter, for example in the LC‐1 model.38 Cre recombinase expression is interrupted by the administration of doxycycline, which competitively binds to the tTA. Administering doxycycline to pregnant dams and in the drinking water prevents the labeling of target gene expressing cells, until the timely removal of doxycycline. Two such models include the FCTomato 39 and the Ccl19‐iEYFP23 mouse strains, which allow the fate mapping of Fap‐ or Ccl19‐expressing cells, respectively, when crossed to a Cre recombinase‐dependent reporter strain. Each triple transgenic model encodes a fluorescent protein preceded by a stop‐flox cassette under the control of a Rosa26 promoter, tracking current and progenitor‐progeny relationships. The Ccl19‐iEYFP additionally encodes for a TdTomato reporter under the control of the Ccl19‐promoter to distinguish current from past promoter activity. These models have been used to identify a common FAP‐expressing progenitor of lymph node FRCs39 and to delineate differentiation trajectories of splenic white pulp FRCs that were found to originate from multipotent periarterial, CCL19‐expressing FRC progenitors.23 Additional tools to study clonal relationships include multicolor tagging systems based on Brainbow models.40, 41 The combinatorial expression of multiple fluorescent proteins under the control of the Rosa26 promoter permits the Cre‐induced lineage tracing or fate mapping of individual clones within a targeted cell population. This system has been used to study the developmental origin and differentiation dynamics of FDCs in lymph nodes,42 and FRCs in the splenic white pulp23 and Peyer's patches.27
Collectively, these genetic models have aided in elucidating patterns of FRC differentiation across SLOs by marking progenitor‐progeny relationships, enriching known or rare cell populations for single‐cell RNA‐sequencing, and demonstrably establishing the function of FRC subsets as will be discussed in the following sections. In addition, the broad and constitutive targeting of fibroblasts also makes many of these Cre recombinase‐driven lineage tracing models suitable for targeting stromal cells in inflammatory lesions or the tumor microenvironment,32, 43, 44, 45 making it possible to study immune‐interacting stromal cells outside of lymphoid tissues.
3. RESOLVING FRC BIOLOGY USING SINGLE‐CELL TRANSCRIPTOMICS
In recent years, single‐cell profiling has become a fast‐growing field with a vast number of technological advances accompanied by a flood of new computational tools and algorithms for single‐cell data analysis.46 This rapid progress opens a multitude of new opportunities, but at the same time poses challenges for standardization, and consequently for data interpretation and reproducibility.47, 48 Key variables that ultimately determine the quality and reproducibility of the analysis include sequencing depth, total cell number, and clustering strategy.49, 50 However, these parameters themselves depend on whether heterogeneous cell types are being analyzed, such as in whole organ analyses, or whether the heterogeneity across subsets or activation states of a single‐cell type is being performed.51 Thus, a robust and meaningful clustering depth, assignment, and validation strongly determine the biological interpretation of cellular heterogeneity using single‐cell transcriptomics.
3.1. Deciphering FRC heterogeneity
The FRC landscape consists of specialized subsets that form distinct niches within SLOs corresponding to the T cell zone, B cell follicle, antigen‐sampling regions, and sites of lymphocyte entry (Figure 1).1, 5 As such, FRCs can be broadly categorized as T cell zone reticular cell (TRCs), B cell‐interacting reticular cells (BRCs), and perivascular reticular cells (PRCs). In lymph nodes, medullary reticular cell (MedRCs) form an additional, largely perivascular FRC subset localized in the medulla.52, 53 TRCs and BRCs are defined by classical features such as the CCL19/CCL21‐mediated T cell and dendritic cell recruitment, or CXCL13‐guided B cell trafficking and follicle formation, respectively.9, 11 In recent years, cell‐specific genetic targeting models combined with single‐cell transcriptomics have revealed the presence of multiple BRC and TRC subsets underpinning SLO niches.23, 27, 31, 54 Across SLOs, MRCs border antigen‐sampling regions expressing high levels of Madcam1, Tnfsf11 (encoding for RANKL), and Cxcl13, whereas FDC subsets express receptors to capture and present immune complexes to B cells. T‐B border FRCs co‐express low levels of Cxcl13, Cxcl12, Ccl19, and Ccl21a, while TRCs maintain the highest expression of Ccl19 and Ccl21a in the lymph node cortex, splenic periarteriolar lymphoid sheaths, and perivascular regions in the Peyer's patch. Neighboring FRC subsets across SLOs adopt gradual transcriptomic changes reflecting a spectrum of partially overlapping gene signatures and chemokine gradients, with no chemokine uniquely expressed by any one subset (Figure 1).
FIGURE 1.
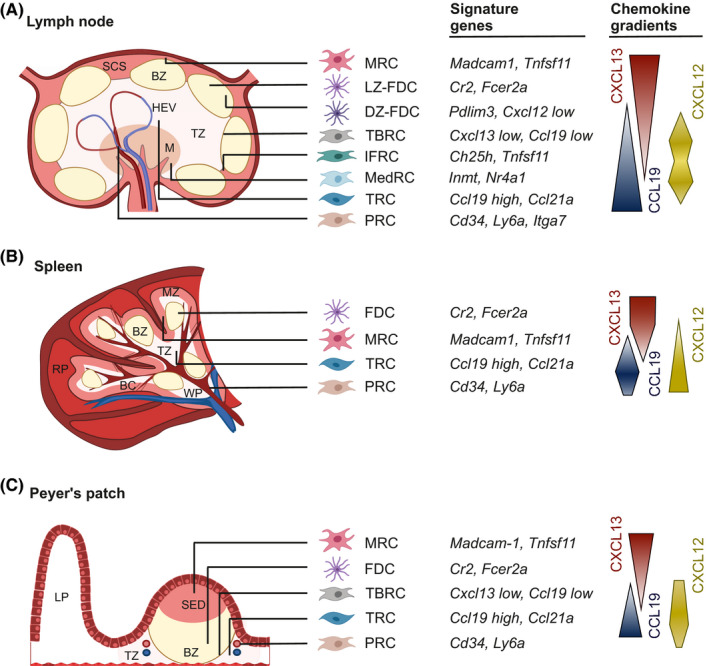
The FRC landscape across secondary lymphoid organs. The FRC landscape consists of specialized subsets that form distinct niches within SLOs. FRC subset identities are defined based on their spatial localization and immune interaction partners in the T cell zone (TZ) and B cell zone (BZ), and as reflected by the expression of signature genes and chemokines. (A) In lymph nodes, marginal reticular cells (MRCs) line the subcapsular sinus (SCS). Two subsets of follicular dendritic cells (FDCs) underpin the BZ and align to the light zone (LZ) and dark zone (DZ) during the germinal center reaction. T‐B border reticular cells (TBRCs) are located along the border between BZ and TZ, and interfollicular reticular cells (IFRCs) support the network between B cell follicles. Medullary reticular cells (MedRCs) locate in the medulla (M). Ccl19‐high T cell reticular cells (TRCs) underpin the majority of the TZ and perivascular reticular cells (PRCs) enwrap large arteries and veins. (B) In the spleen, MRCs line the marginal zone (MZ) bordering the red pulp (RP) and white pulp (WP). Bridging channels (BC) provide a trafficking avenue for lymphocytes to shuttle between the WP and RP. (C) In the Peyer's patch, MRCs underlie the basement membrane of the subepithelial dome (SED), where antigen is sampled and shuttled to the BZ, underpinned by FDCs. TRCs are positioned in between B cell follicle and PRCs border the lamina propria (LP)
Given the gradation in signature genes and chemokine gradients between neighboring FRC subsets, a first requisite to define FRC heterogeneity is to determine robust and meaningful clusters. Usually, unsupervised clustering provides an unbiased, data‐driven assignment of cells based on transcriptome similarity.49 Despite a wide range of different clustering algorithms available with individual strengths and drawbacks,47, 55, 56 there are no common criteria for clustering methods or cell type assignment. Instead, it is often favorable to run a number of algorithms with different parameters to gain confidence about cluster robustness and potential “over‐” or “under‐clustering”.47 As a general rule of thumb, reducing technical noise and resolving the heterogeneity of highly similar or rare cell populations requires a sufficiently high cell input number, and in the case of FRCs, can be facilitated by enriching for desired subsets using available reporter models51 (see Table 1). Once cluster robustness is tested, the list of each cluster's marker genes should reflect the spatial positioning and immune cell‐interacting partners of FRC subsets. Notably, the final choice of clustering depth can vary and should be adapted to the research question and a resolution that can be validated.56, 57, 58 For validation, overlapping expression of unbiased, computed cluster markers should be verified against known signature genes and spatial orientation by confocal microscopy59, 60 (Figure 2A). While histological cluster validation can be challenging and requires highly expressed marker genes and good antibodies, it achieves a reliable description of FRC subset heterogeneity as shown in a number of recent studies.23, 27, 31, 53, 54 The molecular properties of FRC subsets as revealed by single‐cell transcriptomics will be discussed in more detail in section 4.
FIGURE 2.
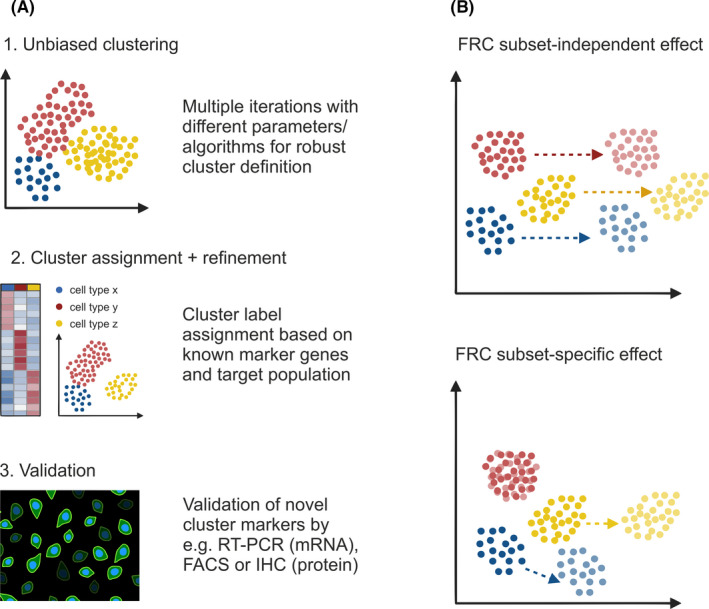
Resolving FRC heterogeneity and changes in activation state. (A) Unsupervised clustering can be used as a first step for unbiased clustering of the analyzed cells. It is often favorable to run a number of algorithms with different parameters to gain confidence about cluster robustness and potential artefacts. In a second step, clusters are refined and labeled based on known marker genes and adapted to the research question. Finally, expression of unbiased, novel cluster markers needs to be validated against known signature genes and spatial orientation by independent techniques such as confocal microscopy, fluorescence‐activated cell sorting (FACS), or real‐time PCR (RT‐PCR). (B) Changes in the microenvironment or biological state may result in a cell‐type independent effect as reflected by a general, linear shift in gene expression profiles across all cell types or by cell type‐specific shifts
3.2. Inflammation‐induced changes in FRC activation state
In addition to FRC heterogeneity within SLOs in the steady‐state, changing conditions such as pathogen infection can cause dynamic changes to the FRC landscape. Indeed, the gene expression profile of an individual cell reflects not just its cell type identity but also a combination of the changing cellular microenvironments, stochastic gene expression, and various transient biological states.61, 62, 63 Those factors can mask each other and confound any classification of cells into cell types or subsets.64 While there are computational tools to regress out confounding factors such as cell cycle state from transcriptomic data,64, 65 it is often not trivial to identify overlapping signatures and interpret shifts in subsets projected in reduced dimensional space.61, 66 Inflammation‐induced programs may be reflected by a general, linear shift in gene expression profiles across subsets or by subset‐specific shifts in the transcriptional profiles of selected subsets.67, 68 However, neither necessarily results in a change of the subset identity as reflected in the cellular function and spatial organization60, 63 (Figure 2B). A crucial first step to studying transcriptional changes across transient biological states is to define subset‐specific gene signatures that reflect cellular identities.48, 69 This step can be based on either known, validated gene signatures or by validating subset‐specific marker genes in the steady‐state as described above. Based on the defined subset‐specific signatures and marker genes, computed clusters can be characterized and subset identities can be assigned as a basis to test for gene signatures that reflect changes in biological state.60, 63 As will be discussed in the subsequent sections, single‐cell transcriptomic studies of FRC activation consistently reflect a preservation of FRC subset identity characterized by changes in state rather than the inflammation‐induced maturation of additional FRC subsets.31, 53, 54
4. FRC SUBSETS ACROSS LYMPHOID ORGANS
Resolving FRC heterogeneity has been a major roadblock to understanding SLO microenvironments and immunological FRC functions. Reflecting the conserved biology of SLOs as sites of immune activation, FRC subset identity appears to be similar across SLOs despite the differences in clustering resolution or cell subset assignment across single‐cell transcriptomics studies. It is conceivable that the shared immune cell composition and the nature of immune cell interactions in the different SLO regions determine the particular phenotype of FRC subsets in order to secure niche‐specific, optimal “catering” conditions.
4.1. T cell zone reticular cells
TRCs are involved in various crucial processes to establish specialized microenvironments and control immune regulation. Besides T cell recruitment, TRCs promote T cell homeostasis by secreting important survival factors such as IL‐7 and BAFF.11, 70 It was further shown that in the lymph node, TRCs could induce peripheral tolerance by presenting tissue‐restricted antigens71 and mediating metabolic reprogramming to support the long‐lasting activation of CD8+ T cells.72 Several single‐cell transcriptomic studies of lymph node FRCs have identified as many as four distinct TRC subsets: Ccl19 high TRCs, T‐B border reticular cells (TBRCs) also referred to as Ccl19 low TRCs, CXCL9+ TRCs, and interfollicular reticular cells (IFRCs).31, 53, 54, 73 While TRC subsets sharing an overlapping transcriptional profile with TBRCs, and CXCL9+ TRCs have also been identified in Peyer's patches,27 splenic TRC subsets have not yet been resolved at a higher resolution. Moreover, IFRCs, a subset co‐expressing Ch25h, Tnfsf11, and Rarres1, were shown to underpin the FRC network between B cell follicles in lymph nodes, where they contribute to the retention of myeloid cells in the lymph vessel‐rich, interfollicular region.31, 54
Ccl19high TRCs are characterized by a high expression of Ccl19, Ccl21a, and Il7 as well as further genes involved in classical TRC functions, including extracellular matrix deposition and reticular fiber network formation.74, 75 This subset underpins the majority of the T cell zone extending throughout the lymph node paracortex. Ccl19 high TRCs sharing a similar transcriptional profile were consistently identified across distinct transcriptome studies of the lymph node stroma53, 54 as well as in the T cell zone of the splenic white pulp23 and the Peyer's patches.27 A subset of potentially activated CXCL9+ TRCs, characterized by a high expression of the CXCR3 ligands Cxcl9 and Cxcl10, MHC class II‐related genes, and an interferon‐inducible gene signature, has been identified in lymph nodes.53, 73 A similar subset of presumably activated TRCs as reflected in the expression of classical TRC markers in combination with genes related to the interferon pathway was recently described in the Peyer's patches,27 highlighting shared features of TRCs across SLOs.
TBRCs were first described as Ccl19 low TRCs that co‐express the signature chemokines Ccl19, Cxcl12, and Cxcl13, as well as genes encoding the survival factors BAFF and APRIL.28, 31, 53, 54, 70, 76 This subset underpins the border between the T cell zone and B cell follicle, where their unique molecular profile supports the migration of recently activated B cells and activated T cells prior to germinal center formation77 as well as the accumulation of recently formed plasma cells exiting the germinal center.76, 78 Using single‐cell transcriptomics, a recent study detected even two TBRC subsets in murine lymph nodes.54 The two TBRC subsets share an overlapping expression of genes encoding CXCL13 and CCL19, however, the marker gene profile of one subset more closely resembles that of Ccl19 high TRCs and the second of MedRCs. It remains unclear whether these gene signatures reflect gradual differences in TBRCs lining B cell follicles distributed more closely to the medulla or a subset in the lymph node cortex.21 Although TBRCs have not yet been described in the splenic white pulp, a recent study of Peyer's patch FRCs also described a TBRC subset sharing a similar molecular profile and spatial localization as those described in lymph nodes.27
The heterogeneity of the TRC repertoire across SLOs highlights the influence of spatial localization and interacting immune cell partners on FRC subset identity. It remains unclear whether activated TRCs bearing an interferon‐induced gene signature (CXCL9+ TRCs in the lymph node, and TRC2 in the Peyer's patches) are truly a distinct TRC subsets or reflect a change in state following activation by yet unknown stimuli. While some studies have begun to look at this,53, 54 a higher resolution of activation‐induced changes in TRC state is warranted.
4.2. B cell interacting reticular cells
CXCL13‐expressing FRC subsets that interact with B cells are referred to as BRCs. The most commonly known BRCs are FDCs that underpin B cell follicles and are specialized in the capture and presentation of antigen. Although initially correctly described as reticular cells,14 their dendritic morphology and ability to retain immune complexes, led to the misclassification of FDCs as dendritic cells restricted to B cell follicles.79 Only decades later it was shown that unlike dendritic cells, FDCs develop from a perivascular myofibroblastic precursor.80 Classically, FDCs are identified based on the expression of complement receptor 2 (Cr2) and Fc receptors (ie, Fcgr2b and Fcer2a). Recently, single‐cell transcriptomics analysis revealed the presence of two distinct FDC subsets in the lymph node: light zone (LZ‐) and dark zone (DZ‐)FDCs.31 LZ‐FDCs express significantly higher levels of Cr2 and Fcer2a and interact with B cells and follicular helper T cells in the light zone during the germinal center reaction. DZ‐FDCs express low levels of genes related to antigen presentation compared to LZ‐FDCs, and low levels of Cxcl12 and extracellular matrix genes compared to neighboring TBRCs.31 Of note, although CXCL12 is important for the spatial shuffling of B cells within the germinal center,81 the markedly higher expression of CXCL12 in TBRCs and MedRCs compared to DZ‐FDCs28, 31 suggests that the designation as CXCL12‐expressing reticular cells (CRCs) should be updated to more accurately reflect the spatial distribution of this chemokine within SLOs. Moreover, while two FDC subsets have been described in the lymph node, further studies are warranted to determine to what extent the molecular identity of LZ‐ and DZ‐FDCs is recapitulated in other SLOs.
Marginal reticular cell (MRCs) are another important BRC subset, characterized by a high expression of Cxcl13, Tnfsf11, and Madcam1.82 This molecular profile shares overlapping characteristics with mesenchymal lymphoid tissue organizer (mLTo) cells in embryonic lymphoid tissues, leading to the proposed function of MRCs as adult precursor for other FRC subsets.42, 82, 83 Recent fate mapping and lineage tracing experiments have validated the role of MRCs as an intermediate developmental stage of the BRC network in Peyer's patches.27 Across SLOs, MRCs line the antigen‐sampling zone interacting with both myeloid cells and B cells. In lymph nodes, MRCs line the lymphatic endothelium and a layer of CD169+ (sialoadhesin) macrophages at the base of the subcapsular sinus where lymph‐borne antigens reach the lymph node.83 In the spleen, blood‐borne antigen is delivered via the arterial circulation and released at the marginal sinus bordering the red and white pulp and is then shuttled back to the white pulp through marginal zone B cells and macrophages.84 Splenic MRCs line the marginal sinus, interdigitated by CD169+ metallophilic macrophages similar to those in the lymph node.85 In Peyer's patches, luminal antigen is sampled by specialized microfold epithelial cells and shuttled into the B cell follicle.86 MRCs underlie the basement membrane of the subepithelial dome at this antigen‐sampling region. The positioning of MRCs along antigen entry routes lining outer SLO surfaces, and their molecular identity with RANKL and MAdCAM‐1 expression, identifies MRCs as a key FRC subset that orchestrates antigen delivery, myeloid cell positioning and B cell activation.
4.3. Perivascular reticular cells
PRCs, as their name suggests, are perivascular fibroblasts that fulfill reticular cell functions such as chemokine expression and conduit formation.13 As perivascular cells ensheath the length of the vascular tree, single‐cell transcriptomic analyses demarcate PRCs as CD34‐ and LY6A (stem cell antigen 1)‐expressing cells surrounding blood vessels in each SLO.23, 27, 53, 54 This relates to the arteries and veins that traverse the medulla in lymph nodes,13 the ramifications of the splenic artery and vein that run through the white pulp,87 blood vessels that pervade the T cell zones bordering the lamina propria in Peyer's patches.88 A key feature distinguishing PRCs from perivascular cells with mainly contractile (ie, vascular smooth muscle cells) or basement membrane forming (ie, pericytes) fibroblasts is their precursor potential. CD34+ PRCs are suggested to give rise to multiple FRC subsets in the lymph node,89 and fate‐mapping studies have shown that periarterial PRCs expressing CD140a and CD140b possess the capacity to give rise to all FRC subsets in the spleen.23 Similarly, in a recent study of Peyer's patch development, CD34+ LY6A+ PRCs in the T cell zone (referred to as TRC1) was found to be a multipotent FRC progenitor subset.27 Further detailed studies are needed to resolve the molecular identity of PRCs along the vascular tree as has been done for PRCs in the CNS90 or for lymph node blood endothelial cells.91 Moreover, while the precursor potential of CD34+ PRCs has been demonstrated during development,23 it remains unclear whether only a subset of PRCs exhibits precursor potential during SLO differentiation and whether the same or different PRC subsets maintain self‐renewing properties in already formed SLOs, especially in the context of inflammation‐induced remodeling.
4.4. Medullary reticular cells
In lymph nodes, the medulla is a site of lymphocyte exit and myeloid cell accumulation, penetrated by large blood vessels and lymphatic sinuses. The lymph node vascular tree is rooted in the medulla with large arteries and veins traversing this region,91 while transverse and cortical lymphatic sinuses collect in the medullary sinus before leaving the lymph node via efferent lymphatic vessels.92 This diverse architecture is supported by at least two subsets of medullary reticular cells (MedRC) distinguished by the expression of Nr4a1 and Inmt,31, 53, 54 as well as CD34+ desmin− PRCs.53 Functional and histological analyses demonstrate that MedRCs orchestrate myeloid cell accumulation via the provision of CCL2,93 and provide the niche factors BAFF, APRIL, IL‐6, and CXCL12 for plasma cell accumulation.21, 94 Despite multiple high‐resolution analyses, appropriate MedRC‐targeting genetic models will be required to disentangle the functional and spatial distinction between MedRC subsets in the future.
In sum, while there is a general consensus about major FRC categorization based on spatial positioning and interacting immune cell partners, many unknowns remain. Resolving further heterogeneity, consistent subset definition and gene signatures remains a future challenge that will involve collective efforts across the scientific community. Transcriptomic FRC studies carried out during SLO differentiation and pathogen‐driven activation will help to refine FRC subset identity versus the dynamic changes in gene expression as part of developmental programs or responses to external stimuli. It can be anticipated that future studies and advanced tools will help to refine our understanding of the FRC landscape across lymphoid and non‐lymphoid sites during inflammation and in cross‐species analyses.
5. FRC DIFFERENTIATION
SLO organogenesis and FRC maturation is governed by a sequence of temporally and spatially coordinated cell‐fate specification, proliferation, and differentiation events.95 All SLOs develop during embryogenesis or in the first few weeks after birth.96 Despite their functional convergence, the developmental program and molecular requirements differ between SLOs reflecting their individual evolutionary history. As the most ancient SLO, the spleen evolved during vertebrate evolution and adapted to the developing adaptive immune system some 300 million years ago. In comparison, Peyer's patches and lymph nodes appeared rather late, approximately 100 million years ago along with the evolution of mammals.4 This evolutionary gap is also reflected in the cellular and molecular mediators of splenic white pulp versus lymph node and Peyer's patch development. Signaling via the lymphotoxin beta‐receptor (LTβR) is grossly required for SLO formation with an abrogation of this pathway resulting in the complete absence of lymph nodes and Peyer's patches and the lack of splenic white pulp development.97, 98, 99, 100, 101 Underlying differences in splenic white pulp versus lymph node and Peyer's patch development are underscored by the different involvement of hematopoietic lymphoid tissue inducer (LTi) cells. While lymph node and Peyer's patch organogenesis relies on the interaction between lymphotoxin alpha1‐beta2 (LTα1β2)‐expressing, CD3‐ CD4+ LTi cells and LTβR‐expressing, non‐hematopoietic LTo cells,96, 102 splenic white pulp formation relies on LTα1β2‐expressing B cells103, 104 and is independent of LTi cells.105 In vivo fate mapping models combined with single‐cell transcriptomics have finally begun to deconstruct the multi‐tiered signaling requirements at the level of FRCs and their progenitors. Recent studies in the spleen and Peyer's patch demonstrate that yet undefined signals drive the differentiation of a multipotent perivascular (and subepithelial in the case of the Peyer's patch) progenitor.23, 27 Clearly, LTβR signaling, “signal 1,” is required for FRC lineage commitment,24, 25 and a further “signal 2” drives subset differentiation80, 106 (Figure 3).
FIGURE 3.
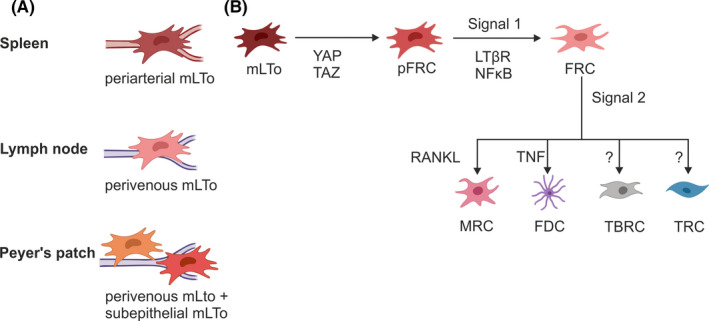
FRC precursor and differentiation pathways across SLOs. (A) In the spleen, periarterial mLTo cells can give rise to all FRC subsets, while in the lymph node FRCs likely arise from mLTo cells in the perivenous space. In Peyer's patches convergent FRC differentiation from two distinct progenitor lineages, a perivascular and a subepithelial mLTo population. (B) Two‐signal model of FRC differentiation from progenitor populations. Mesenchymal lymphoid tissue organizer cells (mLTo) receive an initiating signal to commit to a progenitor FRC (pFRC) intermediate, that commits to the FRC lineage following an LTβR and NFκB‐dependent “signal 1”, and “signal 2” drives downstream differentiation into specialized FRC subsets
5.1. Splenic white pulp development
During embryonic development, splenic precursors emerge as mesenchymal condensation within the dorsal mesogastrium at ~E10.5‐11.0.107 Timely and spatially controlled expression of a set of transcription factors governs spleen ontogeny resulting in the formation of red pulp and white pulp structures with segregated B and T cell niches.108 In a recent study, the differentiation trajectories from committed splenic white pulp mLTo cells to specialized FRC subsets were delineated by combining single‐cell transcriptomics with in vivo cell‐fate mapping.23 Using timed tracing of Ccl19‐iEYFP‐targeted FRCs, starting from embryonic day E19.5, Cheng and colleagues demonstrated the perivascular localization of FRC progenitors around the central artery (Figure 3A). The timed, conditional deletion of LTβR from Ccl19‐iEYFP‐targeted FRCs revealed a block in fate‐mapped FRC subset differentiation, whereas mural cell specification and sustenance of a multipotent periarterial progenitor was found to be LTβR‐independent. Based on these findings a two‐signal program was proposed as model for splenic FRC subset specification. In this model, LTβR‐dependent activation of mLTo cells serves as “signal 1” to commit to an FRC lineage, while further FRC subset specialization depends on secondary signals that likely reflect the immune microenvironment and extrinsic imprints from interacting cellular partners (Figure 3B). As the sustenance of adult reticular progenitors is independent of LTβR signaling, a yet undefined preceding signal is required to establish and maintain the periarteriolar progenitor niche.23 Further cell‐targeted genetic perturbation studies are required to delineate the nature of this initiating signal in the splenic white pulp.
5.2. Lymph node organogenesis
Depending on the bodily region, lymph node organogenesis in mice is initiated between E12 and E17 and is driven by sequential activation of different LTo cell subtypes.102 The time and localization of lymph node initiation is determined by specialized lymphatic endothelial LTo cells that attract and retain circulating LTi cells at vascular intersections via RANK and LTβR signaling.25, 109 Localized swarming of LTi cells at sites of lymph node anlage formation leads to the activation of local perivascular CXCL13+ FAP+ mesenchymal and lymphatic endothelial LTo cells leading to the remodeling of the vascular and fibroblastic infrastructure25, 39 (Figure 3A). These interactions induce the upregulation of adhesion molecules110 and chemokines9 as part of a positive feedback loop that ultimately drives the maturation of blood endothelial LTo cells and specialized FRC subsets.102 FRC subset differentiation and niche maturation requires LTβR and NFκB pathway signaling in mLTo cells as demonstrated by the conditional ablation of LTβR expression or the alternative NFκB pathway in Ccl19‐Cre or Cxcl13‐Cre‐expressing mLTo cells25, 111 and adipocyte precursor cells.112 In line with this finding, it was shown that the genetic abrogation of the canonical NFκB pathway in Ccl19‐Cre‐expressing cells inhibits FRC differentiation,113 and constant LTβR signaling throughout postnatal life is required for FRC differentiation.114 Together these studies reinforce the notion that LTβR and NFκB signaling act as major switch for FRC subset differentiation, equivalent to the “signal 1” suggested for splenic FRCs. A recent study described YAP and TAZ, effectors of Hippo signaling, as additional factors that determine FRC lineage commitment prior to LTβR engagement115 identifying this pathway as an initial signal preceding “signal 1” in FRC differentiation (Figure 3B). Since G‐protein‐coupled receptors, mechanical forces and Wnt signaling can feed into the YAP/TAZ signaling pathway,116 further studies are warranted to explore the cellular and molecular triggers of the Hippo pathway in lymph node FRC precursors.
5.3. Peyer's patch ontogeny
Peyer's patch organogenesis is initiated at E16.5 when LTi cells accumulate in a network of postcapillary venules along the intestinal wall.117, 118 Similar to the activation of mLTo cells during lymph node formation, accumulation of LTi cells in Peyer's patch anlagen induces LTβR‐dependent FRC maturation from perivascular LTo cells.119 Recently, high‐resolution analysis of FRCs from Col6a1‐Cre and Ccl19‐Cre mice was used to delineate FRC differentiation trajectories in Peyer's patches.27 It was shown that the initial activation of perivascular LTo cells is followed by increased lymphocyte infiltration and LTβR‐dependent activation of subepithelial LTo cells (Figure 3A). While activated subepithelial LTo cells induce the formation of MRC networks, perivascular LTo cells support the formation of T cell zones. Interestingly, progenitor cells from both the perivascular and the subepithelial lineage were found to converge in the TNF‐mediated maturation of FDCs.27 While the convergent differentiation from two distinct progenitor lineages appears to be a unique pattern of Peyer's patch organogenesis, LTβR signaling has been confirmed as the main switch that drives FRC differentiation, equivalent to the proposed “signal 1” in other SLOs. Accordingly, TNF signaling acts as secondary signal that drives FDC subset specification (Figure 3B).
In summary, while FRC subsets form convergent functional niches across distinct SLOs, their differentiation trajectories and progenitor populations are different. In the spleen, FRCs arise from periarterial mLTo cells,23 while in the lymph node anlage, perivenous mLTo cells give rise to lymph node FRCs.25 In Peyer's patches, both perivascular and subepithelial mLTo cells converge to give rise to all FRC subsets.27 The observed LTβR‐independent persistence of perivascular mLTo cells in each of these developing SLOs 23, 25, 27 raises the possibility that an initiating signal preceding “signal 1” may be provided by the crosstalk with endothelial LTo cells as suggested in the lymph node anlage.25 FRC differentiation from mLTo cells follows a basic two‐signal model (Figure 3). LTβR signaling appears to be the conserved “signal 1” that determines whether progenitor mLTo cells differentiate into immune‐interacting FRCs. Accordingly, “signal 2” regulates downstream specialization into different FRC subsets. This secondary signal likely reflects extrinsic imprints from the distinct microenvironments and was proposed to involve RANK‐RANKL signaling to support MRC differentiation in lymph nodes,109 and TNFR signaling in the differentiation of FDCs in the spleen and Peyer's patch.27, 106 As an additional layer of complexity, progenitor‐progeny relationships exist between FRC subsets during embryonic SLO development, as has been demonstrated in the convergence of perivascular and subepithelial progenitors in FDC differentiation in Peyer's patches,27 and the lineage relationship between MRCs and FDCs using a multicolor fate‐mapping system in lymph nodes.42 Although pharmacological studies suggest that the continued engagement of key pathways such as the LTβR and TNFR pathway are important to maintaining postnatal FRC subset identity,98, 114 to what extent these progenitor‐progeny relationships are maintained or reshaped in established SLOs over a lifetime of pathogen surveillance remains to be determined.
6. FRC ACTIVATION
In the course of the encounter with pathogens, lymphoid microenvironments increase in size through the recruitment and proliferation of immune cells leading to profound changes in the reticular cell network.2 In addition to FRC proliferation,74, 120 topological changes in FRC network organization occur to support germinal center responses,31 lymphangiogenesis,121 and even de novo B cell follicle formation.122 Moreover, a number of FRC‐derived factors have been shown to modulate adaptive immune responses to a number of pathogens. FRCs crucially contribute to an efficient adaptive immune response by secretion of stimulatory factors and cytokines including BAFF, IL‐6, and IL‐3370, 72, 123 and express activating molecules such as major histocompatibility complex (MHC) molecules that most likely influence antiviral CD8+ T cell priming.72, 124 Concomitantly, FRCs are involved in modulating adaptive immune responses via the expression of peripheral tissue antigens,3 inhibitory molecules such as programmed death‐ligand 1 (PD‐L1),54, 125 or metabolites such as nitric oxide or prostaglandin E2/cyclooxygenase‐2 (PGE2/COX‐2) in mice,126, 127, 128 or a multi‐axis regulation of T cell responses via indoleamine‐s,2‐dioxygenase (IDO), adenosine 2A receptor (A2AR), PGE2 and transforming growth factor‐beta (TGFβ) as shown for FRCs in human tonsils.129 At sites of continuous commensal stimulation, innate immunological sensing pathways also modulate the effector functions of group 1 innate lymphoid cell (ILC) and natural killer (NK) cell activity following enteric coronavirus infection, maintaining intestinal barrier integrity.30 While FRCs have been shown to contribute to various facets of innate and adaptive immune cell activation in SLOs, it remains unclear whether inflammation induces the acquisition of certain immune‐stimulating FRC functions, or whether SLO FRCs are continuously poised to facilitate adaptive immunity.
In the first high‐resolution transcriptomic study of lymph node FRCs, Cyster and colleagues compared FRC identity in lymph nodes from naive mice and mice infected 14 days earlier with the lymphocytic choriomeningitis virus (LCMV).53 No new subsets were apparent from this analysis, although differential gene signatures were not assessed. Two recent studies have compared the molecular identity of FRCs following inflammatory and genetic perturbation to elucidate the molecular changes in FRC subset composition in a functionally relevant manner. Perez‐Shibayama et al used a locally restricted LCMV infection model with the slowly replicating Armstrong strain to study infected lymph node FRCs as targeted with the Ccl19‐Cre mouse model. Upon infection, they observed a transcriptional upregulation of immune stimulatory processes including type I interferon (IFN) response, antigen presentation, and chemokine‐driven immune cell recruitment across all FRCs. While LCMV elicits a robust CD8+ T cell response,130 the vesicular stomatitis virus (VSV) is known to evoke strong humoral immune responses.131 Pikor et al made use of the VSV immunization model to study BRC remodeling during the germinal center response. Upon inflammation, distinct BRC subsets showed individual activation signatures reflected in relatively small transcriptional changes compared to the marked topological remodeling of the germinal center. While LZ‐FDCs showed elevated expression of Fc‐binding receptors and cell shape markers, DZ‐FDCs were found to upregulate the chemokines Cxcl1 and Cxcl16 as well as the cytokine Il6, integrin‐binding proteins, and extracellular matrix‐remodeling proteins. Although LCMV infection resulted in an overall transcriptional shift with a consistent upregulation of immune activation gene signatures in all FRC subsets, VSV immunization induced only small subset‐specific transcriptional changes (Figure 2B). However, in both studies there was no evidence for the inflammation‐induced differentiation of a new FRC subset, rather, FRC subset identities (ie, the expression of defined FRC subset markers) were preserved in lymph nodes from naïve and virus‐infected mice. Collectively, these findings suggest that unlike lymphocytes, FRC subset specification is predetermined in the steady‐state and only the activation state is affected during inflammatory responses.
These observations beg the question of whether a transcriptionally poised FRC network is beneficial for the robustness of adaptive immune responses. Since Perez‐Shibayama and colleagues observed a profound type I IFN response across FRCs following LCMV infection, they assessed the consequence of FRC‐specific type I interferon‐α receptor (IFNAR) ablation. They observed that tonic IFNAR signaling in Ccl19‐Cre+ FRCs was important for sequestering myeloid cells and viral antigen at interfollicular regions thereby ensuring the optimal type I IFN‐mediated upregulation of antigen‐presenting machinery and productive CD8+ T cell antiviral immunity.54 Along similar lines, by selectively deleting Cxcl12 from Cxcl13‐Cre‐targeted BRCs, Pikor et al demonstrated that a poised BRC network and CXCL12 gradient is important for the optimal localization of proliferating B cells at the T‐B border, the topological remodeling of the germinal center, and the focused interaction of B cells, antigen and TFH that drives B cell selection and high‐affinity germinal center output.31 Taken together, both studies highlight that FRC subset specification is transcriptionally and spatially poised in the steady‐state to steer efficient adaptive immunity. Continued high‐resolution single‐cell genomics paired with cell type‐specific FRC gene ablation models will help to further elucidate how individual FRC subsets contribute to immune homeostasis and activation in response to distinct external stimuli.
7. CONCLUSIONS
Efficient adaptive immunity across SLOs is steered by specialized FRC subsets that form distinct microenvironmental niches to promote the optimal interaction of lymphocytes with other lymphocytes, antigen, antigen‐presenting cells, and soluble mediators. Resolving FRC heterogeneity, differentiation and activation is pivotal to understand the induction of immune responses in SLOs, but also at non‐lymphoid sites of inflammation. The development of high‐resolution, single‐cell techniques established platforms to study FRC biology with an unprecedented resolution. Deciphering gene signatures and anatomical localization within SLOs reveals that FRC subset identity reflects their spatial positioning and interacting immune cell partners. Although a direct comparison of FRC subsets across SLOs is still lacking, comparisons across studies reveal an apparent convergence of FRC subset identities, consistent with the notion that anatomically distributed SLOs ultimately fulfill a common function. To advance the understanding of FRC biology beyond heterogeneity, high‐resolution transcriptomics combined with specialized genetic models has propelled and will further foster the elucidation of FRC differentiation lineages and immunological functions. Moreover, the transcriptomic analysis of lymph node FRCs following inflammatory and genetic perturbations has started to reveal the intricacy with which spatially and transcriptionally poised FRC subsets steer humoral immunity27, 31 or bridge the gap between innate and adaptive immunity54 by accommodating an inflammation‐induced change in state. Future studies will unify the molecular identity of FRC subsets, define differentiation and activation states and reveal further immunological functions by which FRCs govern innate and adaptive immunity.
Although there are some inconsistencies in FRC subset characterization across studies (owing to differences in clustering resolution or cell input number), tremendous progress has been made in defining the molecular and functional FRC landscape in SLOs in murine models. It will be important to further elaborate FRC‐driven regulation of lymphocyte activation and regulation as pioneered by Fletcher and colleagues who identified molecular mechanisms underlying FRC‐restricted T cell activation as potential therapeutic strategies for CAR‐T cells.129 Clearly, future technological advances such as spatial transcriptomics132 will facilitate the study of human FRCs, bridging knowledge and insights from the murine setting. As SLO FRCs can be regarded as the prototypical immune‐interacting fibroblasts, a profound understanding of FRC activation and differentiation will meaningfully guide research on therapeutically targeting stromal cell‐underpinned niches in autoimmunity and cancer.
CONFLICT OF INTEREST
BL and NBP are co‐founders and shareholders in Stromal Therapeutics AG, St. Gallen, Switzerland.
ACKNOWLEDGMENTS
This study received financial support from the Swiss National Science Foundation/Schweizerischer Nationalfonds zur Förderung der Wissenschaftlichen Forschung (grant 180011 to NBP and grants 177208 and 182583 to BL) and Novartis Foundation for Biomedical Research to (20C217 to NBP). The funders had no role in preparation of the manuscript.
Lütge M, Pikor NB, Ludewig B. Differentiation and activation of fibroblastic reticular cells. Immunol Rev. 2021;302:32–46. 10.1111/imr.12981
This article is part of a series of reviews covering Immunological functions of fibroblasts in human health and disease appearing in Volume 302 of Immunological Reviews.
REFERENCES
- 1.Krishnamurty AT, Turley SJ. Lymph node stromal cells: cartographers of the immune system. Nat Immunol. 2020;21(4):369‐380. [DOI] [PubMed] [Google Scholar]
- 2.Pikor NB, Cheng HW, Onder L, Ludewig B. Development and immunological function of lymph node stromal cells. J Immunol. 2021;206(2):257‐263. [DOI] [PubMed] [Google Scholar]
- 3.Fletcher AL, Baker AT, Lukacs‐Kornek V, Knoblich K. The fibroblastic T cell niche in lymphoid tissues. Curr Opin Immunol. 2020;64:110‐116. [DOI] [PubMed] [Google Scholar]
- 4.Boehm T, Hess I, Swann JB. Evolution of lymphoid tissues. Trends Immunol. 2012;33(6):315‐321. [DOI] [PubMed] [Google Scholar]
- 5.Junt T, Scandella E, Ludewig B. Form follows function: lymphoid tissue microarchitecture in antimicrobial immune defence. Nat Rev Immunol. 2008;8(10):764‐775. [DOI] [PubMed] [Google Scholar]
- 6.Butcher EC, Picker LJ. Lymphocyte homing and homeostasis. Science. 1996;272(5258):60‐66. [DOI] [PubMed] [Google Scholar]
- 7.Cyster JG. Chemokines and cell migration in secondary lymphoid organs. Science. 1999;286(5447):2098‐2102. [DOI] [PubMed] [Google Scholar]
- 8.Gunn MD, Ngo VN, Ansel KM, Ekland EH, Cyster JG, Williams LT. A B‐cell‐homing chemokine made in lymphoid follicles activates Burkitt's lymphoma receptor‐1. Nature. 1998;391(6669):799‐803. [DOI] [PubMed] [Google Scholar]
- 9.Ansel KM, Ngo VN, Hyman PL, et al. A chemokine‐driven positive feedback loop organizes lymphoid follicles. Nature. 2000;406(6793):309‐314. [DOI] [PubMed] [Google Scholar]
- 10.Yoshida R, Imai T, Hieshima K, et al. Molecular cloning of a novel human CC chemokine EBI1‐ligand chemokine that is a specific functional ligand for EBI1, CCR7. J Biol Chem. 1997;272(21):13803‐13809. [DOI] [PubMed] [Google Scholar]
- 11.Link A, Vogt TK, Favre S, et al. Fibroblastic reticular cells in lymph nodes regulate the homeostasis of naive T cells. Nat Immunol. 2007;8(11):1255‐1265. [DOI] [PubMed] [Google Scholar]
- 12.Acton SE, Astarita JL, Malhotra D, et al. Podoplanin‐rich stromal networks induce dendritic cell motility via activation of the C‐type lectin receptor CLEC‐2. Immunity. 2012;37(2):276‐289. [DOI] [PMC free article] [PubMed] [Google Scholar]
- 13.Gretz JE, Anderson AO, Shaw S. Cords, channels, corridors and conduits: critical architectural elements facilitating cell interactions in the lymph node cortex. Immunol Rev. 1997;156:11‐24. [DOI] [PubMed] [Google Scholar]
- 14.Nossal GJ, Abbot A, Mitchell J, Lummus Z. Antigens in immunity. XV. Ultrastructural features of antigen capture in primary and secondary lymphoid follicles. J Exp Med. 1968;127(2):277‐290. [DOI] [PMC free article] [PubMed] [Google Scholar]
- 15.Hanna MG Jr, Szakal AK. Localization of 125I‐labeled antigen in germinal centers of mouse spleen: histologic and ultrastructural autoradiographic studies of the secondary immune reaction. J Immunol. 1968;101(5):949‐962. [PubMed] [Google Scholar]
- 16.Nicander L, Halleraker M, Landsverk T. Ontogeny of reticular cells in the ileal Peyer's patch of sheep and goats. Am J Anat. 1991;191(3):237‐249. [DOI] [PubMed] [Google Scholar]
- 17.Gretz JE, Kaldjian EP, Anderson AO, Shaw S. Sophisticated strategies for information encounter in the lymph node: the reticular network as a conduit of soluble information and a highway for cell traffic. J Immunol. 1996;157(2):495‐499. [PubMed] [Google Scholar]
- 18.Bajenoff M, Egen JG, Koo LY, et al. Stromal cell networks regulate lymphocyte entry, migration, and territoriality in lymph nodes. Immunity. 2006;25(6):989‐1001. [DOI] [PMC free article] [PubMed] [Google Scholar]
- 19.Brown FD, Turley SJ. Fibroblastic reticular cells: organization and regulation of the T lymphocyte life cycle. J Immunol. 2015;194(4):1389‐1394. [DOI] [PMC free article] [PubMed] [Google Scholar]
- 20.Van Vliet E, Melis M, Foidart JM, Van Ewijk W. Reticular fibroblasts in peripheral lymphoid organs identified by a monoclonal antibody. J Histochem Cytochem. 1986;34(7):883‐890. [DOI] [PubMed] [Google Scholar]
- 21.Takeuchi A, Ozawa M, Kanda Y, et al. A distinct subset of fibroblastic stromal cells constitutes the cortex‐medulla boundary subcompartment of the lymph node. Front Immunol. 2018;9:2196. [DOI] [PMC free article] [PubMed] [Google Scholar]
- 22.Scandella E, Bolinger B, Lattmann E, et al. Restoration of lymphoid organ integrity through the interaction of lymphoid tissue‐inducer cells with stroma of the T cell zone. Nat Immunol. 2008;9(6):667‐675. [DOI] [PubMed] [Google Scholar]
- 23.Cheng HW, Onder L, Novkovic M, et al. Origin and differentiation trajectories of fibroblastic reticular cells in the splenic white pulp. Nat Commun. 2019;10(1):1739. [DOI] [PMC free article] [PubMed] [Google Scholar]
- 24.Chai Q, Onder L, Scandella E, et al. Maturation of lymph node fibroblastic reticular cells from myofibroblastic precursors is critical for antiviral immunity. Immunity. 2013;38(5):1013‐1024. [DOI] [PMC free article] [PubMed] [Google Scholar]
- 25.Onder L, Morbe U, Pikor N, et al. Lymphatic endothelial cells control initiation of lymph node organogenesis. Immunity. 2017;47(1):80‐92 e84. [DOI] [PubMed] [Google Scholar]
- 26.Srinivas S, Watanabe T, Lin CS, et al. Cre reporter strains produced by targeted insertion of EYFP and ECFP into the ROSA26 locus. BMC Dev Biol. 2001;1:4. [DOI] [PMC free article] [PubMed] [Google Scholar]
- 27.Prados A, Onder L, Cheng HW, et al. Fibroblastic reticular cell lineage convergence in Peyer's patches governs intestinal immunity. Nat Immunol. 2021;22(4):510‐519. [DOI] [PMC free article] [PubMed] [Google Scholar]
- 28.Rodda LB, Bannard O, Ludewig B, Nagasawa T, Cyster JG. Phenotypic and morphological properties of germinal center dark zone Cxcl12‐expressing reticular cells. J Immunol. 2015;195(10):4781‐4791. [DOI] [PMC free article] [PubMed] [Google Scholar]
- 29.Schaeuble K, Britschgi MR, Scarpellino L, et al. Perivascular fibroblasts of the developing spleen act as LTalpha1beta2‐dependent precursors of both T and B zone organizer cells. Cell Rep. 2017;21(9):2500‐2514. [DOI] [PubMed] [Google Scholar]
- 30.Gil‐Cruz C, Perez‐Shibayama C, Onder L, et al. Fibroblastic reticular cells regulate intestinal inflammation via IL‐15‐mediated control of group 1 ILCs. Nat Immunol. 2016;17(12):1388‐1396. [DOI] [PMC free article] [PubMed] [Google Scholar]
- 31.Pikor NB, Morbe U, Lutge M, et al. Remodeling of light and dark zone follicular dendritic cells governs germinal center responses. Nat Immunol. 2020;21(6):649‐659. [DOI] [PMC free article] [PubMed] [Google Scholar]
- 32.Roberts EW, Deonarine A, Jones JO, et al. Depletion of stromal cells expressing fibroblast activation protein‐alpha from skeletal muscle and bone marrow results in cachexia and anemia. J Exp Med. 2013;210(6):1137‐1151. [DOI] [PMC free article] [PubMed] [Google Scholar]
- 33.Denton AE, Roberts EW, Linterman MA, Fearon DT. Fibroblastic reticular cells of the lymph node are required for retention of resting but not activated CD8+ T cells. Proc Natl Acad Sci USA. 2014;111(33):12139‐12144. [DOI] [PMC free article] [PubMed] [Google Scholar]
- 34.Armaka M, Apostolaki M, Jacques P, Kontoyiannis DL, Elewaut D, Kollias G. Mesenchymal cell targeting by TNF as a common pathogenic principle in chronic inflammatory joint and intestinal diseases. J Exp Med. 2008;205(2):331‐337. [DOI] [PMC free article] [PubMed] [Google Scholar]
- 35.Prados A, Kollias G, Koliaraki V. CollagenVI‐Cre mice: a new tool to target stromal cells in secondary lymphoid organs. Sci Rep. 2016;6:33027. [DOI] [PMC free article] [PubMed] [Google Scholar]
- 36.McCulloch L, Brown KL, Bradford BM, et al. Follicular dendritic cell‐specific prion protein (PrP) expression alone is sufficient to sustain prion infection in the spleen. PLoS Pathog. 2011;7(12):e1002402. [DOI] [PMC free article] [PubMed] [Google Scholar]
- 37.Mionnet C, Mondor I, Jorquera A, et al. Identification of a new stromal cell type involved in the regulation of inflamed B cell follicles. PLoS Biol. 2013;11(10):e1001672. [DOI] [PMC free article] [PubMed] [Google Scholar]
- 38.Schonig K, Schwenk F, Rajewsky K, Bujard H. Stringent doxycycline dependent control of CRE recombinase in vivo. Nucleic Acids Res. 2002;30(23):e134. [DOI] [PMC free article] [PubMed] [Google Scholar]
- 39.Denton AE, Carr EJ, Magiera LP, Watts AJB, Fearon DT. Embryonic FAP(+) lymphoid tissue organizer cells generate the reticular network of adult lymph nodes. J Exp Med. 2019;216(10):2242‐2252. [DOI] [PMC free article] [PubMed] [Google Scholar]
- 40.Ghigo C, Mondor I, Jorquera A, et al. Multicolor fate mapping of langerhans cell homeostasis. J Exp Med. 2013;210(9):1657‐1664. [DOI] [PMC free article] [PubMed] [Google Scholar]
- 41.Livet J, Weissman TA, Kang H, et al. Transgenic strategies for combinatorial expression of fluorescent proteins in the nervous system. Nature. 2007;450(7166):56‐62. [DOI] [PubMed] [Google Scholar]
- 42.Jarjour M, Jorquera A, Mondor I, et al. Fate mapping reveals origin and dynamics of lymph node follicular dendritic cells. J Exp Med. 2014;211(6):1109‐1122. [DOI] [PMC free article] [PubMed] [Google Scholar]
- 43.Denton AE, Innocentin S, Carr EJ, et al. Type I interferon induces CXCL13 to support ectopic germinal center formation. J Exp Med. 2019;216(3):621‐637. [DOI] [PMC free article] [PubMed] [Google Scholar]
- 44.Cheng HW, Onder L, Cupovic J, et al. CCL19‐producing fibroblastic stromal cells restrain lung carcinoma growth by promoting local antitumor T‐cell responses. J Allergy Clin Immunol. 2018;142(4):1257‐1271 e1254. [DOI] [PubMed] [Google Scholar]
- 45.Cupovic J, Onder L, Gil‐Cruz C, et al. Central nervous system stromal cells control local CD8(+) T cell responses during virus‐induced neuroinflammation. Immunity. 2016;44(3):622‐633. [DOI] [PMC free article] [PubMed] [Google Scholar]
- 46.Zappia L, Phipson B, Oshlack A. Exploring the single‐cell RNA‐seq analysis landscape with the scRNA‐tools database. PLoS Comput Biol. 2018;14(6):e1006245. [DOI] [PMC free article] [PubMed] [Google Scholar]
- 47.Kiselev VY, Andrews TS, Hemberg M. Challenges in unsupervised clustering of single‐cell RNA‐seq data. Nat Rev Genet. 2019;20(5):273‐282. [DOI] [PubMed] [Google Scholar]
- 48.Stegle O, Teichmann SA, Marioni JC. Computational and analytical challenges in single‐cell transcriptomics. Nat Rev Genet. 2015;16(3):133‐145. [DOI] [PubMed] [Google Scholar]
- 49.Andrews TS, Hemberg M. Identifying cell populations with scRNASeq. Mol Aspects Med. 2018;59:114‐122. [DOI] [PubMed] [Google Scholar]
- 50.Sims D, Sudbery I, Ilott NE, Heger A, Ponting CP. Sequencing depth and coverage: key considerations in genomic analyses. Nat Rev Genet. 2014;15(2):121‐132. [DOI] [PubMed] [Google Scholar]
- 51.Nguyen A, Khoo WH, Moran I, Croucher PI, Phan TG. Single cell RNA sequencing of rare immune cell populations. Front Immunol. 2018;9:1553. [DOI] [PMC free article] [PubMed] [Google Scholar]
- 52.Perez‐Shibayama C, Gil‐Cruz C, Ludewig B. Fibroblastic reticular cells at the nexus of innate and adaptive immune responses. Immunol Rev. 2019;289(1):31‐41. [DOI] [PMC free article] [PubMed] [Google Scholar]
- 53.Rodda LB, Lu E, Bennett ML, et al. Single‐cell RNA sequencing of lymph node stromal cells reveals niche‐associated heterogeneity. Immunity. 2018;48(5):1014‐1028 e1016. [DOI] [PMC free article] [PubMed] [Google Scholar]
- 54.Perez‐Shibayama C, Islander U, Lutge M, et al. Type I interferon signaling in fibroblastic reticular cells prevents exhaustive activation of antiviral CD8(+) T cells. Sci Immunol. 2020;5(51). [DOI] [PubMed] [Google Scholar]
- 55.Duo A, Robinson MD, Soneson C. A systematic performance evaluation of clustering methods for single‐cell RNA‐seq data. F1000Res. 2018;7:1141. [DOI] [PMC free article] [PubMed] [Google Scholar]
- 56.Andrews TS, Kiselev VY, McCarthy D, Hemberg M. Tutorial: guidelines for the computational analysis of single‐cell RNA sequencing data. Nat Protoc. 2021;16(1):1‐9. [DOI] [PubMed] [Google Scholar]
- 57.Luecken MD, Theis FJ. Current best practices in single‐cell RNA‐seq analysis: a tutorial. Mol Syst Biol. 2019;15(6):e8746. [DOI] [PMC free article] [PubMed] [Google Scholar]
- 58.Hwang B, Lee JH, Bang D. Single‐cell RNA sequencing technologies and bioinformatics pipelines. Exp Mol Med. 2018;50(8):96. [DOI] [PMC free article] [PubMed] [Google Scholar]
- 59.Kolodziejczyk AA, Kim JK, Svensson V, Marioni JC, Teichmann SA. The technology and biology of single‐cell RNA sequencing. Mol Cell. 2015;58(4):610‐620. [DOI] [PubMed] [Google Scholar]
- 60.Morris SA. The evolving concept of cell identity in the single cell era. Development. 2019;146(12):dev169748. [DOI] [PubMed] [Google Scholar]
- 61.Tanay A, Regev A. Scaling single‐cell genomics from phenomenology to mechanism. Nature. 2017;541(7637):331‐338. [DOI] [PMC free article] [PubMed] [Google Scholar]
- 62.Trapnell C. Defining cell types and states with single‐cell genomics. Genome Res. 2015;25(10):1491‐1498. [DOI] [PMC free article] [PubMed] [Google Scholar]
- 63.Kotliar D, Veres A, Nagy MA, et al. Identifying gene expression programs of cell‐type identity and cellular activity with single‐cell RNA‐Seq. Elife. 2019;8:e43803. [DOI] [PMC free article] [PubMed] [Google Scholar]
- 64.Buettner F, Natarajan KN, Casale FP, et al. Computational analysis of cell‐to‐cell heterogeneity in single‐cell RNA‐sequencing data reveals hidden subpopulations of cells. Nat Biotechnol. 2015;33(2):155‐160. [DOI] [PubMed] [Google Scholar]
- 65.Scialdone A, Natarajan KN, Saraiva LR, et al. Computational assignment of cell‐cycle stage from single‐cell transcriptome data. Methods. 2015;85:54‐61. [DOI] [PubMed] [Google Scholar]
- 66.Grun D, Kester L, van Oudenaarden A. Validation of noise models for single‐cell transcriptomics. Nat Methods. 2014;11(6):637‐640. [DOI] [PubMed] [Google Scholar]
- 67.Lutge A, Zyprych‐Walczak J, Brykczynska Kunzmann U, et al. Cell MixS: quantifying and visualizing batch effects in single‐cell RNA‐seq data. Life Sci Alliance. 2021;4(6):e202001004. [DOI] [PMC free article] [PubMed] [Google Scholar]
- 68.Haghverdi L, Lun ATL, Morgan MD, Marioni JC. Batch effects in single‐cell RNA‐sequencing data are corrected by matching mutual nearest neighbors. Nat Biotechnol. 2018;36(5):421‐427. [DOI] [PMC free article] [PubMed] [Google Scholar]
- 69.Crowell HL, Soneson C, Germain PL, et al. muscat detects subpopulation‐specific state transitions from multi‐sample multi‐condition single‐cell transcriptomics data. Nat Commun. 2020;11(1):6077. [DOI] [PMC free article] [PubMed] [Google Scholar]
- 70.Cremasco V, Woodruff MC, Onder L, et al. B cell homeostasis and follicle confines are governed by fibroblastic reticular cells. Nat Immunol. 2014;15(10):973‐981. [DOI] [PMC free article] [PubMed] [Google Scholar]
- 71.Fletcher AL, Lukacs‐Kornek V, Reynoso ED, et al. Lymph node fibroblastic reticular cells directly present peripheral tissue antigen under steady‐state and inflammatory conditions. J Exp Med. 2010;207(4):689‐697. [DOI] [PMC free article] [PubMed] [Google Scholar]
- 72.Brown FD, Sen DR, LaFleur MW, et al. Fibroblastic reticular cells enhance T cell metabolism and survival via epigenetic remodeling. Nat Immunol. 2019;20(12):1668‐1680. [DOI] [PMC free article] [PubMed] [Google Scholar]
- 73.Pezoldt J, Pasztoi M, Zou M, et al. Neonatally imprinted stromal cell subsets induce tolerogenic dendritic cells in mesenteric lymph nodes. Nat Commun. 2018;9(1):3903. [DOI] [PMC free article] [PubMed] [Google Scholar]
- 74.Novkovic M, Onder L, Cupovic J, et al. Topological small‐world organization of the fibroblastic reticular cell network determines lymph node functionality. PLoS Biol. 2016;14(7):e1002515. [DOI] [PMC free article] [PubMed] [Google Scholar]
- 75.Novkovic M, Onder L, Bocharov G, Ludewig B. Topological structure and robustness of the lymph node conduit system. Cell Rep. 2020;30(3):893‐904 e896. [DOI] [PubMed] [Google Scholar]
- 76.Zhang Y, Tech L, George LA, et al. Plasma cell output from germinal centers is regulated by signals from Tfh and stromal cells. J Exp Med. 2018;215(4):1227‐1243. [DOI] [PMC free article] [PubMed] [Google Scholar]
- 77.Roco JA, Mesin L, Binder SC, et al. Class‐switch recombination occurs infrequently in germinal centers. Immunity. 2019;51(2):337‐350 e337. [DOI] [PMC free article] [PubMed] [Google Scholar]
- 78.Fooksman DR, Schwickert TA, Victora GD, Dustin ML, Nussenzweig MC, Skokos D. Development and migration of plasma cells in the mouse lymph node. Immunity. 2010;33(1):118‐127. [DOI] [PMC free article] [PubMed] [Google Scholar]
- 79.Mandel TE, Phipps RP, Abbot AP, Tew JG. Long‐term antigen retention by dendritic cells in the popliteal lymph node of immunized mice. Immunology. 1981;43(2):353‐362. [PMC free article] [PubMed] [Google Scholar]
- 80.Krautler NJ, Kana V, Kranich J, et al. Follicular dendritic cells emerge from ubiquitous perivascular precursors. Cell. 2012;150(1):194‐206. [DOI] [PMC free article] [PubMed] [Google Scholar]
- 81.Allen CD, Ansel KM, Low C, et al. Germinal center dark and light zone organization is mediated by CXCR4 and CXCR5. Nat Immunol. 2004;5(9):943‐952. [DOI] [PubMed] [Google Scholar]
- 82.Katakai T, Suto H, Sugai M, et al. Organizer‐like reticular stromal cell layer common to adult secondary lymphoid organs. J Immunol. 2008;181(9):6189‐6200. [DOI] [PubMed] [Google Scholar]
- 83.Katakai T. Marginal reticular cells: a stromal subset directly descended from the lymphoid tissue organizer. Front Immunol. 2012;3:200. [DOI] [PMC free article] [PubMed] [Google Scholar]
- 84.Lewis SM, Williams A, Eisenbarth SC. Structure and function of the immune system in the spleen. Sci Immunol. 2019;4(33):eaau6085. [DOI] [PMC free article] [PubMed] [Google Scholar]
- 85.Martinez‐Pomares L, Gordon S. CD169+ macrophages at the crossroads of antigen presentation. Trends Immunol. 2012;33(2):66‐70. [DOI] [PubMed] [Google Scholar]
- 86.Komban RJ, Stromberg A, Biram A, et al. Activated Peyer's patch B cells sample antigen directly from M cells in the subepithelial dome. Nat Commun. 2019;10(1):2423. [DOI] [PMC free article] [PubMed] [Google Scholar]
- 87.Mebius RE, Kraal G. Structure and function of the spleen. Nat Rev Immunol. 2005;5(8):606‐616. [DOI] [PubMed] [Google Scholar]
- 88.Yamaguchi K, Schoefl GI. Blood vessels of the Peyer's patch in the mouse: I. Topographic studies. Anat Rec. 1983;206(4):391‐401. [DOI] [PubMed] [Google Scholar]
- 89.Sitnik KM, Wendland K, Weishaupt H, et al. Context‐dependent development of lymphoid stroma from adult CD34(+) adventitial progenitors. Cell Rep. 2016;14(10):2375‐2388. [DOI] [PubMed] [Google Scholar]
- 90.Vanlandewijck M, He L, Mae MA, et al. A molecular atlas of cell types and zonation in the brain vasculature. Nature. 2018;554(7693):475‐480. [DOI] [PubMed] [Google Scholar]
- 91.Brulois K, Rajaraman A, Szade A, et al. A molecular map of murine lymph node blood vascular endothelium at single cell resolution. Nat Commun. 2020;11(1):3798. [DOI] [PMC free article] [PubMed] [Google Scholar]
- 92.Jalkanen S, Salmi M. Lymphatic endothelial cells of the lymph node. Nat Rev Immunol. 2020;20(9):566‐578. [DOI] [PubMed] [Google Scholar]
- 93.Dasoveanu DC, Park HJ, Ly CL, et al. Lymph node stromal CCL2 limits antibody responses. Sci Immunol. 2020;5(45):eaaw0693. [DOI] [PMC free article] [PubMed] [Google Scholar]
- 94.Huang HY, Rivas‐Caicedo A, Renevey F, et al. Identification of a new subset of lymph node stromal cells involved in regulating plasma cell homeostasis. Proc Natl Acad Sci USA. 2018;115(29):E6826‐E6835. [DOI] [PMC free article] [PubMed] [Google Scholar]
- 95.Fu YX, Chaplin DD. Development and maturation of secondary lymphoid tissues. Annu Rev Immunol. 1999;17:399‐433. [DOI] [PubMed] [Google Scholar]
- 96.Randall TD, Carragher DM, Rangel‐Moreno J. Development of secondary lymphoid organs. Annu Rev Immunol. 2008;26:627‐650. [DOI] [PMC free article] [PubMed] [Google Scholar]
- 97.Futterer A, Mink K, Luz A, Kosco‐Vilbois MH, Pfeffer K. The lymphotoxin beta receptor controls organogenesis and affinity maturation in peripheral lymphoid tissues. Immunity. 1998;9(1):59‐70. [DOI] [PubMed] [Google Scholar]
- 98.Mackay F, Browning JL. Turning off follicular dendritic cells. Nature. 1998;395(6697):26‐27. [DOI] [PubMed] [Google Scholar]
- 99.De Togni P, Goellner J, Ruddle NH, et al. Abnormal development of peripheral lymphoid organs in mice deficient in lymphotoxin. Science. 1994;264(5159):703‐707. [DOI] [PubMed] [Google Scholar]
- 100.Koni PA, Sacca R, Lawton P, Browning JL, Ruddle NH, Flavell RA. Distinct roles in lymphoid organogenesis for lymphotoxins alpha and beta revealed in lymphotoxin beta‐deficient mice. Immunity. 1997;6(4):491‐500. [DOI] [PubMed] [Google Scholar]
- 101.Tumanov AV, Grivennikov SI, Shakhov AN, et al. Dissecting the role of lymphotoxin in lymphoid organs by conditional targeting. Immunol Rev. 2003;195:106‐116. [DOI] [PubMed] [Google Scholar]
- 102.Onder L, Ludewig B. A fresh view on lymph node organogenesis. Trends Immunol. 2018;39(10):775‐787. [DOI] [PubMed] [Google Scholar]
- 103.Tumanov A, Kuprash D, Lagarkova M, et al. Distinct role of surface lymphotoxin expressed by B cells in the organization of secondary lymphoid tissues. Immunity. 2002;17(3):239‐250. [DOI] [PubMed] [Google Scholar]
- 104.Nolte MA, Arens R, Kraus M, et al. B cells are crucial for both development and maintenance of the splenic marginal zone. J Immunol. 2004;172(6):3620‐3627. [DOI] [PubMed] [Google Scholar]
- 105.Lane PJ, McConnell FM, Withers D, Gaspal F, Saini M, Anderson G. Lymphoid tissue inducer cells and the evolution of CD4 dependent high‐affinity antibody responses. Prog Mol Biol Transl Sci. 2010;92:159‐174. [DOI] [PubMed] [Google Scholar]
- 106.Tumanov AV, Grivennikov SI, Kruglov AA, et al. Cellular source and molecular form of TNF specify its distinct functions in organization of secondary lymphoid organs. Blood. 2010;116(18):3456‐3464. [DOI] [PMC free article] [PubMed] [Google Scholar]
- 107.Burn SF, Boot MJ, de Angelis C, et al. The dynamics of spleen morphogenesis. Dev Biol. 2008;318(2):303‐311. [DOI] [PubMed] [Google Scholar]
- 108.Brendolan A, Rosado MM, Carsetti R, Selleri L, Dear TN. Development and function of the mammalian spleen. BioEssays. 2007;29(2):166‐177. [DOI] [PubMed] [Google Scholar]
- 109.Camara A, Cordeiro OG, Alloush F, et al. Lymph node mesenchymal and endothelial stromal cells cooperate via the RANK‐RANKL cytokine axis to shape the sinusoidal macrophage niche. Immunity. 2019;50(6):1467‐1481 e1466. [DOI] [PubMed] [Google Scholar]
- 110.Benezech C, White A, Mader E, et al. Ontogeny of stromal organizer cells during lymph node development. J Immunol. 2010;184(8):4521‐4530. [DOI] [PMC free article] [PubMed] [Google Scholar]
- 111.Onder L, Danuser R, Scandella E, et al. Endothelial cell‐specific lymphotoxin‐beta receptor signaling is critical for lymph node and high endothelial venule formation. J Exp Med. 2013;210(3):465‐473. [DOI] [PMC free article] [PubMed] [Google Scholar]
- 112.Benezech C, Mader E, Desanti G, et al. Lymphotoxin‐beta receptor signaling through NF‐kappaB2‐RelB pathway reprograms adipocyte precursors as lymph node stromal cells. Immunity. 2012;37(4):721‐734. [DOI] [PMC free article] [PubMed] [Google Scholar]
- 113.Bogdanova D, Takeuchi A, Ozawa M, et al. Essential role of canonical NF‐kappaB activity in the development of stromal cell subsets in secondary lymphoid organs. J Immunol. 2018;201(12):3580‐3586. [DOI] [PubMed] [Google Scholar]
- 114.Li C, Lam E, Perez‐Shibayama C, et al. Early‐life programming of mesenteric lymph node stromal cell identity by the lymphotoxin pathway regulates adult mucosal immunity. Sci Immunol. 2019;4(42):eaax1027. [DOI] [PubMed] [Google Scholar]
- 115.Choi SY, Bae H, Jeong SH, et al. YAP/TAZ direct commitment and maturation of lymph node fibroblastic reticular cells. Nat Commun. 2020;11(1):519. [DOI] [PMC free article] [PubMed] [Google Scholar]
- 116.Moya IM, Halder G. Hippo‐YAP/TAZ signalling in organ regeneration and regenerative medicine. Nat Rev Mol Cell Biol. 2019;20(4):211‐226. [DOI] [PubMed] [Google Scholar]
- 117.Nakagawa R, Togawa A, Nagasawa T, Nishikawa S. Peyer's patch inducer cells play a leading role in the formation of B and T cell zone architecture. J Immunol. 2013;190(7):3309‐3318. [DOI] [PubMed] [Google Scholar]
- 118.Yoshida H, Honda K, Shinkura R, et al. IL‐7 receptor alpha+ CD3(‐) cells in the embryonic intestine induces the organizing center of Peyer's patches. Int Immunol. 1999;11(5):643‐655. [DOI] [PubMed] [Google Scholar]
- 119.Debard N, Sierro F, Browning J, Kraehenbuhl JP. Effect of mature lymphocytes and lymphotoxin on the development of the follicle‐associated epithelium and M cells in mouse Peyer's patches. Gastroenterology. 2001;120(5):1173‐1182. [DOI] [PubMed] [Google Scholar]
- 120.Gregory JL, Walter A, Alexandre YO, et al. Infection programs sustained lymphoid stromal cell responses and shapes lymph node remodeling upon secondary challenge. Cell Rep. 2017;18(2):406‐418. [DOI] [PubMed] [Google Scholar]
- 121.Dubey LK, Karempudi P, Luther SA, Ludewig B, Harris NL. Interactions between fibroblastic reticular cells and B cells promote mesenteric lymph node lymphangiogenesis. Nat Commun. 2017;8(1):367. [DOI] [PMC free article] [PubMed] [Google Scholar]
- 122.Dubey LK, Lebon L, Mosconi I, et al. Lymphotoxin‐dependent B cell‐FRC crosstalk promotes de novo follicle formation and antibody production following intestinal helminth infection. Cell Rep. 2016;15(7):1527‐1541. [DOI] [PubMed] [Google Scholar]
- 123.Kallert SM, Darbre S, Bonilla WV, et al. Replicating viral vector platform exploits alarmin signals for potent CD8(+) T cell‐mediated tumour immunotherapy. Nat Commun. 2017;8:15327. [DOI] [PMC free article] [PubMed] [Google Scholar]
- 124.Perez‐Shibayama C, Gil‐Cruz C, Cheng HW, et al. Fibroblastic reticular cells initiate immune responses in visceral adipose tissues and secure peritoneal immunity. Sci Immunol. 2018;3(26):eaar4539. [DOI] [PubMed] [Google Scholar]
- 125.Mueller SN, Matloubian M, Clemens DM, et al. Viral targeting of fibroblastic reticular cells contributes to immunosuppression and persistence during chronic infection. Proc Natl Acad Sci USA. 2007;104(39):15430‐15435. [DOI] [PMC free article] [PubMed] [Google Scholar]
- 126.Schaeuble K, Cannelle H, Favre S, et al. Attenuation of chronic antiviral T‐cell responses through constitutive COX2‐dependent prostanoid synthesis by lymph node fibroblasts. PLoS Biol. 2019;17(7):e3000072. [DOI] [PMC free article] [PubMed] [Google Scholar]
- 127.Lukacs‐Kornek V, Malhotra D, Fletcher AL, et al. Regulated release of nitric oxide by nonhematopoietic stroma controls expansion of the activated T cell pool in lymph nodes. Nat Immunol. 2011;12(11):1096‐1104. [DOI] [PMC free article] [PubMed] [Google Scholar]
- 128.Yu M, Guo G, Zhang X, et al. Fibroblastic reticular cells of the lymphoid tissues modulate T cell activation threshold during homeostasis via hyperactive cyclooxygenase‐2/prostaglandin E2 axis. Sci Rep. 2017;7(1):3350. [DOI] [PMC free article] [PubMed] [Google Scholar]
- 129.Knoblich K, Cruz Migoni S, Siew SM, et al. The human lymph node microenvironment unilaterally regulates T‐cell activation and differentiation. PLoS Biol. 2018;16(9):e2005046. [DOI] [PMC free article] [PubMed] [Google Scholar]
- 130.Muller U, Steinhoff U, Reis LF, et al. Functional role of type I and type II interferons in antiviral defense. Science. 1994;264(5167):1918‐1921. [DOI] [PubMed] [Google Scholar]
- 131.Martinez I, Barrera JC, Rodriguez LL, Wertz GW. Recombinant vesicular stomatitis (Indiana) virus expressing New Jersey and Indiana glycoproteins induces neutralizing antibodies to each serotype in swine, a natural host. Vaccine. 2004;22(29–30):4035‐4043. [DOI] [PubMed] [Google Scholar]
- 132.Efremova M, Teichmann SA. Computational methods for single‐cell omics across modalities. Nat Methods. 2020;17(1):14‐17. [DOI] [PubMed] [Google Scholar]
- 133.Victoratos P, Lagnel J, Tzima S, et al. FDC‐specific functions of p55TNFR and IKK2 in the development of FDC networks and of antibody responses. Immunity. 2006;24(1):65‐77. [DOI] [PubMed] [Google Scholar]