

Abstract
Dendritic cells (DC) subsets, like Langerhans cells (LC), are immune cells involved in pathogen sensing. They express specific antimicrobial cellular factors that are able to restrict infection and limit further pathogen transmission. Here, we identify the alarmin S100A9 as a novel intracellular antiretroviral factor expressed in human monocyte‐derived and skin‐derived LC. The intracellular expression of S100A9 is decreased upon LC maturation and inversely correlates with enhanced susceptibility to HIV‐1 infection of LC. Furthermore, silencing of S100A9 in primary human LC relieves HIV‐1 restriction while ectopic expression of S100A9 in various cell lines promotes intrinsic resistance to both HIV‐1 and MLV infection by acting on reverse transcription. Mechanistically, the intracellular expression of S100A9 alters viral capsid uncoating and reverse transcription. S100A9 also shows potent inhibitory effect against HIV‐1 and MMLV reverse transcriptase (RTase) activity in vitro in a divalent cation‐dependent manner. Our findings uncover an unexpected intracellular function of the human alarmin S100A9 in regulating antiretroviral immunity in Langerhans cells.
Keywords: HIV‐1, innate immunity, Langerhans cells, S100A9, viral restriction
Subject Categories: Immunology; Microbiology, Virology & Host Pathogen Interaction
Human Langerhans cells are refractory to HIV‐1 infection due to the expression of the alarmin S100A9 that inhibits reverse transcriptase activity.
Introduction
The outcome of early events of HIV‐1 infection and transmission depends on mucosal immunity notably regulated by Langerhans cells (LC), a mucosa‐ and skin‐resident dendritic cell subset. Experimental models to study HIV infection of human LC rely on the use of ex vivo‐isolated skin‐LC or in vitro blood‐derived mononuclear cells. Although possible carriers of infectious virions, most studies have demonstrated that ex vivo LC are refractory to productive HIV‐1 infection (Miller & Hu, 1999; Czubala et al, 2016; Ribeiro et al, 2016), as well as their in vitro monocyte‐derived counterparts (Kaushik et al, 2009; Schule et al, 2009).
Langerhans cells were shown to specifically express a C‐type lectin receptor, langerin, acting as a natural barrier to HIV infection (de Witte et al, 2007) and recently described as an interferon‐stimulated gene (ISG) (Maarifi et al, 2019). Nevertheless, LC could be significantly infected at high viral inoculum (Nasr et al, 2014; Mayr et al, 2017) or upon activation (Fahrbach et al, 2007; de Jong et al, 2010). Interestingly, several reports also evidenced an enhanced susceptibility of matured LC to SIV and HIV infection (Miller & Hu, 1999; Fahrbach et al, 2007; Ogawa et al, 2009; de Jong et al, 2010). Recent data showed that langerin was linked to degradative autophagy through a novel TRIM5α‐Atg16L1‐Atg5 complex, therefore driving incoming virions to degradation (Ribeiro et al, 2016). Therefore, engineered and repurposed HIV‐based lentiviral vectors pseudotyped with glycoproteins derived from other enveloped viruses are often used to bypass langerin‐mediated viral restriction acting at viral entry therefore allowing to study the intrinsic immune response of LC to HIV‐1 infection (de Witte et al, 2007; de Jong et al, 2010; Czubala et al, 2016). Interestingly, LC were nevertheless shown to be also refractory to HIV‐based lentiviral‐mediated transduction bypassing virus receptor usage and therefore suggesting the existence of other cell type‐specific innate or intrinsic antiviral immune mechanisms (Veron et al, 2006; Czubala et al, 2016).
We recently provided the evidence of a TGF‐β‐dependent anti‐HIV‐1 activity present in LC and acting at a post‐entry step of the viral replication cycle (Czubala et al, 2016). More precisely, this anti‐HIV activity was shown to act at the reverse transcription (RT) step and SAMHD1, a previously reported HIV restriction factor (Hrecka et al, 2011; Laguette et al, 2011), was seemingly not required.
Here, a high‐throughput transcriptomic approach on human primary monocyte‐derived cells led to the identification of the S100A9 alarmin as a TGF‐β‐regulated cellular factor which exerts an intracellular antiretroviral activity. S100A9 is a member of the S100 family of EF‐hand calcium (Ca2+)‐binding proteins, whom extracellular hetero‐multimers, in complex with its cellular partner S100A8, form an antimicrobial complex, called calprotectin, involved in nutritional immunity and essential to limit bacterial infection (Zackular et al, 2015; Zygiel & Nolan, 2018). We now demonstrate that S100A9 expression levels are modulated upon LC maturation and inversely correlate with susceptibility to HIV‐based lentiviral transduction. Silencing of S100A9 expression in human primary skin‐isolated and monocyte‐derived LC (MoLC) led to an enhanced susceptibility to HIV‐1 infection while ectopic S100A9 expression rendered various cell lines refractory to retroviral infection. The reverse transcription step of the viral replication cycle was impaired in S100A9‐expressing cells. This correlated with an impaired viral capsid uncoating without any detectable association with incoming virus suggesting a distal mechanism of S100A9 action. In line with this, we evidenced an in vitro inhibitory function of S100A9 on HIV‐1 and MLV reverse transcriptase enzymatic activity modulated by MgCl2 concentrations. Our findings reveal, therefore, a totally novel and startling intracellular function of the human alarmin S100A9 which limits retroviral infections.
Results
TGF‐β‐dependent expression and subcellular localization of human S100A9 in monocyte‐derived LC
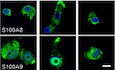
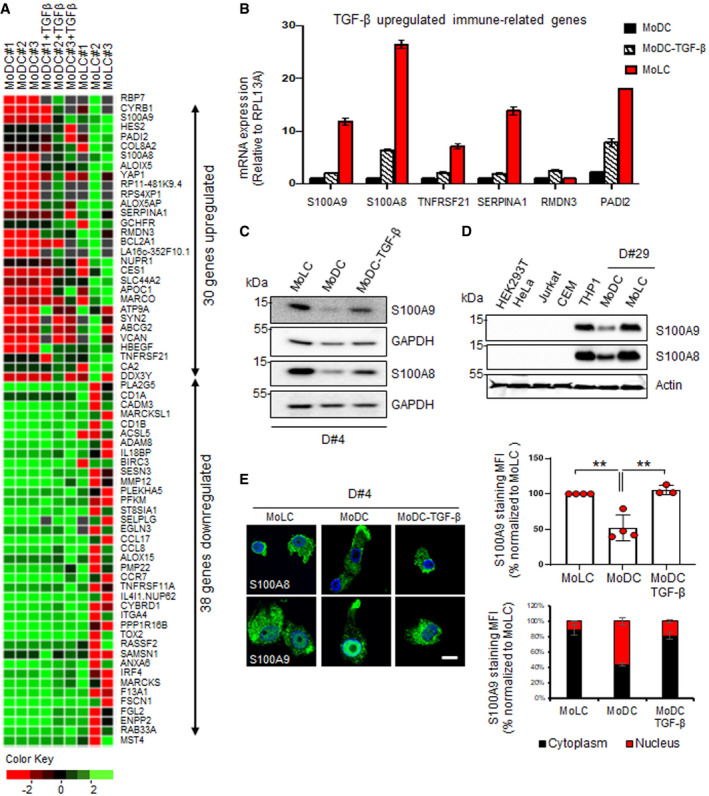
In order to look for TGF‐β‐dependent genetic signatures related to antiviral immunity, we conducted a high‐throughput RNA‐sequencing comparative screening between human primary monocyte‐derived Langerhans (MoLC) and monocyte‐derived dendritic cells (MoDC) treated or not for 24 h with TGF‐β (Fig EV1A). Gene expression values normalized to fragments per kilobase million (FPKM) for each experimental condition derived from each donor (N = 3) were then configured as normally distributed upon log‐transformation and displayed as hierarchical clustering heatmaps (Fig EV1B). A representative differential gene expression (DGE) analysis highlighted 30 genes significantly upregulated in MoLC and MoDC+TGF‐β (Fig 1A) compared to untreated autologous MoDC. Interestingly, the antimicrobial peptides pathway as well as pathways involved in cellular trafficking and vesicular budding were upregulated in MoLC (Appendix Fig S1). We previously reported a TGF‐β‐mediated antiviral activity transferable to other cell types (Czubala et al, 2016) suggesting that the viral restriction signature in LC would be driven via TGF‐β‐induced gene expression. From our transcriptomic data, we selected the highest relevant TGF‐β‐upregulated genes related to host immunity and inflammation (s100a8, s100a9, tnfrsf21, serpina1, rmdn3 and padi2) and confirmed their increased relative mRNA levels in MoLC and TGF‐β‐treated MoDC (Fig 1B). The presence of two members from the same protein family (S100A8 and S100A9) could emphasize a relevant role for these S100‐calcium‐binding proteins in TGF‐β‐dependent antiviral immune responses, and we therefore focused on those proteins. We validated higher protein expression levels for both S100A8 and S100A9 in MoLC compared to MoDC and further confirmed that TGF‐β treatment of MoDC for 24h induced an increase in the expression of both proteins (Fig 1C). Of note, besides the myelomonocytic THP1 cell line, other non‐myeloid cell types and laboratory‐adapted cell lines did not show detectable levels of S100A8 or S100A9 expression, neither at the mRNA nor at protein levels, even upon TGF‐β treatment (Figs 1D, and EV2A and B), suggesting that TGF‐β‐dependent expression of these cellular factors seemingly required a specific genetic context and conditional priming environment. When analysing the localization of both S100A8 and S100A9 in human monocyte‐derived cells, we noticed a different signal intensity and localization pattern for S100A9 in MoDC compared to MoLC or TGF‐β‐treated MoDC (Fig 1E). Indeed, while S100A9 staining seemed mainly nuclear in MoDC, its localization appeared rather cytoplasmic upon TGF‐β treatment of MoDC, reminiscent of the localization pattern observed in MoLC (Fig 1E). This differential cellular localization of S100A9 could therefore influence a cell type‐specific function of this protein.
Figure EV1. Differentiation of human monocyte‐derived cells and transcriptomic data heatmaps.
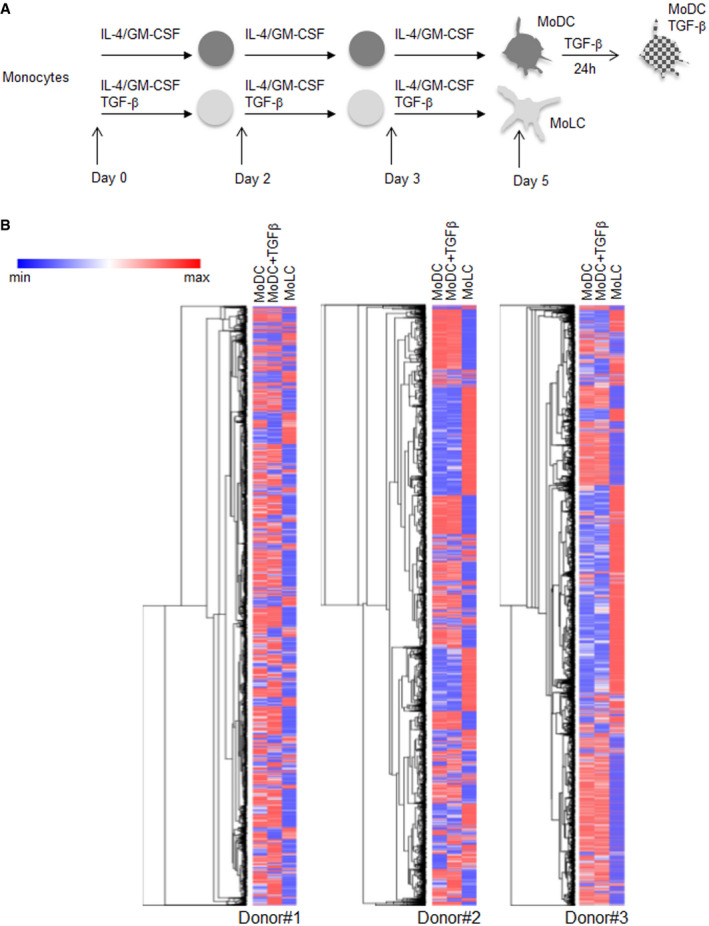
- Human blood CD14+ monocytes are purified and differentiated to monocytes‐derived MoDC and MoLC upon 6 days of incubation with cytokines as indicated.
- Heatmaps of logged normalized gene expression data obtained in monocyte‐derived cells treated as indicated are shown for each donor. Hierarchical clustering by Euclidian distance metric was performed on normalized dataset from each donor and represented as dendrograms (N = 3 donors).
Figure 1. TGF‐β regulates S100A9 expression and its subcellular localization in Langerhans cells (LC).
-
AHeat map showing differential expression of significant TGF‐β regulated genes in MoDC, MoLC and TGF‐β‐treated MoDC of independent experiments from three donors (n = 3). Fold change normalization to autologous MoDC was done on log2‐transformed normalized FPKM data and represented by heat map. Row clusterization was applied based on (Log2) fold change values. Green and red shades correspond to increased or decreased gene expression levels respectively.
-
BRT‐qPCR analysis of mRNA expression of indicated genes from MoLC or MoDC treated with TGF‐β for 16 h normalized to MoDC. Data represent mean values ± SD of triplicates from two donors.
-
C, D(C) S100A8 and S100A9 expression was determined by Western blotting of lysates from MoLC, MoDC and MoDC treated with TGF‐β for 24 h or (D) from cell lines as indicated. Loading controls were done with GAPDH or actin antibodies. Human primary cells results are representative of three donors, and the experiment shown is representative of three (n = 3).
-
ESubcellular localization analysis of S100A9 and S100A8 in MoLC, MoDC and MoDC‐TGF‐β. S100A9 mean fluorescence intensities (MFI) were normalized to MoLC and represented in the upper graph. The same was done for S100A9 cytoplasmic/nuclear MFI and shown in the lower graph. Scale bar: 5 µm. Graphs show normalized percentages ± SD of data from four different donors for MoLC (n = 4) and MoDC (n = 4) and three different donors for TGF‐β‐treated MoDC (n = 3). When applicable, Student's t‐test was performed to determine statistical significance (**P < 0.01).
Source data are available online for this figure.
Figure EV2. Human S100A8 and S100A9 expression and correlation with HIV infection.
-
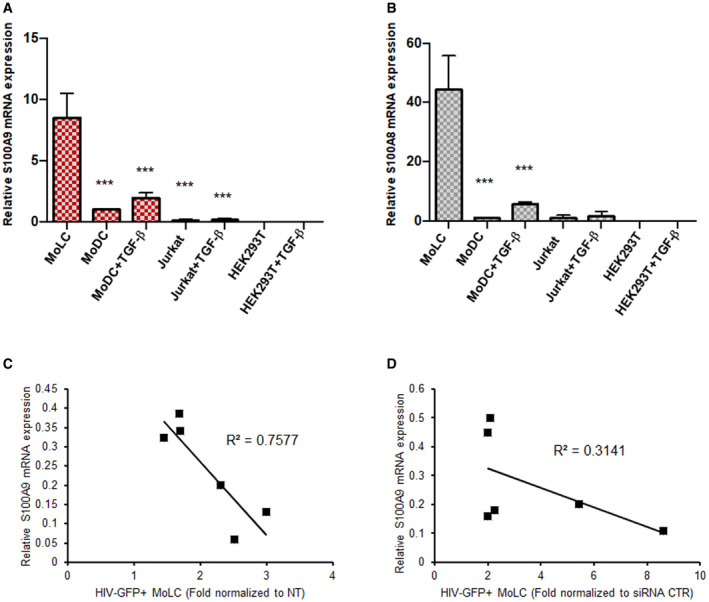
A, BTGF‐β‐dependent expression of S100A9 and S100A8 in primary cells and cell lines. RT‐qPCR analysis of mRNA expression of (A) S100A9 and (B) S100A8 from MoLC, MoDC, Jurkat or HEK293T treated or not with TGF‐β for 16 h normalized to MoDC. Data represent mean values ± SD of triplicates from three independent experiments for myeloid‐derived cells and Jurkat cells (n = 3) and two independent experiments for HEK293T cells (n = 2). When applicable, Student’s t‐test was performed to determine P values (***P < 0.001).
-
C, DCorrelation between S100A9 expression levels and susceptibility to HIV‐1 infection of LC. (C) A Linear regression analysis was done comparing levels of S100A9 transcripts measured 48 h after LPS maturation by RT‐qPCR and HIV‐GFP infection by flow cytometry (related to Fig 2E). Data were obtained from six different donors (n = 6). Pearson’s coefficient of determination (R 2) was calculated and shown (D) MoLC were transfected with siCTR or siS100A9 and mRNA expression of S100A9 was normalized as fold compared to siCtrl condition. Linear regression analysis was done comparing levels of S100A9 transcripts measured by RT‐qPCR and HIV‐1‐GFP infection by flow cytometry (related to Fig 3D). Data were obtained from six different donors (n = 6). Pearson’s coefficient of determination (R 2) was calculated and shown.
Human S100A9 intracellular expression inversely correlates with susceptibility to HIV‐1 infection of matured LC
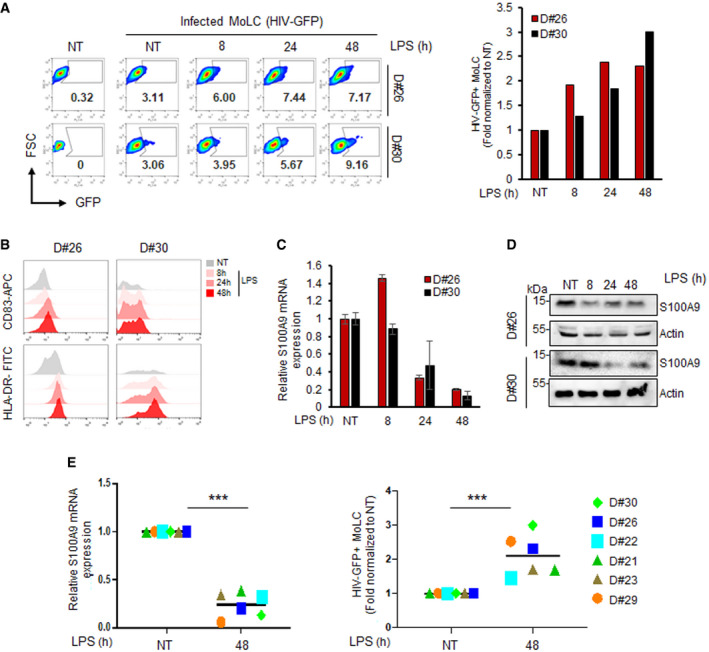
Because activation and maturation of LC were reported to enhance their susceptibility to HIV‐1 infection and favour viral transmission, we analysed MoLC maturation and susceptibility to HIV‐1 infection linked to S100A9 expression levels. LPS treatment of MoLC timely increased their susceptibility to GFP‐expressing VSV‐G pseudotyped HIV‐1‐based lentivectors (HIV‐GFP) (Fig 2A), as well as cell surface expression levels of MHC‐II molecules and the maturation marker CD83 as expected (Fig 2B). A decrease in S100A9 mRNA (Fig 2C) and protein levels (Fig 2D) was observed concomitantly with LPS‐induced maturation of MoLC. Data obtained with matured MoLC from 6 different donors evidenced a decreased intracellular S100A9 expression concomitant with an enhanced susceptibility to HIV‐GFP infection (Figs 2E and EV2C) suggesting a role for S100A9 in the control of HIV‐1 infection of MoLC.
Figure 2. S100A9 expression inversely correlates with MoLC maturation and susceptibility to HIV‐1 infection.
-
AMoLC from two different donors (donor #26 and #30) were left untreated (NT) or incubated with 1 µg/ml of LPS for indicated time points before infection with HIV‐GFP vectors for 48 h. The percentage of GFP+ cells was analysed by flow cytometry (left dot‐plots), and a graph representing the fold change of GFP+ cells, normalized to untreated infected MoLC, is shown on the right.
-
BNon‐treated (NT) and LPS‐treated MoLC, as before, were analysed by flow cytometry for the expression of CD83 and HLA‐DR.
-
C, D(C) RT‐qPCR and (D) Western blot analyses of S100A9 expression in MoLC from the two donors treated as above. RT‐qPCR data were represented as means ± SD.
-
EMoLC from six different donors (n = 6) were left untreated (NT) or incubated with LPS for 48 h and analysed for S100A9 expression by RT‐qPCR (left graph). MoLC treated as before were then transduced with HIV‐GFP vectors for 48 h and GFP+ cells were analysed by flow cytometry, and data were graphically represented as fold relative to non‐treated MoLC (right graph). Black horizontal line corresponds to the mean. When applicable, Student’s t‐test was performed to determine statistical significance (***P < 0.001).
Source data are available online for this figure.
Endogenous human S100A9 expression limits HIV‐1 transduction of MoLC
In order to confirm the link between S100A9 expression and resistance to HIV‐1 infection of MoLC, we silenced S100A9 expression in primary human MoLC treated with specific small‐interfering RNA (siS100A9‐MoLC) which reduced over 80% of S100A9 expression compared to control siRNA treatment (siCTR‐MoLC) as evidenced by RT‐qPCR and Western blot analyses (Fig 3A). Cells were then challenged with HIV‐GFP in order to bypass langerin‐mediated restriction of HIV‐1 entry. As expected, MoLC were poorly susceptible to HIV‐GFP upon 48‐h infection (Fig 3B). Interestingly, siS100A9‐MoLC displayed an increase in GFP+ cells compared to siCTR‐MoLC. Because of the envelope‐pseudotyped infection model used, this phenotype was seemingly due to a facilitated viral post‐entry replication step further inhibited upon treatment with the non‐nucleoside reverse transcriptase inhibitor nevirapine (NVP) (Fig 3C). A combinatorial analysis gathering data from 6 different donors demonstrated that silencing of S100A9 expression in MoLC was promoting an average of fourfold enhanced HIV‐GFP infection rate (Fig 3D). Thus, the highest susceptibility to HIV‐GFP infection was observed in cells showing the lowest S100A9 expression when compared to siCTR‐MoLC (Fig 3D) although not seemingly significant (Fig EV2D). These results evidence S100A9 as a new antiviral factor expressed in MoLC.
Figure 3. S100A9 expression restricts HIV‐1 infection of LC.
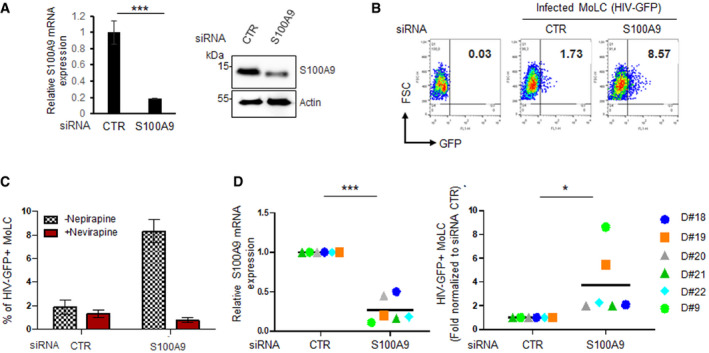
- MoLC were transfected with control (siCTR) or S100A9‐specific (siS100A9) siRNA and checked for S100A9 expression by RT‐qPCR (left) and Western blot (right). Shown is a representative experiment out of six. RT‐qPCR data were represented as means of duplicates ± SD.
- MoLC were then transduced with HIV‐GFP vectors for 48 h and GFP+ cells were analysed by flow cytometry. The experiment shown is representative of data from six different donors (n = 6).
- Cells transfected as above were pre‐treated or not with nevirapine and transduced with HIV‐GFP vectors for 48 h. The percentage of GFP+ MoLC was analysed by flow cytometry. Data represent means values ± SD from two different donors.
- MoLC from six different donors was transfected with siCTR or siS100A9 and challenged with HIV‐GFP vectors for 48 h. S100A9 expression (left graph) and the percentage of GFP+ cells (right graph) were analysed by RT‐qPCR and flow cytometry, respectively. Flow cytometry data are presented as fold relative to siCTR‐MoLC. Data represent means of fold values for each read‐out from six donors (n = 6).
Data information: When applicable, Student’s t‐test was performed to determine statistical significance (*P < 0.1; ***P < 0.001).
Source data are available online for this figure.
Endogenous S100A9 expression restricts HIV‐1 infection of MoLC and human epidermal LC
Importantly, the predominant cytoplasmic localization of S100A9 was confirmed in human skin‐derived epidermal CD1a+/langerin+ LC (eLC) (Fig 4A). Our flow cytometry data further evidenced that eLC were all S100A9‐positive (Fig 4B) and the CD1a+ epidermal cells, indeed, showed higher S100A9 protein expression levels compared to CD1a− epidermal cells and skin‐derived dermal cells (Fig 4C). When challenged with luciferase‐expressing HIV‐based lentiviral vectors (HIV‐Luc), human skin epidermal cells in which S100A9 expression was efficiently downregulated (Fig 4D) displayed a threefold to sevenfold enhancement of HIV‐Luc infection (Fig 4E). Importantly, nevirapine pre‐treatment of eLC led to a significant inhibition of emitted luminescence (Fig 4E), thus demonstrating a functional reverse transcription step in these cells challenged with HIV‐1‐derived lentivectors. These data are therefore confirming an intrinsic S100A9‐mediated HIV‐1 restriction activity in a relevant primary human ex vivo model.
Figure 4. S100A9 expression in human epidermal LC (eLC) restricts HIV‐derived LV transduction.
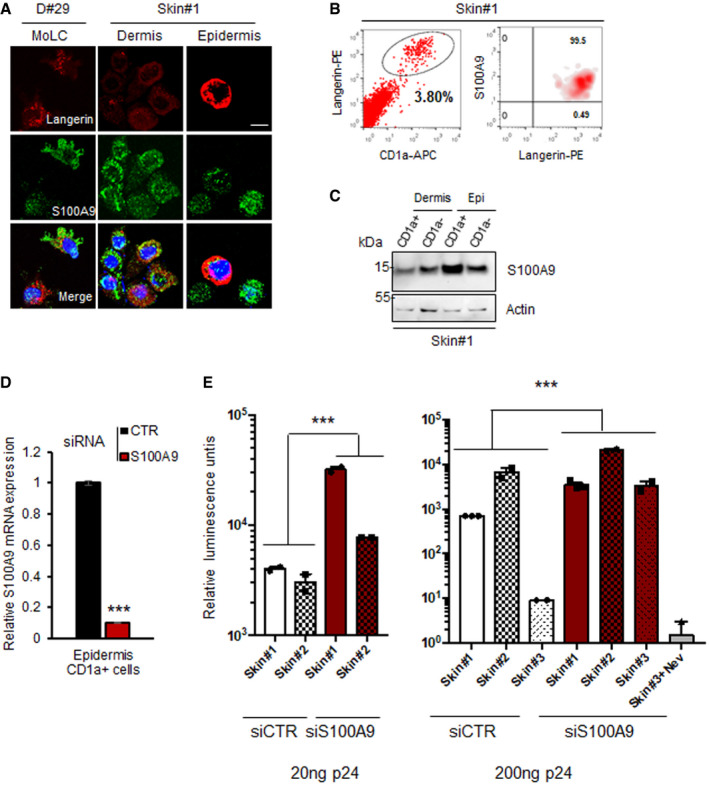
- MoLC, dermal and epidermal cells were subjected to confocal immunofluorescence microscopy for langerin and S100A9 expression analysis. Scale bar: 5 µm.
- Representative experiment of human epidermal cells analysed by flow cytometry for the expression of langerin, CD1a and S100A9 (Skin samples from n = 2 donors). The enriched CD1a+/langerin+ population representing human eLC is shown (black circle).
- Lysates from CD1a+ and CD1a− cells from human skin dermis or epidermis (Epi) were subjected to immunoblotting for the expression of S100A9 proteins. Loading control was done with anti‐actin (n = 2).
- RT‐qPCR analysis of S100A9 expression in human CD1a+ epidermal cells transfected with siCTR or siS100A9 (skin samples from n = 2 donors). RT‐qPCR data were represented as means ± SD.
- Human epidermal cells treated as before were challenged for 48 h with 20 and 200 ng of p24 of HIV‐Luc. When indicated, cells were pre‐treated with 10 μM nevirapine for 30 min before viral challenge. Luciferase activities measured in duplicates for each condition from two (infection with 20 ng P24) or three (infection with 200 ng P24) different skin samples were represented on a graph as means of relative luminescence units (RLU) ± SD.
Data information: When applicable, Student’s t‐test was performed to determine statistical significance (***P < 0.001).
Source data are available online for this figure.
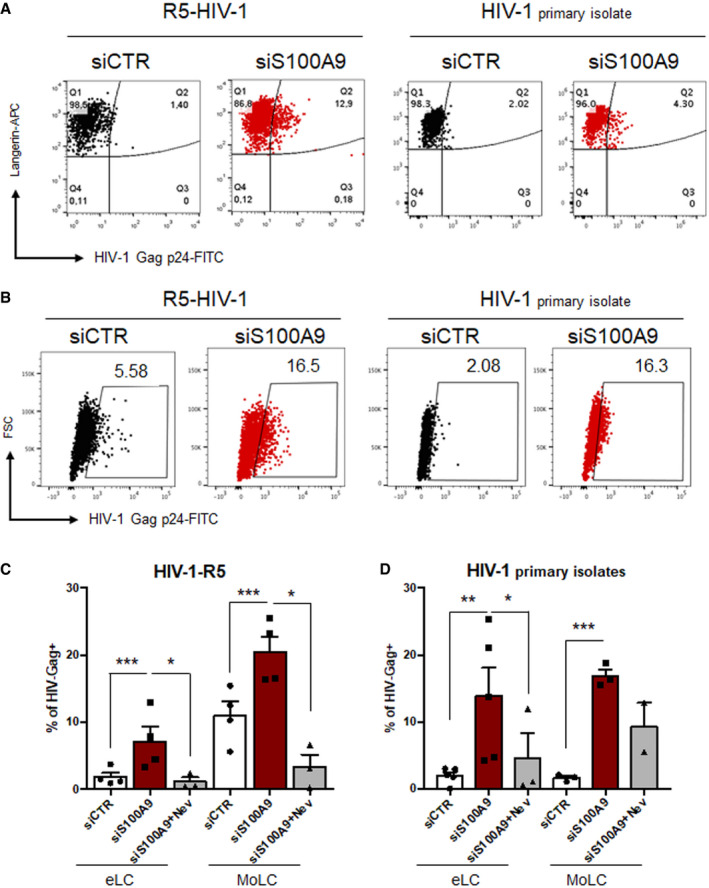
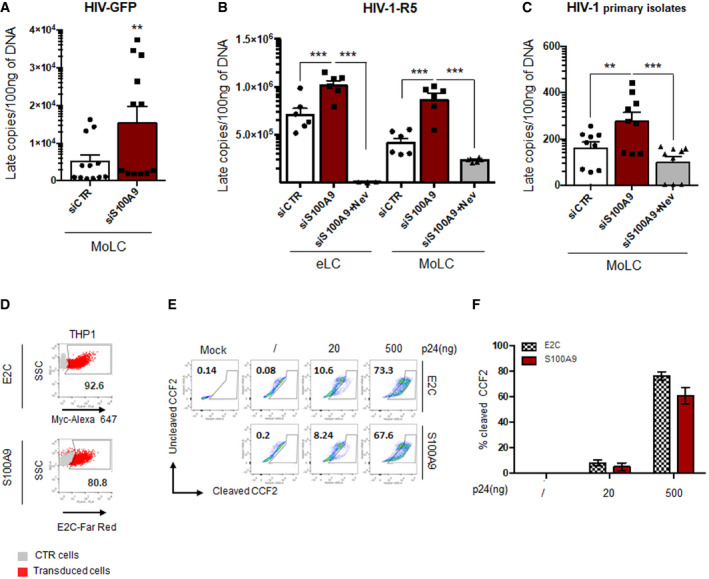
We then wanted to analyse whether this S100A9 antiviral phenotype could be also functional upon HIV‐1 wild‐type infection of human primary MoLC and eLC. We thus challenged siCtrl‐ or siS100A9‐eLC with HIV‐1‐R5 for 72 h and evidenced a 3‐ to ~ 10‐fold increase in HIV‐1 Gag p24 staining in langerin+ eLC silenced for S100A9 expression (Fig 5A, left panels). Importantly, siS100A9‐eLC evidenced also an increased susceptibility to HIV‐1 infection compared to siCtrl‐eLC upon challenge with HIV‐1 primary isolate (Fig 5A, right panels). The same enhanced susceptibility to HIV‐1‐R5 and HIV‐1 primary isolate infection was observed in MoLC silenced for S100A9 expression (Fig 5B). When collected from all donors, our data clearly showed a significant increase in HIV‐1‐R5 (Fig 5C) and HIV‐1 primary isolate (Fig 5D) infection of human primary LC in which S100A9 expression was silenced, therefore confirming the role of S100A9 in limiting HIV‐1 infection.
Figure 5. S100A9 expression inhibits wild‐type HIV‐1 infection of MoLC and eLC.
-
AEpidermal cells transfected with control siRNA (siCtrl) or S100A9‐targeting siRNA (siS100A9) were challenged for 72 h with 200 ng P24 of HIV‐1‐R5 (left dot‐plots) or HIV‐1 primary isolate (right dot‐plots). Cells were fixed, permeabilized and stained with langerin (Y‐axis) and HIV Gag P24 (X‐axis) fluorescently coupled antibodies. Samples were acquired on a flow cytometer. The experiment shown is representative of four donors for HIV‐1‐R5 (n = 4) and five donors for HIV‐1 primary isolates (n = 5).
-
B–DThe same as above was done but on MoLC gated by size (FSC). The experiment shown is representative of four donors for HIV‐1‐R5 (n = 4) and three donors for HIV‐1 primary isolates (n = 3). Data collected from all donors were compiled and represented as bar charts for cells challenged with (C) HIV‐1‐R5 and (D) HIV‐1 primary isolates. Nevirapine (Nev) (10 μM) was used as control when indicated and data were represented as means ± SD of HIV‐Gag+ cells from at least 2 (for siS100A9‐MoLC infected by HIV‐1 primary isolates) to 3 donors. When applicable, Student’s t‐test was performed to determine statistical significance (*P < 0.1;**P < 0.01; ***P < 0.001).
Ectopic human S100A9 expression in human non‐myeloid cells restricts HIV‐1 infection
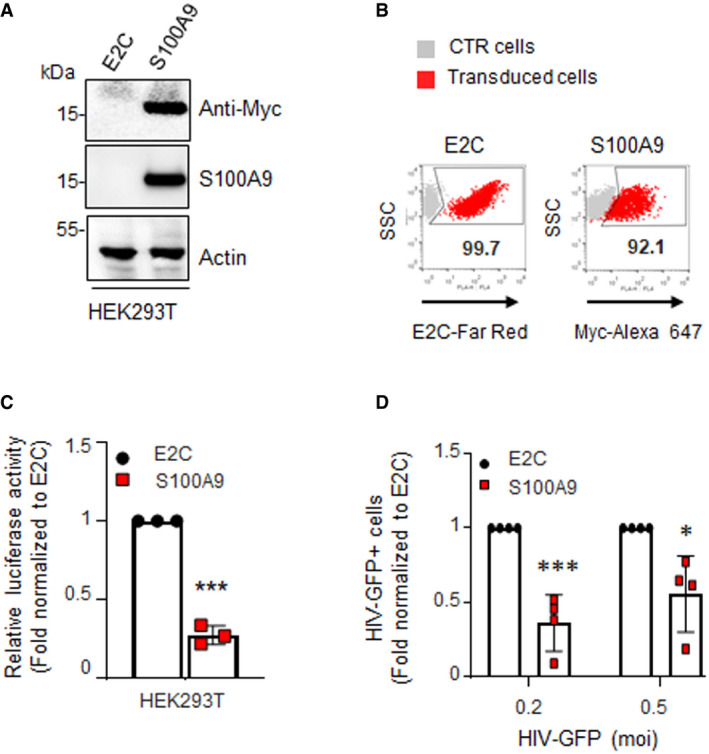
In order to analyse whether S100A9‐mediated anti‐HIV‐1 activity could be transferred to a non‐myeloid cell type, HEK293T cells were transduced with lentiviral vectors expressing Myc‐tagged human S100A9 protein under control of the spleen focus‐forming virus (SFFV) promoter and carrying a puromycin resistance gene to obtain a homogenous S100A9‐expressing cell line (S100A9‐HEK293T). A cell line control was also raised in parallel upon transduction with lentiviral vectors expressing an irrelevant tagged E2Crimson protein (E2C). Ectopic expression of S100A9 and E2C was controlled by Western blotting (Fig 6A) or flow cytometry (Fig 6B) and showing homogenous levels of expression. When challenged for 48h with HIV‐Luc, S100A9‐HEK293T showed 78% reduction of luciferase activity compared to their E2C‐expressing counterparts (Fig 6C). Of note, the same trend was observed when S100A9‐HEK293T cells were challenged with HIV‐GFP as evidenced by a 60–70% reduction in GFP+ cells in average (Fig 6D). Interestingly, the S100A9‐mediated antiviral effect appeared less pronounced at higher MOI in agreement with a partially saturable viral restriction activity (Fig 6D).
Figure 6. Ectopic expression of human S100A9 in HEK293T cells inhibits HIV infection.
-
A, BS100A9 expression was analysed by (A) immunoblotting or (B) flow cytometry in stably transduced HEK293T cells using anti‐myc and anti‐S100A9 as indicated. Immunoblot loading controls were done with anti‐actin. Flow cytometry negative and positive controls were done with non‐transduced parental cells (in grey) and HEK293T cells stably expressing the red‐emitting fluorescent protein E2C (E2C‐Far Red), respectively. Experiments shown are representative of three (n = 3).
-
CHEK293T were infected with HIV‐Luc for 48 h (10 ng of p24). Graphs represent fold RLU means ± SD of infected S100A9‐expressing cells normalized to infected E2C‐expressing cells from duplicates of three independent experiments (n = 3).
-
DE2C‐ and S100A9‐expressing HEK293T cells were infected with the indicated MOI of HIV‐GFP for 48 h and GFP+ cells were analysed by flow cytometry. Mean values ± SD from four independent experiments (n = 4) were normalized to the E2C‐HEK293T control and represented in graph.
Data information: When applicable, Student’s t‐test was performed to determine statistical significance (*P < 0.1***P < 0.001).
Source data are available online for this figure.
Engineered human S100A9 expression in CD4+ T cell lines abolishes X4‐tropic HIV‐1 infection
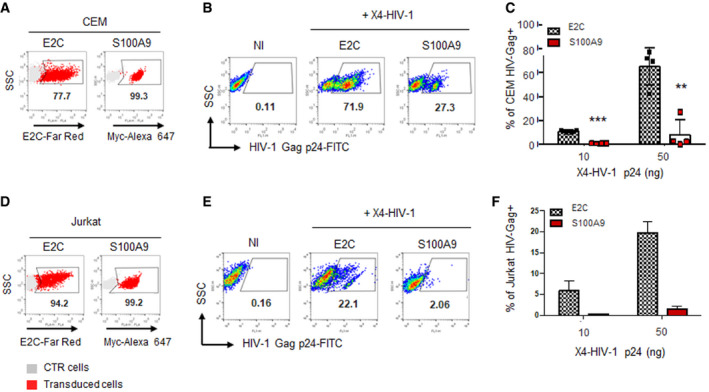
Our data above demonstrated that S100A9 could inhibit HIV‐based lentiviral vector infection in human myeloid or engineered epithelial cells which, however, do not represent relevant cellular targets for HIV‐1 replication and productive infection. As previously shown, CD4+ T cells do not express detectable levels of S100A9 (Fig EV2A) and we therefore decided to establish specific human S100A9‐expressing CD4+ T cell lines (CEM and Jurkat) and analyse their susceptibility to wild‐type HIV‐1 infection. As shown in flow cytometry analyses, S100A9‐CEM and S100A9‐Jurkat transduced cells were all expressing homogenous amounts of S100A9 (Fig 7A and D, respectively). As before, cell lines expressing an irrelevant tagged protein (E2C‐CEM and E2C‐Jurkat) were used as control. Importantly, all engineered cell lines were expressing expected levels of CD4 and CXCR4 and were not showing any major alteration in morphology or viability (Appendix Fig S2). Flow cytometry data from HIV‐1 X4‐tropic challenged S100A9‐CEM (Fig 7B) and S100A9‐Jurkat (Fig 7E) were evidencing a marked decrease in the percentage of HIV‐Gag P24‐positive cells compared to the E2C‐expressing control cells. Experimental replicates showed an average of 80 and 90% reduction in HIV‐Gag P24 staining obtained, respectively, in S100A9‐CEM (Fig 7C) and S100A9‐Jurkat cells (Fig 7F) upon 72 h challenge with wild‐type X4‐tropic HIV‐1. Our data therefore confirmed the S100A9‐mediated antiviral phenotype in CD4+ T lymphoid cells engineered to stably express S100A9 and challenged with fully infectious X4‐tropic HIV‐1 virus.
Figure 7. Ectopic human S100A9 expression in CD4+ T lymphoid cell lines potently restricts X4‐tropic wild‐type HIV‐1 infection.
-
A–F(A, D) E2C‐ and S100A9‐expressing CEM and (D) E2C‐ and S100A9‐expressing Jurkat CD4+ T cells were analysed for the expression of E2C and S100A9 by flow cytometry. (B, E) Cells from above were infected with X4‐tropic HIV‐1 for 72 h and processed for flow cytometry analysis upon staining with anti‐HIV Gag p24‐FITC. Dot‐plots from representative experiments of (B) CEM or (E) Jurkat infected with X4‐tropic HIV‐1 (50 ng of p24 per 105 cells) are shown. Control cells (NI) correspond to non‐infected E2C‐expressing cells. (C, F) The percentage of HIV‐Gag p24+ cells from four independent experiments for CEM (n = 4) and two for Jurkat (n = 2) analysed by flow cytometry were graphically represented as means of HIV‐Gag+ cells ± SD. When applicable, Student’s t‐test was performed to determine statistical significance (**P < 0.01; ***P < 0.001).
Human S100A9 possesses a broader antiretroviral activity transferable to non‐human cells
We recently reported a SAMHD1‐independent anti‐HIV‐1 activity present in Langerhans cells, as well as TGF‐β‐treated monocyte‐derived cells, and seemingly acting at the reverse transcription (RT) step of HIV‐1 replication cycle (Czubala et al, 2016). If S100A9 contributes to this inhibitory effect on RT, this may not be restricted to HIV‐1 and could impact replication of other retroviruses. As a proof of concept, we first transfected the murine cell line MDTF with plasmids either empty or encoding myc‐tagged human S100A9. Ectopic human myc‐tagged S100A9 expression was controlled by Western blotting (Fig 8A), and cells were challenged with YFP‐expressing Moloney murine leukaemia virus (MMLV‐YFP) for 48 h. Cells were then analysed by flow cytometry for fluorescence emission and S100A9‐MDTF showed a twofold decrease in YFP+ cells when compared to control cells (Fig 8B). We extended this analysis to the non‐primate CHO cell line stably expressing either the irrelevant control protein E2Crimson (E2C‐CHO) or human myc‐tagged S100A9 (S100A9‐CHO) (Fig 8C) which were then challenged with varying doses of MMLV‐YFP. Our data evidenced a twofold to threefold reduction in YFP+ cells in S100A9‐CHO when compared to E2C‐CHO (Fig 8D), suggesting a broader S100A9‐mediated antiretroviral activity. Interestingly, however, we did not observe any effect of S100A9 expression in HEK293T and THP‐1 cells upon infection by luciferase‐expressing influenza A virus (IAV‐Luc), arguing against a general S100A9‐dependent antiviral effect (Fig EV3A).
Figure 8. Human S100A9 expression restricts ex vivo MMLV replication and inhibits MMLV RTase activity in vitro .
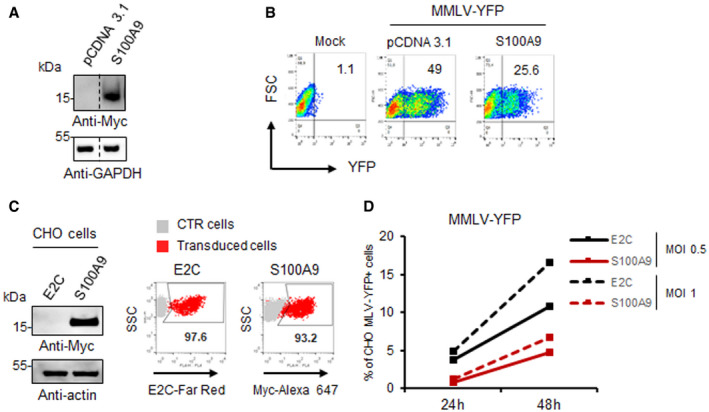
- MDTF cells were transfected with an empty vector (pCDNA3.1) or a vector expressing myc‐tagged human S100A9 whose expression was analysed by Western blotting with anti‐myc 48 h post‐transfection.
- MDTF cells were then challenged with MMLV‐YFP vectors (MOI 1) for 48 h. Flow cytometry dot‐plots from a representative experiment are shown.
- Human S100A9 expression in CHO cells was analysed by immunoblotting or flow cytometry as in Fig 7.
- E2C‐ and S100A9‐expressing CHO cells were challenged with indicated MOI of MMLV‐YFP vectors for 24 h or 48 h. The percentages of YFP+ CHO‐infected cells analysed by flow cytometry and data were represented on graphs.
Source data are available online for this figure.
Figure EV3. S100A9 acts at the RT step and does not affect IAV replication.
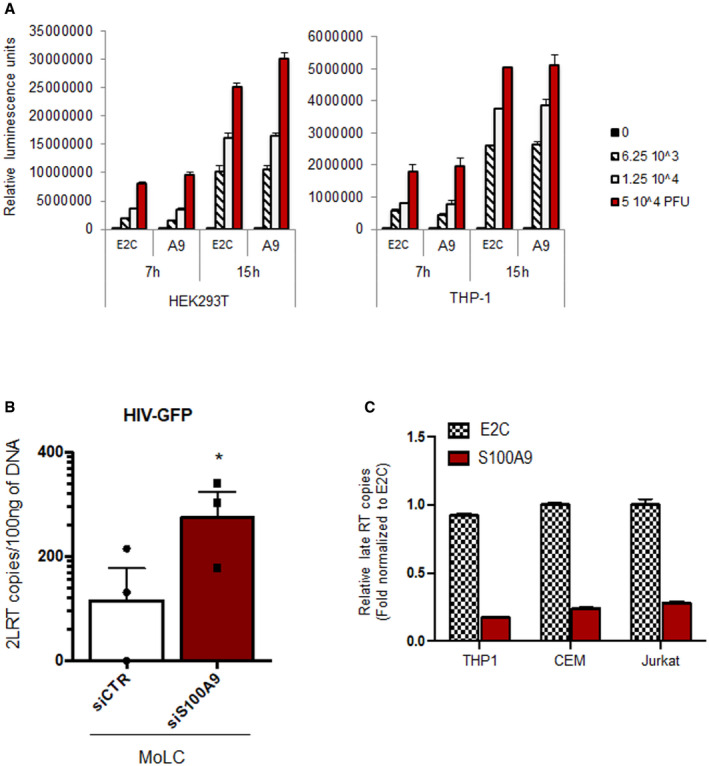
- HEK 293T and THP‐1 cells stably expressing E2‐crimson (E2C) or S100A9 (A9) were uninfected (0) or challenged with 6.25 × 10³, 1.25 × 10⁴ or 5 × 10⁴ PFU/well of IAV NanoLuc. Cells were lysed 7 h or 15 h post‐infection, as indicated, and luciferase activity measured. Graph represents the mean of triplicates ± SD.
- MoLC were transfected with siCTR or siS100A9 and infected with HIV‐GFP vectors for 24 h. DNA was extracted, and 2‐LTR copies were quantified as copies for 30 ng DNA ± SD (from N = 3 donors) and graphically represented as bar charts. When applicable, Student’s t‐test was performed to determine statistical significance (*P < 0.1).
- Total DNA was extracted from E2C‐ or S100A9‐expressing THP1 cells infected with HIV‐Luc (10 ng p24) and from CEM and Jurkat cells infected with X4‐tropic HIV‐1 (10 ng of p24) for 24 h to quantify late RT products by qPCR. Graphs represent relative means ± SD of triplicates from two independent experiments (n = 2).
Human S100A9 expression restricts HIV‐1 infection at the reverse transcription step
The broad activity on retroviral infection suggested an impact of human S100A9 on a common step of the viral replication cycle, like reverse transcription (RT), hence reminiscent of our previous observation (Czubala et al, 2016). We therefore wondered if S100A9 expression could impact this viral replication step upon HIV‐1 infection. We challenged siS100A9‐ and siCTR‐MoLC from 4 different donors with HIV‐GFP to analyse the intracellular RT products and derivatives. Our results showed that the downregulation of S100A9 expression in MoLC led to a 3‐ to 30‐fold increase in late RT products when compared to siRNA‐CTR MoLC (Fig 9A). These results were further strengthened by an increase in copies of 2‐LTR circular viral DNA observed in siS100A9‐MoLC from each donor (Fig EV3B). The relevance of S100A9‐mediated inhibition of HIV‐1 reverse transcription step was assessed in experiments performed on eLC or MoLC infected by HIV‐1‐R5 and evidencing a significant increase in late RT products in both siS100A9‐eLC and siS100A9‐MoLC compared to siCtrl‐transfected cells (Fig 9B). We also infected MoLC with HIV‐1 primary isolates and further confirmed the increased late RT products in siS100A9‐MoLC although the levels measured were very low (Fig 9C). Importantly, cells challenged with HIV‐1‐R5 or HIV‐1 primary isolates were also pre‐treated with the non‐nucleoside reverse transcriptase inhibitor nevirapine which strongly inhibited late RT products synthesis therefore confirming HIV‐1 productive infection of MoLC and eLC (Fig 9B and C). The negative impact of human S100A9 on HIV‐1 reverse transcription was also confirmed in S100A9‐CEM and S100A9‐Jurkat infected for 72 h with wild‐type X4‐tropic HIV‐1 and which were evidencing ~ 80% reduction in late RT products compared to levels obtained in E2C‐expressing control cells (Fig EV3C). Of note, the myelomonocytic cell line THP‐1, known to be relatively resistant to lentivirus infection and to express endogenous S100A9 (see Fig 1E), engineered to express ectopic myc‐tagged human S100A9 (S100A9‐THP1) showed a further enhanced inhibitory effect on late RT products when compared to E2C‐THP1 counterparts (Fig EV3C). In order to preclude any S100A9‐mediated effect at viral entry, we conducted a BLAM‐Vpr fusion assay as previously described (Cavrois et al, 2002; Doyle et al, 2018). Thus, S100A9‐THP1 and E2C‐THP1 (Fig 9D) were challenged with varying doses of BLAM‐Vpr‐containing lentiviral vectors and analysed by flow cytometry for their capacity to cleave the β‐lactamase substrate CCF2 (Fig 9E). Our data from replicates of S100A9‐THP1 and E2C‐THP1 showed no significant difference in β‐lactamase activity upon viral challenge (Fig 9F), therefore arguing against an effect of S100A9 at viral entry.
Figure 9. Human S100A9 negatively regulates HIV‐1 reverse transcription.
- MoLC were transfected with siCTR or siS100A9 and infected with HIV‐GFP vectors for 24 h. DNA was extracted and copies of late reverse transcripts were quantified by qPCR. Shown data were collected from experimental triplicates ± SD of four different donors (n = 4).
- MoLC or eLC previously transfected with control siRNA (siCtrl) or S100A9‐targeting siRNA (siS100A9) were challenged with 200 ng P24 of HIV‐1‐R5 for 24 h. Nevirapine (10 μM) was used as a control of RT inhibition. Total DNA was then extracted and late RT products were quantified by qPCR and normalized as copies/100 ng DNA using a standard curve based on the serial dilution of a defined and linearized HIV‐1 plasmid. Duplicates from three different donors are shown (n = 3). Nevirapine (10 μM) treatment was performed once on each donor to control RT inhibition. Data were represented as means ± SD.
- The same experimental procedure as above was done with HIV‐1 primary isolates. Data in triplicates ± SD from three different donors (n = 3) were collected and represented as bar charts.
- E2C‐expressing (upper dot‐plot) and S100A9‐expressing (lower dot‐plot) THP‐1 cells were controlled for E2C and S100A9 expression by flow cytometry upon analysis of fluorescence as indicated in the x‐axis label. Parental untransduced THP‐1 cells were used as control cells (grey dots). The experiment shown is representative of 3.
- E2C‐ or S100A9‐expressing THP1 were left uninfected (/) or infected for 3 h with the indicated p24 amounts of HIV‐1 NL4‐3/Nef‐IRES‐Renilla viruses containing BlaM‐VPR. Cells were processed for Blam‐Vpr assay and the percentage of cleaved CCF2 was analysed by flow cytometry. The mock condition corresponds to unstained E2C‐expressing cells. Dot‐plots from a representative experiment are shown.
- Means ± SD of duplicates from two independent experiments are presented in the graph (n = 2).
Data information: When applicable, Student’s t‐test was performed to determine statistical significance (**P < 0.01; ***P < 0.001).
Human S100A9 inhibits reverse transcriptase activity and alters HIV‐1 capsid uncoating
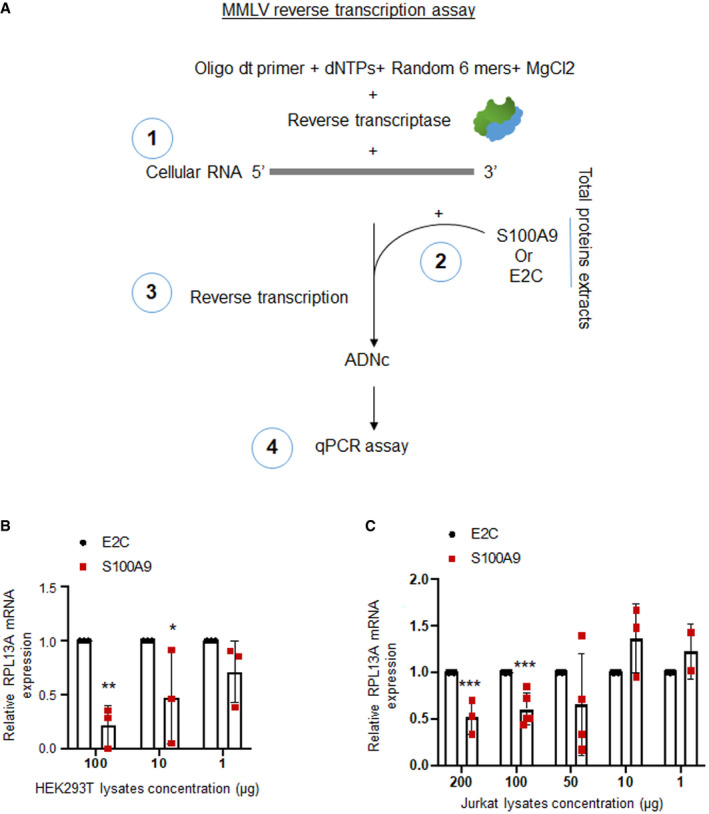
Our data above prompted us to further assess whether S100A9 presence could directly impact on RTase activity. We first took advantage of the fact that most of the commercially available reverse transcription assays kits are based on the MMLV RTase activity to measure the direct effect of S100A9‐containing cell extracts on in vitro MMLV RTase activity on a reporter cellular mRNA (Fig EV4A). Our data showed a dose‐dependent inhibition of MMLV RTase activity when mixing cellular extracts originating from S100A9‐HEK293T (Fig EV4B) or S100A9‐Jurkat (Fig EV4C) compared to control E2C‐containing cellular extracts. Interestingly, the effect of both S100A9‐HEK293T‐ and S100A9‐Jurkat‐derived extracts on MMLV RTase activity levels was attenuated at lower protein concentrations becoming almost equivalent to those observed with E2C‐expressing extracts. These data confirmed a critical threshold level of S100A9 expression to inhibit RTase activity in line with a saturable S100A9‐mediated intrinsic antiviral function.
Figure EV4. MMLV reverse transcription assay.
-
A(1) Reactions including 20 ng of RNA extracted from HeLa cells, oligo dt primer, dNTPs, random 6 mers and MLV reverse transcriptase were prepared in presence of 3 mM of MgCl2 following TAKARA protocols. Reactions were then supplemented with (2) protein lysates freshly extracted from cell lines of interest. (3) Reverse transcription of RNA allowed conversion to cDNA. (4) Reporter reverse transcripts (RPL13A in our assays) were then measured by qPCR.
-
B, CMMLV RT assay relying on the conversion of 20 ng of extracted RNA from HeLa cells to cDNA in presence of indicated amounts of fresh E2C‐expressing or S100A9‐expressing HEK293T (B) and Jurkat (C) protein lysates. RPL13A reverse transcripts were then measured by qPCR, and the mean of triplicates ± SD was represented upon normalization to E2C‐expressing lysates (n = 2 for the Jurkat extract 1 μg and n = 3 for all other conditions). When applicable, Student’s t‐test was performed to determine P values (*P < 0.1; **P < 0.01; ***P < 0.001).
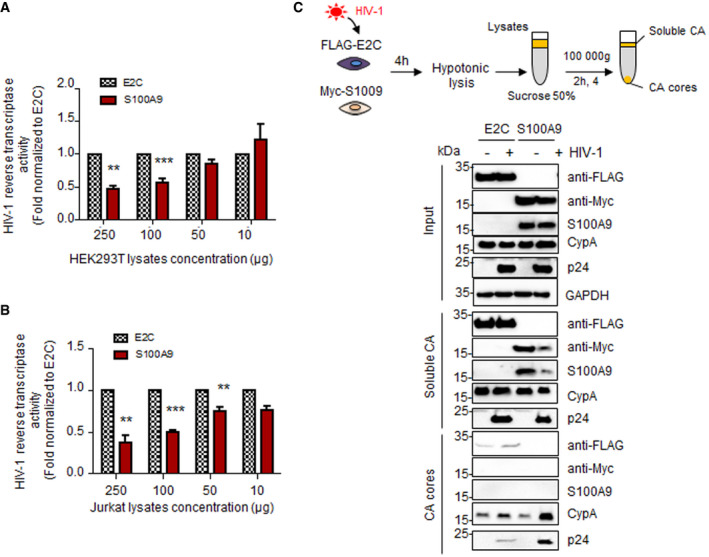
Then, we used a HIV‐1 reverse transcriptase assay (see Methods), in order to quantify the RTase activity in presence of either E2C‐ or S100A9‐containing cellular extracts. Our data showed that HIV‐1 RTase activity was significantly inhibited when cellular extracts from S100A9‐HEK293T (Fig 10A) or S100A9‐Jurkat (Fig 10B) were added to the reaction compared to E2C‐containing extracts. As for MMLV RTase activity, the S100A9‐mediated inhibition was dose‐dependent. Because viral reverse transcription is tightly coupled to uncoating, we then performed a Fate‐of‐Capsid assay upon 4 h of HIV‐Luc challenge in E2C‐ or S100A9‐expressing HEK293T cells to analyse viral cores status (Fig 10C). Our data showed a marked stabilization of HIV cores and a lower content of soluble HIV‐P24 capsid protein in S100A9‐expressing cells compared to E2C‐expressing control cells (Fig 10C). Stabilized HIV cores in S100A9‐expressing cells retained, however, their integrity as evidenced by the enhanced remaining association with cyclophilin A, a known cellular partner (Fig 10C) and therefore mechanistically linking RT inhibition with an altered uncoating. Interestingly, our experiments failed to detect an association between immunoprecipitated S100A9 and incoming viral capsid upon HIV‐Luc challenge of S100A9‐expressing HEK293T cells (Fig EV5A), rather suggesting a distal mechanism of S100A9 function on the RT step.
Figure 10. Human S100A9 inhibits HIV‐1 reverse transcriptase activity and uncoating.
-
A, BColorimetric HIV‐1 RT activity assay was adapted from the manufacturer’s protocol using constant amount of HIV‐1 RT (0.5 ng) and increasing amounts of lysates from (A) E2C‐ and S100A9‐expressing HEK293T and (B) E2C‐ and S100A9‐expressing Jurkat cells. Means ± SD colorimetric data obtained from at least two independent experiments were normalized to E2C‐expressing lysates and shown on graphs.
-
CSchematic description of fate‐of‐capsid assay is displayed above. HEK293T expressing E2C or S100A9 was transduced with HIV‐Luc (10 ng p24) for 4 h. Cells were then subjected to the fate‐of‐capsid assay (see Materials and Methods) in order to pull‐down intact cores (CA cores) (recovered in the pellet). Equal volumes from the soluble (top fraction) and pelleted (down fraction) materials were analysed by Western blotting in order to evaluate the presence of p24 (CA), CypA, S100A9 and E2C proteins.
Data information: When applicable, Student’s t‐test was performed to determine statistical significance (*P < 0.1;**P < 0.01; ***P < 0.001).
Source data are available online for this figure.
Figure EV5. HIV‐1 cores are not associated with immunopurified S100A9 and increasing MgCl2 concentrations overcome S100A9‐mediated RTase inhibition in vitro .
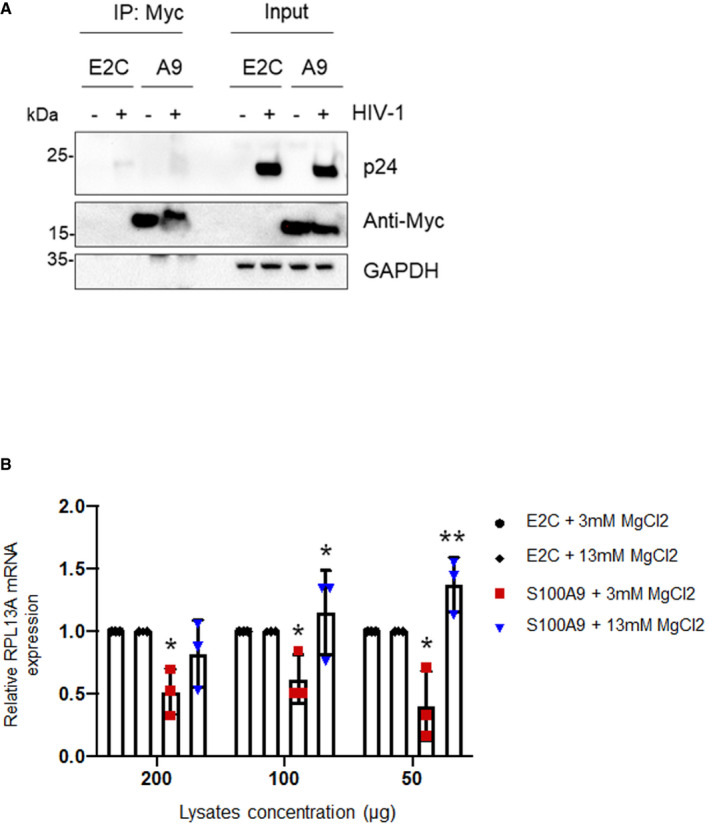
- HEK293T cells expressing FLAG‐E2C or Myc‐S100A9 were transduced with HIV‐Luc for 4 h (10 ng P24). Cells were then lysed and processed for S100A9 immunoprecipitation using Myc Abs‐coated beads. Cell inputs and immunoprecipitates were analysed for the presence of Myc‐S100A9 and HIV‐1 cores (p24) by Western blotting. GAPDH was analysed for input loading control.
- MLV RTase assays were performed in presence of indicated amounts of fresh E2C‐ and S100A9‐Jurkat protein lysates and indicated MgCl2 concentrations. RPL13A transcripts were then measured by qPCR, as before, and the mean ± SD triplicate values from three independent experiments were normalized to E2C‐expressing lysates. When applicable, Student’s t‐test was performed to determine P values (*P < 0.1; **P < 0.01).
Source data are available online for this figure.
Purified human S100A9 is sufficient to inhibit RTase activity in a ion‐dependent manner
In order to further characterize the effect of S100A9 on RTase activity in vitro, we conducted experiments in which HEK‐derived immunopurified and eluted E2C or human S100A9 were added into the enzymatic reaction instead of cellular extracts (Fig 11A). Expression of E2C and S100A9 before and after elution was controlled by Western blotting (Fig 11A, right) and eluates were used in enzymatic reactions as before. Our results showed that HIV‐1 RTase activity was markedly reduced in presence of increasing amounts of HEK‐derived immunopurified S100A9 compared to HEK‐derived immunopurified E2C (Fig 11B). Because of the reported metal divalent‐ion chelation activity of S100A9, we further investigated the impact of human S100A9 on HIV‐1 RTase activity in presence of varying MgCl2 concentrations. Interestingly, enhancing MgCl2 concentrations in S100A9‐containing reactions appeared to rescue HIV‐1 RTase activity levels towards control levels (Fig 11C). Noteworthy, we also observed that the concentration of MgCl2 was also another critical parameter modulating S100A9‐mediated inhibition of MMLV RTase activity (Fig EV5B) confirming the broad and panretroviral effect of S100A9. Our results suggest that S100A9‐mediated inhibition of reverse transcriptase activity occurs by limiting metal divalent‐ion availability therefore revealing a novel mode of intrinsic immunity against retroviral infection.
Figure 11. Human S100A9 inhibits HIV‐1 reverse transcriptase activity in vitro in a divalent cation‐dependent manner.
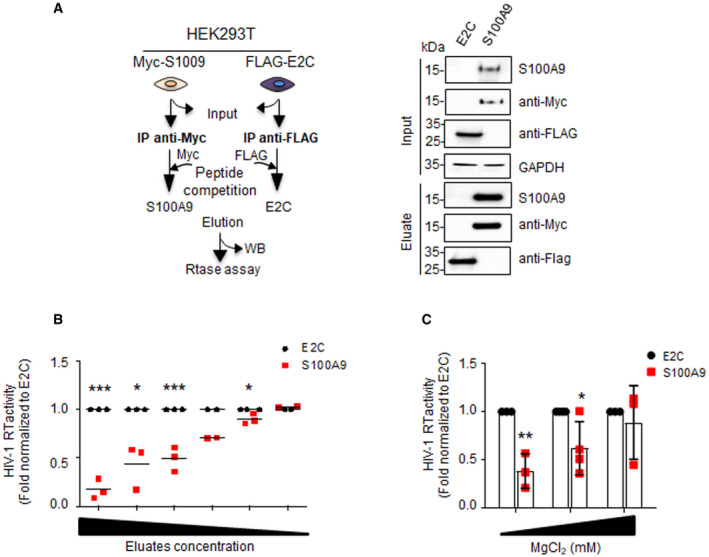
- Schematic description of E2C and S100A9 immunopurification and elution protocol (left panel) and Western blot analyses of total extracts (input) and eluated immunopurified E2C and S100A9 (right panels).
- Colorimetric HIV‐1 RT activity assay using constant amount of HIV‐1 RT (0.5 ng) and performed with increasing amounts of immunopurified E2C and S100A9 eluates. Means ± SD colorimetric data obtained from duplicates of depicted independent experiments were normalized to E2C‐containing conditions and shown on graphs. Each data point in the graph represents an independent experiment.
- Colorimetric HIV‐1 RTase activity was performed with 10 µg of immunoprecipitated and eluted E2C or S100A9 in presence of increasing MgCl2 concentrations. Means ± SD colorimetric data obtained from at least three independent experiments were normalized to E2C‐containing conditions and shown on graphs.
Data information: When applicable, Student’s t‐test was performed to determine statistical significance (*P < 0.1;**P < 0.01; ***P < 0.001).
Source data are available online for this figure.
Discussion
Our study identified the human alarmin S100A9 (also categorized as a DAMP) as a TGF‐β‐regulated gene whose expression and subcellular localization correlate with cell susceptibility to HIV‐1 infection. Indeed, primary human LC lacking S100A9 expression evidenced a higher susceptibility to HIV infection while cell lines engineered to stably express human S100A9 became significantly resistant. Interestingly, S100A9‐expressing cells were also restricting MMLV replication therefore suggesting a broader impact of S100A9 on retroviral infections. This hypothesis was also strengthened by experiments showing that reverse transcription was the step of the retroviral replication impacted by S100A9 expression. This was further reinforced by a defect in uncoating upon viral challenge of S100A9‐expressing cells. Finally, we demonstrated that immunopurified human S100A9 could inhibit HIV‐1 reverse transcriptase activity in vitro in a Mg2+‐dependent manner.
Intrinsic immunity represents an arm of the host innate immune response allowing direct restriction of viral replication in defined cell types and reported to rely on specific cellular factors such as SAMHD1, TRIM5α or APOBEC3G (A3G) in the case of HIV infection (for review see (Colomer‐Lluch et al, 2018)). While A3G‐mediated antiviral function in LC has not been investigated so far, TRIM5α was recently reported to restrict HIV‐1 entry into LC through its association with langerin and the autophagy pathway (Ribeiro et al, 2016), the latter previously shown to regulate DC antiviral responses (Blanchet et al, 2010). We unravelled recently a TGF‐β‐dependent and SAMHD1‐unrelated antiviral activity in human LC (Czubala et al, 2016), and our current study unveiled for the first time the unexpected involvement of the human alarmin S100A9 as an intracellular mediator of intrinsic immunity upon HIV infection. Alarmins represent host endogenous DAMPs acting as molecular multitaskers with extensively studied extracellular roles in tumorigenesis, inflammation and immune responses (Yang et al, 2017). However, their intracellular functions remain mostly unappreciated and often unforeseen. S100A9 is no exception to the rule and few reports described unanticipated intracellular S100A9 effects like MDSC promotion during late sepsis (Dai et al, 2017), microtubule reorganization during transendothelial migration of phagocytes (Vogl et al, 2004) or S‐nitrosylation of inflammatory and cytoskeletal cellular factors (Jia et al, 2014).
During viral infection, extracellular S100A9 has been shown to promote HIV‐1 transcriptional activity and viral replication in infected CD4+ T lymphocytes (Ryckman et al, 2002) while stimulating the anti‐HIV‐1 activity of NK cells through CD85j ligation (Arnold et al, 2013). Interestingly, intracellular S100A9 was rather shown to restrict Porcine reproductive and respiratory syndrome virus (PRRSV) replication (Song et al, 2019) and facilitate activation of the viral sensor TLR3 (Tsai et al, 2015), therefore suggesting an intracellular antiviral role for S100A9 independent of its capacity to activate TLR4 and Rage pathways. It will remain also to determine the contribution of S100A9 in the susceptibility to HIV‐1 infection of LC under inflammatory conditions. Indeed, induced maturation of LC by TLR agonists or cytokines was reported to enhance LC susceptibility to HIV‐1 infection (Kawamura et al, 2001; de Jong et al, 2008; Ogawa et al, 2009) and data from our study showed that this maturation state inversely correlated with S100A9 expression upon stimulation of MoLC with LPS.
S100A9 antimicrobial activity has been mostly linked to extracellular calprotectin, a protein complex of heterodimers formed with S100A8 and critically required to chelate metal divalent cations, like Zn2+, therefore impeding bacterial growth by a host response referred to nutritional immunity (Zackular et al, 2015; Zygiel & Nolan, 2018). Our study, however, focused exclusively on intracellular human S100A9 because its subcellular localization appeared modulated upon TGF‐β treatment while human S100A8 intracellular pattern remained unchanged. Hence, human S100A9 expression alone in lymphoid and epithelial cells was sufficient to restrict wild‐type HIV‐1 and HIV‐based lentiviral vector infection, respectively.
Although the mechanism by which human S100A9 restricts HIV‐1 infection of LC is not yet clearly determined, our data provide evidence of this alarmin interfering with the reverse transcription step of retroviral replication cycle and causing a defect in uncoating. Interestingly, a link between inhibition of HIV‐1 reverse transcription and altered viral uncoating has been suggested and either destabilization or over‐stabilization of the viral core by cellular factors were reported to alter productive viral infection (Hulme et al, 2011; Fernandez et al, 2019; Maillet et al, 2020). The observed S100A9‐dependent viral core over‐stabilization was, however, not associated with a proximity between intracellular human S100A9 and incoming viral capsids, therefore suggesting a distal mechanism of action. Such aspect appears of interest in light of the recent ground‐breaking reports of viral uncoating in the nucleus (Dharan et al, 2020; Selyutina et al, 2020). Indeed, although nuclear uncoating has not yet been reported in LC, our data do not preclude S100A9‐mediated HIV‐1 restriction in conditions where accomplishment of reverse transcription would occur in the nucleus and such hypothesis will require further investigation. Nevertheless, we unravelled that S100A9‐containing cellular extracts and purified human S100A9 could inhibit viral reverse transcriptase activity in vitro in a dose‐ and Mg2+‐dependent manner. Because HIV‐1 or MMLV reverse transcriptase enzymatic activities rely on divalent cations supply like Mg2+, cellular proteins affecting intracellular metal cations homeostasis, like S100A9, might critically regulate such viral enzymatic activity. Our proposed model would suggest that human S100A9 timely and quantitatively controls the supply of essential enzymatic components required for the viral reverse transcriptase to fulfil its activity in infected cells. Such mechanism would recall the SAMHD1‐dependent HIV‐1 restriction reported to act through the regulation of intracellular dNTP pool (Goldstone et al, 2011; Lahouassa et al, 2012) and would possibly fit with the known S100A9 antimicrobial function as a divalent‐ion chelating protein (Zygiel & Nolan, 2018), a mechanism involved in nutritional immunity. The involvement of divalent metal ions during viral infection seems rather intuitive as most viral enzymes require ligation with such inorganic compound to be active (Chaturvedi & Shrivastava, 2005). Thus, drug‐based chelation of divalent cations has been already considered therapeutically and developed to inhibit viral enzymes like the HIV‐1 integrase (Summa et al, 2006), the influenza endonuclease PA (Tomassini et al, 1994) or the hepatitis C virus polymerase NS5B (Summa et al, 2004). An emerging and innovative concept relies on the specific targeting of host proteins regulating the concentration and supply of important divalent cations. As such, modulating the activity of cellular factors involved in the sequestration or depletion of ions essentials for viral enzymes, like human S100A9, may turn out to represent a novel and promising therapeutic strategy against viral infections. In conclusion, our study reveals an unexpected S100A9‐mediated intracellular antiretroviral function in Langerhans cells localized at the forefront against incoming pathogens and proposes an unanticipated function for this nutritional immunity regulator as a new mediator of intrinsic antiviral immunity.
Materials and Methods
Human skin and blood samples
Human skin samples were obtained from the laboratory Inflammation, Tissus Epithéliaux et Cytokines EA4331, University of Poitiers, France. The use of all human skin samples for research studies was approved by the Ethics Committee (committee for the protection of persons) Ouest III (project identification code: DC‐2014‐2109). After the provision of fully informed consent, normal abdominal skin was obtained from patients undergoing plastic surgery at the Poitiers University Hospital.
Human skin sample processing was adapted from our described method (Czubala et al, 2016). Briefly, skin sheets were cut into 1‐cm² pieces and incubated with agitation in shaking water bath (at 175 strokes/min) in Roswell Park Memorial Institute (RPMI) medium (Gibco) containing collagenase A (1 mg/ml), DNase I (20 U/ml) and Dispase II (1 mg/ml) overnight at 37°C, after which the epidermis was mechanically separated from the dermis using forceps. Epidermal sheets were cultured separately in RPMI with 10% human AB serum and 1% penicillin/streptomycin/fungizone solution for 48 h, after which migratory cells were collected from wells.
Buffy coats from healthy donors were obtained from the Etablissement Français du Sang (EFS, Montpellier, France). CD14+ monocyte isolation and differentiation to MoDC were performed as previously described (Blanchet et al, 2010; Blanchet et al, 2013). MoLC were obtained from CD14+ monocytes upon 6‐day incubation with 500 U/ml GM‐CSF, 500 U/ml IL‐4 and 10 ng/ml TGF‐β in IMDM medium supplemented with 10% FBS 100 U/ml penicillin, 100 μg/ml streptomycin and 2 mM l‐glutamine. When applicable, an internal laboratory nomenclature classifying human blood donors (D#) and human skin donors (Skin#) were indicated in figures.
RNA‐Seq transcriptional profiling and analysis
Total RNA was isolated from 4 × 10⁶ human monocyte‐derived cells (MoDC, MoLC and MoDC+TGF‐β) with TRIzol–chloroform (Invitrogen) precipitation, according to the manufacturer’s recommendation, and cleaned up with RNeasy mini kit (Qiagen). RNA Quality control was done using an Agilent 2100 Bioanalyser RNA Nano chip. RNA integrity (RIN) was routinely found to be ≥ 8.0. Further RNA‐Seq processing and analysis were performed by GATC Biotech AG (Germany). Briefly, mRNA were enriched by poly‐A purification, then fragmented and reverse‐transcribed. Adapters were ligated to random primed cDNA, and adapter‐specific PCR amplification was performed. Samples were barcoded and size‐selected to generate 50 base‐pair single‐end read cDNA libraries which were sequenced on Genome Sequencer Illumina HiSeq2500. Each sample (3 different conditions from 3 different donors) gave approximately 40 million reads which were mapped to the human genome (hg19) using TopHat and Bowtie, then annotated using Cufflinks. Merged transcripts from samples or conditions were compared using Cuffdiff to determine the differential transcript expression levels including a measure of significance between samples/conditions and expressed as FPKM expression. Potential false‐positive hits were limited by applying a threshold of ≥ 0.2 FPKM expression thus preserving true positives from the dataset. Heat map and data clusterization analyses were done using MORPHEUS software (https://software.broadinstitute.org/morpheus). The pathway analyses were done using the WEB‐based GEne SeT AnaLysis Toolkit (WEBGESTALT, http://www.webgestalt.org/) on representative transcriptomic data and looking after gene set enrichment with the Reactome Function Database.
Plasmids
The lentiviral vector system pRRL.sin.cPPT.SFFV/IRES‐puromycinR.WPRE used to generate the cell lines stably expressing the genes of interest has been described previously (Doyle et al, 2018). pRRL.sin.cPPT.SFFV/S100A9‐IRES‐PuromycinR.WPRE was obtained by PCR amplification of Myc‐tagged S100A9 in pcDNA3.1 (kind gift from Paul Fox, Cleveland, USA), then cloning by replacement of the enhanced E2‐crimson gene (E2C) in pRRL.sin.cPPT.SFFV/E2C‐IRES‐PuromycinR.WPRE, previously described (Doyle et al, 2018) using BamHI and XhoI.
Primers used to amplify S100A9 were as follows:
5′‐AATTAATTTAGGATCCATGACTTGCAAAATGTCGCAGC‐3′
5′‐AATTAATTTACTCGAGCTACTACAGATCCTCTTCAG‐3′
Vectors expressing E2C or S100A9 were generated by co‐transfecting HEK293T cells with pMD‐G, Gag‐Pol expression plasmid (pR8.91) and lentiviral vectors coding E2C or S100A9.
Lentiviral vectors and viruses
Retroviral vectors were pseudotyped with the vesicular stomatitis virus glycoprotein (VSV‐G) encoded by the pMD2.G plasmid. HIV‐1‐GFP vectors were produced using a Gag‐Pol expression plasmid (pR8.91) and green fluorescent protein (GFP)‐expressing retroviral (plox‐EWdeltaSalGFP) vector. HIV‐1‐deltaU3‐luc vectors were produced using a Gag‐Pol expression plasmid (pR8.91) and pTRIP‐CMV‐deltaU3‐luc vector encoding luciferase. MMLV vectors were produced using pCFG2‐eYFP and pHIT60. Viral stocks were titrated on MDTF or HEK293T cells and analysed by flow cytometry.
X4‐tropic HIV‐1 (pNL4‐3) and R5‐tropic HIV‐1 (pR8bal) viruses were produced by transient transfection of HEK293T cells using calcium phosphate precipitation. Viruses were harvested at 48 h after transfection and viral yield was measured by p24 ELISA according to the manufacturer's instructions (PerkinElmer Life Sciences). All lentivectors and viruses were produced by calcium phosphate transfection of HEK293T cells with corresponding plasmids.
HIV‐1 primary isolates were collected at the endpoint of QVOA (Quantitative Viral Outgrowth Assay) performed with co‐culture of MOLT4‐CCR5 cells with stimulated CD4+ T lymphocytes isolated from peripheral blood samples of aviremic HIV‐1‐infected individuals under HAART (N = 2). The blood samples were provided by the Biological Resource Center of Montpellier Hospital (CRB‐CHUM) referenced as BIOBANQUES BB‐0033‐00031.
Influenza A virus infection
A 12‐plasmid system provided by Pr. Wendy Barclay, previously modified (Doyle et al, 2018), was used to rescue the A/Victoria‐NanoLuc/3/75 (IAV NanoLuc) reporter virus, as described in Doyle et al, (2018). Supernatants from day 5 post‐transfection were used for virus amplification on MDCK cells and viral stocks were titrated by plaque assays on MDCK cells. IAV challenges were performed in serum‐free DMEM for 1 h, in triplicate and in 96‐well plates, and the medium was subsequently replaced with 10% FBS‐containing media. The cells were lysed 7 and 15 h post‐challenge and NanoLuc activity was measured with the Nano‐Glo assay system (Promega), and luminescence was detected using a plate reader (Infinite® 200 PRO, Tecan).
Cells
HeLa, HEK293T, Chinese hamster ovary (CHO) and Mus dunni tail fibroblast (MDTF) cells were cultured in Dulbecco’s modified Eagle’s medium (DMEM), and THP1, Jurkat and CEM cells were cultured in RPMI (Gibco). Both media were supplemented with 10% FBS, 2 mM l‐glutamine, 10 U/ml penicillin and 10 μg/ml streptomycin. Different cell lines used in this study (HEK293T, CHO, THP1, Jurkat and CEM) were transduced with the vectors expressing E2C and S100A9 (see above) and selected for 2 weeks under puromycin selection (1 μg/ml).
Antibodies, cytokines and reagents
Primary antibodies used in Western blot experiments were rabbit anti‐S100A9 (Abcam), rabbit anti‐S100A8 (Abcam), rabbit anti‐Langerin (CD207) (Cell Signaling Technology) and rabbit anti‐cyclophilin A (Santa Cruz Biotechnology, sc‐20360‐R). The antibodies mouse anti‐FLAG (Clone M2), mouse anti‐Myc (Clone 4A6), mouse anti‐GAPDH (Clone 6C5) and mouse anti‐β‐Actin were all from Merck Millipore, Sigma‐Aldrich. The anti‐HIV‐1 p24 monoclonal (183‐H12‐5C) was obtained from the NIH AIDS Reagent Program. Secondary antibodies used were anti‐mouse, and anti‐rabbit HRP‐conjugated (GE Healthcare Life Sciences). For immunofluorescence and/or flow cytometry, monoclonal anti‐Langerin (clone 122D5/DCGM4) (Dendritics), anti‐CD83‐APC, anti‐HLA‐DR‐FITC (BD Pharmingen), KC‐57‐FITC (Beckman Coulter) and, when necessary, secondary antibodies coupled to Alexa Fluor 488 or Alexa Fluor 647 were used. For cell differentiation, GM‐CSF and IL‐4 cytokines were purchased from Miltenyi Biotec (CytoBox) and TGF‐β from Peprotech. For cell maturation, E. coli K12‐derived LPS was obtained from A. Gross (IRIM, France). Nevirapine (SML0097), FLAG® peptide (F3290) and c‐Myc peptide (M2435) were purchased from Sigma‐Aldrich.
Immunoblotting
Briefly, cell lysates were denatured and loaded on 12% ProSieve gel and then subjected to electrophoresis. Chemiluminescent acquisitions were done on a Chemidoc™ MP Imager and analysed for quantification using Image Lab™ desktop software (Bio‐Rad Laboratories).
Confocal immunofluorescence microscopy
Cells were adhered on slides, pre‐treated with poly‐lysine and fixed with 4% paraformaldehyde for 15 min, rinsed in PBS and permeabilized with 0.5% BSA/0.3% Triton X‐100 for 30 min. Cells were incubated with primary antibodies at room temperature for 1 h, washed in permeabilization buffer and incubated at room temperature in the dark for 30 min with secondary antibodies. Finally, slides were rinsed in PBS 0.5% BSA and counterstained with Hoechst 33342. Slides were then mounted in Fluoromount‐G medium. Images were digitally acquired with a Zeiss LSM 880 or Leica SP5 confocal microscopes. All analyses were performed using the ImageJ software (NIH, Bethesda, MD, USA).
Quantitative real‐time PCR assays
For quantification of HIV‐1 late RT products and 2‐LTR copies, cells were first infected for 24 h. Infected cells were then treated for 30 min at 37°C with DNase I (Roche), and total cellular DNA was extracted using DNeasy Blood & Tissue Kit (Qiagen). For determination of 2‐LTR circle copy number in HIV‐1‐infected cells, we used primers MH535/536, probe MH603 and as standard curve the pUC2LTR plasmid, which contains the HIV‐1/2‐LTR junction (Butler et al, 2001). Quantitative PCRs were performed using Roche LC480 probe Master Mix and the following program: initial incubations at 50°C for 2 min and 95°C for 10 min and 40 cycles of amplification were carried out at 15 s at 95°C followed by 30 s at 60°C and 1 min at 75°C. For qPCR analysis of HIV‐1 late reverse transcripts, real‐time PCRs were performed using Takyon ROX SYBR MasterMix blue dTTP (Eurogentec). The following program was used: 3 min at 95°C followed by 35 cycles of 15 s at 95°C, 20 s at 60°C and 20 s at 72°C. Values for each transcript were normalized to expression levels of human GAPDH transcripts. Quantitative PCR assays of HIV‐1 late RT products were done using M667/M661 primers, which amplify the RU5‐primer binding site 5' noncoding region. Quantitative values of late RT products were normalized as copies/100 ng DNA using a standard array done with a serial dilution of a defined and linearized HIV‐1 plasmid (pBru).
Primers and 2‐LTR probe sequences are as follows:
2‐LTR probe/MH603: (FAM)‐ACACTACTTGAAGCACTCAAGGCAAGCTTT‐(TAMRA).
MH535: forward primer, 5′‐AACTAGGGAACCCACTGCTTAAG‐3′
MH536: reverse primer, 5′‐TCCACAGATCAAGGATATCTTGTC‐3′
M667: 5′‐GGCTAACTAGGGAACCCACTG‐3′
M661: 5′‐CCTGCGTCGAGAGAGCTCCTCTGG‐3′
GAPDH: forward primer, 5′‐ACTTCAACAGCGACACCCACT‐3′; reverse primer, 5′‐GTGGTCCAGGGGTCTTACTCC‐3′
For RT‐qPCR experiments, total RNA was extracted using RNeasy Mini Kit (Qiagen), following the manufacturer’s instructions. RNA samples were converted to cDNA using PrimeScript RT Reagent Kit (Takara Clontech). Values for each transcript were normalized to expression levels of RPL13A (60S ribosomal protein L13a). Primers used for quantification of transcripts by real‐time quantitative PCR are indicated below:
RPL13A: forward primer, 5′‐AACAGCTCATGAGGCTACGG‐3′; reverse primer, 5′‐TGGGTCTTGAGGACCTCTGT‐3′
S100A9: forward primer, 5′‐GAATTCAAAGAGCTGGTGCGA‐3′; reverse primer, 5′‐GCTTGTCTGCATTTGTGTCCA‐3′
S100A8: forward primer, 5′‐AAGGGGAATTTCCATGCCGT‐3′; reverse primer, 5′‐ACGTCTGCACCCTTTTTCCT‐3′
TNFRS21: forward primer, 5′‐CCTGGACTTTGTGCTGACCA‐3′; reverse primer, 5′‐TTCCATGTGGCATCGGACC‐3′
SERPINA1: forward primer, 5′‐CCAAGGCTGACACTCACGAT‐3′; reverse primer, 5′‐TGGATCTGAGCCTCCGGAAT‐3′
RMDN3: forward primer, 5’‐ACCTACCTCTGGACCGATGTC‐3’; reverse primer, 5’‐ TTCCATGTGGCATCGGACC‐3’.
PADI2: forward primer, 5′‐AACAGCTCATGAGGCTACGG‐3′; reverse primer, 5′‐CACACGTGTTCCGAGTGCT‐3′.
siRNA‐mediated downregulation of target expression
SiRNA non‐targeting control (siRNA‐CTR) and siRNA specific for S100A9 (siRNA S100A9) were purchased from Dharmacon as SMARTpools. Transfections of MoLC and human skin‐derived cells with siRNA (60 nM) were performed using INTERFERin (Polyplus transfection) and Dharmafect4 (Dharmacon), respectively, according to the manufacturer’s recommendations and cells were used for indicated experiments 48 h upon transfection.
Flow cytometry
For flow cytometry analysis, all cells were fixed with 2% formaldehyde. Cells stably expressing E2C or transduced with lentivectors expressing HIV‐1‐GFP were analysed for red and green fluorescence, respectively. For cell surface expression analysis, cells were stained with indicated antibodies at 4°C for 1 h. For intracellular staining, cells were permeabilized in a PBS/1% BSA/0.025% saponin solution for 15 min prior to staining with corresponding antibodies for 1 h at 4°C diluted in the permeabilization solution. Analyses were done with FlowJo software (Treestar Inc., Oregon, USA).
HIV‐1 BlaM‐Vpr assay
A 105 E2C‐ or S100A9‐expressing THP1 cells were plated in 96‐well plates the day prior to infection. Cells were infected or not with BlaM‐Vpr containing NL4‐3/Nef‐IRES‐Renilla viruses for 3 h, as described in Doyle et al, (2018). Cells were then washed once in CO2‐independent media and loaded with CCF2‐AM substrate (Invitrogen) containing development media (CO2‐independent media containing 1.6 mM probenecid) for 2 h at room temperature before 2 washes and incubation at room temperature overnight in development media. Finally, cells were harvested, washed and fixed in 2% PFA, before analysis using a FACSCanto II (BD Biosciences).
Immunoprecipitation and elution of E2C and S100A9 proteins
HEK293T cells expressing either FLAG‐E2C or Myc‐S100A9 were lysed in IP lysis buffer (50 mM Tris–HCl (pH7.4), 150 mM NaCl, 1 mM EDTA, 1% Triton X‐100, 20 mM N‐ethyl maleimide, EDTA‐free protease inhibitor cocktail (Roche)) for 1 h at 4°C. Cell lysates from FLAG‐E2C and Myc‐S100A9 were then incubated for 8 h at 4°C with anti‐FLAG (clone M2) Affinity Agarose Gel or anti‐c‐Myc Affinity Agarose Gel (both from Sigma‐Aldrich), respectively. Immunoprecipitates were washed three times and used for Western blot analysis or eluted with 500 μg/ml of FLAG® and c‐Myc peptides in elution buffer (50 mM HEPES, 100 mM NaCl, 0.05% Triton X‐100 and EDTA‐free protease inhibitor cocktail (Roche)) under constant shaking overnight at 4°C. Eluates were then used for in vitro RT assays and efficiency of elution was controlled by immunoblotting.
Invitro MMLV reverse transcription assay
Total RNA was extracted from HeLa cells using RNeasy Mini Kit (Qiagen), following manufacturer’s instructions. 20 ng of RNA samples was converted to cDNA using PrimeScript RT Reagent Kit (Takara Clontech) in presence of varying amounts of protein lysates freshly extracted from cell lines stably expressing E2C or S100A9. Efficiency of reverse transcriptase activity was then measured by qPCR using primers for quantification of RPL13A transcripts.
Colorimetric HIV‐1 reverse transcriptase assay
The HIV‐1 reverse transcriptase assay (From Roche) is a colorimetric enzyme immunoassay for the quantitative determination of retroviral reverse transcriptase activity by incorporation of digoxigennin‐and biotin‐labelled dUTP into DNA. Increasing amounts of cell lysates freshly extracted from E2C‐ or S100A9‐expressing cell lines and/or immunopurified E2C and S100A9 eluates were incubated with constant concentration of recombinant HIV‐1‐RT (0.5 ng) and the reaction mixture which includes dUTP/dTTP for 30 min at 37°C. Samples containing nevirapine and lysis buffer with no HIV‐1‐RT added were used as controls. When indicated, different MgCl2 concentrations were used in the assay. The detection and quantification of the HIV‐1 reverse transcriptase activity were then performed according to the manufacturer’s protocol. The samples absorbance is directly correlated to the level of HIV‐1 RTase activity and was determined using a microplate reader (TECAN). Results were presented as fold normalized to enzymatic activities obtained with immunopurified E2C.
Intracellular fate‐of‐capsid assay
The HIV‐1 core stability in cells was assessed by the separation of soluble capsid from particulate capsid on a sucrose cushion, using the fate‐of‐capsid assay (Yang et al, 2014). At 4 h post‐transduction, the HEK293T cells expressing either FLAG‐E2C or Myc‐S100A9 were lysed using hypotonic lysis buffer and a dounce homogenizer and briefly centrifuged to clarify the cytosol fractions. The lysates were then layered onto a 50% sucrose cushion and ultracentrifuged at 100,000 g for 2 h. The soluble capsid (top 100 μl fraction) and retroviral cores (pellet) were analysed by Western blotting with an anti‐HIV‐1 p24 monoclonal antibody (Clone 183‐H12‐5C obtained from NIH AIDS Reagent Program).
Statistical analysis
All results are displayed as means ± standard deviation of the means (SD). Student’s t‐tests were used to evaluate the significance of differences between experimental groups and conditions and to determine P values. *P < 0.05, **P < 0.01, ***P < 0.001.
Author contributions
GM and FPB conceived the study. GM, JL, QH, BB, CC, KF, OM, MT, LP and FPB carried out experiments. GM, JL, KF, OM, MT, MM, CB, NL, AG, NA, SN and CG helped to obtain or generate biological reagents used in the study. GM, OM, J‐PM, AG, NA, SN, PVdP, CG and FPB helped in experimental design and discussed experimental data. FPB wrote the manuscript. All authors read, corrected and commented the manuscript.
Conflict of interest
The authors declare that they have no conflict of interest.
Supporting information
Review Process File
Appendix
Expanded View Figures PDF
Source Data for Expanded View
Source Data for Figure 1
Source Data for Figure 2
Source Data for Figure 3
Source Data for Figure 4
Source Data for Figure 6
Source Data for Figure 8
Source Data for Figure 10
Source Data for Figure 11
Acknowledgements
We are grateful to Juliette Fernandez for the technical help and to all members of the Viral Trafficking, Restriction and Innate Signaling Team for excellent scientific discussions and/or critical reading of the manuscript. We warmly thank M. Benkirane (IGH, Montpellier) for providing reagents (SAMHD1 and phosphoSAMHD1 antibodies) and critical reading of the manuscript. We are also grateful to Paul L. Fox and Jie Jia (Cleveland, USA) for the kind gift of S100A8 and S100A9 encoding plasmids. Immunofluorescence microscopy and some flow cytometry experiments were done at Montpellier RIO Imaging (Montpellier, France). This work was supported by an ANRS grant to F.P.B (No D15236). L.P. was a recipient of a SIDACTION Young Researcher doctoral fellowship. G.M. was the recipient of postdoctoral fellowships from Labex EpiGenMed (Montpellier, France) and the ANRS. The funding bodies had no role in the preparation of the article, design of the study or interpretation of the data.
The EMBO Journal (2021) 40: e106540.
Data availability
Raw and processed RNA‐Seq data generated for this study are available as GEO series GSE173939 at https://www.ncbi.nlm.nih.gov/geo/query/acc.cgi?acc=GSE173939. Raw data from this study can be also provided upon reasonable request.
References
- Arnold V, Cummings JS, Moreno‐Nieves UY, Didier C, Gilbert A, Barre‐Sinoussi F, Scott‐Algara D (2013) S100A9 protein is a novel ligand for the CD85j receptor and its interaction is implicated in the control of HIV‐1 replication by NK cells. Retrovirology 10: 122 [DOI] [PMC free article] [PubMed] [Google Scholar]
- Blanchet FP, Moris A, Nikolic DS, Lehmann M, Cardinaud S, Stalder R, Garcia E, Dinkins C, Leuba F, Wu Liet al (2010) Human immunodeficiency virus‐1 inhibition of immunoamphisomes in dendritic cells impairs early innate and adaptive immune responses. Immunity 32: 654–669 [DOI] [PMC free article] [PubMed] [Google Scholar]
- Blanchet FP, Stalder R, Czubala M, Lehmann M, Rio L, Mangeat B, Piguet V (2013) TLR‐4 engagement of dendritic cells confers a BST‐2/tetherin‐mediated restriction of HIV‐1 infection to CD4+ T cells across the virological synapse. Retrovirology 10: 6 [DOI] [PMC free article] [PubMed] [Google Scholar]
- Butler SL, Hansen MS, Bushman FD (2001) A quantitative assay for HIV DNA integration in vivo . Nat Med 7: 631–634 [DOI] [PubMed] [Google Scholar]
- Cavrois M, De Noronha C, Greene WC (2002) A sensitive and specific enzyme‐based assay detecting HIV‐1 virion fusion in primary T lymphocytes. Nat Biotechnol 20: 1151–1154 [DOI] [PubMed] [Google Scholar]
- Chaturvedi UC, Shrivastava R (2005) Interaction of viral proteins with metal ions: role in maintaining the structure and functions of viruses. FEMS Immunol Med Microbiol 43: 105–114 [DOI] [PMC free article] [PubMed] [Google Scholar]
- Colomer‐Lluch M, Ruiz A, Moris A, Prado JG (2018) Restriction factors: from intrinsic viral restriction to shaping cellular immunity against HIV‐1. Front Immunol 9: 2876 [DOI] [PMC free article] [PubMed] [Google Scholar]
- Czubala MA, Finsterbusch K, Ivory MO, Mitchell JP, Ahmed Z, Shimauchi T, Karoo ROS, Coulman SA, Gateley C, Birchall JCet al (2016) TGFbeta induces a SAMHD1‐independent post‐entry restriction to HIV‐1 infection of human epithelial langerhans cells. J Invest Dermatol 136: 1981–1989 [DOI] [PubMed] [Google Scholar]
- Dai J, Kumbhare A, Youssef D, McCall CE, El Gazzar M (2017) Intracellular S100A9 promotes myeloid‐derived suppressor cells during late sepsis. Front Immunol 8: 1565 [DOI] [PMC free article] [PubMed] [Google Scholar]
- Dharan A, Bachmann N, Talley S, Zwikelmaier V, Campbell EM (2020) Nuclear pore blockade reveals that HIV‐1 completes reverse transcription and uncoating in the nucleus. Nat Microbiol 5: 1088–1095 [DOI] [PMC free article] [PubMed] [Google Scholar]
- Doyle T, Moncorge O, Bonaventure B, Pollpeter D, Lussignol M, Tauziet M, Apolonia L, Catanese MT, Goujon C, Malim MH (2018) The interferon‐inducible isoform of NCOA7 inhibits endosome‐mediated viral entry. Nat Microbiol 3: 1369–1376 [DOI] [PMC free article] [PubMed] [Google Scholar]
- Fahrbach KM, Barry SM, Ayehunie S, Lamore S, Klausner M, Hope TJ (2007) Activated CD34‐derived Langerhans cells mediate transinfection with human immunodeficiency virus. J Virol 81: 6858–6868 [DOI] [PMC free article] [PubMed] [Google Scholar]
- Fernandez J, Machado AK, Lyonnais S, Chamontin C, Gärtner K, Léger T, Henriquet C, Garcia C, Portilho DM, Pugnière Met al (2019) Transportin‐1 binds to the HIV‐1 capsid via a nuclear localization signal and triggers uncoating. Nat Microbiol 4: 1840–1850 [DOI] [PubMed] [Google Scholar]
- Goldstone DC, Ennis‐Adeniran V, Hedden JJ, Groom HCT, Rice GI, Christodoulou E, Walker PA, Kelly G, Haire LF, Yap MWet al (2011) HIV‐1 restriction factor SAMHD1 is a deoxynucleoside triphosphate triphosphohydrolase. Nature 480: 379–382 [DOI] [PubMed] [Google Scholar]
- Hrecka K, Hao C, Gierszewska M, Swanson SK, Kesik‐Brodacka M, Srivastava S, Florens L, Washburn MP, Skowronski J (2011) Vpx relieves inhibition of HIV‐1 infection of macrophages mediated by the SAMHD1 protein. Nature 474: 658–661 [DOI] [PMC free article] [PubMed] [Google Scholar]
- Hulme AE, Perez O, Hope TJ (2011) Complementary assays reveal a relationship between HIV‐1 uncoating and reverse transcription. Proc Natl Acad Sci U S A 108: 9975–9980 [DOI] [PMC free article] [PubMed] [Google Scholar]
- Jia J, Arif A, Terenzi F, Willard B, Plow EF, Hazen SL, Fox PL (2014) Target‐selective protein S‐nitrosylation by sequence motif recognition. Cell 159: 623–634 [DOI] [PMC free article] [PubMed] [Google Scholar]
- de Jong MA, de Witte L, Oudhoff MJ, Gringhuis SI, Gallay P, Geijtenbeek TB (2008) TNF‐alpha and TLR agonists increase susceptibility to HIV‐1 transmission by human Langerhans cells ex vivo . J Clin Invest 118: 3440–3452 [DOI] [PMC free article] [PubMed] [Google Scholar]
- de Jong MA, de Witte L, Taylor ME, Geijtenbeek TB (2010) Herpes simplex virus type 2 enhances HIV‐1 susceptibility by affecting Langerhans cell function. J Immunol 185: 1633–1641 [DOI] [PubMed] [Google Scholar]
- Kaushik R, Zhu X, Stranska R, Wu Y, Stevenson M (2009) A cellular restriction dictates the permissivity of nondividing monocytes/macrophages to lentivirus and gammaretrovirus infection. Cell Host Microbe 6: 68–80 [DOI] [PMC free article] [PubMed] [Google Scholar]
- Kawamura T, Qualbani M, Thomas EK, Orenstein JM, Blauvelt A (2001) Low levels of productive HIV infection in Langerhans cell‐like dendritic cells differentiated in the presence of TGF‐beta1 and increased viral replication with CD40 ligand‐induced maturation. Eur J Immunol 31: 360–368 [DOI] [PubMed] [Google Scholar]
- Laguette N, Sobhian B, Casartelli N, Ringeard M, Chable‐Bessia C, Segeral E, Yatim A, Emiliani S, Schwartz O, Benkirane M (2011) SAMHD1 is the dendritic‐ and myeloid‐cell‐specific HIV‐1 restriction factor counteracted by Vpx. Nature 474: 654–657 [DOI] [PMC free article] [PubMed] [Google Scholar]
- Lahouassa H, Daddacha W, Hofmann H, Ayinde D, Logue EC, Dragin L, Bloch N, Maudet C, Bertrand M, Gramberg Tet al (2012) SAMHD1 restricts the replication of human immunodeficiency virus type 1 by depleting the intracellular pool of deoxynucleoside triphosphates. Nat Immunol 13: 223–228 [DOI] [PMC free article] [PubMed] [Google Scholar]
- Maarifi G, Czubala MA, Lagisquet J, Ivory MO, Fuchs K, Papin L, Birchall JC, Nisole S, Piguet V, Blanchet FP (2019) Langerin (CD207) represents a novel interferon‐stimulated gene in Langerhans cells. Cell Mol Immunol 17: 547–549 [DOI] [PMC free article] [PubMed] [Google Scholar]
- Maillet S, Fernandez J, Decourcelle M, El Koulali K, Blanchet FP, Arhel NJ, Maarifi G, Nisole S (2020) Daxx Inhibits HIV‐1 reverse transcription and uncoating in a SUMO‐dependent manner. Viruses 12: 636 [DOI] [PMC free article] [PubMed] [Google Scholar]
- Mayr L, Su B, Moog C (2017) Langerhans cells: the 'Yin and Yang' of HIV restriction and transmission. Trends Microbiol 25: 170–172 [DOI] [PubMed] [Google Scholar]
- Miller CJ, Hu J (1999) T cell‐tropic simian immunodeficiency virus (SIV) and simian‐human immunodeficiency viruses are readily transmitted by vaginal inoculation of rhesus macaques, and Langerhans' cells of the female genital tract are infected with SIV. J Infect Dis 179(Suppl 3): S413–S417 [DOI] [PMC free article] [PubMed] [Google Scholar]
- Nasr N, Lai J, Botting RA, Mercier SK, Harman AN, Kim M, Turville S, Center RJ, Domagala T, Gorry PRet al (2014) Inhibition of two temporal phases of HIV‐1 transfer from primary Langerhans cells to T cells: the role of langerin. J Immunol 193: 2554–2564 [DOI] [PubMed] [Google Scholar]
- Ogawa Y, Kawamura T, Kimura T, Ito M, Blauvelt A, Shimada S (2009) Gram‐positive bacteria enhance HIV‐1 susceptibility in Langerhans cells, but not in dendritic cells, via Toll‐like receptor activation. Blood 113: 5157–5166 [DOI] [PubMed] [Google Scholar]
- Ribeiro CM, Sarrami‐Forooshani R, Setiawan LC, Zijlstra‐Willems EM, van Hamme JL, Tigchelaar W, van der Wel NN, Kootstra NA, Gringhuis SI, Geijtenbeek TB (2016) Receptor usage dictates HIV‐1 restriction by human TRIM5alpha in dendritic cell subsets. Nature 540: 448–452 [DOI] [PubMed] [Google Scholar]
- Ryckman C, Robichaud GA, Roy J, Cantin R, Tremblay MJ, Tessier PA (2002) HIV‐1 transcription and virus production are both accentuated by the proinflammatory myeloid‐related proteins in human CD4+ T lymphocytes. J Immunol 169: 3307–3313 [DOI] [PubMed] [Google Scholar]
- Schule S, Kloke BP, Kaiser JK, Heidmeier S, Panitz S, Wolfrum N, Cichutek K, Schweizer M (2009) Restriction of HIV‐1 replication in monocytes is abolished by Vpx of SIVsmmPBj. PLoS One 4: e7098 [DOI] [PMC free article] [PubMed] [Google Scholar]
- Selyutina A, Persaud M, Lee K, KewalRamani V, Diaz‐Griffero F (2020) Nuclear import of the HIV‐1 core precedes reverse transcription and uncoating. Cell Rep 32: 108201 [DOI] [PMC free article] [PubMed] [Google Scholar]
- Song ZB, Bai J, Liu XW, Nauwynck H, Wu JQ, Liu X, Jiang P (2019) S100A9 regulates porcine reproductive and respiratory syndrome virus replication by interacting with the viral nucleocapsid protein. Vet Microbiol 239: 108498 [DOI] [PMC free article] [PubMed] [Google Scholar]
- Summa V, Petrocchi A, Pace P, Matassa VG, De Francesco R, Altamura S, Tomei L, Koch U, Neuner P (2004) Discovery of alpha, gamma‐Diketo acids as potent selective and reversible inhibitors of hepatitis C virus NS5b RNA‐dependent RNA polymerase. J Med Chem 47: 14–17 [DOI] [PubMed] [Google Scholar]
- Summa V, Petrocchi A, Matassa VG, Gardelli C, Muraglia E, Rowley M, Paz OG, Laufer R, Monteagudo E, Pace P (2006) 4,5‐dihydroxypyrimidine carboxamides and N‐alkyl‐5‐hydroxypyrimidinone carboxamides are potent, selective HIV integrase inhibitors with good pharmacokinetic profiles in preclinical species. J Med Chem 49: 6646–6649 [DOI] [PubMed] [Google Scholar]
- Tomassini J, Selnick H, Davies ME, Armstrong ME, Baldwin J, Bourgeois M, Hastings J, Hazuda D, Lewis J, McClements Wet al (1994) Inhibition of cap (m7G pppXm)‐dependent endonuclease of influenza virus by 4‐substituted 2,4‐dioxobutanoic acid compounds. Antimicrob Agents Chemother 38: 2827–2837 [DOI] [PMC free article] [PubMed] [Google Scholar]
- Tsai S‐Y, Segovia JA, Chang T‐H, Shil NK, Pokharel SM, Kannan TR, Baseman JB, Defrêne J, Pagé N, Cesaro Aet al (2015) Regulation of TLR3 Activation by S100A9. J Immunol 195: 4426–4437 [DOI] [PMC free article] [PubMed] [Google Scholar]
- Veron P, Boutin S, Bernard J, Danos O, Davoust J, Masurier C (2006) Efficient transduction of monocyte‐ and CD34+‐derived Langerhans cells with lentiviral vectors in the absence of phenotypic and functional maturation. J Gene Med 8: 951–961 [DOI] [PubMed] [Google Scholar]
- Vogl T, Ludwig S, Goebeler M, Strey A, Thorey IS, Reichelt R, Foell D, Gerke V, Manitz MP, Nacken Wet al (2004) MRP8 and MRP14 control microtubule reorganization during transendothelial migration of phagocytes. Blood 104: 4260–4268 [DOI] [PubMed] [Google Scholar]
- de Witte L, Nabatov A, Pion M, Fluitsma D, de Jong MA, de Gruijl T, Piguet V, van Kooyk Y, Geijtenbeek TB (2007) Langerin is a natural barrier to HIV‐1 transmission by Langerhans cells. Nat Med 13: 367–371 [DOI] [PubMed] [Google Scholar]
- Yang D, Han Z, Oppenheim JJ (2017) Alarmins and immunity. Immunol Rev 280: 41–56 [DOI] [PMC free article] [PubMed] [Google Scholar]
- Yang Y, Luban J, Diaz‐Griffero F (2014) The fate of HIV‐1 capsid: a biochemical assay for HIV‐1 uncoating. Methods Mol Biol 1087: 29–36 [DOI] [PMC free article] [PubMed] [Google Scholar]
- Zackular JP, Chazin WJ, Skaar EP (2015) Nutritional Immunity: S100 proteins at the host‐pathogen interface. J Biol Chem 290: 18991–18998 [DOI] [PMC free article] [PubMed] [Google Scholar]
- Zygiel EM, Nolan EM (2018) Transition metal sequestration by the host‐defense protein calprotectin. Annu Rev Biochem 87: 621–643 [DOI] [PMC free article] [PubMed] [Google Scholar]
Associated Data
This section collects any data citations, data availability statements, or supplementary materials included in this article.
Supplementary Materials
Review Process File
Appendix
Expanded View Figures PDF
Source Data for Expanded View
Source Data for Figure 1
Source Data for Figure 2
Source Data for Figure 3
Source Data for Figure 4
Source Data for Figure 6
Source Data for Figure 8
Source Data for Figure 10
Source Data for Figure 11
Data Availability Statement
Raw and processed RNA‐Seq data generated for this study are available as GEO series GSE173939 at https://www.ncbi.nlm.nih.gov/geo/query/acc.cgi?acc=GSE173939. Raw data from this study can be also provided upon reasonable request.