Abstract
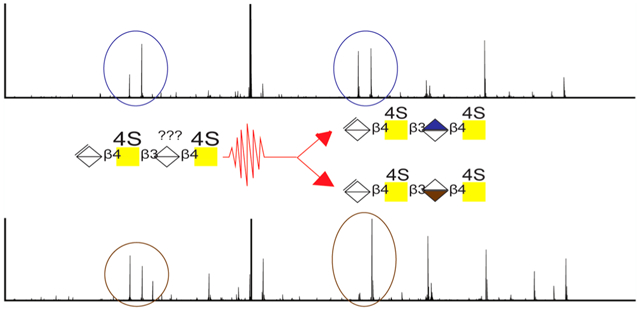
Glycosaminoglycans (GAGs) are linear polysaccharides that participate in a broad range of biological functions. Their incomplete biosynthesis pathway leads to nonuniform chains and complex mixtures. For this reason, the characterization of GAGs has been a difficult hurdle for the analytical community. Recently, ultraviolet photodissociation (UVPD) has emerged as a useful tool for determining sites of modification within a GAG chain. Here, we investigate the ability for UVPD to distinguish chondroitin sulfate epimers and the effects of UVPD experimental parameters on fragmentation efficiency. Chondroitin sulfate A (CS-A) and chondroitin sulfate B (CS-B), commonly referred to as dermatan sulfate (DS), differ only in C-5 uronic acid stereochemistry. This uronic acid difference can influence GAG-protein binding and therefore can alter the specific biological function of a GAG chain. Prior tandem mass spectrometry methods investigated for the elucidation of GAG structures also have difficulty differentiating 4-O from 6-O sulfation in chondroitin sulfate GAGs. Preliminary data using UVPD to characterize GAGs showed a promising ability to characterize 4-O sulfation in CS-A GAGs. Here, we look in depth at the capability of UVPD to distinguish chondroitin sulfate C-5 diastereomers and the role of key experimental parameters in making this distinction. Results using a 193 nm excimer laser and a 213 nm solid-state laser are compared for this study. The effect of precursor ionization state, the number of laser pulses (193 or 213 nm UVPD), and the use of the low-pressure versus high-pressure trap are investigated.
Keywords: carbohydrates, ion activation, UVPD, tandem mass spectrometry, glycans
Graphical Abstract
INTRODUCTION
Ultraviolet photodissociation (UVPD) coupled with mass spectrometry has been utilized for a variety of biological analyses.1–5 UV lasers were first coupled with mass spectrometers almost 40 years ago; however, due to low signal-to-noise (S/N) and limitations on ionization methods and mass spectrometers at that time, it was not widely used for biological samples until decades later.6,7 Although a large proportion of UVPD research has focused on proteins and protein complexes, there have also been successful efforts made with UVPD to characterize lipids, nucleotides, and carbohydrates.8–18 This type of photodissociation utilizes a single wavelength for activation, with the most widely used wavelength being 193 nm from excimer lasers. Ion activation by UVPD occurs from the absorption of one or more high-energy photons. Upon absorption of a UV photon, ions reach excited electronic states that access dissociation pathways that can be quite different from those resulting from vibrational excitation, as in collision-induced dissociation (CID).19 Following electronic excitation, ions can dissociate by direct dissociation from excited states, which is a unique feature of UVPD. Laser irradiation can also result in electron detachment from multiply deprotonated ions, leading to radically driven dissociation.20–22 Ions can also undergo internal conversion to the ground electronic state and intramolecular vibrational energy redistribution (IVR), which result in low-energy fragmentation pathways, similar to those commonly observed for conventional collisional-activation methods.4,23–26
Glycosaminoglycans (GAGs) are linear polysaccharides covalently bound to a protein backbone. GAGs are involved in a variety of biological functions ranging from cell signaling pathways to cell adhesion.27–30 Structural characterization of these carbohydrates is challenging, as they are expressed as heterogeneous mixtures. GAGs are highly modified by varying degrees of sulfation, acetylation, and uronic acid C-5 epimerization and are also heterogeneous in chain length (degree of polymerization or dp). Due to the complex nature of GAG mixtures, mass spectrometry is well suited for their structural characterization. Other analytical methods, such as nuclear magnetic resonance (NMR), can determine locations of modifications; however, this requires high purity samples in much greater amounts than are required for mass spectrometry, which uses microgram quantities or less for analysis.31 Many groups have focused their efforts on optimizing the positive-ion mode for permethylated glycans and proteins sequencing. For example, Wei et al. utilized electronic excitation dissociation (EED) paired with gated-trapped ion mobility to sequence permethylated N-glycan isomers.32 This work showed an ability to generate isomer-specific fragmentation allowing confident identification of isomers. However, due to the sulfate and carboxylic acid groups, GAGs ionize well in negative ion mode, which is used substantially less frequently by mass spectrometrists than positive ion mode. For this reason, optimization of negative ion activation methods has been the focus of research in our lab and others for nearly 20 years. Alternative ion activation methods that are suited for negative ions, including electron detachment dissociation (EDD) and negative electron transfer dissociation (NETD), have been utilized to generate informative spectra for these acidic biomolecules. These activation methods have been shown to yield a large number of cross-ring fragment ions, which are particularly useful for assigning sites of modification within a GAG chain.31,33–38 One of the more challenging modifications to characterize by mass spectrometry is the stereochemistry of the C-5 position of the hexuronic acid, which distinguishes glucuronic acid from iduronic acid. Assignment of this difference has been examined for both heparin (Hp)/heparan sulfate (HS) and chondroitin sulfate (CS)/dermatan sulfate (DS) GAG subclasses.35,39–44 For CS/DS GAGs, CID can distinguish this stereochemistry difference by comparing the intensities of fragment ions generated from specific glycosidic cleavages.42–44 Electron-based methods have also been utilized for this determination and, like threshold-based methods, produce differing fragment ion intensities that can be used to determine C-5 hexuronic acid stereochemistry.35 We have recently shown the ability of UVPD to characterize GAG standards, producing extensive cross-ring fragmentation.15 Recent work by Hawkridge et al. demonstrated the ability for 213 nm UVPD to identify 3-O sulfation in HS GAGs by a Y3/C3 internal fragment ion from lowly charge precursor ions.45 Here, we investigate the ability of UVPD to distinguish CS-A dp4, which contains glucuronic acid (GlcA), from DS dp4, which contains iduronic acid (IdoA) but is otherwise identical in structure. To determine a basis for improving fragmentation efficiency of UVPD for this class of carbohydrates, we examined parameters previously found to be essential for optimizing the fragmentation of other classes of molecules. Key parameters for UVPD fragmentation efficiency include pulse energy, number of pulses, and wavelength. For this work, we investigate the effect of these parameters on the fragmentation patterns of GAGs, as well as the impact of the charge state of the precursor.
EXPERIMENTAL SECTION
Preparation of Chondroitin Sulfate Oligosaccharides.
Chondroitin sulfate A (CS-A) was prepared using partial enzymatic depolymerization of bovine trachea chondroitin sulfate A (Celsus Laboratories, Cincinnati, OH). Dermatan sulfate (DS) was prepared the same way but using porcine intestinal mucosa dermatan sulfate (Celsus Laboratories). A full explanation of the procedure has been previously reported.35,43 For this study, CS-A dp4 (ΔUA-GalNAc4S-GlcA-GalNAc4S) and DS dp4 (ΔUA-GalNAc4S-GlcA-Gal-NAc4S) are utilized.
Mass Spectrometry.
All experiments were performed on a Thermo Fisher Orbitrap Fusion Lumos mass spectrometer (San Jose, CA). The mass spectrometer was equipped with a Coherent Excistar 193 nm excimer laser (Santa Clara, CA) or a 213 nm CryLas solid state laser (Berlin, Germany) as described previously.46 A schematic including the laser beam path is shown in Figure S1. Samples were sprayed from a static nanoelectrospray source with a spray voltage of 0.8–1.2 kV. Samples were diluted in 50:50 MeOH/H2O to a concentration of 50 μg/mL before ionization. Spectra were collected in negative-ion mode at a resolving power of 120000 at m/z 200 in full-profile mode. To minimize sulfate decomposition in MS1 spectra, the ion funnel RF was set to 10%. Precursor ions were isolated in the ion trap using an isolation width of 3 m/z. Higher energy collisional dissociation (HCD) was performed using a normalized collision energy (NCE) of 15–25. 193 nm UVPD was performed in both the low-pressure cell and the high-pressure cell, using 4 or 8 pulses at 4 mJ per pulse, and repetition rate of 500 Hz, applied during a 8 or 16 ms activation period, respectively. 213 nm UVPD experiments were also performed in the low-pressure cell and high-pressure cell, varying the number of pulses from 3 to 1000 at 3 μJ per pulse and a repetition rate of 2.5 kHz corresponding to activation periods ranging from 1 to 400 ms. All data presented is an average of 50 transients, resulting in an experimental time of approximately 30–60 s per spectrum.15
Mass spectral features were assigned using Glycoworkbench 2.047 and in-house GAG analysis software.48,49 Fragment ions are reported using a modified version of the Domon and Costello nomenclature.50,51 Fragment ion maps use dashed lines drawn through the chemical structure to depict fragmentation, and hash marks at the end of the lines indicate the specific fragment ion. Circles at the end of the hash marks represent sulfate decomposition via loss of −SO3 with an open circle representing one −SO3 loss and a filled circle representing two or more −SO3 losses. A tick mark within a hash mark represents loss of hydrogen, and two tick marks represent the loss of two hydrogen atoms. Donut plots display the percentages of the summed ion abundances for glycosidic fragment ions, cross-ring fragment ions, glycosidic fragment ions with sulfate decomposition, and cross-ring fragment ions with sulfate decomposition.
RESULTS AND DISCUSSION
Previous work using both vibrational and electronic excitation methods for the dissociation of CS/DS GAGs has shown the ability to distinguish isomers using variations in fragment ion intensities. Initial work using CID showed that a higher abundance of Yn and 0,2Xn fragment ions occurs for DS samples compared to CS-A samples.44 Further work utilized CID, infrared multiphoton dissociation (IRMPD), EDD, and NETD.35 Like the previous CID results, IRMPD, EDD, and NETD data showed 0,2Xn and Yn fragments to be diagnostic for DS, specifically 0,2X3 and Y3 for DS dp4 when activated by EDD. Additionally, these data showed Y1 and B3 fragments to be diagnostic for CS-A dp4. It was also shown that for CS-A dp4, B3 is more intense than C3, and for DS dp4 C3 is more intense than B3 when activating by EDD. Here, we investigate the different parameters of UVPD that typically modulate energy deposition to determine which parameters are optimal for GAG fragmentation. We also examine the utility of UVPD to distinguish CS isomers and how these essential fragmentation parameters affect diagnostic fragment ion intensity.
Precursor Ionization State.
Precursor selection for MS/MS analysis of GAGs is of primary importance for achieving effective fragmentation. The degree of ionization is known to play a significant role in the fragmentation behavior of GAGs.51,52 When using CID, a fully ionized precursor is needed to produce structurally informative fragmentation.43,53 A fully ionized precursor ion has been defined previously by our group as one where all acidic sites are deprotonated; that is, all sulfo and carboxyl groups are deprotonated and ionized.34,51 This can be achieved by either utilizing a highly charged precursor ion or by replacement of protons with sodium cations. When using EDD, a precursor with a degree of ionization that is one more than the number of sulfate modifications is needed to minimize sulfate decomposition while maintaining informative glycosidic and cross-ring fragmentation production, meaning all sulfate modifications and one carboxyl group are deprotonated.51 Here, we have investigated the effect that the degree of ionization of the precursor ion exerts on the production of diagnostic fragment ions by UVPD for CS-A and DS tetrasaccharides containing two sulfate modifications and two carboxyl groups for a total of four ionizable sites. Precursors ranging from one ionized site to four ionized sites were examined. All UVPD results discussed in this section used eight laser pulses of the 193 nm excimer laser in the high-pressure cell unless stated otherwise.
Figure 1 compares UVPD results for CS-A dp4 for four different levels of deprotonation. The singly charged precursor ion, [M − H]− (m/z 917.129), of CS-A dp4 contains only one site of ionization out of four potential sites yet yields an abundance of glycosidic fragments and a modest level of cross-ring fragments by UVPD, as shown in the fragment map in Figure 1A. The capability of UVPD to produce structurally informative fragment ions for this singly charged precursor is remarkable when compared to other activation methods. For example, CID would yield principally sulfate decomposition products for this singly charged precursor, as shown in Figure S2. Both methods produce SO3 loss from the precursor ion; however, UVPD yields structurally informative fragment ions that CID does not. Though the fragment ion intensities are low in the UVPD spectrum, the [M − H]− precursor produced 2,4X2 (m/z 619.130) and 1,4A4 (m/z 828.105) fragment ions for both CS-A dp4 and DS dp4 (Figure 2), which establishes the sites of both sulfate modifications of each structure as 4-O rather than 6-O (mass error of 0.48 and 2.3 ppm, respectively). An expanded view of these low intensity fragment ions is shown in Figures S3 and S4. The distribution of glycosidic cleavages, cross-ring cleavages, glycosidic cleavages with SO3 loss, and cross-ring cleavages with SO3 loss are shown in Figure 1E for each precursor. SO3 loss from the precursor ion is not included in this listing. Although this neutral loss peak has substantial abundance, it does not contribute significantly to the standard fragmentation types (A, B, C, X, Y, Z). The distribution of product ions for the singly charged precursor is composed mainly of glycosidic fragment ions (83.6%) with a low abundance of cross-ring fragment ions (6.2%) (Figure 1E). In addition, the singly charged precursor produced the highest relative portion of products corresponding to SO3 loss(10.2%) compared to the other precursor charge states. A comparison of the UVPD spectra and fragment ion distributions for the singly charged CS-A and DS tetramers is shown in Figure 2, and Tables S1 and S2 contain complete lists of identified fragment ions. Figure S5 shows the full-scan UVPD spectrum of the [M − H]− precursor ion of CS-A dp4. The Y1 (m/z 300.039) fragment is less intense than the Z1 ion (m/z 282.029) for DS dp4, whereas for CS-A dp4 the Y1 fragment is more intense than the Z1 ion. These results are consistent with previous results for distinguishing CS-A from DS based on EDD.35 An increased intensity of the Z2′′=C2′′ (m/z 456.045) fragment ion, where ′′ denotes the loss of two hydrogens, compared to the Z2=C2 peak (m/z 458.060) is also noted for DS dp4 while these fragment ions are similar intensities for CS-A dp4. These results also agree with the previous EDD results. The individual Z2 and C2 fragment ions are isobaric and therefore are indistinguishable from each other.
Figure 1.
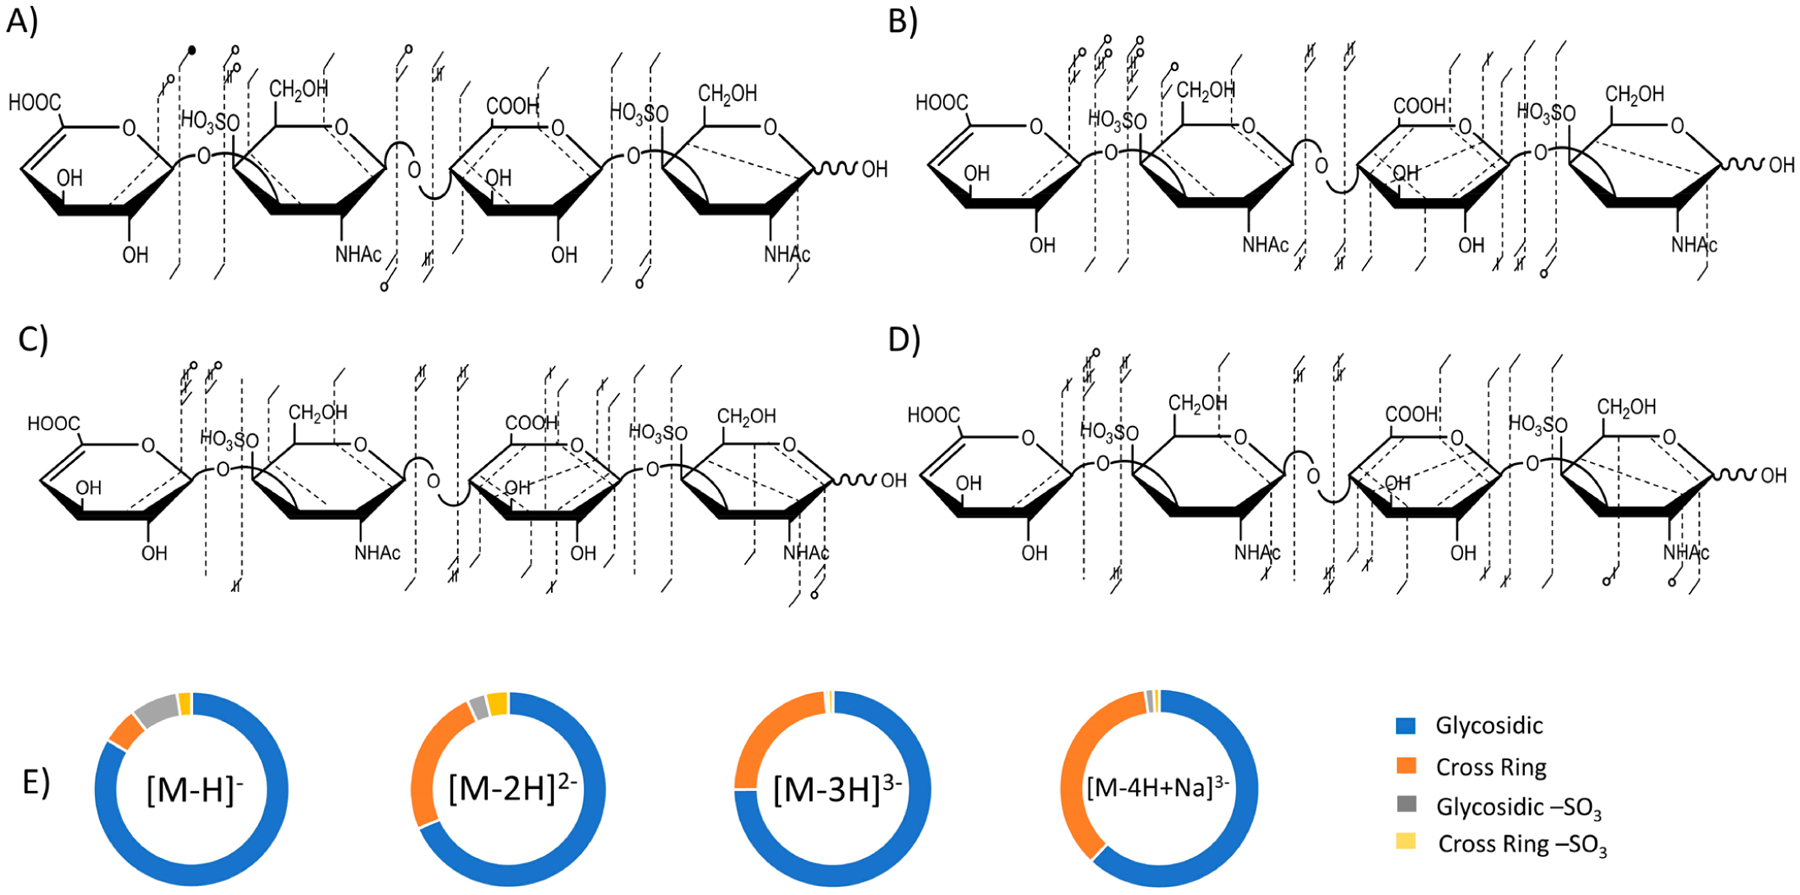
Annotated fragment maps depicting 193 nm UVPD fragment ion diversity using eight laser pulses (4 mJ per pulse) in the high-pressure cell for (A) CS-A dp4 [M − H]− precursor, (B) CS-A dp4 [M − 2H]2− precursor, (C) CS-A dp4 [M − 3H]3− precursor and (D) CS-A dp4 [M − 4H + Na]3− precursor. (E) Donut plots depicting the intensity distribution of glycosidic fragments (blue), cross-ring fragments (orange), glycosidic fragments with −SO3 loss (gray), and cross-ring fragments with −SO3 loss (yellow) of each precursor. Precursor ion intensity and sulfate decomposition from the precursor ion are not included.
Figure 2.
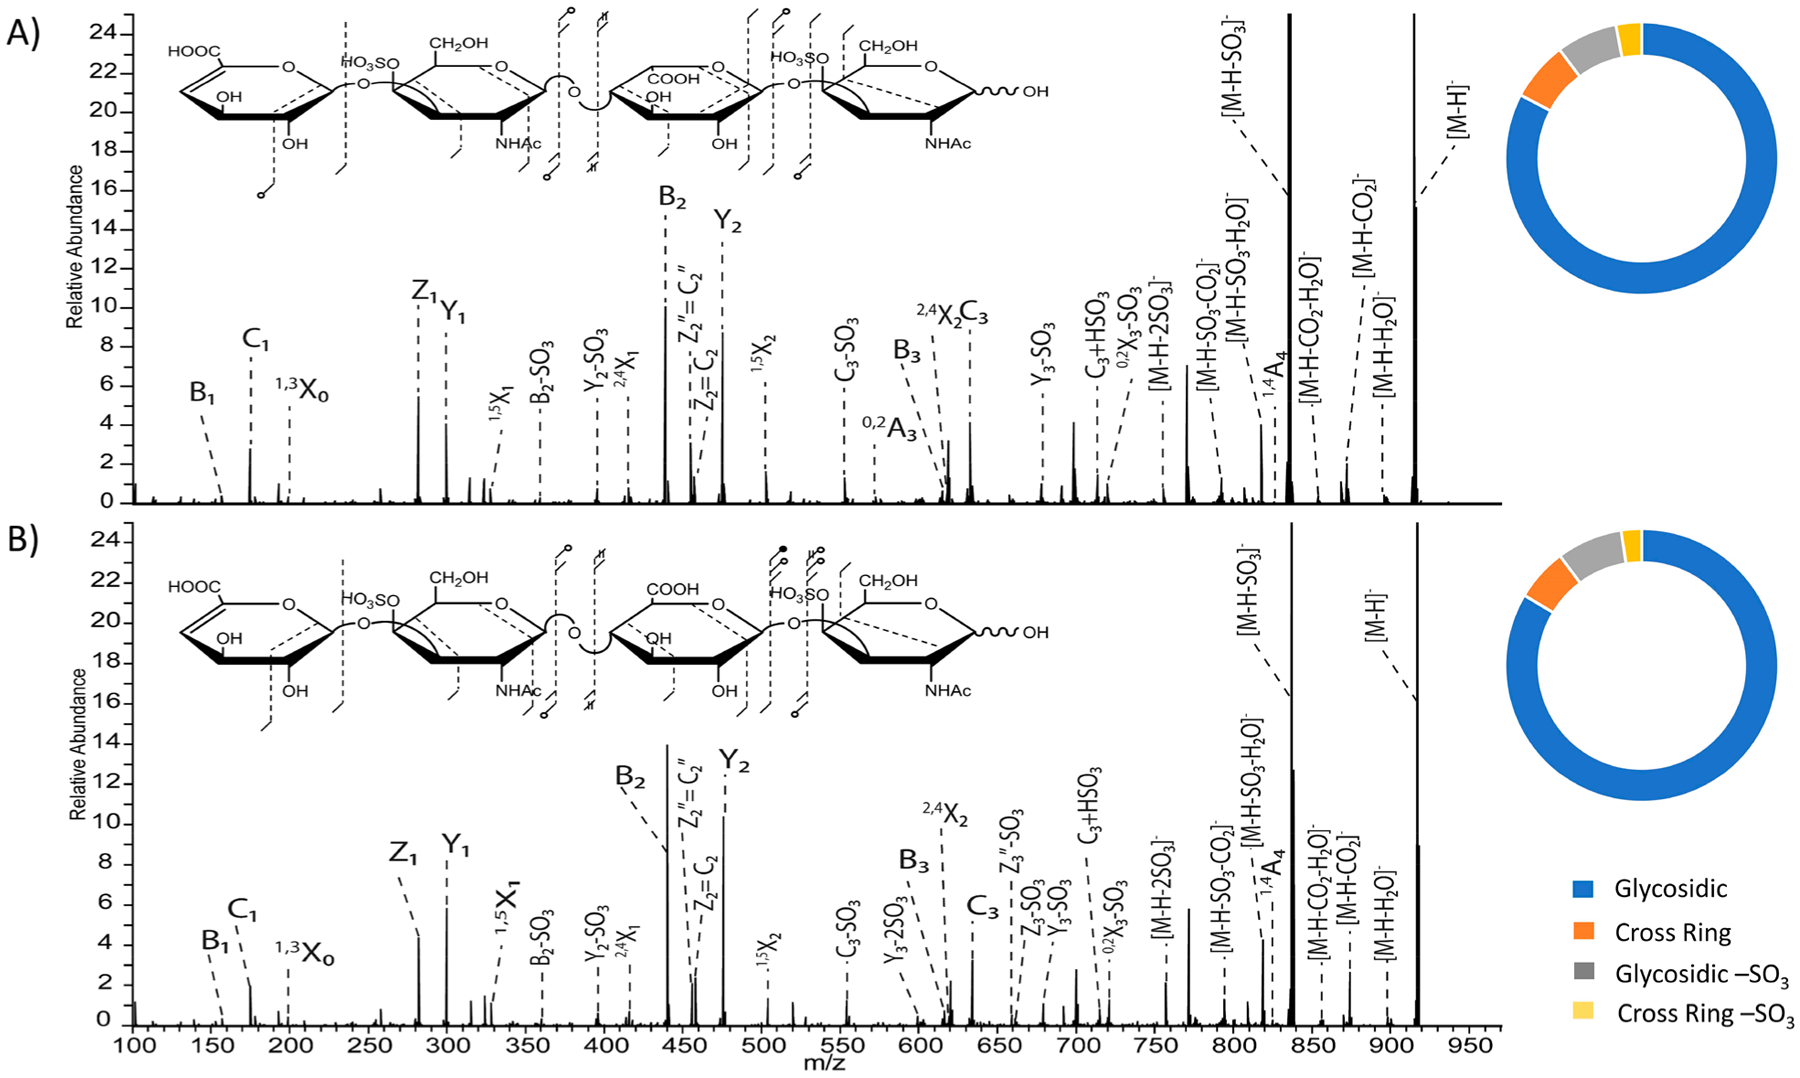
193 nm UVPD spectra of the [M − H]− precursor and intensity donut plots using eight laser pulses in the high-pressure cell of tetrasaccharides of (A) DS dp4 and (B) CS-A dp4. Donut plots depict the intensity distribution of glycosidic fragments (blue), cross-ring fragments (orange), glycosidic fragments with −SO3 loss (gray), and cross-ring fragments with −SO3 loss (yellow).
Figure 1B shows the fragmentation map of the [M − 2H]2− (m/z 458.061) precursor ion of CS-A dp4, which exhibits a greater diversity of cross-ring fragment ion types compared to the [M − H]− precursor ion. The doubly charged precursor is deprotonated at two of the four ionizable sites, likely the two sulfate modifications, as the sulfo half-esters are stronger acids than the carboxyl groups.35,54,55 The [M − 2H]2− precursor of CS-A dp4 exhibited a lower percentage of −SO3 loss than the [M − H]− precursor and a higher portion of cross-ring fragment ions (Figure 1E). Similar to UVPD of the singly charged precursor, the doubly charged precursor produced 2,4X2 and 1,4A4 ions for both CS-A dp4 and DS dp4, which assigns both sulfate modifications to 4-O positions on the amino sugars, shown in Figure 3. These fragment ions are more intense in the spectrum obtained for the doubly charged precursor than for the singly charged precursor. For the [M − 2H]2− precursor ion, the relative abundance of the Y1 versus the Z1 ions shows the same trend as observed for the singly charged precursor, where Y1 is more abundant than Z1 for CS-A dp4 and less abundant for DS dp4. Additionally, the C3 (m/z 634.093) fragment was much higher in abundance than the B3 (m/z 616.083) fragment for DS dp4 (Figure 3A), which was also noted previously with EDD.35 Past work showed that for CS-A the B3 fragment was more intense than C3; however, both fragment ions have very similar intensity in the UVPD spectrum of CS-A dp4. UVPD of both the singly and doubly charged precursors of DS dp4 and CS-A dp4 yielded fragment ions with the mass matching the addition of −HSO3 to the C3 fragment ion (m/z 715.057), which appears to arise from a rearrangement reaction of the sulfate modification. This fragment ion was not seen for the [M − 3H]3− and [M − 4H + Na]3− precursor ions (Figures 4 and S5), indicating that the location of deprotonation of acidic sites may play a role in gas-phase rearrangement processes.15 As discussed in our previously published paper,15 MS3 results support that sulfate migration has occurred, where the sulfate modification on the reducing end GalNAc has moved to the underivatized uronic acid residue.15 This is further supported by the presence of a [Y2/C3] + SO3 (m/z 272.99) internal fragment which corresponds to an uronic acid containing a sulfate modification. MS3 spectra of the m/z 715.057 fragment peak for DS dp4 and CS-A dp4 with additional assignments beyond those previously reported are shown in Figures S7 and S8.
Figure 3.
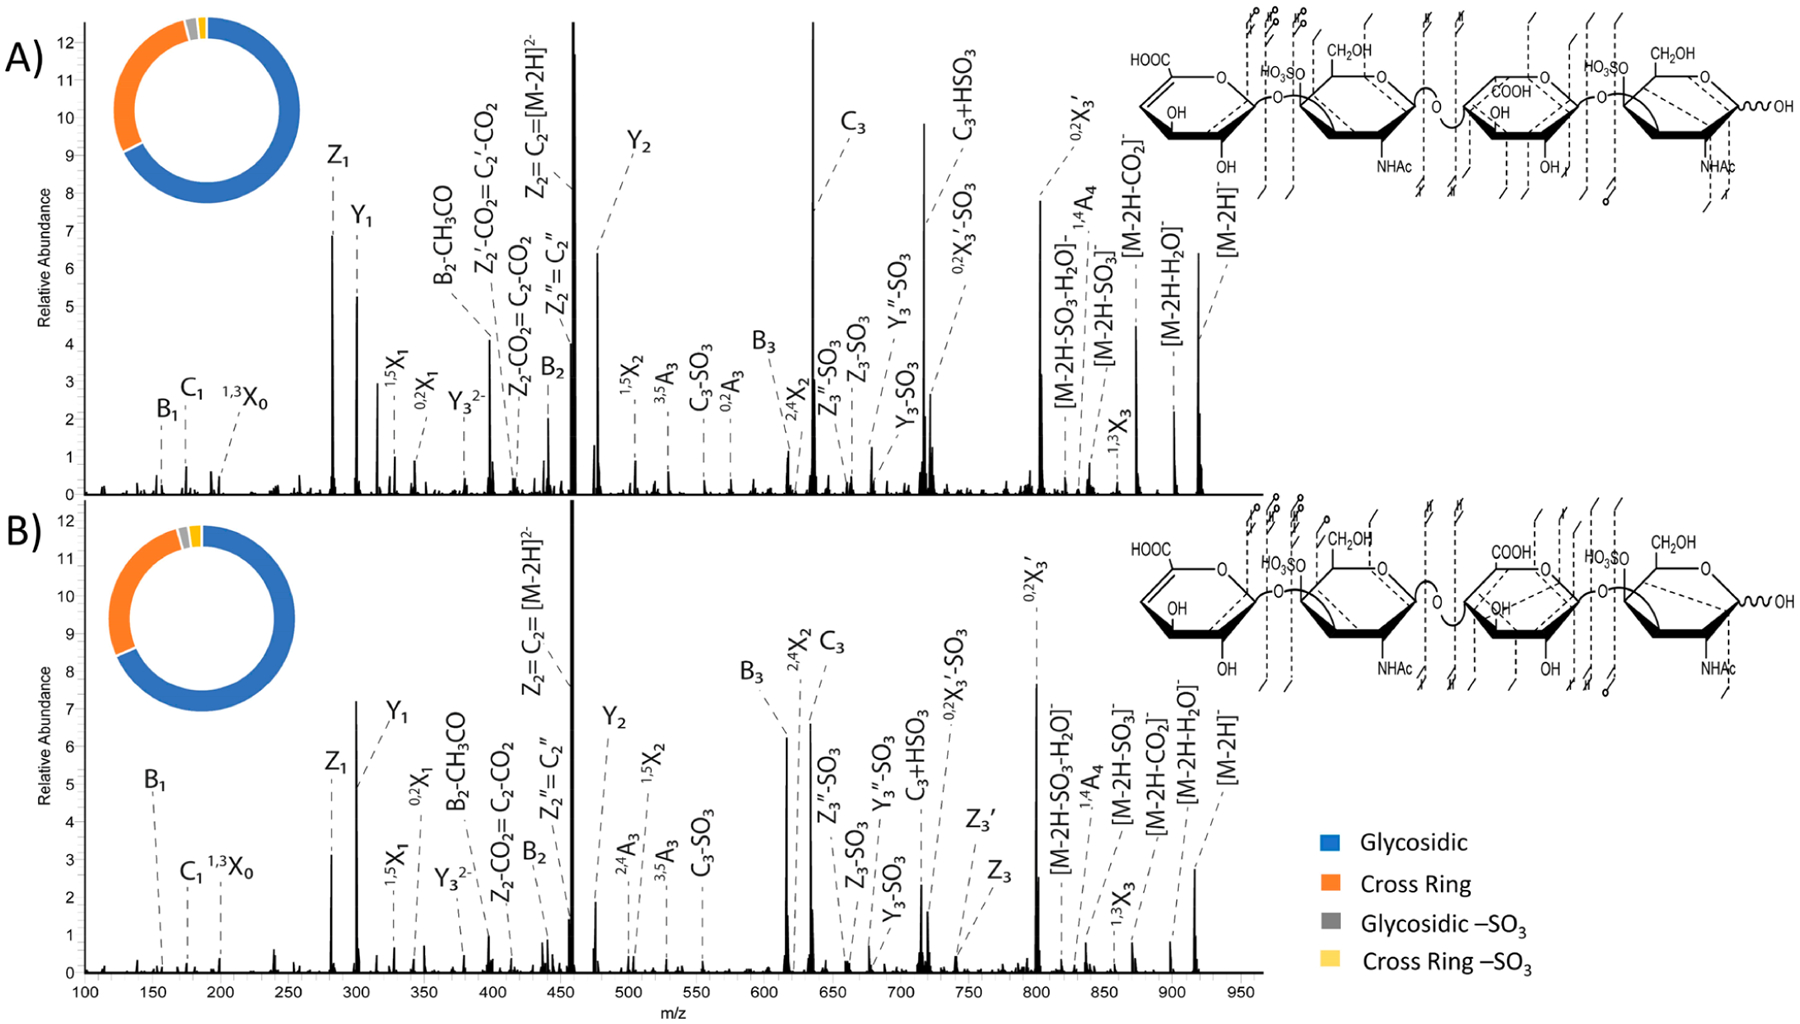
193 nm UVPD spectra using eight laser pulses (4 mJ per pulse) in the high-pressure cell of the [M − 2H]2− precursor with fragment map and intensity donut plot insets of (A) DS dp4 and (B) CS-A dp4. Tables S3–S8 contain identified fragment ions for the [M − 2H]2− precursors of CS-A and DS.
Figure 4.
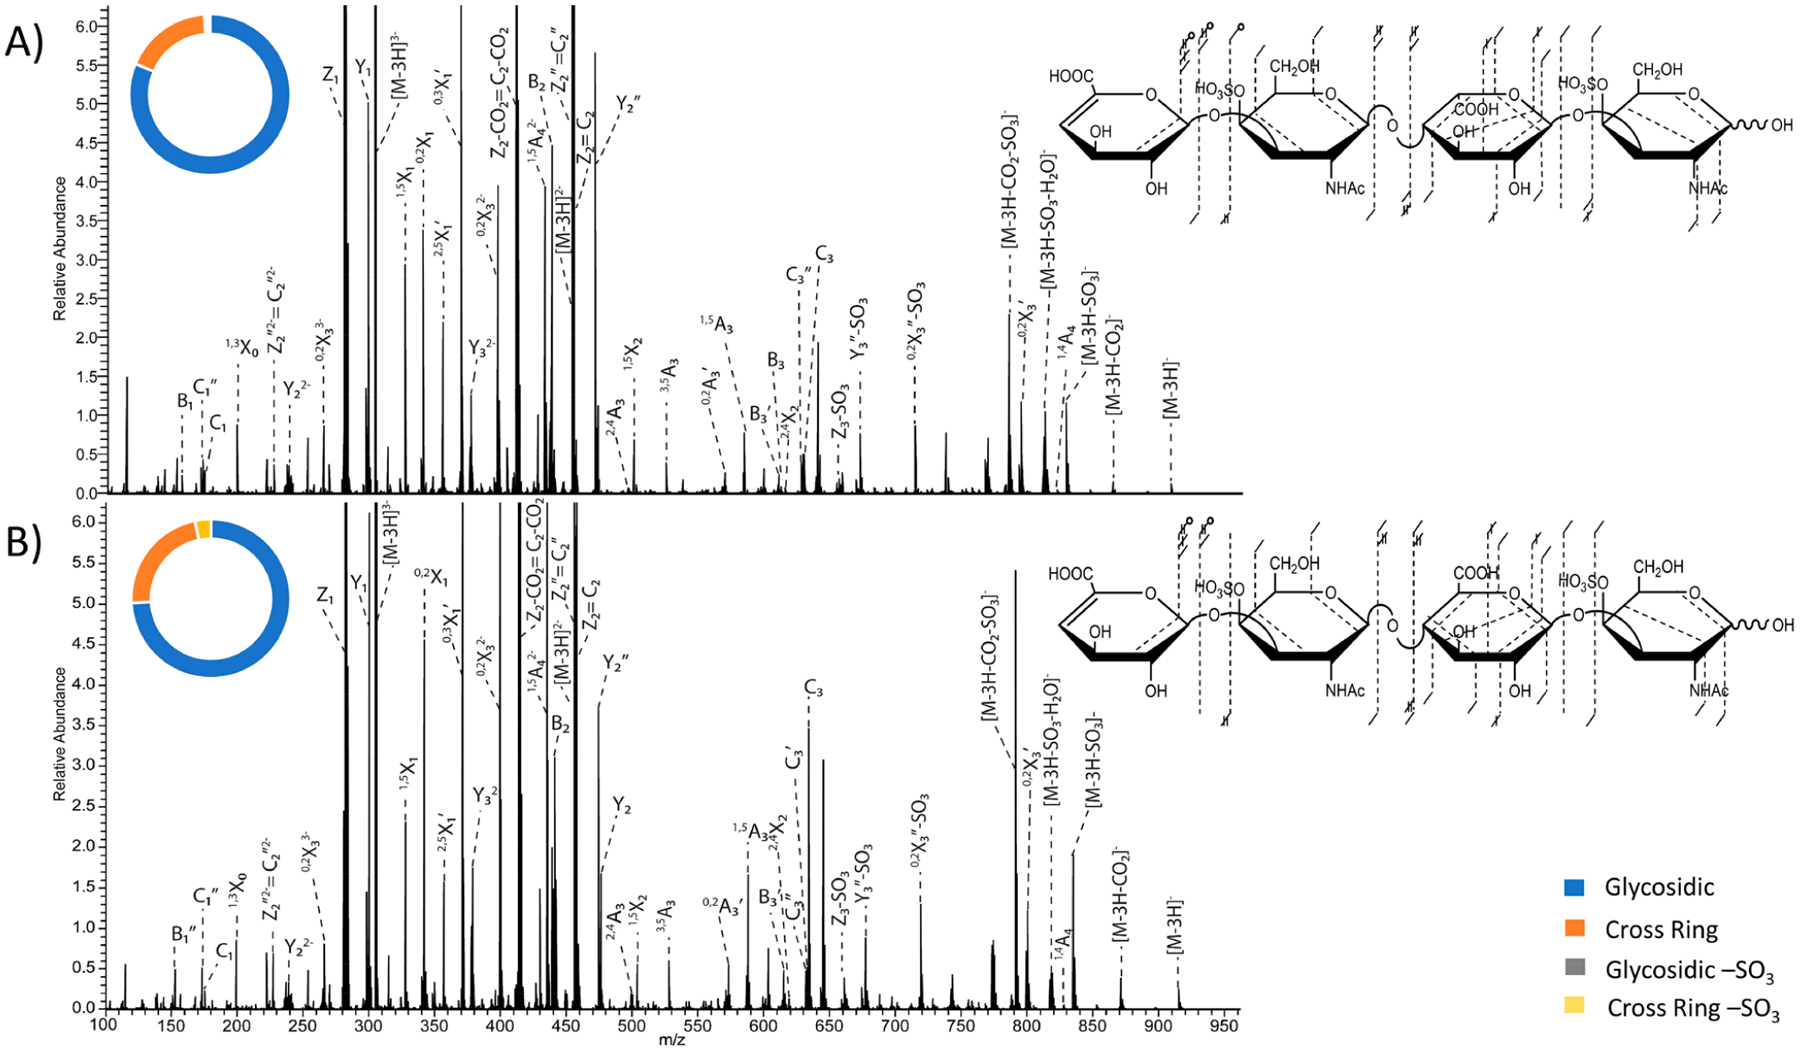
193 nm UVPD spectra using eight laser pulses (4 mJ per pulse) in the high-pressure cell of the [M − 3H]3− precursor with fragment map and donut plot insets of (A) DS dp4 and (B) CS-A dp4. Donut plots depict intensity distributions if glycosidic fragments (blue), cross-ring fragments (orange), glycosidic fragments with −SO3 loss (gray), and cross-ring fragments with −SO3 loss (yellow). Tables S9–S14 show identified fragment ions for the [M − 3H]3− precursor of CS-A and DS.
The triply charged precursor of CS-A dp4, [M − 3H]3−(m/z 305.038), is deprotonated at three of the four ionizable sites. Presumably both sulfate modifications and one of the carboxyl groups are ionized. Figure 1C shows the fragment ion map of the triply charged precursor, which yielded a higher diversity of cross-ring fragment ions than noted for the singly and doubly charged precursors, particularly those involving the reducing end galactosamine and glucuronic acid residues. Like the singly and doubly charged precursor ions, the triply charged precursor ion also produced 2,4X2 and 1,4A4 fragment ions for both CS-A dp4 and DS dp4, which establish the locations of both sulfate modifications, shown in Figure 4. The triply charged precursor, however, did not produce a higher intensity of cross-ring fragment ions (22.6%) compared to the doubly charged precursor (24.7%). It did, however, retain sulfate modifications more extensively than either the singly or doubly charged precursors (Figure 1E). These higher charge state precursors no longer exhibit a distribution of B3 and C3 ions that are diagnostic for uronic acid stereochemistry, a correlation that was noted for the singly and doubly charged precursors. Instead, for the triply charged precursor the C3 fragment ion is more intense than the B3 ion for both CS-A dp4 and DS dp4. As was seen previously using EDD, the [M − 3H]3− precursor does not produce stereospecific fragment ions.35 However, the present results differ from the EDD results in that the B3 and C3 ions are vanishingly small by EDD but have abundances comparable to other fragment ions in the UVPD mass spectrum.
UVPD of the fully ionized precursor, [M − 4H + Na]3−(m/z 312.366), produced a similar diversity of cross-ring fragment ion types to the triply charged precursor (Figure 1D). The [M − 4H + Na]3− precursor, however, did not produce the cross-ring fragment ions critical for assigning either sulfate modification as 4-O versus 6-O. This outcome may be due to the incorporation of Na, which adds more complexity to the spectrum and spreads signals out across additional fragmentation channels owing to the possible retention or exclusion of Na, resulting in a reduction of the overall S/N ratio.56 It is also possible that sodium stabilizes radical intermediates from electron detachment. It has been observed in EDD studies that a significant decrease in product ion formation results from the incorporation of sodium cation in the precursor.51 A comparison of UVPD of the [M − 4H + Na]3− precursor of CS-A and DS tetramers is shown in Figure S8. For the [M − 4H + Na]3− precursor ion, the intensity of the Y3 + Na (m/z 781.090) fragment was more intense than the Z3 + Na (m/z 763.079) fragment for DS dp4, and the Z3 + Na fragment was more intense than the Y1 + Na ion for CS-A dp4. Additionally, the doubly charged Y3 + Na fragment had a higher intensity in DS dp4 than in CS-A dp4; the doubly charged Z3 + Na fragment ion was not seen for either sample. This agrees with past findings that Yn fragment ions are diagnostic for DS.35,44
Precursor comparison for the DS tetrasaccharide, shown in Figure S9, followed a similar trend. The fully ionized precursor produced less cross-ring fragment ion diversity than observed for both the doubly and triply charged precursor ions. The fully ionized precursor also produced a lower percentage of cross-ring fragment ions (15.7%) than both the doubly (23.4%) and triply charged (17.6%) precursor ions. Neither sulfate modification could be localized at the 4-O position for the [M − 4H + Na]3− fragment ion; however, both sulfate modifications could be localized at the 4-O position for the singly, doubly, and triply charged precursor ions.
On the basis of these results obtained using UVPD, it can be concluded that SO3 loss is minimized when the ionization state is equal to one more than the number of sulfate modifications, and informative product ion formation can be maximized when the ionization state is either equal to, or one more than, the number of sulfate modifications present in the precursor. This is similar to the behavior of EDD and can guide precursor selection for the analysis of individual GAGs, for which one can select solution conditions to control the types of precursors that are generated in electrospray ionization. In contrast to EDD, UVPD produces informationally rich MS/MS spectra from lower charge states and with only a modest amount of sulfate decomposition exhibited among the standard fragment ions (A, B, C, X, Y, Z). Although we observe a substantial peak exhibiting loss of SO3 from the precursor ion, this ion does not appear to undergo further fragmentation. This is a significant result that can enable the integration of capillary zone electrophoresis (CZE) and tandem mass spectrometry for the analysis of GAG mixtures, as CZE buffers tend to produce lower charge states for GAGs that are difficult to analyze with other ion activation methods.57
Number of Pulses (193 nm UVPD).
The number of laser pulses used in a UVPD experiment has been shown to affect the fragmentation outcome. For example, past work by Cotham et al. showed that an increased number of laser pulses results in higher sequence coverage of monoclonal antibodies.58 The variation in fragmentation as the number of laser pulses increases is related to the higher signal-to-noise of fragment ions upon conversion of more precursor ions into fragment ions as well as conversion of primary fragment ions into other secondary fragment ions upon exposure to additional laser pulses.58 For this study, the number of laser pulses used was varied from four laser pulses to eight laser pulses at 4 mJ per pulse when using a 193 nm excimer laser. The increase in the number of laser pulses used resulted in an overall increase in fragment ion intensity, as shown for precursor ion [M − 3H]3− of the CS-A tetramer in Figure 5. The abundances of all product ions, including both glycosidic and cross-ring fragment ions, as well as neutral loss peaks, increased with an increase in pulses used. The sequence coverage however did not significantly increase, as shown in the fragment ion maps in Figure 5. When using eight laser pulses, the location of both sulfate modifications were assigned based on diagnostic 2,4X2 and 1,4A4 fragment ions (Figure 5A). Only the 2,4X2 fragment ion is seen when using four laser pulses (Figure 5B). This is likely due to the low intensity of these fragment ions. This trend was seen for both CS-A and DS tetramers. When comparing the intensity distribution of fragment ion types, there was minimal differences between the results obtained using four laser pulses and eight laser pulses. With an increase in the number of pulses, there is an expected increase in the fraction of precursor ions that undergo photoabsorption. The majority of the signal in these UVPD spectra is from undissociated precursor ions, suggesting that additional laser pulses could offer even higher yields of fragmentation. However, this must be balanced against the possibility of further fragmentation of product ions, leading to the formation of internal cleavage products that might confound the assignment of a structure.
Figure 5.
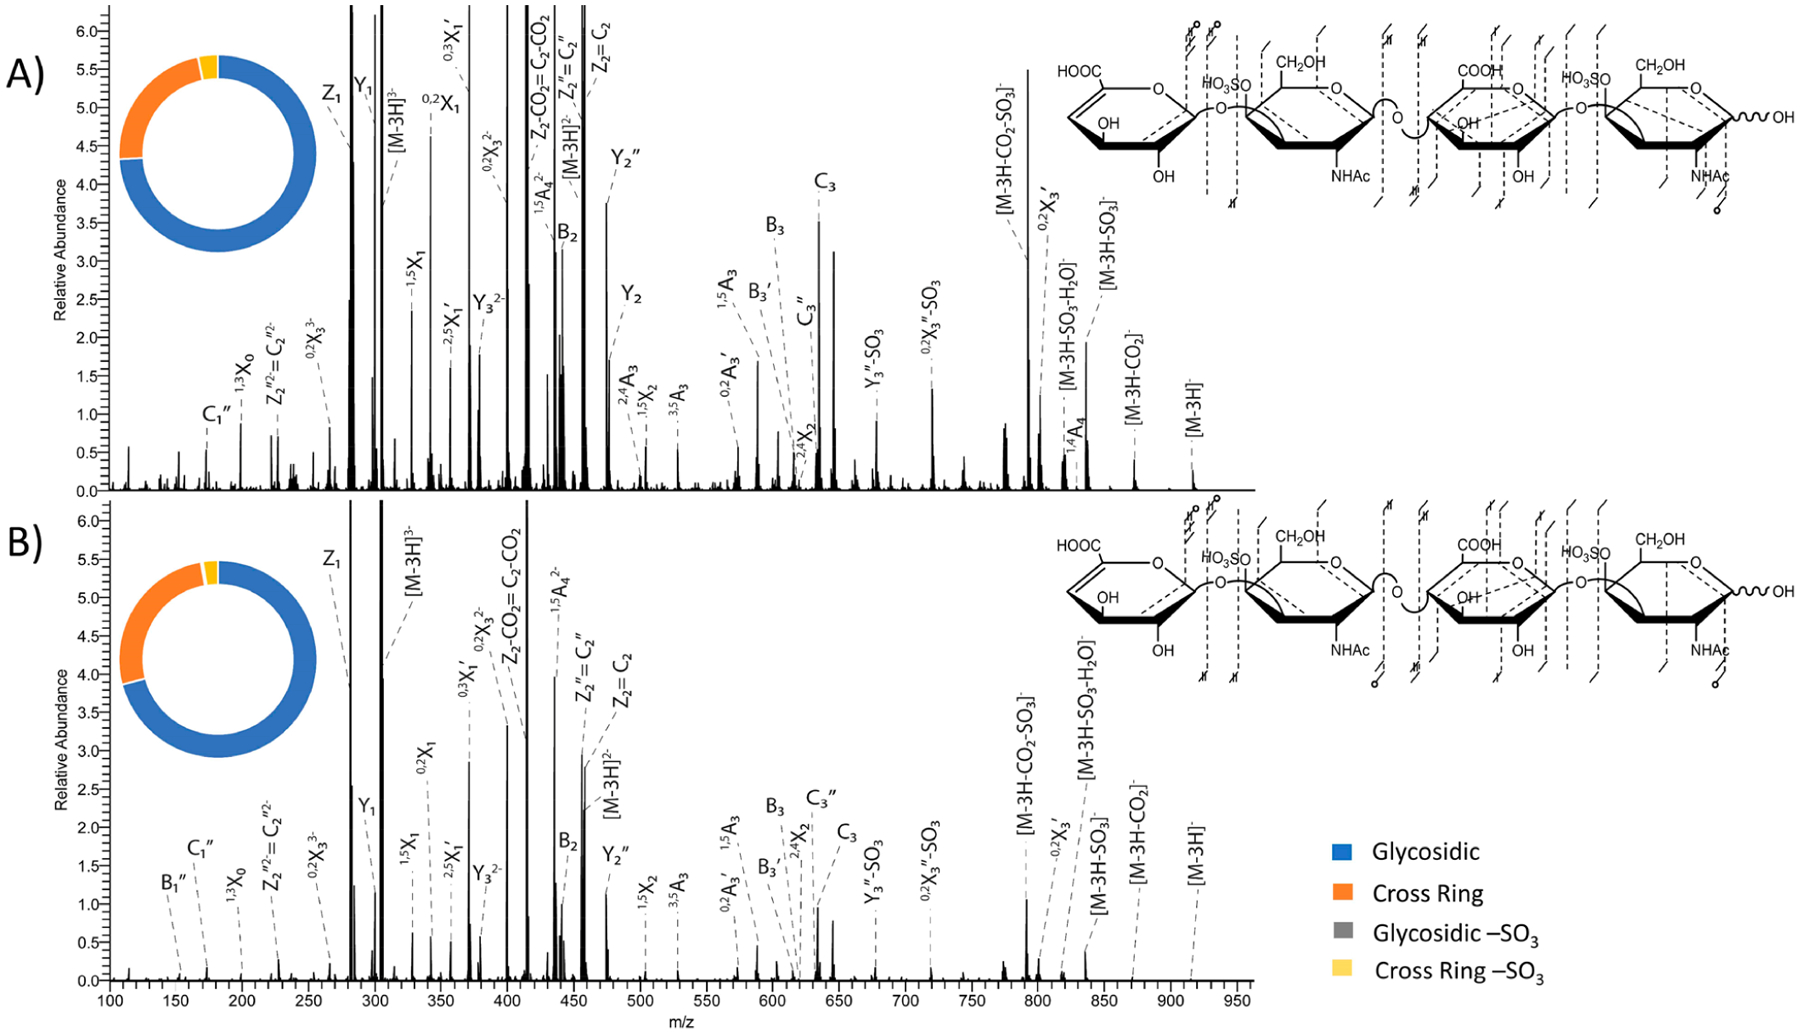
193 nm UVPD spectra with fragment map and intensity donut plot insets of the [M − 3H]3− precursor of CS-A dp4 with (A) eight laser pulses (4 mJ per pulse) in the high-pressure cell and (B) four laser pulses (4 mJ per pulse) in the high-pressure cell. Donut plots depict intensity distributions of glycosidic fragments (blue), cross-ring fragments (orange), glycosidic fragments with −SO3 loss (gray), and cross-ring fragments with −SO3 loss (yellow).
The effect of the number of laser pulses on differentiation of CS-A dp4 and DS dp4 was also investigated. UVPD of the [M − 2H]2− precursor of both CS-A dp4 and DS dp4 when using eight laser pulses in the high-pressure cell is shown in Figure 3. For DS dp4, the Y1 fragment ion is less intense than the Z1 ion, whereas for CS-A dp4 the Z1 fragment is more intense than the Y1 ion. Additionally, for DS dp4, the C3 fragment ion was more intense than the B3 fragment, whereas for CS-A dp4 both fragment ions were similar in intensity. These distribution differences have been noted previously for EDD.35 For UVPD of the [M − 2H]2− precursor ion using four laser pulses in the high-pressure cell (Figure S10), the same distributions for diagnostics fragments were seen. This indicates that although increasing the number of laser pulses increases the intensities of fragment ions it does not change their relative distribution. This was also investigated for the [M − 3H]3− precursor. As previously noted, the triply charged precursor did not yield any diagnostic fragments. However, like the [M − 2H]2− precursor, the [M − 3H]3− precursor did not exhibit any changes in fragmentation distribution when eight laser pulses and four laser pulses for UVPD (Figures 4 and S11).
Using the Low-Pressure or High-Pressure Cell.
A benefit of performing UVPD experiments on a mass spectrometer with a dual linear ion trap is the ability to carry out UVPD in either the high-pressure or low-pressure region. The observation of fragment ions upon UVPD experiments in either portion of a dual-pressure ion trap results from the ability of high energy photons to fragment ions via single photon absorption, unlike other techniques which require multiple photons, such as IRMPD. When comparing results for the [M − 3H]3− precursor ion of DS tetrasaccharide using the high-pressure cell (eight laser pulses) and the low-pressure cell (eight laser pulses), the sequence coverage did not change significantly. Both the high-pressure cell and low-pressure cell UVPD experiments resulted in almost identical sequence coverage. However, the high-pressure cell resulted in an overall increase of fragment ion intensity and produced two cross-ring fragments needed to assign the location of both sulfate modifications, 2,4X2 and 1,4A4. These cross-ring fragments were not seen in the low-pressure cell results. A higher pressure in the ion trap produces more radial condensation of the ion cloud and an increased overlap with the laser beam. This leads to a better conversion of precursor ions to fragment ions, as seen in Figure 6 for DS dp4. Though the fragmentation coverage of the GAG chain is almost identical between the high-pressure cell and low-pressure cell experiments, there was an increase in the intensity of cross-ring fragment ions when activating precursor ions in the low-pressure cell. This change in intensity distribution is likely due to a few intense glycosidic fragments, specifically the Z1, Y1 and Z2/C2 fragment ions in the high-pressure cell UVPD data, which are likely affecting the intensity distribution between glycosidic and cross-ring cleavages.
Figure 6.
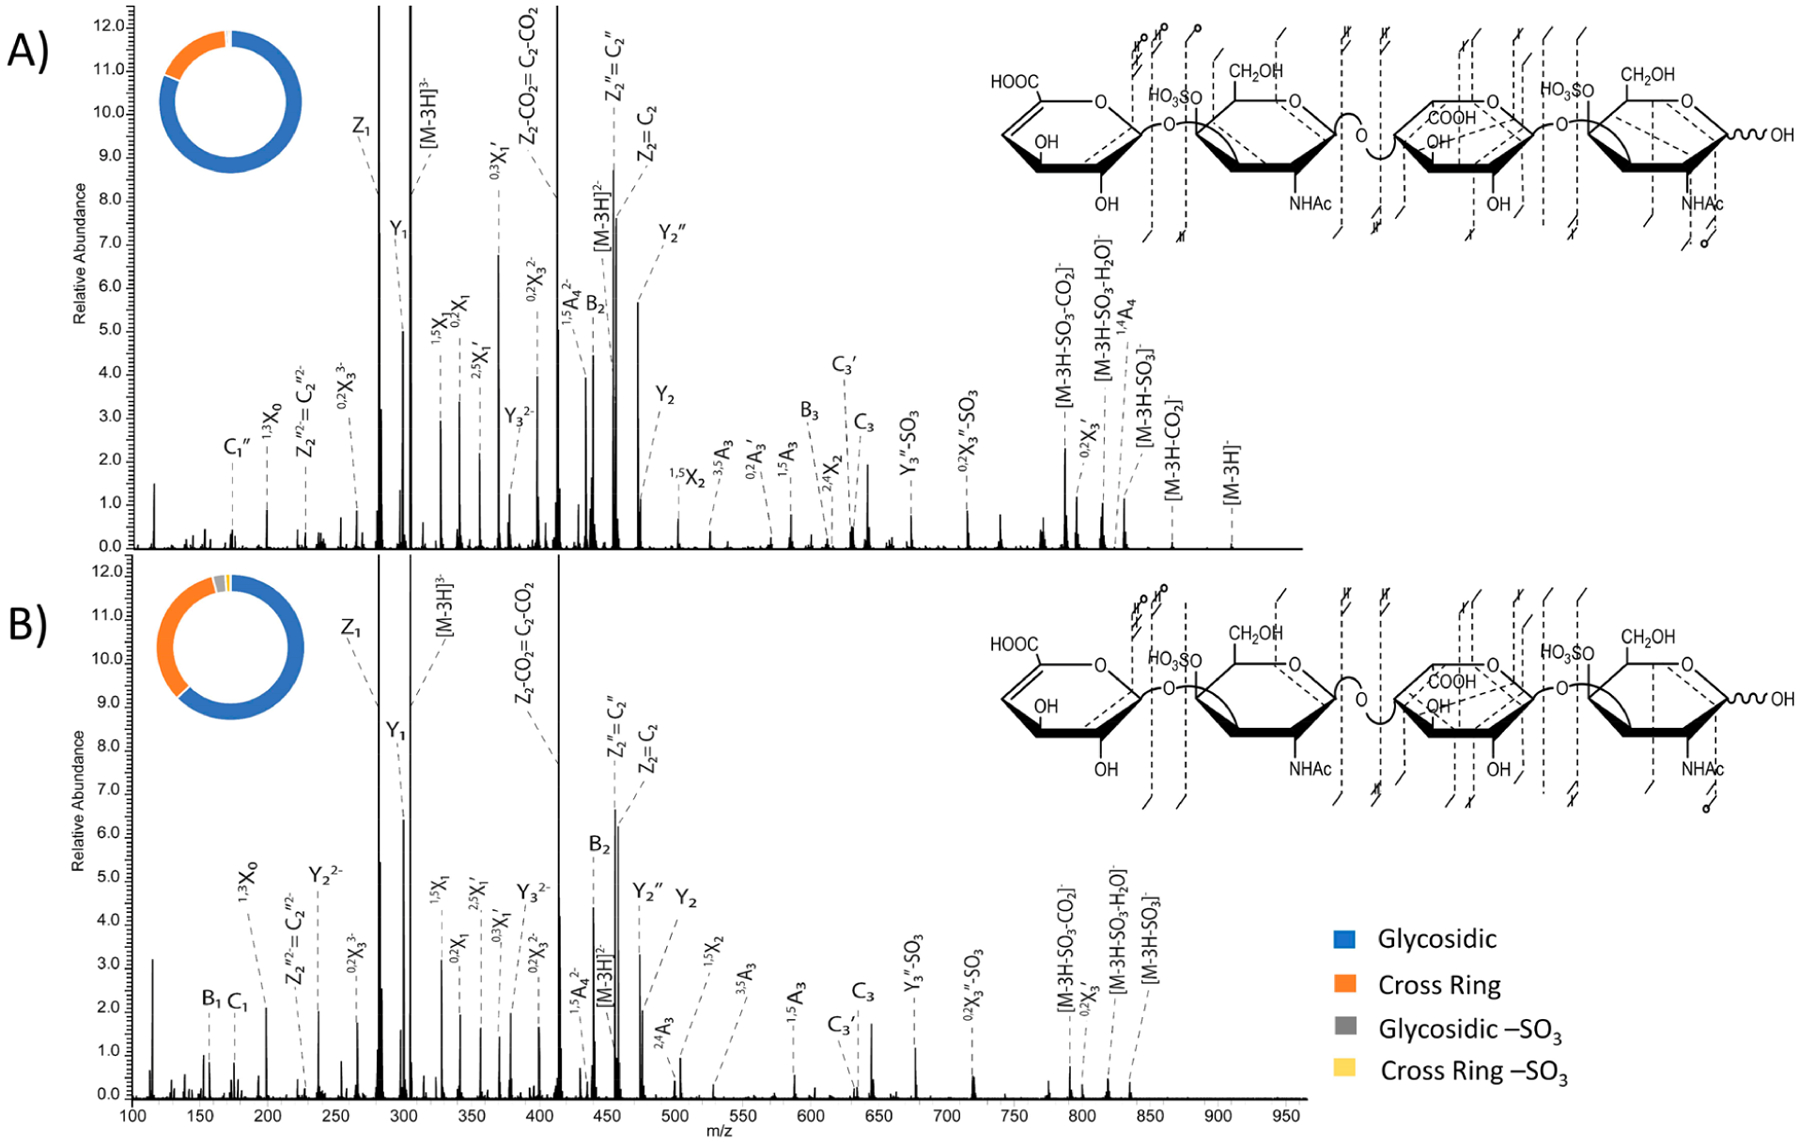
193 nm UVPD spectra with fragment map and donut plot insets of the [M − 3H]3− precursor of DS dp4 with eight pulses (4 mJ per pulse) in the (A) high-pressure cell and (B) low-pressure cell.
The influence of trapping pressure on formation of diagnostic fragments was also investigated. When activating the [M − 2H]2− precursor (m/z 458.061) of DS dp4 in the high-pressure cell with eight laser pulses (4 mJ per pulse), the C3 fragment ion was much more intense than the B3 fragment ion, whereas for CS-A dp4 the B3 and C3 fragment ions have similar intensities. Additionally, the Y1 fragment is more intense than Z1 in CS-A dp4, whereas for DS dp4 Z1 ion is more intense (Figure 3). When the same precursor was activated in the low-pressure cell using eight laser pulses (4 mJ per pulse), the C3 fragment was still much more intense than the B3 fragment in DS dp4, but the Y1 fragment was slightly more intense than the Z1 fragment for CS-A (Figure S12). These results coincide with the results from the [M − 3H]3− precursor (Figure S13); activation in the high-pressure cell results in an overall increase in fragment ion intensity, but activation in the low-pressure cell does not change the intensity distribution of diagnostic fragment ions. UVPD in either the high-pressure cell or low-pressure cell can yield diagnostic fragment ions to distinguish CS-A dp4 from DS dp4.
Laser Wavelength (193 nm vs 213 nm).
193 nm UVPD has successfully been used for structural characterization of acidic saccharides, locating sulfate modifications on peptides, and recently, the structural characterization of GAGs.15,59,60 213 nm UVPD has recently been made a commercially available option with Orbitrap MS via use of a high repetition rate, low power solid state laser.61,62 While the energy per photon is similar (6.4 eV per 193 nm photon versus 5.8 eV per 213 nm photon), the lower power (3 μJ per pulses) of the solid state laser means that more pulses are needed to deliver comparable energy to the excimer laser (mJ per pulse). However, the difference in power delivered to the trapped ions is not as extreme as one might expect from difference in the outputs of the two lasers. The 193 nm excimer laser has a large beam divergence that results in a small percentage of the beam overlapping with the trapped ions compared to the 213 nm solid-state laser, which has a much more coherent and well-focused output. We compared the fragmentation patterns of GAGS using the two lasers. Figure 7 shows a comparison of fragmentation for the [M − 3H]3− precursor of DS dp4. The red dashes indicate fragment ions observed only upon 193 nm UVPD, and blue dashes represents fragment ions detected only by 213 nm UVPD. Black dashes indicate fragment ions produced by both 193 and 213 nm UVPD. Figure 7A compares 213 nm UVPD fragmentation using 125 pulses (50 ms period) to 193 nm UVPD using four laser pulses (8 ms period), both in the high-pressure cell. 193 nm UVPD produced of a 2,4X2 fragment ion, which locates a sulfate modification at the 4-O position on the nonreducing end GalNAc. Figure 7B compares the fragmentation obtained using 213 nm UVPD (1000 laser pulses in a 400 ms period) to 193 nm UVPD (eight laser pulses at 4 mJ), both in the high-pressure cell. In both cases, the location of the sulfate positions were pinpointed. Both produced a 2,4X2 fragment and 213 nm UVPD also produced a 2,4A42− fragment, whereas 193 nm UVPD produced a 1,4A4 fragment. By increasing the number of pulses from 125 to 1000, the sequence information gained from 213 nm UVPD was drastically increased (Figure 7A,B), presumably owing to greater conversion of precursor ions into meaningful fragment ions. When UVPD was performed in the low-pressure cell, neither 213 nm UVPD nor 193 nm UVPD allowed successful assignment of the location of sulfate modifications (Figure 7C). Both lasers resulted in production of glycosidic fragment ions that can be used to assign the location of sulfate modifications to the amino sugars and not the uronic acid residues. 213 nm UVPD (1000 pulses) in the low-pressure cell allowed assignment of both sulfate modifications based on 2,4X2 and 2,4A42− fragment ions, but 193 nm UVPD (eight laser pulses) in the low-pressure cell was unable to assign the location of either sulfate modification (Figure 7D). For all conditions, 213 nm UVPD produced a higher intensity of cross-ring fragment ions than 193 nm UVPD. However, as seen in the fragment maps in Figure 7, the higher intensity of cross-ring fragments does not mean a higher abundance and diversity of cross-ring fragment types.
Figure 7.
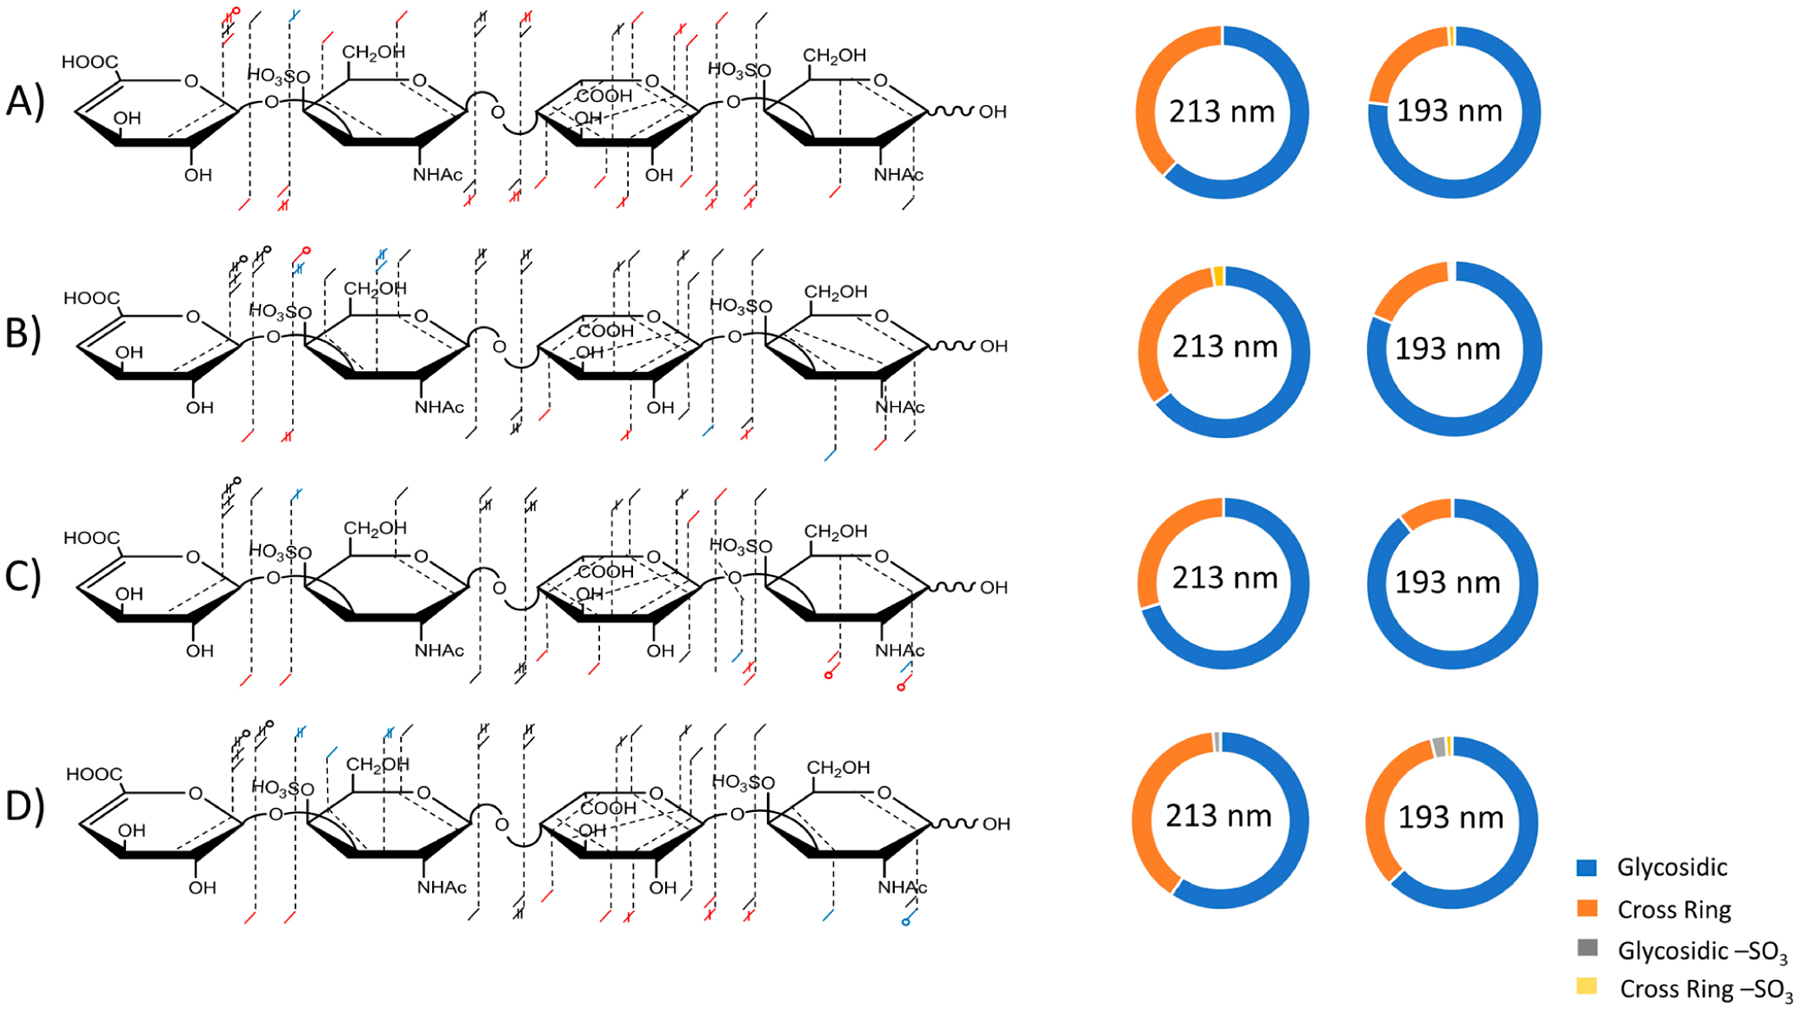
Annotated fragment maps and donut plots of the [M − 3H]3− precursor of DS dp4 comparing 213 nm UVPD to 193 nm UVPD. Red dashes indicate fragment ions observed solely using 193 nm UVPD, blue dashes indicated fragment ions observed exclusively using 213 nm UVPD, and black dashes indicate fragments produced using 193 nm UVPD or 213 nm UVPD. (A) 213 nm UVPD with 125 pulses (3 μJ/pulse) in the high-pressure cell compared to 193 nm UVPD with four laser pulses (4 mJ/pulse) in the high-pressure cell. (B) 213 nm UVPD with 1000 pulses (3 μJ/pulse) in the high-pressure cell compared to 193 nm UVPD with eight laser pulses (4 mJ/pulse) in the high-pressure cell. (C) 213 nm UVPD with 125 pulses (3 μJ/pulse) in the low-pressure cell compared to 193 nm UVPD with four laser pulses (4 mJ/pulse) in the low-pressure cell. (D) 213 nm UVPD with 1000 pulses (3 μJ/pulse) in the low-pressure cell compared to 193 nm UVPD with eight laser pulses (4 mJ/pulse) in the low-pressure cell.
Number of Laser Pulses (213 nm UVPD).
For experiments using the 213 nm solid state laser, the number of pulses was varied from 125 to 1000, and a comparison of the spectra obtained using 125, 375, 750, and 1000 pulses of the [M − 3H]3− precursor ion of DS dp4 is shown in Figure 8. By increasing the number of laser pulses, there is in increase in overall signal intensity, leading to more fragment ion coverage. Using 1000 pulses produced more diverse fragmentation than 125 pulses. Neither sulfate modification could be located using 125 pulses. Using 375 pulses allowed localization of one sulfate modification via a 2,4A42− fragment ion but did not permit localization of the remaining sulfate modification. Applying 750 or 1000 pulses allowed localization of both sulfate modifications based on 2,4X2 and 2,4A42− fragment ions. Figure S14 shows a comparison of 213 nm UVPD with 750 laser pulses (3 μJ/pulse) in the high-pressure cell to 213 nm UVPD with 750 pulses (3 μJ/pulse) in the low-pressure cell. As was noted for 193 nm UVPD, the high-pressure cell produces an overall higher intensity of fragment ions than the low-pressure cell. For CS/DS GAGs, this increase in fragment ion intensity is imperative for distinguishing 4-O and 6-O sulfation, as the necessary cross-ring fragment ions to do this are low intensity.
Figure 8.
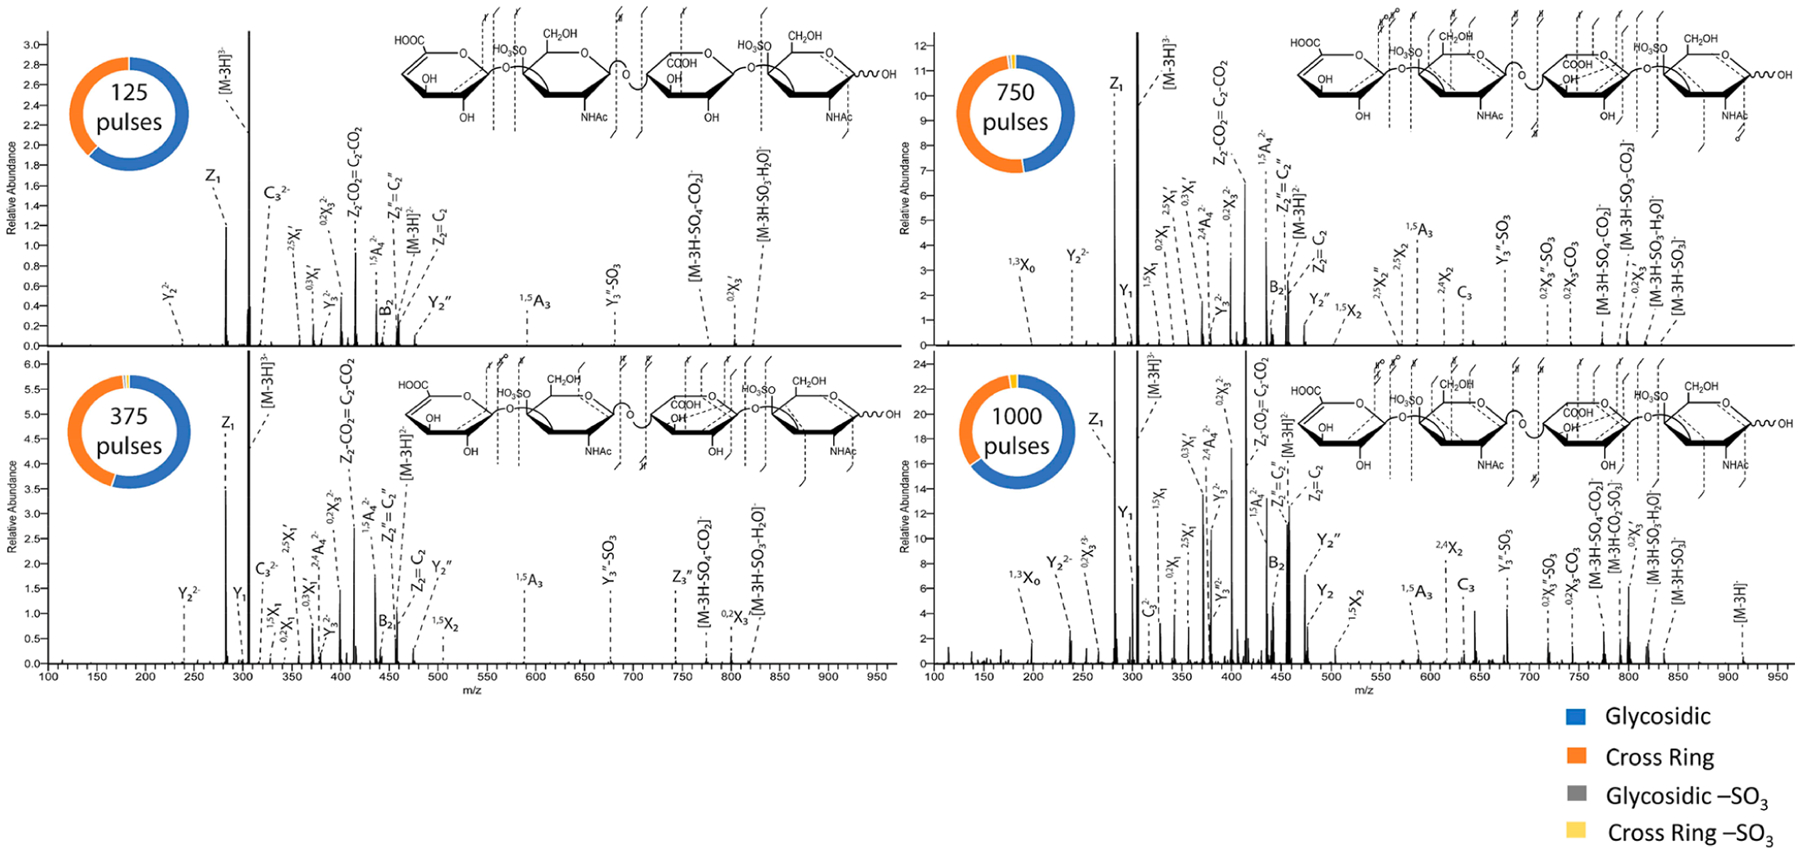
213 nm UVPD spectra of the [M − 3H]3− precursor of DSdp4 with fragment map and donut plot insets illustrating the effect of the number of pulses. Fragment ion lists are shown in Tables S17–S22.
CONCLUSIONS
The importance of optimizing UVPD fragmentation parameters for efficiently converting precursor ions to fragment ions has been previously demonstrated for proteins and peptides. Here, we outline the effect these parameters have on fragmentation and distinction of DS and CS-A tetrasaccharide GAG standards. The parameters that were shown to be imperative for enhancing protein fragmentation, including precursor charge state, number of laser pulses, and pulse energy, have been shown here to play a large role in GAG fragmentation as well. UVPD using either a 193 nm excimer laser or a 213 nm solid-state laser can yield informative fragmentation for GAG standards. Increasing the number of pulses for both wavelengths can yield more informative fragmentation and increase the fragmentation abundance. However, what was shown to have the largest effect on increasing the information content of UVPD mass spectra was precursor ionization state. A precursor with one more deprotonated site than the number of sulfate modifications was shown to reduce sulfate decomposition while also maintaining informative fragments. DS dp4 and CS-A dp4 could be distinguished from each other using UVPD in the same manner as was previously noted for other activation methods in which Z1, C3, Y3, and Z2′′/C2′′ ions were shown to be indictive of DS dp4.
Supplementary Material
ACKNOWLEDGMENTS
Funding from the NIH (Grant Nos. R01 GM103655 and R35 GM139658 to J.S.B.) and the Welch Foundation (Grant No. F-1155 to J.S.B.) are gratefully acknowledged. I.J.A., F.E.L., and L.E.P. are grateful for generous support from the National Institutes of Health and the Common Fund for Glycoscience (Grant Nos. R21HL136271, U01CA231074, and P41GM103390). Funding from the UT System for support of the UT System Proteomics Core Facility Network is gratefully acknowledged. We also acknowledge Robert Linhardt and Fuming Zhang (Rensselaer Polytechnic Institute) for previously provided CS-A and DS samples that were utilized during this study.
Footnotes
Supporting Information
The Supporting Information is available free of charge at https://pubs.acs.org/doi/10.1021/jasms.1c00119.
Figure S1, UVPD schematic; Figure S2, HCD spectrum of [M − H]− precursor ion of CS-A dp4; Figure S3, zoomed-in view of fragment ion 1,4A4; Figure S4, zoomed-in view of fragment ion 2,4X2; Figure S5, full scan UVPD of CS-A dp4 singly charged precursor ion; Figure S6, 193 nm UVPD spectra with eight pulses of [M − 4H + Na]3− precursor of DS and CS-A dp4 in high-pressure cell; Figure S7, MS3 spectra of DS dp4; Figure S8, MS3 spectra CS-A dp4; Figure S9, annotated fragment maps and donut plots of DS dp4 [M − H]−, [M − 2H]2−, [M − 3H]3−, and [M − 4H + Na]3− precursors; Figure S10, 193 nm UVPD four-laser pulse spectra of [M − 2H]2− precursor of DS and CS-A dp4 in high-pressure cell; Figure S11, 193 nm UVPD four-laser pulse spectra of [M − 3H]3− precursor of DS and CS-A dp4 in high-pressure cell; Figure S12, 193 nm UVPD eight-laser pulses spectra of [M − 2H]2− precursor of DS and CS-A dp4 in low-pressure cell; Figure S13, 193 nm UVPD eight-laser pulses spectra of [M − 3H]3− precursor of DS and CS-A dp4 in low-pressure cell; Figure S14, 213 nm UVPD of [M − 3H]3− precursor ion of DS dp4 using 750 pulses; Tables S1–S26, fragment lists for all samples and experiment parameters discussed (PDF)
The authors declare no competing financial interest.
Complete contact information is available at: https://pubs.acs.org/10.1021/jasms.1c00119.
Contributor Information
Lauren E. Pepi, Department of Chemistry, University of Georgia, Athens, Georgia 30602, United States;.
Franklin E. Leach, III, Department of Environmental Health Sciences and Department of Chemistry, University of Georgia, Athens, Georgia 30602, United States;.
Dustin R. Klein, Department of Biochemistry and Mass Spectrometry Research Center, Vanderbilt University, Nashville, Tennessee 37232, United States;.
Jennifer S. Brodbelt, Department of Chemistry, University of Texas at Austin, Austin, Texas 78712, United States;.
I. Jonathan Amster, Department of Chemistry, University of Georgia, Athens, Georgia 30602, United States;.
REFERENCES
- (1).Shaw JB; Li W; Holden DD; Zhang Y; Griep-Raming J; Fellers RT; Early BP; Thomas PM; Kelleher NL; Brodbelt JS Complete protein characterization using top-down mass spectrometry and ultraviolet photodissociation. J. Am. Chem. Soc 2013, 135, 12646–12651. [DOI] [PMC free article] [PubMed] [Google Scholar]
- (2).Shaw JB; Robinson EW; Paša-Tolicć L Vacuum Ultraviolet Photodissociation and Fourier Transform-Ion Cyclotron Resonance (FT-ICR) Mass Spectrometry: Revisited. Anal. Chem 2016, 88, 3019–3023. [DOI] [PubMed] [Google Scholar]
- (3).Madsen JA; Boutz DR; Brodbelt JS Ultrafast ultraviolet photodissociation at 193 nm and its applicability to proteomic workflows. J. Proteome Res 2010, 9, 4205–4214. [DOI] [PMC free article] [PubMed] [Google Scholar]
- (4).Ly T; Julian RR Ultraviolet photodissociation: developments towards applications for mass-spectrometry-based proteomics. Angew. Chem., Int. Ed 2009, 48, 7130–7137. [DOI] [PubMed] [Google Scholar]
- (5).Guan Z; Kelleher NL; O’Connor PB; Aaserud DJ; Little DP; McLafferty FW 193 nm photodissociation of larger multiply-charged biomolecules. Int. J. Mass Spectrom. Ion Processes 1996, 157, 357–364. [Google Scholar]
- (6).Bowers WD; Delbert SS; Hunter RL; McIver RT Jr Fragmentation of oligopeptide ions using ultraviolet laser radiation and Fourier transform mass spectrometry. J. Am. Chem. Soc 1984, 106, 7288–7289. [Google Scholar]
- (7).Thompson MS; Cui W; Reilly JP Fragmentation of singly charged peptide ions by photodissociation at λ= 157 nm. Angew. Chem., Int. Ed 2004, 43, 4791–4794. [DOI] [PubMed] [Google Scholar]
- (8).Devakumar A; Thompson MS; Reilly JP Fragmentation of oligosaccharide ions with 157 nm vacuum ultraviolet light. Rapid Commun. Mass Spectrom 2005, 19, 2313–2320. [DOI] [PubMed] [Google Scholar]
- (9).Devakumar A; Mechref Y; Kang P; Novotny MV; Reilly JP Laser-induced photofragmentation of neutral and acidic glycans inside an ion-trap mass spectrometer. Rapid Commun. Mass Spectrom 2007, 21, 1452–1460. [DOI] [PubMed] [Google Scholar]
- (10).Cui W; Thompson MS; Reilly JP Pathways of peptide ion fragmentation induced by vacuum ultraviolet light. J. Am. Soc. Mass Spectrom 2005, 16, 1384–1398. [DOI] [PubMed] [Google Scholar]
- (11).Smith SI; Brodbelt JS Hybrid activation methods for elucidating nucleic acid modifications. Anal. Chem 2011, 83, 303–310. [DOI] [PMC free article] [PubMed] [Google Scholar]
- (12).Pham HT; Julian RR Characterization of glycosphingolipid epimers by radical-directed dissociation mass spectrometry. Analyst 2016, 141, 1273–1278. [DOI] [PubMed] [Google Scholar]
- (13).Pham HT; Trevitt AJ; Mitchell TW; Blanksby SJ Rapid differentiation of isomeric lipids by photodissociation mass spectrometry of fatty acid derivatives. Rapid Commun. Mass Spectrom 2013, 27, 805–815. [DOI] [PubMed] [Google Scholar]
- (14).Hancock SE; Ailuri R; Marshall DL; Brown SH; Saville JT; Narreddula VR; Boase NR; Poad BL; Trevitt AJ; Willcox MD Mass spectrometry-directed structure elucidation and total synthesis of ultra-long chain (O-acyl)-ω-hydroxy fatty acids. J. Lipid Res 2018, 59, 1510–1518. [DOI] [PMC free article] [PubMed] [Google Scholar]
- (15).Klein D; Leach FI; Amster I; Brodbelt J Structural Characterization of Glycosaminoglycan Carbohydrates using Ultraviolet Photodissociation. Anal. Chem 2019, 91, 6019–6026. [DOI] [PMC free article] [PubMed] [Google Scholar]
- (16).Crittenden CM; Novelli ET; Xu G; Giles DH; Fies WA; Mehaffey MR; Dalby KN; Webb LJ; Brodbelt JS Structural Evaluation of Protein/Metal Complexes via Native Electrospray Ultraviolet Photodissociation Mass Spectrometry. J. Am. Soc. Mass Spectrom 2020, 31, 1140–1150. [DOI] [PMC free article] [PubMed] [Google Scholar]
- (17).Klein DR; Blevins MS; Macias LA; Douglas M; Trent MS; Brodbelt JS Localization of Double Bonds in Bacterial Glycerophospholipids Using 193 nm Ultraviolet Photodissociation in the Negative Mode. Anal. Chem 2020, 92, 5986–5993. [DOI] [PMC free article] [PubMed] [Google Scholar]
- (18).Sipe SN; Patrick JW; Laganowsky A; Brodbelt JS Enhanced Characterization of Membrane Protein Complexes by Ultraviolet Photodissociation Mass Spectrometry. Anal. Chem 2020, 92, 899–907. [DOI] [PMC free article] [PubMed] [Google Scholar]
- (19).Julian RR The mechanism behind top-down UVPD experiments: making sense of apparent contradictions. J. Am. Soc. Mass Spectrom 2017, 28, 1823–1826. [DOI] [PMC free article] [PubMed] [Google Scholar]
- (20).Racaud A; Antoine R; Joly L; Mesplet N; Dugourd P; Lemoine J Wavelength-tunable ultraviolet photodissociation (UVPD) of heparin-derived disaccharides in a linear ion trap. J. Am. Soc. Mass Spectrom 2009, 20, 1645–1651. [DOI] [PubMed] [Google Scholar]
- (21).Racaud A; Antoine R; Dugourd P; Lemoineb J Photo-induced dissociation of heparin-derived oligosaccharides controlled by charge location. J. Am. Soc. Mass Spectrom 2010, 21, 2077–2084. [DOI] [PubMed] [Google Scholar]
- (22).Gabelica V; Tabarin T; Antoine R; Rosu F; Compagnon I; Broyer M; De Pauw E; Dugourd P Electron photodetachment dissociation of DNA polyanions in a quadrupole ion trap mass spectrometer. Anal. Chem 2006, 78, 6564–6572. [DOI] [PubMed] [Google Scholar]
- (23).Brodbelt JS; Morrison LJ; Santos I. s. Ultraviolet Photodissociation Mass Spectrometry for Analysis of Biological Molecules. Chem. Rev 2020, 120, 3328–3380. [DOI] [PMC free article] [PubMed] [Google Scholar]
- (24).Brodbelt JS Shedding light on the frontier of photodissociation. J. Am. Soc. Mass Spectrom 2011, 22, 197–206. [DOI] [PubMed] [Google Scholar]
- (25).Brodbelt JS Photodissociation mass spectrometry: new tools for characterization of biological molecules. Chem. Soc. Rev 2014, 43, 2757–2783. [DOI] [PMC free article] [PubMed] [Google Scholar]
- (26).Reilly JP Ultraviolet photofragmentation of biomolecular ions. Mass Spectrom. Rev 2009, 28, 425–447. [DOI] [PMC free article] [PubMed] [Google Scholar]
- (27).Clegg DO; Reda DJ; Harris CL; Klein MA; O’Dell JR; Hooper MM; Bradley JD; Bingham III CO; Weisman MH; Jackson CG Glucosamine, chondroitin sulfate, and the two in combination for painful knee osteoarthritis. N. Engl. J. Med 2006, 354, 795–808. [DOI] [PubMed] [Google Scholar]
- (28).Esko JD; Lindahl U Molecular diversity of heparan sulfate. J. Clin. Invest 2001, 108, 169–173. [DOI] [PMC free article] [PubMed] [Google Scholar]
- (29).Varki A; Cummings RD; Esko JD; Freeze HH; Stanley P; Bertozzi CR; Hart GW; Etzler ME Essentials of Glycobiology. NY, 2009; Vol. 2. [PubMed] [Google Scholar]
- (30).Watanabe H; Yamada Y; Kimata K Roles of aggrecan, a large chondroitin sulfate proteoglycan, in cartilage structure and function. J. Biochem 1998, 124, 687–693. [DOI] [PubMed] [Google Scholar]
- (31).Wolff JJ; Leach FE; Laremore TN; Kaplan DA; Easterling ML; Linhardt RJ; Amster IJ Negative electron transfer dissociation of glycosaminoglycans. Anal. Chem 2010, 82, 3460–3466. [DOI] [PMC free article] [PubMed] [Google Scholar]
- (32).Wei J; Tang Y; Ridgeway ME; Park MA; Costello CE; Lin C Accurate Identification of Isomeric Glycans by Trapped Ion Mobility Spectrometry-Electronic Excitation Dissociation Tandem Mass Spectrometry. Anal. Chem 2020, 92, 13211–13220. [DOI] [PMC free article] [PubMed] [Google Scholar]
- (33).Wu J; Wei J; Hogan JD; Chopra P; Joshi A; Lu W; Klein J; Boons G-J; Lin C; Zaia J Negative Electron Transfer Dissociation Sequencing of 3-O-Sulfation-Containing Heparan Sulfate Oligosaccharides. J. Am. Soc. Mass Spectrom 2018, 29, 1262–1272. [DOI] [PMC free article] [PubMed] [Google Scholar]
- (34).Leach FE; Arungundram S; Al-Mafraji K; Venot A; Boons G-J; Amster IJ Electron detachment dissociation of synthetic heparan sulfate glycosaminoglycan tetrasaccharides varying in degree of sulfation and hexuronic acid stereochemistry. Int. J. Mass Spectrom 2012, 330–332, 152–159. [DOI] [PMC free article] [PubMed] [Google Scholar]
- (35).Leach FE; Ly M; Laremore TN; Wolff JJ; Perlow J; Linhardt RJ; Amster IJ Hexuronic Acid Stereochemistry Determination in Chondroitin Sulfate Glycosaminoglycan Oligosaccharides by Electron Detachment Dissociation. J. Am. Soc. Mass Spectrom 2012, 23, 1488–1497. [DOI] [PMC free article] [PubMed] [Google Scholar]
- (36).Leach FE; Xiao Z; Laremore TN; Linhardt RJ; Amster IJ Electron detachment dissociation and infrared multiphoton dissociation of heparin tetrasaccharides. Int. J. Mass Spectrom 2011, 308, 253–259. [DOI] [PMC free article] [PubMed] [Google Scholar]
- (37).Leach FE; Riley NM; Westphall MS; Coon JJ; Amster IJ Negative Electron Transfer Dissociation Sequencing of Increasingly Sulfated Glycosaminoglycan Oligosaccharides on an Orbitrap Mass Spectrometer. J. Am. Soc. Mass Spectrom 2017, 28, 1844–1854. [DOI] [PMC free article] [PubMed] [Google Scholar]
- (38).Wolff JJ; Amster IJ; Chi L; Linhardt RJ Electron detachment dissociation of glycosaminoglycan tetrasaccharides. J. Am. Soc. Mass Spectrom 2007, 18, 234–44. [DOI] [PMC free article] [PubMed] [Google Scholar]
- (39).Agyekum I; Patel AB; Zong C; Boons G-J; Amster IJ Assignment of hexuronic acid stereochemistry in synthetic heparan sulfate tetrasaccharides with 2-O-sulfo uronic acids using electron detachment dissociation. Int. J. Mass Spectrom 2015, 390, 163–169. [DOI] [PMC free article] [PubMed] [Google Scholar]
- (40).Agyekum I; Zong C; Boons G-J; Amster IJ Single Stage Tandem Mass Spectrometry Assignment of the C-5 Uronic Acid Stereochemistry in Heparan Sulfate Tetrasaccharides using Electron Detachment Dissociation. J. Am. Soc. Mass Spectrom 2017, 28, 1741–1750. [DOI] [PMC free article] [PubMed] [Google Scholar]
- (41).Oh HB; Leach FE; Arungundram S; Al-Mafraji K; Venot A; Boons G-J; Amster IJ Multivariate Analysis of Electron Detachment Dissociation and Infrared Multiphoton Dissociation Mass Spectra of Heparan Sulfate Tetrasaccharides Differing Only in Hexuronic acid Stereochemistry. J. Am. Soc. Mass Spectrom 2011, 22, 582–590. [DOI] [PMC free article] [PubMed] [Google Scholar]
- (42).Zaia J; McClellan JE; Costello CE Tandem Mass Spectrometric Determination of the 4S/6S Sulfation Sequence in Chondroitin Sulfate Oligosaccharides. Anal. Chem 2001, 73, 6030–6039. [DOI] [PubMed] [Google Scholar]
- (43).Kailemia MJ; Patel AB; Johnson DT; Li L; Linhardt RJ; Amster IJ Differentiating chondroitin sulfate glycosaminoglycans using collision-induced dissociation; uronic acid cross-ring diagnostic fragments in a single stage of tandem mass spectrometry. Eur. J. Mass Spectrom 2015, 21, 275–85. [DOI] [PMC free article] [PubMed] [Google Scholar]
- (44).Zaia J; Li X-Q; Chan S-Y; Costello CE Tandem mass spectrometric strategies for determination of sulfation positions and uronic acid epimerization in chondroitin sulfate oligosaccharides. J. Am. Soc. Mass Spectrom 2003, 14, 1270–1281. [DOI] [PubMed] [Google Scholar]
- (45).Hawkridge AM; Hackbusch S Ultraviolet photodissociation of fondaparinux generates signature antithrombin-like 3-O-sulfated-GlcNS3S6S-monosaccharide fragment (Y-3/C-3). Anal. Bioanal. Chem 2020, 412, 7925–7935. [DOI] [PubMed] [Google Scholar]
- (46).Klein DR; Holden DD; Brodbelt JS Shotgun Analysis of Rough-Type Lipopolysaccharides Using Ultraviolet Photodissociation Mass Spectrometry. Anal. Chem 2016, 88, 1044–1051. [DOI] [PMC free article] [PubMed] [Google Scholar]
- (47).Ceroni A; Maass K; Geyer H; Geyer R; Dell A; Haslam SM GlycoWorkbench: a tool for the computer-assisted annotation of mass spectra of glycans. J. Proteome Res 2008, 7, 1650–1659. [DOI] [PubMed] [Google Scholar]
- (48).Duan J; Jonathan Amster I An Automated, High-Throughput Method for Interpreting the Tandem Mass Spectra of Glycosaminoglycans. J. Am. Soc. Mass Spectrom 2018, 29, 1802–1811. [DOI] [PMC free article] [PubMed] [Google Scholar]
- (49).Duan J; Pepi L; Amster IJ A Scoring Algorithm for the Automated Analysis of Glycosaminoglycan MS/MS Data. J. Am. Soc. Mass Spectrom 2019, 30, 2692–3703. [DOI] [PMC free article] [PubMed] [Google Scholar]
- (50).Domon B; Costello CE A systematic nomenclature for carbohydrate fragmentations in FAB-MS/MS spectra of glycoconju-gates. Glycoconjugate J. 1988, 5, 397–409. [Google Scholar]
- (51).Wolff JJ; Laremore TN; Busch AM; Linhardt RJ; Amster IJ Influence of charge state and sodium cationization on the electron detachment dissociation and infrared multiphoton dissociation of glycosaminoglycan oligosaccharides. J. Am. Soc. Mass Spectrom 2008, 19, 790–8. [DOI] [PMC free article] [PubMed] [Google Scholar]
- (52).Zaia J; Costello CE Tandem mass Spectrometry of sulfated heparin-like glycosaminoglycan oligosaccharides. Anal. Chem 2003, 75, 2445–2455. [DOI] [PubMed] [Google Scholar]
- (53).Kailemia MJ; Li L; Xu Y; Liu J; Linhardt RJ; Amster IJ Structurally Informative Tandem Mass Spectrometry of Highly Sulfated Natural and Chemoenzymatically Synthesized Heparin and Heparan Sulfate Glycosaminoglycans. Mol. Cell Proteomics 2013, 12, 979–990. [DOI] [PMC free article] [PubMed] [Google Scholar]
- (54).Wolff JJ; Laremore TN; Busch AM; Linhardt RJ; Amster IJ Electron detachment dissociation of dermatan sulfate oligosaccharides. J. Am. Soc. Mass Spectrom 2008, 19, 294–304. [DOI] [PMC free article] [PubMed] [Google Scholar]
- (55).Wolff JJ; Chi L; Linhardt RJ; Amster IJ Distinguishing glucuronic from iduronic acid in glycosaminoglycan tetrasaccharides by using electron detachment dissociation. Anal. Chem 2007, 79, 2015–2022. [DOI] [PMC free article] [PubMed] [Google Scholar]
- (56).Chi L; Wolff JJ; Laremore TN; Restaino OF; Xie J; Schiraldi C; Toida T; Amster IJ; Linhardt RJ Structural analysis of bikunin glycosaminoglycan. J. Am. Chem. Soc 2008, 130, 2617–2625. [DOI] [PMC free article] [PubMed] [Google Scholar]
- (57).Stickney M; Sanderson P; Leach FE; Zhang FM; Linhardt RJ; Amster IJ Online capillary zone electrophoresis negative electron transfer dissociation tandem mass spectrometry of glycosaminoglycan mixtures. Int. J. Mass Spectrom 2019, 445, 116209. [DOI] [PMC free article] [PubMed] [Google Scholar]
- (58).Cotham VC; Brodbelt JS Characterization of therapeutic monoclonal antibodies at the subunit-level using middle-down 193 nm ultraviolet photodissociation. Anal. Chem 2016, 88, 4004–4013. [DOI] [PubMed] [Google Scholar]
- (59).Ko BJ; Brodbelt JS 193 nm ultraviolet photodissociation of deprotonated sialylated oligosaccharides. Anal. Chem 2011, 83, 8192–8200. [DOI] [PubMed] [Google Scholar]
- (60).Robinson MR; Moore KL; Brodbelt JS Direct identification of tyrosine sulfation by using ultraviolet photodissociation mass spectrometry. J. Am. Soc. Mass Spectrom 2014, 25, 1461–1471. [DOI] [PMC free article] [PubMed] [Google Scholar]
- (61).Brodie NI; Huguet R; Zhang T; Viner R; Zabrouskov V; Pan J; Petrotchenko EV; Borchers CH Top-down hydrogen-deuterium exchange analysis of protein structures using ultraviolet photodissociation. Anal. Chem 2018, 90, 3079–3082. [DOI] [PubMed] [Google Scholar]
- (62).Fornelli L; Srzentić K; Huguet R; Mullen C; Sharma S; Zabrouskov V; Fellers RT; Durbin KR; Compton PD; Kelleher NL Accurate sequence analysis of a monoclonal antibody by top-down and middle-down orbitrap mass spectrometry applying multiple ion activation techniques. Anal. Chem 2018, 90, 8421–8429. [DOI] [PMC free article] [PubMed] [Google Scholar]
Associated Data
This section collects any data citations, data availability statements, or supplementary materials included in this article.


