Abstract
Background & Aims:
Tissue metaplasia is uncommon in adults because established cis-element programs resist rewiring. In Barrett’s esophagus, the distal esophageal mucosa acquires predominantly intestinal character, with notable gastric features, and is predisposed to develop invasive cancers. We sought to understand the chromatin underpinnings of Barrett’s metaplasia and why it commonly displays simultaneous gastric and intestinal properties.
Methods:
We profiled cis-regulatory elements with active histone modifications in primary human biopsy materials using chromatin immunoprecipitation followed by DNA sequencing (ChIP-seq). Mutations in Barrett’s esophagus were examined in relation to tissue-specific enhancer landscapes using a random-forest machine learning algorithm. We also profiled open chromatin at single-cell resolution in primary Barrett’s biopsy specimens using the assay for transposase-accessible chromatin (ATAC-seq). We used one- and two-color immunohistochemistry to examine protein expression of tissue-restricted genes.
Results:
Barrett’s esophagus bears epigenome fingerprints of human stomach and intestinal columnar, but not esophageal squamous, epithelia. Mutational patterns were best explained as arising on the epigenome background of active gastric cis-elements, supporting the view that adjoining stomach epithelium is a likely tissue source. Individual cells in Barrett’s metaplasia co-express gastric and intestinal genes, reflecting concomitant chromatin access at enhancers ordinarily restricted to one or the other epithelium. Protein expression of stomach-specific mucins, CLDN18, and a novel gastric marker, ANXA10, revealed extensive tissue and sub-clonal heterogeneity of dual stomach-intestinal cell states.
Conclusions:
These findings reveal mixed and dynamic tissue-restricted chromatin states and phenotypic heterogeneity in Barrett’s esophagus. Pervasive intra-gland variation argues against stem-cell governance of this phenotype.
Keywords: Intestinal metaplasia, epigenetics, tissue-specific epigenomes
Graphical Abstract
Short summary (Lay summary)
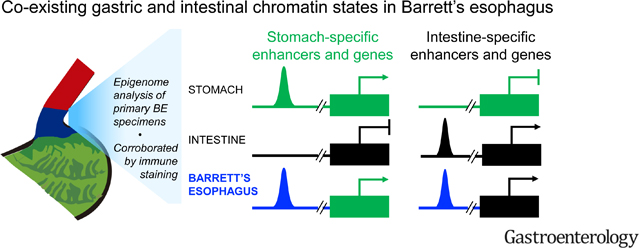
Using state-of-the-art molecular analyses, we find that the pre-cancerous condition known as Barrett’s esophagus represents a unique state in which cells concomitantly manifest features of stomach and intestinal gene activity.
INTRODUCTION
In Barrett’s esophagus (BE), columnar mucosa of an intestinal type replaces the native stratified epithelium in the human distal esophagus1. Esophageal adenocarcinoma (EAC) arises almost exclusively within dysplastic BE foci and its incidence in the West has increased nearly 8-fold in the last four decades2, 3. As symptoms usually appear after EACs are inoperable, improved outcomes hinge on prevention, detection, and monitoring of BE1, 3. Preventive strategies are, however, constrained by a limited understanding of BE origins and pathogenesis.
Historically, BE was thought to reflect transdifferentiation of squamous esophageal cells4, 5. Indeed, glands dissected from one BE specimen carried the same mutations in one nuclear (CDKN2A) and one mitochondrial (COO) gene as those found in adjoining stratified epithelium6. Recent experiments in mouse esophagus reinforce this view7, but the presence of significant gastric features in human BE specimens raises the alternative that BE reflects mucosal repair by stomach-derived columnar cells, which subsequently acquire ectopic intestinal character8–11. This idea, difficult to prove in humans, is consistent with the similar metaplastic responses to chronic stomach or esophageal injury and with the strong similarities between esophageal and gastric adenocarcinomas12. A third possibility is that BE originates in esophageal sub-mucosal glands (ESMGs)13, whose single-cell (sc) RNA profiles resemble those in BE14. No animal model mimics BE perfectly and rodents lack ESMGs; however, expansion of mouse fetal cellular rests15, of transitional squamo-columnar junction cells16, or cells from the gastric cardia17 support non-squamous sources of mouse intestinal metaplasia (IM). Tissue-specific chromatin signatures can shed light on BE origins and co-occurrence of gastric and intestinal properties.
Only a fraction of the millions of cis-regulatory elements in mammalian genomes is active in any tissue. Active sites have accessible chromatin, bind transcription factors (TFs), and bear characteristic covalent modifications such as methylated Lysine 4 (H3K4me1/2) on Histone 318, 19. Each cell type uses thousands of distinct enhancers and the specific combination constitutes a fingerprint20. ‘Stretch’ or ‘super’ enhancers carry dense active histone marks, control many lineage-restricted genes, and contribute disproportionately toward tissue signatures21, 22. Mutations that adult tissues accumulate from replication errors23 tend to concentrate in regions that lack active enhancers, thus reflecting cell-of-origin (COO) chromatin landscapes for tumors and precancerous lesions24.
Chromatin states might hence point to cellular sources of BE with more clarity than other methods possible in human tissues and, in individual cells, reveal the cis-regulatory basis for cellular diversity. We delineated the enhancer landscapes specific to human esophageal, stomach, and intestinal mucosae. BE specimens showed concomitant activation of enhancers specific to intestine and stomach, but not the esophagus, and the gastric epigenome best explained BE mutational backgrounds. In discrete BE cells resolved by single-cell (sc)ATAC-seq, stomach- and intestine-restricted enhancers are co-accessible. Immunohistochemistry verified abundant co-expression of gastric and intestinal markers in the same cells. Together, these findings in reveal a unique hybrid chromatin state as the basis for a human metaplasia with simultaneous gastric and intestinal cell identities and pervasive sub-clonal heterogeneity.
METHODS
Biopsy samples for FiT-seq and scATAC-seq.
For FiT-seq, endoscopic mucosal biopsies were fixed in formalin and embedded in paraffin. Institutional review boards (IRBs) approved research on anonymized samples from regions of healthy tissue and BE (Dana-Farber Cancer Institute IRB 05–157). Tissue sections were chosen for >90% mucosal content or dissected to achieve this proportion (Fig. S1B). For BE, we required ≥1-cm esophageal segment with intestinal metaplasia, including goblet cells25, and no dysplasia. For normal stomach, we used fundic (oxyntic) mucosa, avoiding the cardia. Ileum was used for normal small intestine. Histologically normal squamous epithelium from mid- and lower esophageal biopsies were pooled from each patient. All samples in the study are from independent subjects.
For scATAC-seq, fresh mucosal specimens were obtained from patients undergoing endoscopic surveillance (Partners Healthcare IRB 2015P002409). BE was identified by narrow band imaging26 and biopsies were obtained from the gastric corpus and duodenum of the same subjects. Samples were frozen immediately at −80°C in Bambanker freezing medium while parallel biopsies were examined by histopathology. We performed scATAC after confirming non-dysplastic BE carrying goblet cells (e.g., Fig. 4B).
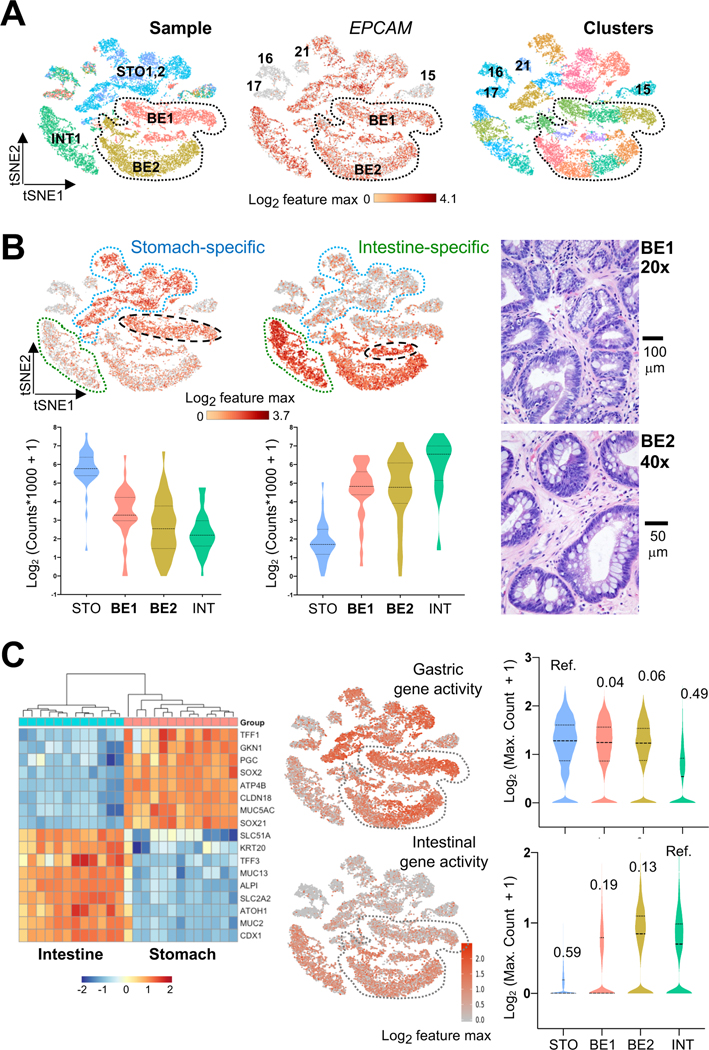
Figure 4. Single-cell resolution of hybrid gastric/intestinal chromatin states in BE.
(A) All informative cells (after filtering by CellRanger criteria) projected on a tSNE plot to reduce data dimensionality. Cells are color coded by sample (left, BE1 and BE2: Barrett’s esophagus cases 1 and 2; STO1,2: stomach cases 1 and 2; INT1: intestine) or graph-based cell clusters (right). ATAC signals at the EPCAM promoter identify epithelial cells. BE1 and BE2 cells are demarcated. Non-epithelial cells from all samples (clusters 15–17, 21) showed ATAC signals at VIM and CD45 (Fig. S3D).
(B) Distribution of single cells from BE (histology shown to the right), INT (green outline), and STO (blue outline) specimens in graph-based scATAC-seq clusters. Aggregate signals for open chromatin at stomach- (n=37) or intestine- (n=32) restricted enhancers are projected onto the tSNE plot, showing co-activity of tissue-specific regions throughout BE1 and BE2 (bottom right epithelial clusters), with the two BE1 sub-clusters (dashed black ovals) showing relative enrichment of STO or INT enhancers. Violin plots represent the average signal on each enhancer across all epithelial cells in the indicated specimens.
(C) Aggregate ATAC scores at panels of classic intestinal and gastric marker genes (left, RNA-seq data from Ref. 14; blue=low, orange=high RNA expression) projected onto the tSNE plot. Single cells in both BE samples (grey dotted space) show extensive co-activity and signals (log-transformed maximum counts per cell) are quantified on the right, with the similarities across samples estimated using D-statistics from the Kolmogorov-Smirnov test (noted above each violin plot; lower values reflect greater similarity; STO and INT samples serve as references).
CHIP-Seq.
Tissue sections processed according to a published FIT-Seq protocol27 were precipitated using 10 μl of H3K4me2 antibody (Millipore, 07–030). Libraries were prepared using ThruPLEX DNA-seq kits (Rubicon Genomics) and sequenced on a NextSeq instrument (Illumina). Computational analysis and delineation of tissue-restricted enhancers are described in Supplemental Methods.
Principal coordinate (PCoA) and cell-of-origin (COO) analysis.
To obtain regional feature densities, we first divided autosomes into 1-Mb regions, excluding centromeres, telomeres, and low-quality sequence tags. We calculated somatic mutation numbers per 1-Mb region and first used regional mutation densities as inputs for PCoA, to represent inter-sample differences in mutation frequency distribution (Fig. 3A). Samples were located in 3D space using a dissimilarity matrix, calculated from Pearson correlation coefficients. For feature selection and COO analysis, we utilized a non-parametric machine learning method (random-forest) to predict the value of a continuous response variable by employing ensemble decision trees28. Details and the approach to ascertain statistical significance are described in Supplemental Methods.
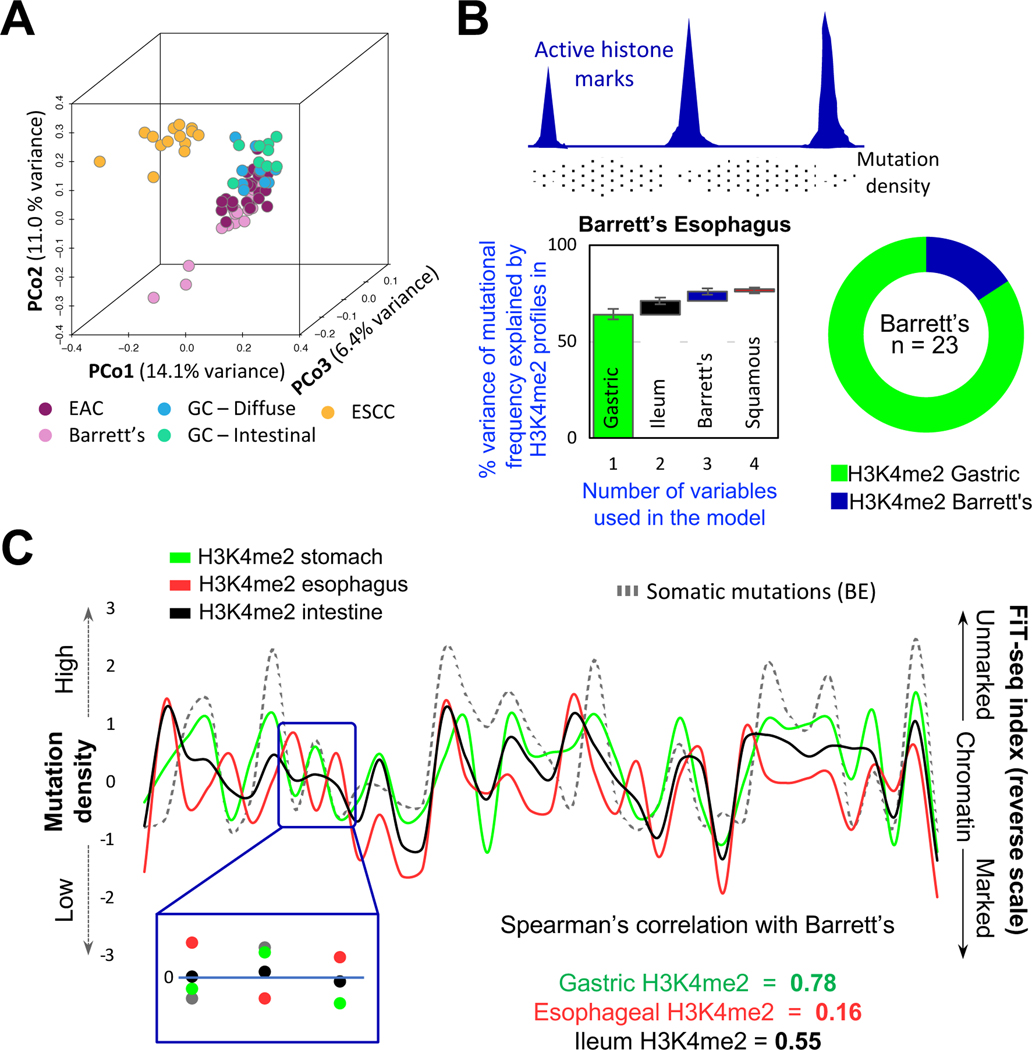
Figure 3. Mutational profiles in BE imply a gastric, not esophageal, origin.
(A) Principal coordinate (PCo) analysis of genome-wide somatic mutation data from BE, esophageal squamous cell carcinoma (ESCC), esophageal adenocarcinoma (EAC), and gastric cancers (GC) of the diffuse or intestinal types. BE mutational profiles overlap substantially with those in EAC and GC and differ from those in ESCC.
(B) Top, Illustration of the inverse relation of somatic mutation density and enhancer chromatin, likely reflecting differential access to DNA repair. Bottom, A random-forest machine-learning approach revealed that the enhancer H3K4me2 landscape of normal gastric epithelium was the best predictor of mutational variance in 23 BE samples, with small incremental contributions from other landscapes. The algorithm was run on grouped (graph – first bar depicts the largest contributor; subsequent columns represent incremental contribution of additional variables) or individual (donut) BE samples. In both analyses, the gastric signature best explained mutations found in BE.
(C) A representative 38-Mb region showing correlation between mutation frequency in BE (left y-axis) and absence of enhancer marking in normal gastric chromatin (right y-axis), whereas absence of enhancer marks in stratified esophageal and intestinal epithelium correlated poorly.
Single-cell (sc) ATAC-Seq.
Nuclei were obtained from frozen biopsy specimens by suspending the tissue in 1 mL buffer containing 10 mM Tris-HCl pH 7.4, 10 mM NaCl, 3 mM MgCl2, 0.1% NP-40, 0.1% Tween-20, and 0.01% digitonin, followed by homogenization in a douncer using 10 loose and 10 tight pestle strokes. The resulting cell suspension was passed through a 70 μm filter and debris were removed over an iodixanol gradient or by flow cytometry using positive selection with DAPI, both to equal effect. Isolated nuclei were counted manually using a hemacytometer, resuspended in diluted nuclear stock solution, and processed according to the 10x Genomics protocol (https://www.10xgenomics.com/solutions/single-cell-atac/). Computational analyses and delineation of tissue-restricted enhancers are described in Supplemental Methods.
Immunohistochemistry (IHC).
Formalin-fixed paraffin-embedded tissue sections (4 μm thick) were baked at 37°C overnight, deparaffinized, and rehydrated (100% xylene X4 for 3 min each; 100% ethanol X4 for 3 min each; running water for 5 min). Sections were treated with 1.5% hydrogen peroxide in methanol for 10 min, washed under running water for 5 min, and placed in a pressure cooker (Biocare Medical) at 120°C in Target Retrieval Solution (pH 6.1 citrate buffer, DAKO). After cooling and transfer to Tris buffered saline (TBS), slides were incubated for 40 min at room temperature with anti-CDX2 mouse monoclonal antibody (mAb, BioGenex clone CDX2–88, 1:100) or ANXA10 (Novus, NBP1–90156, 1:1,000) antiserum, followed by secondary antibody (Envision+ mouse, DAKO, or PowerVision AP rabbit, Leica Biosystems) for 30 min. Stains were developed using 3,3’-diaminobenzidine (brown product). For two-color IHC, sections were then incubated for 40 min at room temperature with mouse MUC5AC (Abcam clone 45M1, 1:10,000) or MUC2 (Vector Laboratories clone Ccp58, 1:400) mAb; rabbit TFF1 mAb (Cell Signaling Technology clone D2Y1J, 1:1000); or rabbit CLDN18 antiserum (Sigma, 1:500), followed by secondary Ab (PowerVision AP mouse or rabbit; Leica Biosystems) for 30 min. Slides were incubated in a humid chamber and rinsed in between with Tris-buffered saline. Sections were developed using Permanent Red and counterstained with Mayer’s Hematoxylin.
RESULTS
A gastric enhancer fingerprint in human BE
To discern active enhancer fingerprints in human mucosal biopsies, we applied FiT-Seq27, a method to map modified histones in formalin-fixed, paraffin-embedded tissues. Among active enhancer marks18, 29, H3K27ac resists robust immunoprecipitation in FiT-Seq, which identifies H3K4me2 reliably27. H3K4me2 and H3K27ac mark essentially the same enhancers in mouse intestines (Fig. S1A) and FiT-seq for H3K4me2 identified largely the same enhancers in human pancreatic endocrine tumors as ChIP-seq for H3K27ac did in frozen tumors30. FiT-Seq for H3K4me2 gave robust signals in mucosal biopsies from healthy esophagus (n=4), gastric corpus (n=4), and ileum (n=5) (Fig. S1B–C and Suppl. Table S1). Considering marked regions >2 kb from transcription start sites (TSSs) as putative enhancers, we used k-means clustering of the top quintile of variable regions to identify tissue-restricted enhancers (Fig. S1D). These sites were highly correlated with tissue-specific gene expression (Figs. S1E), implying that they represent active cis-elements. Below we also demonstrate high overlap between H3K4me2+ sites identified by FiT-Seq and open chromatin identified in assays for transposase-accessible chromatin (ATAC-seq, Fig. S4A).
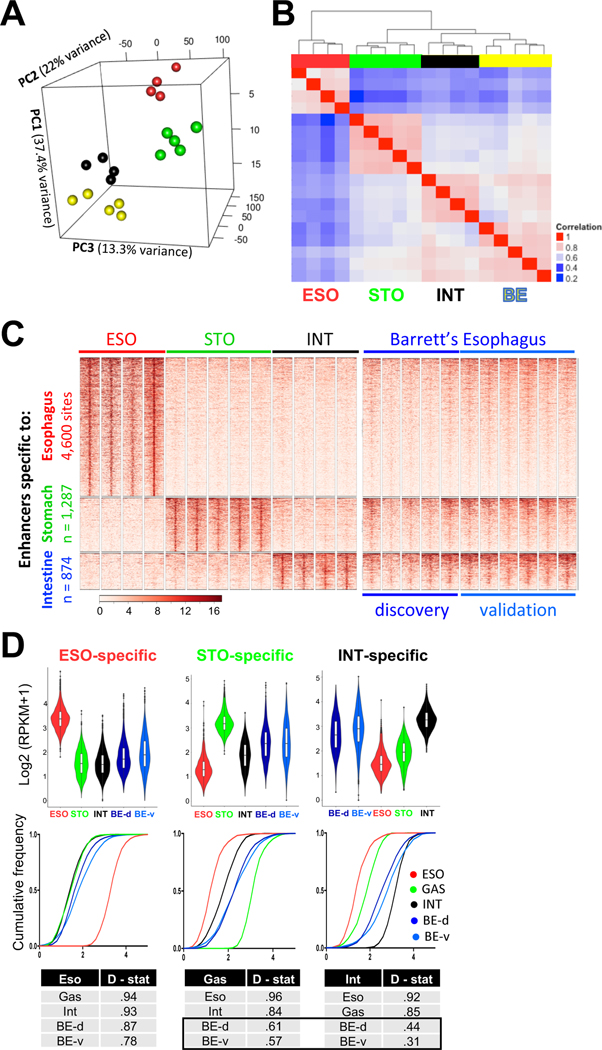
Principal Component Analysis (PCA) of the top quintile of variable enhancers (Fig. 1A) and inspection of tissue-specific loci (Fig. S1C) readily distinguished the three epithelia. By unsupervised clustering of global enhancer profiles, BE samples (n=5) most resembled intestinal epithelium (median correlation coefficient 0.73, range 0.59–0.79, Fig. 1B), least resembled stratified esophageal epithelium (median coefficient 0.50, range 0.44–0.60), and showed considerable overlap with gastric enhancers (median coefficient 0.67, range 0.58–0.73). Among enhancers specific to normal esophagus, stomach or intestine (Fig. 1C), BE specimens carried not only the expected intestinal signature, but also clear marking at stomach enhancers and barely any esophageal squamous signature (Fig. 1C–D). Trace esophageal enhancer signals, higher than the background in stomach or intestine, likely reflect our manual dissection from paraffin blocks where BE abuts squamous tissue.
Figure 1. BE specimens carry intestinal and gastric, but not esophageal, enhancers.
(A) Principal Component Analysis of the highest quintile of variable enhancers. Esophageal (red, n = 4) and gastric (blue, n = 5) epithelia form discrete clusters. Enhancers marked in BE (yellow, n = 5) are distinct from those in the native esophageal mucosa and most similar to those in the intestine (black, n = 4).
(B) Pearson correlation coefficients among active enhancers (H3K4me2 peaks >2 kb from transcription start sites, TSSs). In unsupervised hierarchical clustering, the BE enhancer profile (n=5) is most similar to intestinal (INT) mucosa (n=4) and related to stomach (STO, n= 5), but not to esophageal (ESO) squamous epithelium (n=4).
(C) H3K4me2+ enhancers marked uniquely in stratified esophageal (4,600 sites), stomach corpus (1,287 sites) or intestinal (874 sites) epithelium. Five original (discovery set) and 6 additional (validation set) BE samples show H3K4me2 at intestinal and gastric, but not at esophageal, enhancers. Heatmap scale, 0 to 16 units.
(D) Quantitation of the above H3K4me2 FiT-seq data, represented in violin plots and cumulative frequencies. Because the large volume of data ensures significant p-values for differences across all sample pairs, we applied the Kolmogorov-Smirnov test to measure similarities and differences across enhancer signatures (D-statistic, where lower values reflect greater similarity). Each quantitative measure reveals the BE enhancer signature as similar to those of stomach and intestine, but not the esophagus.
FiT-seq on 6 additional non-dysplastic BE samples reproduced these findings (Fig. 1C–D). Enhancer landscapes were similar in the discovery and validation cohorts (Fig. S1F) and sites detected in these 11 BE specimens approached saturation in a cumulative analysis (Fig. S1G). Thus, the cohort is sufficient to capture most of the active BE epigenome, revealing mixed gastric and intestinal features. Stomach enhancers active in BE were enriched for GATA- and SOX-family TF motifs, which are known to regulate stomach genes31, 32 (Fig. S1H). Because some studies suggest that H3K4me2 may reflect gene transcription33, we assessed stomach-selective marks that lie within introns (n=720) or in intergenic regions (n=344). Both groups showed comparable H3K4me2 in BE samples (Fig. S2A), indicating that the underlying signal identifies bona fide regulatory activity and not transcription per se.
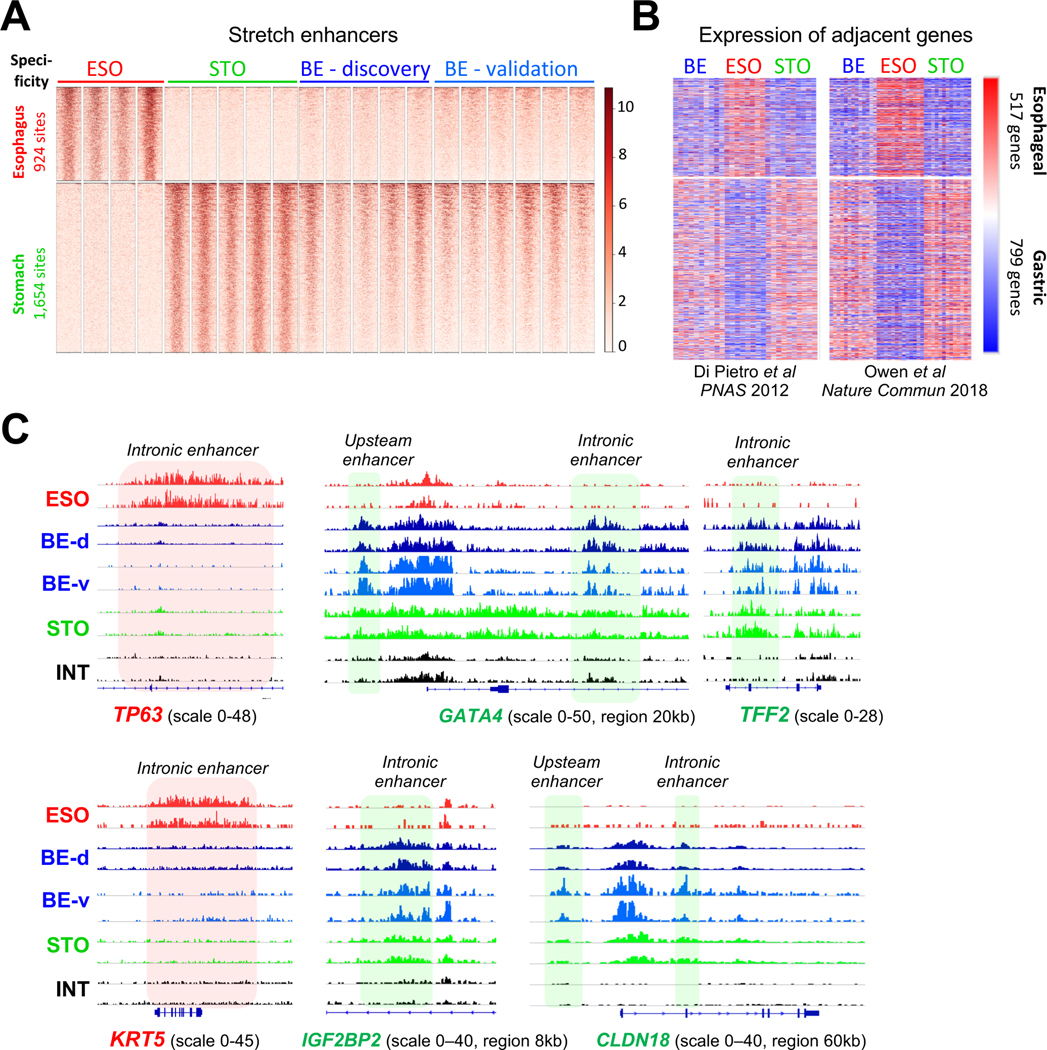
Stretch21 or super enhancers22 carry high levels of active histones and control lineage-defining genes; we identified H3K4me2+ stretch enhancers that are selective for normal gastric or esophageal mucosa and categorically absent in the other (Suppl. Table S2). All BE specimens carried H3K4me2 at stomach- but not at esophagus-restricted stretch enhancers (Fig. 2A). Importantly, BE mRNA profiles14, 34 showed transcripts located near stomach-specific sites and lacked those encoded near esophageal enhancers (Fig. 2B). BE-enriched stretch enhancers were generally marked in normal intestines (e.g., CDX1 locus – Fig. S2B), whereas classic squamous cell loci lacked H3K4me2 (e.g., KRT5 and TP63 – Fig. 2C) and the minimal signals at 924 esophageal stretch enhancers reinforce that trace H3K4me2 signals in Fig. 1C are not consequential. Stomach enhancers were not marked in the intestine (e.g., TFF2, GATA4, CLDN18, IGF2BP2 – Fig. 2C) and therefore do not represent byproducts of intestinal differentiation in BE. Rather, the data reveal both intestine and stomach enhancer fingerprints (e.g., TFF1/2/3 cluster – Fig. S2C) in BE, with corresponding gene activity.
Figure 2. Stomach stretch enhancer activity and a gastric gene signature in BE.
(A) H3K4me2 ChIP signals in BE specimens at 924 esophagus- (ESO) and 1,654 stomach-(STO) specific ‘stretch’ enhancers, showing marks at STO but not signature ESO regions. ESO, n=4; STO, n=5; BE-discovery, n=5; BE-validation, n=6.
(B) Relative mRNA levels of 517 genes encoded <100 kb from ESO-specific and 799 genes encoded <100 kb from STO-specific stretch enhancers, determined from gene expression datasets reported in Refs. 14 and 34, respectively. Blue=low, red=high mRNA expression. Enhancer marks in BE correlate with expression of nearby STO, and not ESO, genes.
(C) Data tracks from H3K4me2 FiT-seq at enhancers in ESO, STO, INT, and BE specimens. TP63 and KRT5 loci are selectively marked in ESO, as expected, but not in BE. Conversely, enhancers near GATA4, TFF2, IGF2BP2, and CLDN18 are marked in STO and BE samples, but not in ESO or INT.
Mutational profiles implicate a gastric origin for BE
Intestinalization of reparative gastric mucosa offers one explanation for this hybrid chromatin state. Alternatively, BE could originate in squamous esophageal cells that erase their identity and activate ectopic gastric and intestinal enhancers. In this light, we note that somatic (mostly non-coding) mutations likely accumulate over decades before metaplastic conversion and propagate clonally in their original patterns. Indeed, mutations in 23 BE specimens (OCCAMS study group35) were distributed most similarly to those in EAC and gastric cancer, not those in esophageal squamous cell carcinoma (ESCC, Fig. 3A). Closed, enhancer-depleted chromatin is vulnerable to mutations, possibly owing to limited access by DNA repair enzymes36, and cells of cancer origin can be imputed from the regional frequency of somatic mutations in relation to genome-wide chromatin features24 (Fig. 3B). Because mutations in BE should similarly reflect the COO, we developed a random forest machine-learning algorithm to associate BE mutation frequencies with the epigenome features specific to each digestive epithelium (Fig. 1). Using this algorithm, H3K4me2-based esophageal and gastric epigenomes best predicted the distributions of somatic mutations in ESCCs and gastric cancers, respectively37, 38 (Fig. S3A).
Applying the random forest algorithm to whole-genome DNA sequence data from BE specimens35, the gastric H3K4me2 landscape predicted the mutational patterns unequivocally in 16 and strongly in another 3 cases of BE (Fig. 3B). The mutation frequency in 4 samples was uninformatively low (<2.4 per Mb) and in no case did esophageal or intestinal enhancers predict the pattern better than gastric sites (Fig. 3B). Removal of the stomach, but not the intestinal, epigenome significantly reduced the mutational variance explained by the model (Fig. S3B), thus confirming our conclusion. A representative region (Fig. 3C) shows BE mutations concentrated in H3K4me2-depleted areas in normal gastric epithelium (correlation coefficient 0.78) and not in areas of unmarked esophageal chromatin. The consensus stomach epigenome also predicted mutation patterns in 17 of 23 EACs, with the BE epigenome predicting patterns best in the other six (Fig. S3C). BE precedes EAC1 and these findings imply that EAC mutations mainly arise over many years in the gastric mucosa, with fewer additional mutations arising during the proportionally short interval between metaplasia and cancer.
Single-cell ATAC-seq reveals heterogeneous cell and chromatin states in human BE
Gastric and intestinal enhancer co-activity in BE could reflect concurrent stomach- and intestine-dominant cell states in the tissue or a hybrid state within individual cells. To distinguish these possibilities, we used scATAC-seq to map accessible chromatin in endoscopic biopsy samples of human BE (n=2), stomach (n=2), and duodenum (n=1) from two volunteers. All samples gave adequate cell numbers and sequencing depth; data from 19,327 informative cells were first processed from individual samples and libraries were normalized for sequence depth, then merged to reduce dimensionality (Suppl. Table S3 and Fig. S3D). T-distributed stochastic neighbor embedding (tSNE)39 grouped stomach samples together, distinct from intestinal cells, while BE specimens formed unique clusters (Figs. 4A and S3D). Open promoter chromatin identified the predominant EPCAM+ epithelial cell fraction (Fig. 4A), distinct from contaminant VIM+ stromal cells or CD45+ leukocyte (clusters 15–17 and 21, Fig. S3D). HOXB genes are reported to be uniquely active in BE34 and aggregate (pseudo-bulk) analysis of scATAC-seq data showed BE-specific open chromatin at HOXB as well as HOXA genes, revealing wider HOX cluster dysregulation (Fig. S3E). Pseudo-bulk signals from epithelial cells in stomach samples coincided with tissue-specific enhancers identified by FiT-seq (e.g. Fig. S4A); thus, both FiT-seq and scATAC accurately identify cis-regulatory activity.
Because sparse scATAC-seq signals limit robust interrogation of individual enhancers, we aggregated chromatin accessibility signals at 37 stomach- and 32 intestine-restricted enhancers derived from FiT-seq (Fig. 1B) to generate reliable tissue-specific signatures (Suppl. Methods and Suppl. Table S4). These enhancer-defined tissue states accurately identified graph-based stomach and intestinal epithelial cell clusters (Fig. 4B). Open chromatin at intestinal enhancers dominated sample BE2, which nevertheless clustered separately from the intestine, likely owing to accessibility of stomach enhancers. In contrast, BE1 partitioned into a small tSNE cluster dominated by intestinal enhancers and a larger cluster with a predominant gastric signature (dashed ovals, Fig. 4B). Thus, independent BE specimens with comparable, abundant goblet cell differentiation and accessible intestinal enhancers showed concomitantly open chromatin at many gastric enhancers (Fig. 4B).
We used panels of classical gastric and intestinal transcripts (Fig. 4C) to derive a second index of tissue-specific cis-regulatory activity: chromatin access at cis-elements that overlap with the respective gene bodies. This tissue signature confirmed concomitant access at gastric and intestinal loci, with BE1 again showing greater stomach character (Fig. 4C). Despite intestinal dominance in BE2, we readily detected stomach-restricted cis-element access. Of note, although KRT5 is reported to mark cells that initiate BE16, scATAC showed closed chromatin at the KRT5 promoter, compared for example to BE specific KRT716, 40 (Fig. S4B).
Enhancer co-accessibility in individual cells
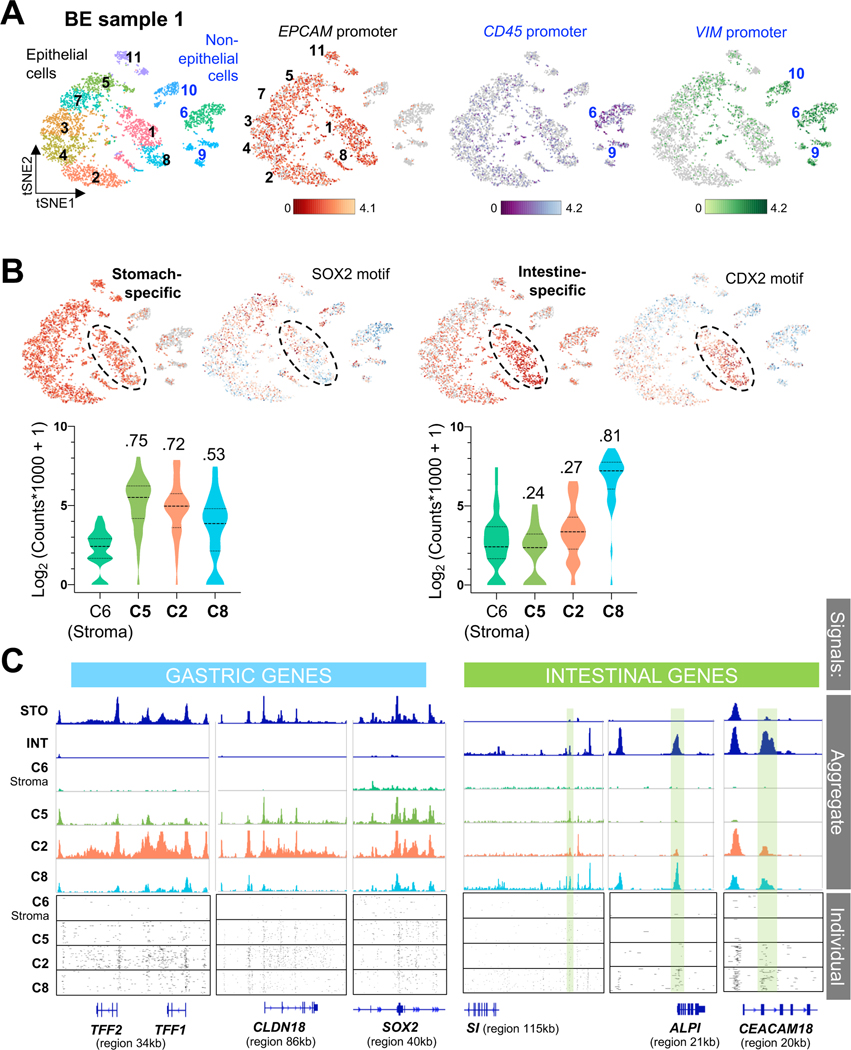
The foregoing analyses reveal simultaneously open chromatin at gastric and intestinal cis-elements at the resolution of tSNE clusters. The relative dominance of gastric or intestinal features in BE1 sub-clusters (Fig. 4B, dashed ovals) allowed us to ask whether stomach and intestinal elements are co-accessible in discrete cells. To this end, we clustered cells from BE1 separately and used EPCAM promoter signals to distinguish the majority epithelial fraction from non-epithelial CD45+ or VIM+ cells (Fig. 5A). Open chromatin at intestinal enhancers dominated in clusters 1 and 8, where accessible sites were globally enriched for the CDX2 consensus motif, whereas stomach enhancers enriched for the SOX2 motif were distributed widely (Fig. 5B). Cells in cluster 2 showed concomitant intestinal and gastric cis-element accessibility and gastric features were evident even in the most intestinalized group, cluster 8. For quantitative comparison and in the following examples, stromal cell cluster 6 provides an internal specificity control. At canonical tissue-restricted loci, ATAC-seq plots in Fig. 5C show aggregate signals in selected cell clusters and the boxes below display signals from 100 discrete cells. Clusters with low (#5), intermediate (#2), or high (#8) intestinal character show unambiguous co-accessibility of gastric sites. Thus, BE harbors a hybrid stomach-intestinal chromatin state, with variable dominance of one state over the other among cells from the same biopsies.
Figure 5. Heterogenous gastric and intestinal cis-element repertoires in BE.
(A) Independent clustering and tSNE projection of cells from BE case 1, with ATAC signals at the EPCAM promoter distinguishing epithelial (black numbers) from non-epithelial (blue numbers, open chromatin at the VIM promoter) populations. Clusters 6 and 9 likely represent blood-derived cells (open CD45 promoter chromatin); CD45-negative cluster 10 likely represents mesenchymal cells.
(B) Graph-based (tSNE) clustering of single BE1 cells, showing focal increase of intestinal cis-element signal (n=37) in specific clusters, with abundant stomach-specific enhancer signals (n=36) throughout the epithelial component. Clusters enriched for intestinal cis-elements were also enriched for intestinal (CDX2) and depleted of stomach (SOX2) TF sequence motifs. Cells within clusters 5, 2 and 8, for example, show different degrees of stomach- and intestine-restricted enhancer co-accessibility. Average signals on each enhancer are plotted for all cells in the indicated clusters and quantified in violin plots. Cluster 2 shows a stomach-dominant pattern, whereas cluster 8 shows substantial intestinal enhancer activity alongside stomach enhancers. D-statistics (Kolmogorov-Smirnov test) noted above each violin estimate similarity between cell populations, using stromal cell cluster 6 as the reference.
(C) Chromatin accessibility at classic gastric and intestinal gene loci in cells from BE1 epithelial clusters 5, 2 and 8, showing different degrees of stomach and intestinal differentiation; cluster 6 (non-epithelial stromal cells) serves as a control. Aggregate (pseudo-bulk) signals from STO and INT samples and BE1 cell clusters are displayed at the top. Cluster 8 shows notable cis-element co-accessibility near intestinal and gastric genes, while cluster 2 has few open intestinal sites (green shaded boxes) and prominent signals at gastric loci. Below, chromatin accessibility at these loci is displayed for 100 random single cells from each cluster.
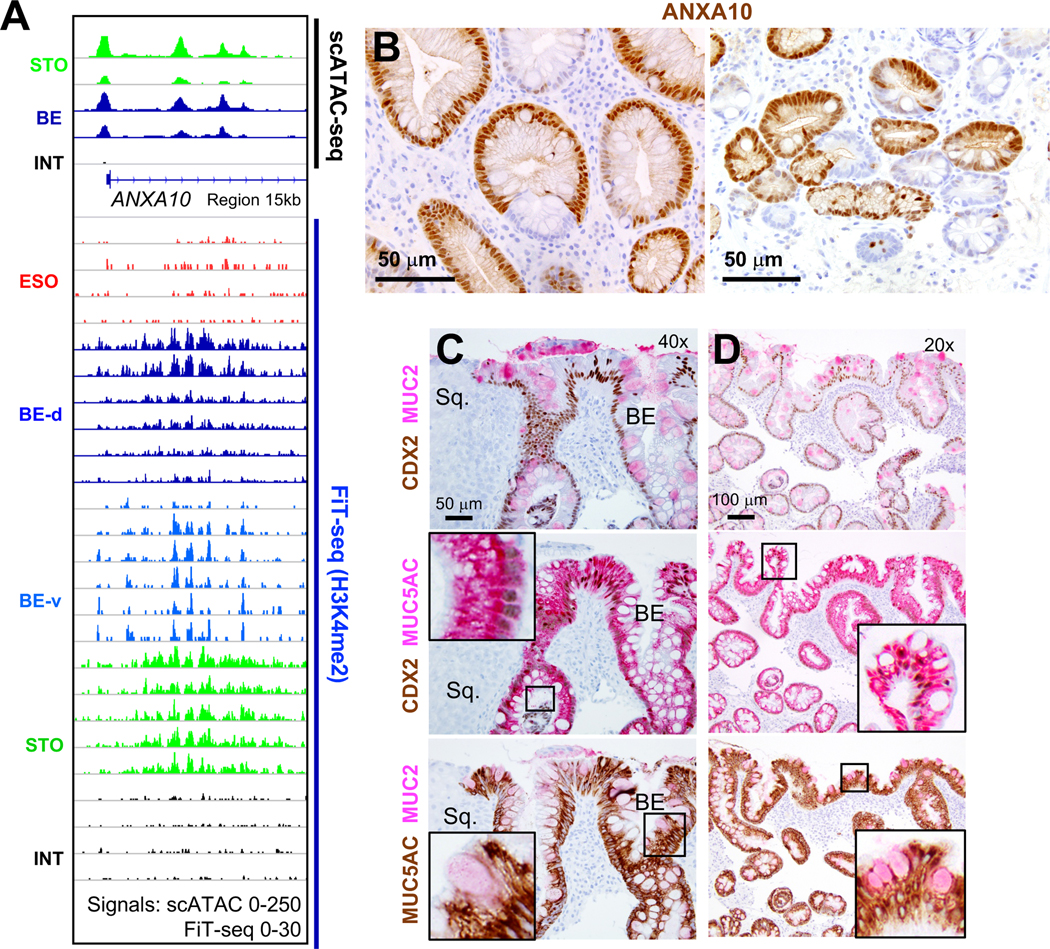
Pair-wise comparisons identified 294 genes near chromatin that is accessible in BE and stomach, but not intestinal, specimens (Suppl. Table S5). These genes are largely expressed in stomach and BE, but not in intestines (Fig. S4C – public mRNA data14, 41, 42), and include classical gastric loci at which FiT-seq showed H3K4me2 marking in BE: CLDN18 (Figs. 2C and S4D), TFF1 (Fig. S2C), MUC5AC, and MUC6 (Fig. S4E). Additional genes such as ANXA10 (Fig. 6A), SLC45A3, and others (Fig. S5A) gave strong scATAC signals in stomach and BE, but weak to no signals in intestinal cells, and FiT-seq showed corresponding H3K4me2 marks. ANXA10 transcripts are exquisitely stomach-restricted (Fig. S5B). Immunostaining confirmed ANXA10 expression in stomach, but not colonic, epithelium (Fig. S5C) and revealed abundant expression in 5 of 5 BE specimens, with striking inter- and intra-gland heterogeneity (Fig. 6B). Thus, scATAC accurately captured active cis-elements, revealed extensive stomach-specific gene activity in BE, and identified ANXA10 as a novel marker of mosaic gastric identity.
Figure 6. Novel BE marker ANXA10 and co-expression of gastric and intestinal features.
(A) scATAC-seq identified open chromatin at ANXA10, a stomach-restricted locus, in BE. Cis-element activity is confirmed by H3K4me2 FIT-seq on 11 independent BE samples.
(B) Representative ANXA10 immunostaining of 5 independent BE samples shows regions of prominent expression varying within and between metaplastic glands.
(C-D) Two-color immunohistochemistry for CDX2 and stomach- (MUC5AC) or intestine- (MUC2) specific genes in sequential tissue sections from 5 different representative BE samples (panels C and D represent specimens from different patients). MUC5AC is co-expressed with MUC2 and CDX2 in hundreds, but not all, single cells. Adjoining squamous (Sq.) mucosa lacks all 3 markers. Insets show enlarged views of the boxed regions, highlighting marker co-expression.
Elaboration of dual stomach-intestinal identity in discrete BE cells
To ask whether concurrent chromatin states yield truly hybrid cells, we immunostained stomach- (MUC5AC) and intestine- (MUC2 and CDX2) restricted proteins in five BE biopsies other than those used for FiT-seq, scATAC, or ANXA10 immunostaining. As expected, CDX2 was widespread and co-expressed with MUC2 in goblet-like cells; MUC2 was expressed only in CDX2+, but CDX2 was present in many MUC2-, cells. All BE samples carried large numbers of cells that co-expressed MUC5AC and intestine-specific markers (3 samples shown in Figs. 6C–D, 7A and another in Fig. S6A). Regions within every sample showed abundant MUC5AC+ foveolar cells, affirming their gastric character, while innumerable goblet-like cells co-expressed MUC2 and CDX2 along with MUC5AC (Figs. 6C–D and S6A). Mixed glands were sometimes abundant and sometimes scattered, with field-to-field variation. Fig. 6 shows representative co-expression and because other areas showed less or greater overlap, focal quantitation would be misleading.
Fig. 7. Heterogeneous cell identities in BE and gastric intestinal metaplasia.
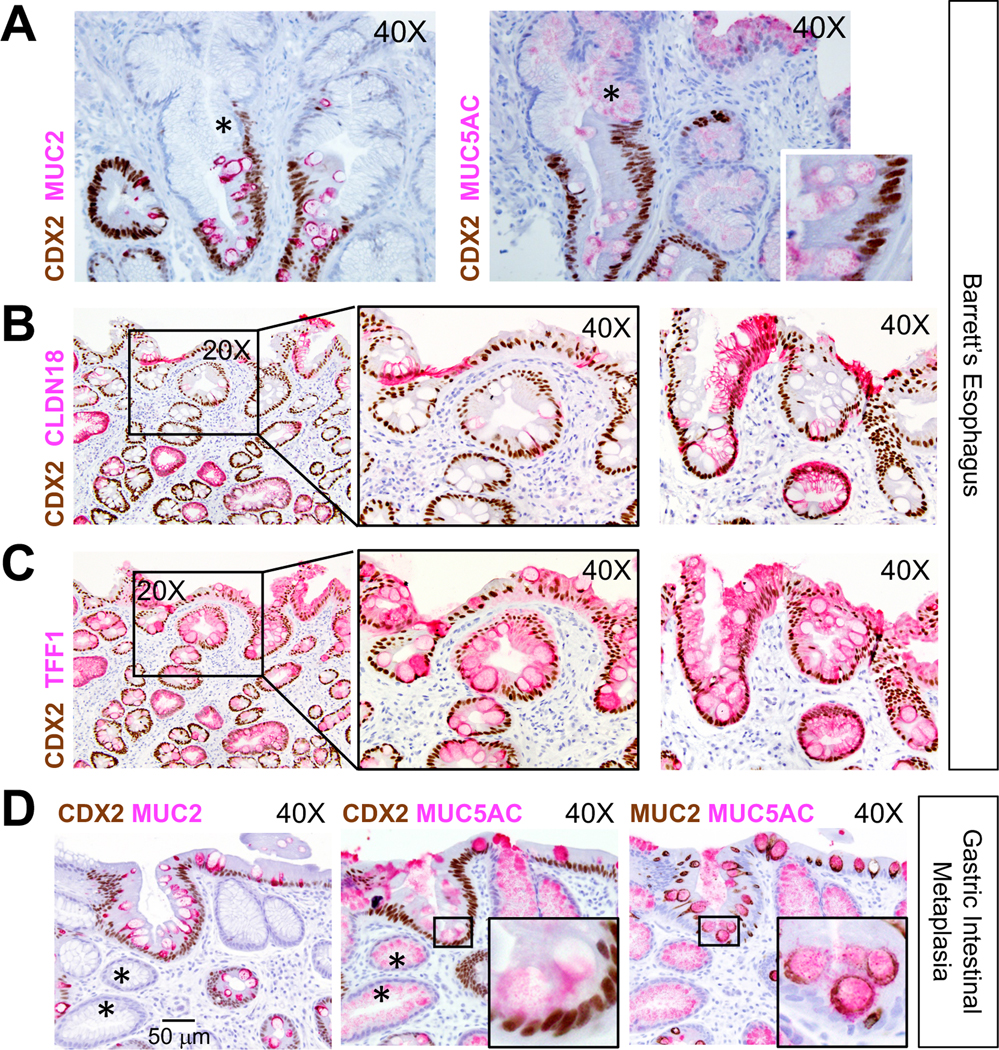
(A-C) Intra-sample heterogeneity of co-existing stomach and intestinal states in BE. Panel A shows representative areas of CDX2- (asterisks) and CDX2+ areas within presumptive clonal BE glands. CDX2 co-expression with additional stomach markers, CLDN18 (B) and TFF1 (C), is evident in specimens (n=5) also used for ANXA10 immunostaining (Fig. 6B). Two representative specimens are shown; middle panels in B and C show boxed areas in the left panels at higher magnification. Both markers reveal extensive intra- and inter-gland heterogeneity. Images were captured through 20X or 40X objectives. Scale bar is shown in D, left panel.
(D) Gastric intestinal metaplasia also harbors dual and heterogeneous gastric and intestinal cell states. In these representative images (n=7, additional examples in Fig. S6C–D), the superficial epithelium expresses CDX2 but many deep glands do not (asterisks). MUC5AC is present broadly, but only CDX2+ cells express MUC2. Insets show boxed areas at higher magnification.
Intra-gland heterogeneity was extensive: cells in some areas expressed all 3 markers, while others in the same glands lacked CDX2 and expressed only MUC5AC in cells with foveolar morphology (example in Fig. 7A). This diversity, also seen with ANXA10 (Fig. 6B), was striking and surprising because each BE gland6, 43, as in normal stomach44, 45, derives clonally from resident stem cells46, 47. Moreover, although MUC2+ goblet cells were present in all specimens, MUC5AC co-expression varied between glands and cases, with some areas showing both markers in every cell (Fig. S6A) or only in a minority. This heterogeneity matches our scATAC-seq findings, where cell subpopulations from the same BE biopsy showed limited, moderate, or extensive gastric character on an intestinal background.
Breadth of dual stomach-intestinal identity in human BE and GIM
To assess the breadth of gastric properties, we examined additional stomach-specific genes identified by scATAC. In all five BE specimens that we first used for ANXA10 immunostaining, sizable patches of CDX2+ cells co-expressed CLDN18 and goblet-like cells co-expressed TFF1 (Fig. 7B–C), hence verifying hybrid cell states. We again observed heterogeneous expression of stomach markers within and across glands; moreover, sequential sections from the same specimen showed incomplete concordance among different gastric markers (Fig. 7B–C, left panels), even in BE cells with gastric morphology. These findings reflect the substantial heterogeneity in mixed chromatin states evident in scATAC analysis (Fig. 5).
The overt resemblance between gastric intestinal metaplasia (GIM) and BE48 prompted us to examine cellular and intra-gland features in GIM. All specimens (n=7) showed co-expression of stomach- and intestine-specific products (Figs. 7D and S6B–D), with substantial intra-gland and inter-sample variability and close proximity of extensively intestinalized glands with others that appeared wholly gastric. Regional CDX2 expression was associated in some areas with high MUC2 and exclusion of MUC5AC, and in adjoining areas with high MUC5AC and absence of MUC2 (Fig. S6C–D, arrows). Again, MUC2 appeared only in CDX2+ cells, but the converse was not always true; for example, Fig. S6C shows superficial foveolar epithelium with low CDX2 and no MUC2 (magnified in the inset). Deeper glands in the same sample showed higher CDX2 levels and concomitant MUC2. Thus, both BE and GIM harbor a spectrum of discrete cell states, ranging from predominantly gastric to largely intestinal.
Discussion
EAC incidence is rising faster in the West than other cancers2. BE, which develops in response to esophageal injury from chronic gastric and biliary reflux, is the principal risk factor1, 3. A traditional view is that BE represents conversion of squamous to intestinal epithelium5–7, 49, but recent opinion has shifted to suggest that embryonic remnants15 or specialized transitional cells16 from the gastro-esophageal junction, Lgr5+ stem cells from the proximal stomach17, or ESMG cells are the source14, 50. These candidate sources can account for columnar BE histomorphology with gastric features and were nominated largely on the basis of animal experiments, in some cases with strong human correlates. Our examination of histone marks and open chromatin in primary human BE specimens reveals at both population and single-cell scales a hybrid stomach-intestinal chromatin state associated with extensive co-expression of gastric and intestinal marker genes.
Somatic mutations likely acquired and clonally propagated before IM also correlated better with the epigenome signature of gastric columnar than of esophageal squamous mucosa. The phenotype and long-term stability of BE implicates an IM source with stem-cell activity8–10. Our work does not implicate a specific COO, nor is it currently possible to isolate for epigenome analysis any of the rare candidate sources, such as embryonic rest15, transitional junction16, or ESMG13, 14 cells. It is unknown if the gastric epithelial epigenome sufficiently resembles these rare cell to explain the correlation of BE mutational signature with the stomach epigenome. Our findings do, however, argue against stratified esophageal mucosa as a BE source.
We suggest that esophageal surface injury from gastric reflux is usually repaired by the native stratified epithelium, but that extensive or certain forms of injury elicits repair from a nearby columnar source. Stem cells in the ectopic reparative epithelium preserve substantial elements of their original identity –expressing abundant MUC5AC, TFF1, CLDN18, ANXA10, and other stomach-specific genes– and in addition manifest intestinal features; to our knowledge, ANXA10 is a novel marker of the gastric phenotype. This model agrees with all known features of BE and future preventive strategies might aspire to promote esophageal repair by native squamous cells at the expense of ‘salvage’ by heterologous cells.
Active histone mark detected at stomach enhancers in our bulk FiT-seq data represent the cellular average. One striking observation from scATAC-seq, corroborated by immunostaining of multiple independent cases, is that the degree of stomach identity varies widely: some cells appear largely intestinal with modest gastric signals, while others carry a predominant gastric cis-regulatory signature. Notably, gastric marker expression is heterogeneous even in BE cells with clear dual identity. This heterogeneity appears not to be clonally determined because areas within the same gland show extremes of gastric or intestinal character. One untested possibility is that local factors such as pH, inflammation or stromal signals determine cellular identities on the background of a plastic –and likely dynamic– chromatin state. Further epigenome characterization at sc resolution might clarify the degree of underlying chromatin plasticity.
Gastric cancers of the intestinal type and EAC share genomic and biological properties12. It is therefore worth considering the morphologic and molecular features common to their respective precursor lesions, GIM and BE48, which may reflect similarly partial intestinalization. We report that GIM also harbors gland heterogeneity –ranging from largely foveolar to mostly goblet-like cells– with innumerable cells co-expressing stomach and intestinal markers. Our study was limited to non-dysplastic BE and GIM; it will be interesting in the future to determine whether the fractional representation of gastric and intestinal fates is a driver or biomarker for progression to dysplasia and invasive cancer. In light of the substantial clonal and sub-clonal heterogeneity, studies that address this question will need large cohorts, sc resolution, and cautious interpretation of data.
Hybrid and heterogeneous chromatin states provide a compelling explanation for dual, non-uniform, and variable presence of gastric and intestinal features. Many metaplastic glands lacked uniform CDX2 expression and its presence in BE or GIM was not always associated with other intestinal products in the same cell. These findings imply that even intestinal TF expression is not hard-wired in clonal metaplastic cells or guaranteed to activate intestinal genes. Rather, they suggest significant cell plasticity and localized stromal or inflammatory influence over TF expression and activities.
Supplementary Material
What you need to know.
Background and context:
Barrett’s esophagus, the major risk factor for esophageal adenocarcinoma, has unclear chromatin underpinnings. We investigated the condition using epigenome analyses that reveal chromatin states and reflect tissue identity.
New findings:
Barrett’s esophagus is a unique tissue type in which individual cells manifest varying degrees of dual stomach and intestinal identity, both in chromatin states and marker gene expression.
Limitations:
Human biopsy materials capture a limited window of time and reveal only partially the simultaneous and dynamic gastric-intestinal identity we identify in Barrett’s esophagus.
Impact:
Definition of novel mixed chromatin states and cell identities in Barrett’s esophagus likely reflects underlying plasticity of the Barrett’s stem cell and provides new insights into adult stem cell biology, chromatin plasticity, and human metaplasias.
ACKNOWLEDGMENTS
We thank M.R. Corces for helpful discussions.
Grant support:
Supported by NIH grants R01DK082889 (R.A.S.) and P50CA127003; the Dana-Farber/Novartis Drug Discovery Program (DDP17026); a generous gift from the Sarah Rhodes Fund for Cancer Research (R.A.S.); an endowment from the William Randolph Hearst Foundation (R.A.S.); and grants to H.L. from the Korean National Research Foundation (NRF-2018M3A9H) and the Korean Institute for Information & Communications Technology (2017-0-00398). H.S. is a William Raveis Charitable Fund Physician-Scientist of the Damon Runyon Cancer Research Foundation (PST-15-18).
Abbreviations:
- BE
Barrett’s esophagus
- GIM
Gastric intestinal metaplasia
Footnotes
Disclosures:
H. S., S.M., P.C., K.J., P.S., and P.P. report no conflicts of interest.
K.H. is currently employed by Alopax-Algo Co., Ltd.
J.L.H. is a consultant to Epizyme, Aadi Biosciences, and TRACON Pharmaceuticals.
H.L. is currently employed by UPPThera, Inc.
R.A.S. receives grant support from Novartis Oncology unrelated to this work.
Transcript and genome profiling:
All ChIP, ATAC, scATAC data are deposited in the Gene Expression Omnibus (GEO), under accession number GSE97178. The token to access these data is sdazgygalnsnrcx.
Writing assistance: None
Publisher's Disclaimer: This is a PDF file of an unedited manuscript that has been accepted for publication. As a service to our customers we are providing this early version of the manuscript. The manuscript will undergo copyediting, typesetting, and review of the resulting proof before it is published in its final form. Please note that during the production process errors may be discovered which could affect the content, and all legal disclaimers that apply to the journal pertain.
REFERENCES
- 1.Spechler SJ, Souza RF. Barrett’s esophagus. N Engl J Med 2014;371:836–845. [DOI] [PubMed] [Google Scholar]
- 2.Pohl H, Welch HG. The role of overdiagnosis and reclassification in the marked increase of esophageal adenocarcinoma incidence. J Natl Cancer Inst 2005;97:142–146. [DOI] [PubMed] [Google Scholar]
- 3.Rustgi AK, El-Serag HB. Esophageal carcinoma. N Engl J Med 2014;371:2499–2509. [DOI] [PubMed] [Google Scholar]
- 4.Giroux V, Rustgi AK. Metaplasia: tissue injury adaptation and a precursor to the dysplasia-cancer sequence. Nat Rev Cancer 2017;17:594–604. [DOI] [PMC free article] [PubMed] [Google Scholar]
- 5.Stairs DB, Nakagawa H, Klein-Szanto A, et al. Cdx1 and c-Myc foster the initiation of transdifferentiation of the normal esophageal squamous epithelium toward Barrett’s esophagus. PLoS One 2008;3:e3534. [DOI] [PMC free article] [PubMed] [Google Scholar]
- 6.Nicholson AM, Graham TA, Simpson A, et al. Barrett’s metaplasia glands are clonal, contain multiple stem cells and share a common squamous progenitor. Gut 2012;61:1380–1389. [DOI] [PubMed] [Google Scholar]
- 7.Vercauteren Drubbel A, Pirard S, Kin S, et al. Reactivation of the Hedgehog pathway in esophageal progenitors turns on an embryonic-like program to initiate columnar metaplasia. Cell Stem Cell 2021;doi: 10.1016/j.stem.2021.03.019. [DOI] [PubMed] [Google Scholar]
- 8.Arul GS, Moorghen M, Myerscough N, et al. Mucin gene expression in Barrett’s oesophagus: an in situ hybridisation and immunohistochemical study. Gut 2000;47:753–761. [DOI] [PMC free article] [PubMed] [Google Scholar]
- 9.Lavery DL, Nicholson AM, Poulsom R, et al. The stem cell organisation, and the proliferative and gene expression profile of Barrett’s epithelium, replicates pyloric-type gastric glands. Gut 2014;63:1854–1863. [DOI] [PMC free article] [PubMed] [Google Scholar]
- 10.McDonald SA, Graham TA, Lavery DL, et al. The Barrett’s gland in phenotype space. Cell Mol Gastroenterol Hepatol 2015;1:41–54. [DOI] [PMC free article] [PubMed] [Google Scholar]
- 11.Van De Bovenkamp JH, Korteland-Van Male AM, Warson C, et al. Gastric-type mucin and TFF-peptide expression in Barrett’s oesophagus is disturbed during increased expression of MUC2. Histopathology 2003;42:555–565. [DOI] [PubMed] [Google Scholar]
- 12.Cancer Genome Atlas Research N, Analysis Working Group: Asan U, Agency BCC, et al. Integrated genomic characterization of oesophageal carcinoma. Nature 2017;541:169–175. [DOI] [PMC free article] [PubMed] [Google Scholar]
- 13.Kruger L, Gonzalez LM, Pridgen TA, et al. Ductular and proliferative response of esophageal submucosal glands in a porcine model of esophageal injury and repair. Am J Physiol Gastrointest Liver Physiol 2017;313:G180–G191. [DOI] [PMC free article] [PubMed] [Google Scholar]
- 14.Owen RP, White MJ, Severson DT, et al. Single cell RNA-seq reveals profound transcriptional similarity between Barrett’s oesophagus and oesophageal submucosal glands. Nat Commun 2018;9:4261. [DOI] [PMC free article] [PubMed] [Google Scholar]
- 15.Wang X, Ouyang H, Yamamoto Y, et al. Residual embryonic cells as precursors of a Barrett’s-like metaplasia. Cell 2011;145:1023–1035. [DOI] [PMC free article] [PubMed] [Google Scholar]
- 16.Jiang M, Li H, Zhang Y, et al. Transitional basal cells at the squamous-columnar junction generate Barrett’s oesophagus. Nature 2017;550:529–533. [DOI] [PMC free article] [PubMed] [Google Scholar]
- 17.Quante M, Bhagat G, Abrams JA, et al. Bile acid and inflammation activate gastric cardia stem cells in a mouse model of Barrett-like metaplasia. Cancer Cell 2012;21:36–51. [DOI] [PMC free article] [PubMed] [Google Scholar]
- 18.Barski A, Cuddapah S, Cui K, Roh TY, Schones DE, Wang Z, Wei G, et al. High-resolution profiling of histone methylations in the human genome. Cell 2007;129:823–837. [DOI] [PubMed] [Google Scholar]
- 19.Heintzman ND, Hon GC, Hawkins RD, et al. Histone modifications at human enhancers reflect global cell-type-specific gene expression. Nature 2009;459:108–112. [DOI] [PMC free article] [PubMed] [Google Scholar]
- 20.Roadmap Epigenomics C, Kundaje A, Meuleman W, Ernst J, Bilenky M, et al. Integrative analysis of 111 reference human epigenomes. Nature 2015;518:317–330. [DOI] [PMC free article] [PubMed] [Google Scholar]
- 21.Parker SC, Stitzel ML, Taylor DL, et al. Chromatin stretch enhancer states drive cell-specific gene regulation and harbor human disease risk variants. Proc Natl Acad Sci USA 2013;110:17921–17926. [DOI] [PMC free article] [PubMed] [Google Scholar]
- 22.Whyte WA, Orlando DA, Hnisz D, et al. Master transcription factors and mediator establish super-enhancers at key cell identity genes. Cell 2013;153:307–319. [DOI] [PMC free article] [PubMed] [Google Scholar]
- 23.Blokzijl F, de Ligt J, Jager M, et al. Tissue-specific mutation accumulation in human adult stem cells during life. Nature 2016;538:260–264. [DOI] [PMC free article] [PubMed] [Google Scholar]
- 24.Polak P, Karlic R, Koren A, et al. Cell-of-origin chromatin organization shapes the mutational landscape of cancer. Nature 2015;518:360–364. [DOI] [PMC free article] [PubMed] [Google Scholar]
- 25.Shaheen NJ, Falk GW, Iyer PG, et al. ACG clinical guideline: Diagnosis and management of Barrett’s esophagus. Am J Gastroenterol 2016;111:30–50; quiz 51. [DOI] [PMC free article] [PubMed] [Google Scholar]
- 26.Sharma P, Bansal A, Mathur S, et al. The utility of a novel narrow band imaging endoscopy system in patients with Barrett’s esophagus. Gastrointest Endosc 2006;64:167–175. [DOI] [PubMed] [Google Scholar]
- 27.Cejas P, Li L, O’Neill NK, et al. Chromatin immunoprecipitation from fixed clinical tissues reveals tumor-specific enhancer profiles. Nat Med 2016;22:685–691. [DOI] [PubMed] [Google Scholar]
- 28.Breiman L. Machine Learning. 452001;5. [Google Scholar]
- 29.Ernst J, Kellis M. ChromHMM: automating chromatin-state discovery and characterization. Nat Methods 2012;9:215–216. [DOI] [PMC free article] [PubMed] [Google Scholar]
- 30.Cejas P, Drier Y, Dreijerink KMA, et al. Enhancer signatures stratify and predict outcomes of non-functional pancreatic neuroendocrine tumors. Nat Med 2019;25:1260–1265. [DOI] [PMC free article] [PubMed] [Google Scholar]
- 31.Arnold K, Sarkar A, Yram MA, et al. Sox2(+) adult stem and progenitor cells are important for tissue regeneration and survival of mice. Cell Stem Cell 2011;9:317–329. [DOI] [PMC free article] [PubMed] [Google Scholar]
- 32.Jacobsen CM, Narita N, Bielinska M, et al. Genetic mosaic analysis reveals that GATA-4 is required for proper differentiation of mouse gastric epithelium. Dev Biol 2002;241:34–46. [DOI] [PubMed] [Google Scholar]
- 33.Hyun K, Jeon J, Park K, et al. Writing, erasing and reading histone lysine methylations. Exp Mol Med 2017;49:e324. [DOI] [PMC free article] [PubMed] [Google Scholar]
- 34.di Pietro M, Lao-Sirieix P, Boyle S, et al. Evidence for a functional role of epigenetically regulated midcluster HOXB genes in the development of Barrett esophagus. Proc Natl Acad Sci USA 2012;109:9077–9082. [DOI] [PMC free article] [PubMed] [Google Scholar]
- 35.Ross-Innes CS, Becq J, Warren A, et al. Whole-genome sequencing provides new insights into the clonal architecture of Barrett’s esophagus and esophageal adenocarcinoma. Nat Genet 2015;47:1038–1046. [DOI] [PMC free article] [PubMed] [Google Scholar]
- 36.Polak P, Lawrence MS, Haugen E, et al. Reduced local mutation density in regulatory DNA of cancer genomes is linked to DNA repair. Nat Biotechnol 2014;32:71–75. [DOI] [PMC free article] [PubMed] [Google Scholar]
- 37.Cancer Genome Atlas Research N. Comprehensive molecular characterization of gastric adenocarcinoma. Nature 2014;513:202–209. [DOI] [PMC free article] [PubMed] [Google Scholar]
- 38.Zhang L, Zhou Y, Cheng C, et al. Genomic analyses reveal mutational signatures and frequently altered genes in esophageal squamous cell carcinoma. Am J Hum Genet 2015;96:597–611. [DOI] [PMC free article] [PubMed] [Google Scholar]
- 39.Satpathy AT, Granja JM, Yost KE, et al. Massively parallel single-cell chromatin landscapes of human immune cell development and intratumoral T cell exhaustion. Nat Biotechnol 2019;37:925–936. [DOI] [PMC free article] [PubMed] [Google Scholar]
- 40.Cabibi D, Fiorentino E, Pantuso G, et al. Keratin 7 expression as an early marker of reflux-related columnar mucosa without intestinal metaplasia in the esophagus. Med Sci Monit 2009;15:CR203–210. [PubMed] [Google Scholar]
- 41.Maag JLV, Fisher OM, Levert-Mignon A, et al. Novel aberrations uncovered in Barrett’s esophagus and esophageal adenocarcinoma using whole transcriptome sequencing. Mol Cancer Res 2017;15:1558–1569. [DOI] [PubMed] [Google Scholar]
- 42.Consortium GT. The genotype-tissue expression (GTEx) project. Nat Genet 2013;45:580–585. [DOI] [PMC free article] [PubMed] [Google Scholar]
- 43.Raskind WH, Norwood T, Levine DS, et al. Persistent clonal areas and clonal expansion in Barrett’s esophagus. Cancer Res 1992;52:2946–2950. [PubMed] [Google Scholar]
- 44.Bjerknes M, Cheng H. Multipotential stem cells in adult mouse gastric epithelium. Am J Physiol Gastrointest Liver Physiol 2002;283:G767–77. [DOI] [PubMed] [Google Scholar]
- 45.Nomura S, Esumi H, Job C, et al. Lineage and clonal development of gastric glands. Dev Biol 1998;204:124–135. [DOI] [PubMed] [Google Scholar]
- 46.Barker N, Huch M, Kujala P, et al. Lgr5(+ve) stem cells drive self-renewal in the stomach and build long-lived gastric units in vitro. Cell Stem Cell 2010;6:25–36. [DOI] [PubMed] [Google Scholar]
- 47.Leushacke M, Tan SH, Wong A, et al. Lgr5-expressing chief cells drive epithelial regeneration and cancer in the oxyntic stomach. Nat Cell Biol 2017;19:774–786. [DOI] [PubMed] [Google Scholar]
- 48.Piazuelo MB, Haque S, Delgado A, et al. Phenotypic differences between esophageal and gastric intestinal metaplasia. Mod Pathol 2004;17:62–74. [DOI] [PubMed] [Google Scholar]
- 49.Que J, Garman KS, Souza RF, Spechler SJ. Pathogenesis and cells of origin of Barrett’s esophagus. Gastroenterology 2019;157:349–364 e1. [DOI] [PMC free article] [PubMed] [Google Scholar]
- 50.Leedham SJ, Preston SL, McDonald SA, et al. Individual crypt genetic heterogeneity and the origin of metaplastic glandular epithelium in human Barrett’s oesophagus. Gut 2008;57:1041–1048. [DOI] [PMC free article] [PubMed] [Google Scholar]
Associated Data
This section collects any data citations, data availability statements, or supplementary materials included in this article.


