

Abstract
Objective
Rates of IgE‐mediated food allergy (FA) have increased over the last few decades, and mounting evidence implicates disruption of epigenetic profiles in various immune cell types in FA development. Recent data implicate B‐cell dysfunction in FA; however, few studies have examined epigenetic changes within these cells.
Methods
We assessed epigenetic and transcriptomic profiles in purified B cells from adolescents with FA, comparing single‐food‐allergic (peanut only), multi‐food‐allergic (peanut and ≥1 other food) and non‐allergic (control) individuals. Adolescents represent a phenotype of persistent and severe FA indicative of a common immune deviation.
Results
We identified 144 differentially methylated probes (DMPs) and 116 differentially expressed genes (DEGs) that distinguish B cells of individuals with FA from controls, including differential methylation of the PM20D1 promoter previously associated with allergic disorders. Subgroup comparisons found 729 DMPs specific to either single‐food‐ or multi‐food‐allergic individuals, suggesting epigenetic distinctions between allergy groups. This included two regions with increased methylation near three S100 genes in multi‐food‐allergic individuals. Ontology results of DEGs specific to multi‐food‐allergic individuals revealed enrichment of terms associated with myeloid cell activation. Motif enrichment analysis of promoters associated with DMPs and DEGs showed differential enrichment for motifs recognised by transcription factors regulating B‐ and T‐cell development, B‐cell lineage determination and TGF‐β signalling pathway between the multi‐food‐allergic and single‐food‐allergic groups.
Conclusion
Our data highlight epigenetic changes in B cells associated with peanut allergy, distinguishing features of the epigenome between single‐food‐ and multi‐food‐allergic individuals and revealing differential developmental pathways potentially underpinning these distinct phenotypes.
Keywords: B cells, epigenetics, multi‐food allergy, peanut allergy, transcriptomics
This study assessed epigenomes and transcriptomes from a cohort of single‐food‐allergic, multi‐food‐allergic and non‐allergic controls. We found distinct B‐cell epigenetic signatures in food‐allergic adolescents and further uncovered multi‐food allergy‐specific methylation signatures, depicting differential regulation of key immune pathways in these clinical groups.

Introduction
IgE‐mediated food allergies (FAs) are a major group of allergic disorders with more than 90% of food‐allergic reactions caused by egg, soy, cow’s milk, peanuts, tree nuts, wheat, fish and shellfish.1 While most egg and cow’s milk allergies resolve within the first few years of life, only 22% of peanut allergy resolves by age 4, and it often persists into adulthood.2, 3 Moreover, 20–30% of peanut‐allergic individuals are multi‐food‐allergic (MA), most commonly to tree nuts (up to 41.5% reported in an Australian adolescent cohort), which increases the risk of experiencing adverse allergic reactions.4, 5, 6, 7, 8, 9, 10 Mechanisms leading to concurrent sensitisations to multiple allergens as opposed to a single allergen are currently unknown. As adolescents with food allergy (FA) represent a subset of the FA population that suffer from persistent FA and are at the highest risk of serious allergic reactions (with up to 35% of FA adolescents experiencing a severe allergic reaction over a year), understanding the immune drivers of persistent peanut and multi‐food allergy remains a high priority research area.4, 10, 11, 12
While the role of B cells as producers of IgE in FA is well documented, recent studies have reported diverse functional changes of B cells in FA, such as enhanced responses upon stimulation with TLR ligand CpG, as well as variations in tissue and circulating subpopulations.13, 14, 15, 16, 17, 18 Food‐allergic children tend to show increased proportions of circulating B cells compared with non‐allergic (NA) children, most apparently in naïve and memory (both switched and non‐switched) B‐cell populations.14 Moreover, variations in regulatory B‐cell (Breg) populations in allergic individuals provide evidence for the role of B cells in regulating the allergic response, with Breg‐derived interleukin (IL)‐10 inhibiting the release of Th2 cytokines.17 We previously showed that B cells from children with egg allergy respond in a more inflammatory manner upon non‐specific activation compared with non‐allergic controls, characterised by a heightened production of IL‐8, as well as impaired production of regulatory cytokines such as IL‐10.14 This suggests a multifaceted role of B cells in shaping the development and severity of allergic response in FA.
Food allergy is a complex phenotype, involving gene–environment interactions that are likely mediated by epigenetic mechanisms, such as DNA methylation.19 Indeed, peripheral blood mononuclear cells (PBMCs) and purified T‐cell populations from FA individuals show distinct DNA methylation patterns compared with NA individuals, affecting genes associated with T‐cell activation, mTOR signalling and the MAPK pathway, with these effects more pronounced in persistent FA.20, 21, 22, 23 Despite mounting evidence of epigenetic variation in various immune cell types in association with FA and evidence of B‐cell dysfunction in children with FA, epigenetic profiles of B cells in FA have been largely overlooked. In this study, we compared genome‐wide DNA methylation and transcriptomic profiles in B cells of FA adolescents (10–14 years of age) between single‐food‐allergic (SA, peanut only) and multi‐food‐allergic (MA, peanut and at least one other food), and non‐allergic (NA) individuals.
Results
Differentially methylated probes associated with peanut allergy
DNA methylation profiling was carried out on purified B‐cell genomic DNA using the widely validated Infinium MethylationEPIC arrays. A total of 26 individuals were included in this analysis: nine NA controls and 17 FA adolescents, consisting of both single‐food (peanut)‐allergic (SA, n = 10) and multi‐food‐allergic (MA, n = 7) individuals (Figure 1a, Table 1). Following quality control procedures, methylation data were available for a total of 770 475 probes, across all individuals, for downstream analysis. While differential methylation analysis did not find any probes following FDR correction, using an unadjusted P < 0.05 significance threshold, we identified 144 differentially methylated probes (DMPs) between NA and FA groups, with 77 probes showing higher methylation in FA (largest effect size of Δβ 0.36 and mean (SD) Δβ 0.14 ± 0.05) and 67 probes showing lower methylation in FA (largest effect size of Δβ 0.29 and mean 0.14 Δβ ± 0.05) (Figure 1b–d, Supplementary table 1). All DMPs were within 1 Mb of a gene transcription start site, with 15 genes in proximity to two or more DMPs. DMPs with higher methylation in association with FA were in the proximity of 59 genes, while DMPs with lower methylation in FA were associated with 56 genes.
Figure 1.

(a) Samples and groups [non‐allergic (NA), n = 9; single‐food allergic (SA), n = 10; and multi‐food allergic (MA), n = 7] used in this study. Red lines indicate individual group comparisons carried out, while green lines represent the comparison of NA (n = 9) and combined FA groups (SA and MA, n = 17). 20 025 genes and 770 475 probes are used in transcriptomic and epigenomic analyses, respectively. (b) Heatmap of the 144 differentially methylated probes (DMPs) in the NA/FA comparison. (c) Boxplots of the (i) 77 probes showing higher methylation in FA individuals and (ii) 67 probes showing lower methylation in FA individuals compared with the NA group. Values displayed above boxplots represent P‐values determined by the Mann–Whitney U‐test between groups. (d) PCA plot of 144 DMPs separating the NA and FA groups. (e) PCA plot of 116 differentially expressed genes separating the NA and FA groups.
Table 1.
Table of demographics for the subset of SchoolNuts cohort used in this study
| Non‐food allergic (NA) | Peanut‐only allergic (SA) | Multi‐food allergica (MA) | |
|---|---|---|---|
| Total number | 9 | 10 | 7 |
| Sex: male, n (%) | 4 (44) | 5 (50) | 5 (71) |
| Age at blood collection (years), median (min–max) | 12 (10–14) | 12 (11–13) | 12 (10–13) |
| Current asthma/wheeze, n (%) | 5 (56) | 5 (50) | 2 (29) |
| Hay fever ever, n (%) | 6 (67) | 6 (60) | 6 (86) |
| Family history of food allergy, n (%) | 5 (56) | 2 (20) | 2 (29) [1 ND] |
| Both parents born in Australia, n (%) | 8 (89) | 6 (60) | 2 (29) |
| Peanut SPT (mm), median (min–max) | 0 (0–2) | 10 (6–22) | 10 (3–22) |
| Peanut sIgE (kUA/L), median (min–max) | ND | 9.27 (0.7–68) | 18.1 (0.45–101) |
| Peanut allergy + ≥ one Tree nut allergy (%) | 0 (0) | 0 (0) | 6 (86) |
Peanut allergy and allergy to one or more of the following foods: tree nuts (either cashew, pistachio, walnut, hazelnut, macadamia, pecan, almond, Brazil nut or pine nut), sesame, egg, milk or shellfish.
Differentially methylated regions associated with peanut allergy
To further investigate methylation differences between NA and FA groups, DMRcate was used to identify differentially methylated regions (DMRs). A total of 288 DMRs were identified with a P‐value < 0.05, and after applying further cut‐offs (at least three probes per DMR and at least one of the probes with mean Δβ of 0.1), 17 DMRs remained (Figure 2a, Supplementary table 3). Of these, 10 showed higher (within 1Mb of MAB21L3, FMOD, SPATA19, TTC23, GAREML, PIGZ, FAM53A, TGFBI, RNF39 and RARRES2) and seven showed lower (within 1 Mb of GSTM5, PM20D1, GNG13, SCN1A, ETS2, LPCAT1 and PRKAG2) methylation in association with FA. These 17 DMRs consisted of between 4 and 31 probes and ranged in size from 188 to 1517 base pairs.
Figure 2.
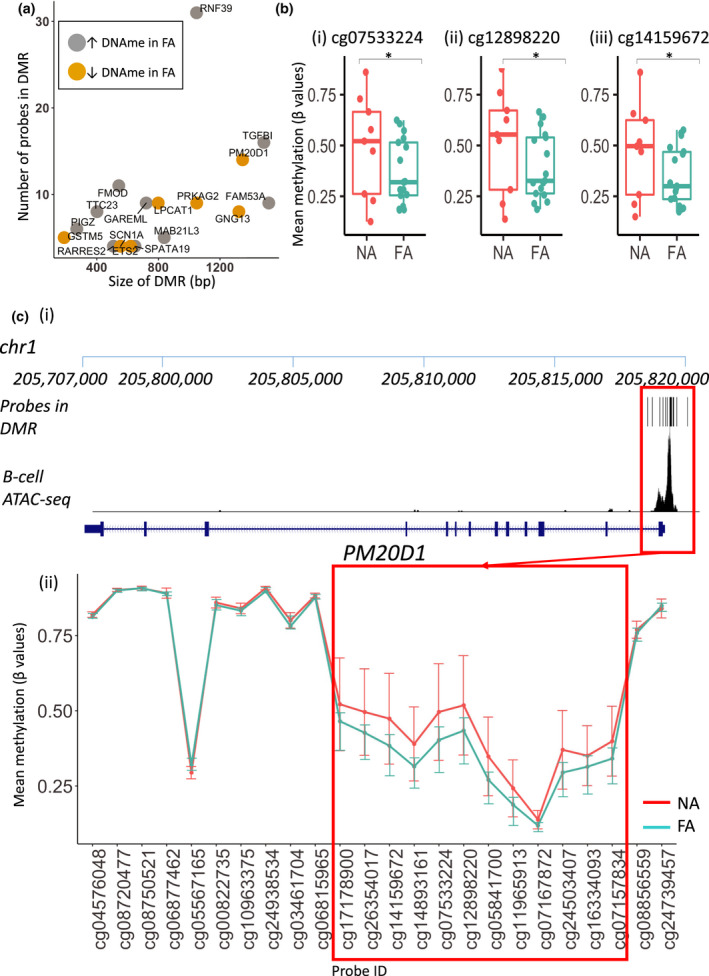
(a) Analysis of differentially methylated regions (DMRs) using DMRCate revealed 17 DMRs between NA (n = 9) and FA groups (n = 18). Here, we show a plot of DMR size (in base pairs (bp)) and number of probes in DMR. (b) A DMR associated with the PM20D1 gene was found in this analysis, consisting of 15 probes. Displayed here are boxplots of statistically significant probes (as determined using the linear regression model with limma) with highest methylation difference between FA and NA groups in PM20D1 DMR. Values displayed above boxplots represent P‐values determined using the linear regression model (limma) (c) Location of the PM20D1 DMR relative to PM20D1 gene. (i) Location of DMR probes on the chr1 chromosome (p arm) and proximity to nearest gene, PM20D1. Overlaid with ATAC‐seq data from healthy B cells to indicate regions of open chromatin. (ii) Mean methylation values (β values) of probes associated with PM20D1.
This included a DMR in the promoter region of PM20D1 (Figure 2b, c), previously identified in respiratory allergy (hay fever, rhinitis and wheezing) and atopic asthma,24, 25, 26 consisting of 15 probes spanning 1531bp with lower mean DNA methylation in the FA group (Δβ 0.03‐0.13, mean 0.08 Δβ ± 0.04). This included three probes identified as a statistically significant difference between NA and FA with a Δβ of > 0.1 (Figure 2b).
Single‐food‐ and multi‐food‐allergic group‐specific methylation signatures
Next, we aimed to identify methylation variation specific to the SA or MA groups. To do this, we compared the SA and MA with each other and with the NA group. Using previously defined cut‐offs for the FA vs NA comparison (unadjusted P‐value < 0.05 significance, Δβ > 0.1), a total of 192 DMPs were identified between NA and SA groups (111 higher and 81 lower methylation); 335 between NA and MA (115 higher and 220 lower); and 318 between SA and MA (106 higher and 220 lower). A total of 729 unique DMPs (out of combined 845 DMPs) were identified across all comparisons (Figure 3a), of which all but three were within 1 Mb of 532 total genes (Supplementary table 4). A principal component analysis revealed distinct separation of the three groups based on methylation data at these 729 probes (Figure 3b), while unsupervised k‐means clustering identified 12 distinct clusters of methylation variation, of which eight showed distinct methylation patterns across the three comparison groups (Figure 3c).
Figure 3.

(a) Summary of the numbers of differentially methylated probes found in each group comparison (NA vs SA – 192 DMPs; NA vs MA – 335 DMPs; and SA vs MA – 318 DMPs), amounting to a total of 729 DMPs across all these comparisons. (b) PCA plot of these 729 probes from combined group comparisons showing distinct separation of the three clinical groups (NA in red, SA in green and MA in blue). (c) Unsupervised clustering of these 729 probes revealed 8 clusters. Shown here are boxplots comparing mean methylation values (β values) of samples in each group (NA, SA and MA) in these eight clusters and numbers of probes in each cluster. Values displayed above boxplots represent P‐values determined by the Mann–Whitney U‐test between groups. The 8 clusters were classified as follows: cluster (i) 54 probes progressively hypermethylated in allergic groups (methylation level: NA< MA< SA), (ii) 125 probes progressively hypermethylated in allergic groups (NA< SA< MA), (iii) 55 probes progressively hypomethylated in allergic groups (NA>MA>SA), (iv) 58 probes hypomethylated in allergic groups (NA>SA>MA), (v) 47 probes specifically hypermethylated in SA (NA = MA< SA), (vi) 84 probes specifically hypomethylated in SA (NA = MA>SA), (vii) 220 probes specifically hypermethylated in MA (NA = SA< MA) and (viii) 86 probes specifically hypomethylated in MA (NA = SA>MA).
Differentially methylated regions associated with single‐food‐ and multi‐food‐allergic groups
A total of 28 DMRs were identified between NA and SA groups (13 higher and 15 lower in SA, 217 total probes; consisting of between 4 and 22 probes, ranging in size from 188 to 2092 base pairs) within 1Mb of 28 genes. In contrast, 46 DMRs (400 total probes; consisting of between 4 and 32 probes, ranging in size from 142 to 2937 base pairs) were identified between NA and MA (34 higher and 12 lower in MA) within 1Mb of 44 genes (Figure 4a), while 34 DMRs (250 total probes; consisting of between 4 and 14 probes, ranging in size from 183 to 1913 base pairs) were found between SA and MA (21 higher and 13 lower in MA), within 1Mb of 34 genes (Figure 4a). In total, the 95 DMRs identified across all comparisons covered 759 probes within 1Mb of 93 genes (Supplementary table 5).
Figure 4.

(a) Location of DMRs associated with S100 genes relative to gene locations on chromosome. (i) Location of probes on the chr1 chromosome (p arm) and proximity to nearest genes: S100A14, S100A13 and S100A1. Overlaid with ATAC‐seq data from healthy B cells to indicate regions of open chromatin, and layered H3K27ac track. (ii) Mean methylation (β values) of probes in this region across groups. (b) Boxplots indicating methylation values (β values) of selected probes within DMRs associated with S100 genes (i) cg01347250, (ii) cg02331910, (iii) cg08273163 and (iv) cg08477332. Values displayed above boxplots represent P‐values determined by the Mann–Whitney U‐test between groups.
Interestingly, two DMRs, spanning 6 and 22 probes, respectively, were found in close proximity within a cluster of S100A1, S100A13 and S100A14 genes on chromosome 1 (Figure 4b). Both DMRs exhibited higher methylation in the MA group relative to SA or NA groups (Δβ > 0.1), with 10/28 probes in these DMRs showing significant methylation differences (Figure 4c). Further analysis of this region using publicly available ENCODE data revealed that these DMRs are marked by H3K27ac (a marker of active chromatin) and specific ATAC peaks (open chromatin associated with gene activity) in purified B cells27 (Figure 4b). We also identified a DMR showing hypermethylation in the MA group (spanning 329 bp and consisting of six probes, two of which show 0.1 Δβ in the SA/MA comparison) near RPTOR, a gene for which we previously reported an unrelated DMR.28 The DMR found in this study was located 200 Kb downstream of the TSS (within the gene body) and is annotated as an ENCODE enhancer site (Supplementary table 5).
Distribution of differentially methylated probes and regions
In order to determine the relevance of our findings, the distribution of the DMPs and DMRs from these comparisons relative to CpG islands was assessed. Relative to the overall distribution of EPIC probes relative to CpG islands, we did not find any particular enrichment for the distribution of DMPs from these comparisons in any locations. However, DMRs from these comparisons were increasingly located at the shores of CpG islands (Supplementary figure 3a).
To further assess whether these genes are actively transcribed in B cells, we used a publicly available data set of ATAC‐seq data from healthy B cells.27 Across all EPIC probes, only 23% (201 368/866 836) of probes are associated with B‐cell‐specific open chromatin regions. In contrast, 38% (55/144) of DMPs distinguishing between NA and FA individuals, and 31% (225/729) of DMPs distinguishing between the three clinical groups (NA, SA and MA) were associated with open chromatin regions in B cells (Supplementary figure 3b). Moreover, 47% (8/17) and 59% (56/95) of DMRs from these respective comparisons showed ATAC‐seq peaks in healthy B cells (Supplementary tables 1, 3–5). A chi‐square test reveals a statistically significant (chi‐square statistic = 31.1899, P‐value < 0.00001) enrichment for accessible chromatin regions among these DMPs and DMRs, indicating active transcription and therefore functional relevance of these sites in B cells.
Transcription factor (TF)‐binding motif analysis of the open chromatin regions associated with these DMPs and DMRs reveals enrichment for 85 motifs, for which 40 associated TFs were expressed in our data (RPKM > 1). Among these, we found several binding sites recognised by TFs associated with B‐cell lineage determination (IRF8, EBF1, PU.1, KLF3 and PU.1:IRF8) (Supplementary figure 4, Supplementary table 10).29, 30, 31, 32, 33, 34
B‐cell transcriptomic differences associated with peanut allergy
RNA profiling was carried out on purified B‐cell mRNA using the next‐generation platform, Illumina NovaSeq 6000. A total of 26 individuals were included: nine NA controls and 17 FA adolescents, consisting of both single‐food (peanut)‐allergic (SA, n = 10) and multi‐food‐allergic (MA, n = 8) individuals (Figure 1a, Table 1). Differential gene expression analysis revealed a total of 116 differentially expressed genes (DEGs; 23 upregulated and 93 downregulated in FA) with mean RPKM > 1, fold change of 1.5 and an unadjusted P‐value < 0.05 between NA and FA groups (Supplementary figure 5). This revealed differential expression of genes associated with epigenetic and transcriptomic regulation (HIST1H1D and PRDM15) and cell differentiation and proliferation (TIMP1).35, 36 A principal component analysis of data for DEGs revealed some separation of NA and FA groups (Figure 1e, Supplementary table 2), but not to the same degree as the 144 DMPs (Figure 1d). The PCA indicates an overlap of a few NA and FA individuals who do not appear to share any similar traits (Figure 1e). Functional enrichment analysis did not identify any relevant gene ontology terms based on these 116 genes. However, enrichment analysis in the MSigDB curated gene set database revealed enrichment for genes previously implicated in T‐cell activation, specifically regulatory T cells and Th2 cells, as well as mast cell activation37, 38, 39, 40 (Supplementary figure 6a).
Single‐food‐ and multi‐food‐allergic group‐specific B‐cell transcription signatures
To identify group‐specific gene expression patterns, we compared the SA and MA with each other and with the NA group, as previously done for DNA methylation. This revealed a total of 74 DEGs between NA and SA (33 upregulated in SA and 41 downregulated), 96 DEGs between NA and MA (60 upregulated 36 downregulated in MA) and 83 DEGs between SA and MA (51 upregulated and 32 downregulated in MA) (Figure 5a). Combined together, there were a total of 224 DEGs across these comparisons. However, as with the NA/FA comparison, a high degree of variability of gene expression existed within groups, with only a few genes showing consistent expression patterns across groups (Supplementary table 6). A principal component analysis of these genes does not indicate a clear distinction of the two allergic groups (Figure 5b).
Figure 5.

(a) Summary of numbers of differentially expressed genes (DEGs) found in each group comparison (NA vs SA – 74 DEGs; NA vs MA – 96 DEGs; and SA vs MA – 83 DEGs) and total numbers of DEGs (224 genes) across all comparisons. (b) PCA plot of the 224 DEGs across all groups. (c) Results of functional enrichment analysis of genes in the NA vs MA comparison, GO term visualised alongside ‐log P‐value of associated term. (d) Boxplots indicating expression (scaled log2 RPKM values) of selected genes from the 224 DEGs identified across all groups: (i) TNFRSF17, (ii) ANXA1, (iii) IL3RA and (iv) LCP2. Values displayed above boxplots represent P‐values determined by the Mann–Whitney U‐test between groups.
Among these 224 DEGs, we found that TNFRSF17 is upregulated specifically in the SA group, while LCP2 is downregulated in the SA group. Conversely, ANXA1 and IL3RA are upregulated in the MA group (Figure 5d). TNFRSF17 encodes the B‐cell maturation antigen (BCMA), which is responsible for the regulation of B‐cell development and highly expressed by long‐lived plasma cells, while LCP2 plays a key role in immune cell signalling.41, 42 ANXA1 serves a number of roles in the innate immune pathway, most notably as a regulator of inflammation.43
Gene ontology analysis of genes from the NA vs MA comparison revealed functional enrichment for the biological process immune response (GO:0006955) with nearly 20 genes from the target list populating this term (Figure 5c). Further investigation of the results indicates that these genes are more specifically involved in immune pathways such as myeloid leucocyte activation (GO:0002274), which included granulocyte activation (GO:0036230).
Transcription factor‐binding motif analysis of genes in the proximity of differential methylation
In order to identify potential upstream regulators of the observed DNA methylation variation identified in specific allergy groups, we analysed distal and proximal regulatory regions for transcription factor‐binding motifs. A total of 30 motifs were enriched across all comparisons in the distal regulatory regions, and of these, evidence of expression of the associated transcription factors was found for 11 of 30 motifs (mean RPKM > 1) (Supplementary figure 6b, Supplementary table 8).
Interestingly, sites associated with lower methylation in MA showed depleted motif presence for RUNX1 binding, directly associated with the regulation of T‐cell development44 and enrichment (increased motif presence) of the motif recognised by b‐MYB, a key regulator of cell differentiation, and FLI1 and ETS1, which play crucial roles in the activation of B‐cell receptors.45, 46 In contrast, DMPs showing higher methylation in MA were enriched for PU.1 binding, implicated in B‐cell maturation.47
In the proximal regulatory regions, 79 enriched motifs were identified, with evidence of expression of associated transcription factors for 32 of 79 motifs (Supplementary table 7). As with motifs mapping to distal regulatory sites, differential enrichment was observed in TF‐binding sites associated with the development and maintenance of B‐ and T‐cell populations (Figure 6b). Binding sites for Bcl6, PPAR‐α, Zfx, OCT2 and NFAT48, 49, 50, 51, 52, 53, 54, 55, 56 showed depleted enrichment, whereas motifs associated with B‐cell lineage determination (PU.1, IRF4, KLF3, Bcl11a and PU.1:IRF8) were enriched in the MA group.29, 30, 31, 32, 33 We additionally found depleted motif presence for regulators of the B‐cell receptor (SpiB and PU.1) in MA groups.47, 57, 58 Interestingly, binding sites for TFs regulating the TGF‐β signalling pathway were only enriched in the promoters associated with DMPs showing higher methylation in MA (SMAD2 and SMAD4).57
Figure 6.
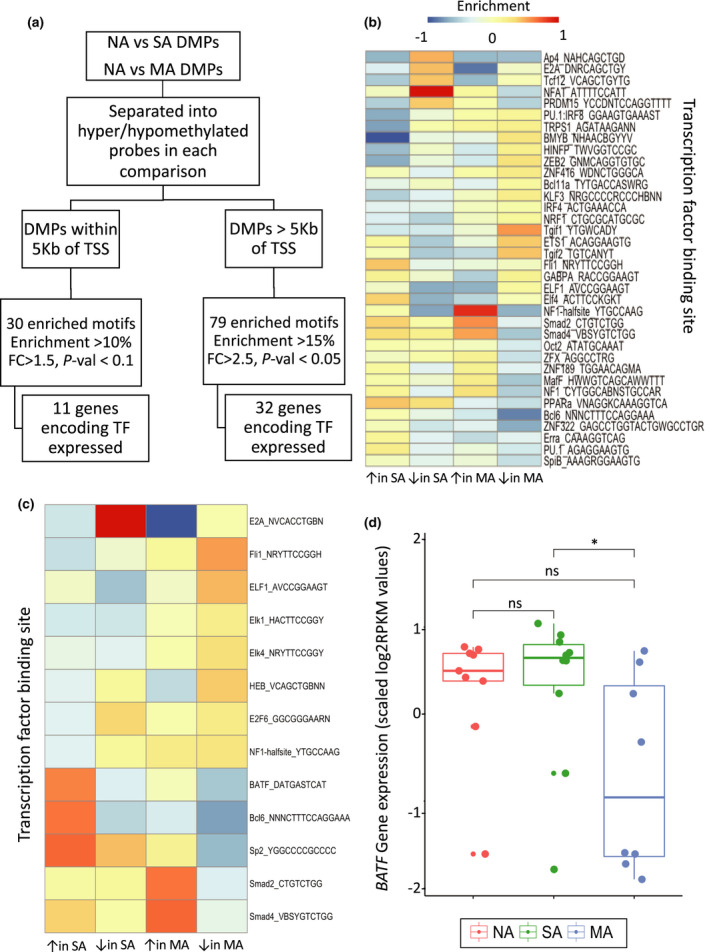
(a) Workflow employed to carry out motif enrichment analysis. (b) Heatmap showing enrichment of motifs across promoters associated with DMPs from NA vs SA and NA vs MA comparisons. (c) Heatmap showing enrichment of motifs in promoters associated with DEGs from NA vs SA and NA vs MA comparisons. (d) Expression (scaled log2 RPKM values) of BATF gene across groups.
Transcription factor‐binding motif analysis of differentially expressed genes
Motif enrichment analysis of DEG‐associated promoters revealed 31 enriched motifs (with evidence of expression for 13 of 31 genes encoding transcription factors that recognise these motifs) across the NA/SA and NA/MA comparisons (Figure 6c, Supplementary table 9). Consistent with the motif signatures of DMP‐associated promoters, binding sites for Bcl6 and BATF, involved in the development and maintenance of B‐ and T‐cell populations, showed depleted enrichment in MA‐associated DEGs.29, 58 Interestingly, BATF gene expression was also downregulated in the MA group (Figure 6d). Moreover, we found that promoters associated with upregulated genes in MA showed enrichment for SMAD2 and SMAD4.
To further determine the significance of TGF‐β pathway in our data, the expression of genes associated with the TGF‐β pathway was assessed. Overall, 42 of 86 genes contained in the TGF‐β pathway KEGG gene set were expressed (RPKM > 0) across all samples. However, SA individuals exhibit diminished expression of these genes, suggesting dysregulation of the TGF‐β pathway in peanut‐only‐allergic individuals (Supplementary figure 5c).
Distinct methylation and gene expression signatures in B cells of FA individuals
To assess the degree to which differential methylation is associated with differential gene expression in B cells of FA individuals, we directly compared genes in the proximity of DMPs/DMRs with DEG. This revealed minimal overlap, with only 11 of 224 total DEGs having a DMP near them, and no DEGs with a nearby DMR. This low overlap between DMPs and DEGs is also reflected in the generally different motif signatures, except for enrichment of Bcl6 and BATF, suggesting that these transcription factors may be involved in the differential regulation of B cells in FA.
Discussion
This is the first analysis of combined genome‐wide DNA methylation and transcriptomic profiling of purified B cells from peanut‐allergic individuals and the first to assess molecular profiles of single‐ and multi‐food‐allergic adolescents, an understudied yet important population given the complex health consequences of FA in this age group.59, 60 Our findings are consistent with past studies in other cell types showing epigenetic variation in association with FA,21, 28, 61 but we extend this by revealing distinct epigenetic variation specific to the MA phenotype.
In summary, DNA and RNA samples from 26 individuals were from three clinical groups: patients with single‐food allergy (peanut only), patients with multi‐food allergy (peanut and one or more additional foods) and non‐allergic controls. Comparisons of FA and NA were carried out with FA groups in combination and individually, and we found group‐specific signatures, highlighted by increased numbers of DEGs/DMPs when FA groups were analysed separately.
B cells from peanut‐allergic individuals show widespread differential methylation
Whereas previous analyses have examined epigenetic variation associated with PBMCs and T cells from FA infants, our findings support the emerging concept that molecular pathways are disrupted across multiple cell types in FA, possibly indicative of early‐life reprogramming of cells that persists into adolescence.62 Indeed, a recent study carried out on the SchoolNuts cohort, the same cohort of adolescents used in this study, found that adolescents with FA possess unique immune profiles that reflect changes reported in early life, such as increased proportions of dendritic cells and activated regulatory T cells in FA individuals.28, 62 Such differences may be attributed to the unique epigenetic signature of FA adolescents found in this study. Our finding of the DMR associated with PM20D1, a gene encoding peptidase M20 domain‐containing one enzyme, supports this hypothesis. Higher methylation at this locus has been strongly associated with adult obesity (up to 0.2 Δβ) and moderately with history of stroke (0.05 Δβ), suggesting that this particular DMR is associated with a number of phenotypes,63, 64 potentially those associated with inflammation. In a study by Gunawardhana et al. (2014), DNA methylation profiled in peripheral blood samples of 12‐month infants (n = 40) showed lower methylation (0.1 Δβ) at this locus in individuals born to atopic mothers.25 While there was no assessment of atopic status of offspring, subsequent studies in later life reported higher methylation at this region in association with respiratory allergy (IgE sensitisation to a set of airborne allergens, in addition to doctor’s report of hay fever or rhinitis) and wheezing.24, 26 Despite the differences in previous studies, it is clear that this represents a region subject to epigenetic variation across the life course including a range of allergic disorders, namely respiratory allergy and now FA. PM20D1 is known to be a regulator of N‐fatty acyl‐amino acids, which are involved in a number of endogenous signalling pathways that include regulation of inflammation. The methylation status of PM20D1 may therefore have downstream effects on allergy‐related inflammatory responses.65
B cells of single‐ and multi‐food allergies appear distinct at the molecular level
Our findings also indicate that MA individuals are epigenetically distinct from SA individuals, clearly illustrated in the group‐specific methylation signatures in the probes. Hypermethylation of regions near genes encoding S100 proteins indicates differential regulation of these pathways associated with these proteins in MA individuals. The S100 family encompasses 21 calcium‐binding proteins that serve diverse roles in inflammation, energy metabolism and cell cycle regulation.66, 67, 68 S100A1 and S100A13 have been previously linked to allergy in a study documenting the suppressive effects of anti‐allergic drugs (cromolyn, amlexanox and tranilast, used to suppress the inflammatory response) on these proteins.69, 70 In a study of atopic dermatitis, S100A11 expression was found to be modulated by Th2 cytokines, which have a downstream effect on human β‐defensin and filaggrin response, both of which have been associated with the progression of allergic disorders.71 Enrichment for accessible chromatin in healthy B cells across the DMPs and DMRs found across these comparisons provides evidence for transcription factor activity at these regions. This may provide some insight regarding pathways contributing to the development of multi‐food allergy.
Limited concordance between B‐cell gene expression and differential methylation in FA
While our results indicate differences in gene expression between NA and FA B cells at baseline, expression levels were variable across groups and the findings on transcriptomic differences did not correlate well with the extensive epigenetic differences observed. However, differences in expression of key genes involved in immune cell signalling and development (LCP2 and TNFRSF17), cytokine activity (IL3RA) and regulation of inflammation (ANXA1) across groups support our hypothesis that crucial molecular pathways are disrupted in FA.41, 42, 43, 72 Functional enrichment for terms associated with immune responses in MA‐associated DEGs, in particular granulocyte activation, suggests that B cells mediate myeloid cell activity and potentially prompt an inflammatory phenotype in MA individuals even at baseline. While ANXA1 is largely associated with the anti‐inflammatory response, one study reports increased expression of ANXA1 in plasma samples (n = 100) of asthmatic patients compared with controls.43, 73, 74 This suggests that the production of higher ANXA1 levels at baseline counteract the proinflammatory skew in atopic individuals. Despite moderate gene expression differences found in this study, studies from our group have demonstrated increased proinflammatory responses of B cells from FA samples following activation via cytokine assays, indicating that B‐cell function is extensively altered in FA individuals.14 Future studies should investigate differences in gene expression of B cells following activation in an in vitro model of allergen exposure to provide insight into the pathways underlying this altered response, and characterise differential responses to activation in MA individuals.
B‐cell lineage‐specific motif signatures identified in DMP‐ and DEG‐associated promoters
The results of our motif analysis shed some light on how B cells interact with other cells to develop the adverse immune responses observed in allergic adolescents. Notably, the differential enrichment for motifs binding OCT2, NFAT, BATF and Bcl6 indicates differential pathways regulating B‐ and T‐cell development in MA individuals, with the differential expression of BATF providing further evidence for disruptions in immune cell development in MA patients.48, 49, 50, 52, 53, 54, 55 Enrichment of Bcl6 motifs has previously been associated with chronic inflammatory disorders such as juvenile arthritis,76 and previous studies report the combined roles of OCT2 and NFAT in promoting a proinflammatory response to pathogens in B‐ and T‐cell populations via the production of IL‐6 and IL‐21.48, 49 Differential enrichment of binding sites for TFs determining B‐cell lineage (KLF3, Bcl11a and PU.1:IRF8) and regulating B‐cell receptor signalling pathways (SpiB and Pu.1) suggests that MA individuals may possess unique B‐cell subpopulations and exhibit differential activation responses compared with SA individuals.14 This is further supported by the differential enrichment of PPAR‐α between MA and SA groups shown by our data, which has been associated with the development of regulatory B cells.56 Moreover, differential enrichment of SMAD2 and SMAD4 promoters between MA‐ and SA‐associated DEGs and DMPs implicates the TGF‐β signalling pathway in the FA phenotype. The TGF‐β signalling pathway plays a key role in the regulation of the allergic immune response, most notably as a suppressor of the proinflammatory response by mediating Treg activity.76, 77, 78, 79 Interestingly, the study conducted by Neeland et al. (2021) in this cohort found increased proportions of activated Tregs in SA individuals.62 Further studies investigating immune profiles of MA B‐cell subsets and T‐cell epigenomes will prove valuable in understanding how B cells and T cells interact in FA.62
Strengths and limitations
We recognise the limitations of this study, particularly the relatively small sample size that did not allow for the detection of probes reaching FDR significance. To compensate for this, the analysis approach employed strict cut‐offs to obtain the most statistically valid differences between groups; this may have resulted in the omission of subtle differences in DNA methylation or gene expression. We also point out that the MA group in this study was heterogeneous with a range of FAs, with lower rates of asthma (25% of MA individuals were diagnosed with current asthma/wheeze compared with 50% of SA and 56% of NA individuals) and with participants of varying ethnicity (only 38% of MA individuals had both parents born in Australia), which may have resulted in increased variation in the results. However, as the multi‐food‐allergic population is heterogeneous, a strength of our samples is that they accurately represent the diversity of this community. Additionally, we are aware of the increased number of males in the MA group (75%, while NA and SA groups consisted of 44% and 50% males, respectively). While the linear regression model used for analysis incorporated sex as a covariate, the sex bias in the MA group may still have led to overestimation of sex‐specific DMRs in this group (BRDT and SPATA19), suggesting that these DMRs were detected as a result of sex bias as opposed to allergy status.80, 81 We also note that the data set used to assess enrichment of open chromatin regions in healthy B cells employed samples from adults, which may not reflect the accessible chromatin landscape in adolescents.27
Conclusion
This study suggests that B cells from peanut‐allergic individuals show specific epigenetic and gene expression differences relative to non‐allergic individuals. Further, our findings suggest that single‐peanut‐allergic and MA individuals possess unique group‐specific epigenetic signatures that involve differential regulation of B‐ and T‐cell development, B‐cell lineage determination and TGF‐β signalling pathway, highlighting the phenotypic and molecular distinction of the MA clinical group from single‐peanut‐allergic individuals. Future research is indicated, particularly around profiling MA patients in order to better characterise this diverse clinical group. It will be interesting to characterise the epigenomes and transcriptomes of other immune cells from matched samples from MA individuals with a range of various FAs, particularly following activation, and integrate these data with assays of functional output.82
Methods
Clinical samples and data collection
This study was carried out using PBMC samples from a subset of adolescents enrolled in the SchoolNuts cohort, a cross‐sectional population‐based study profiling the prevalence of FA in adolescents between 10 and 14 years of age.10 Ethics approval to conduct the SchoolNuts study was obtained from the Royal Children’s Hospital Research Ethics Committee (no. 31079), the Department of Education and Early Childhood and the Catholic Education Office. Written and informed consent was obtained from the parents of participants in this study. Skin prick tests (SPTs) and oral food challenges (OFCs) were conducted to confirm suspected FA, based on parents’ responses to questionnaires regarding history of FA.10 Participants with a clear and recent history of reaction consistent with IgE‐mediated FA, in the context of a positive SPT or sIgE, were not required to undergo an OFC. Blood was collected following clinic visits. Clinic‐defined FA was defined as a positive OFC or convincing recent or severe history in the context of IgE sensitisation (SPT weal size of ≥ 3 mm or sIgE ≥ 0.35 KuA L–1), as described for the cohort previously. Single‐peanut‐allergic children had clinic‐defined peanut allergy with no evidence of sensitisation or a negative OFC to all other foods. Multi‐food‐allergic children had clinic‐defined peanut allergy with a clinic‐defined allergy to at least one other food. Non‐food‐allergic children had no evidence of sensitisation (< 3 mm) to a panel of 15 food allergens by SPT (egg white, cow’s milk, soy, peanut, cashew, almond, hazelnut, walnut, pistachio, macadamia, pecan, Brazil nut, pine nut, sesame and shellfish).
Study participants
The subset used for this study comprised 26 individuals: nine non‐food‐allergic controls (four males and five females) and 18 food‐allergic adolescents (11 males and seven females). In the food‐allergic group, 10 (five males and five females) individuals were allergic to only peanut (single‐food allergic, SA), while eight (six males and two females) individuals were allergic to more than one food (multi‐food allergic, MA) (peanut allergy; along with one or more of the following: tree nuts (either cashew, pistachio, walnut, hazelnut, macadamia, pecan, almond, Brazil nut or pine nut), sesame, egg, milk or shellfish).
Isolation of total B‐cell populations and nucleic acid
Peripheral blood mononuclear cells were isolated from blood samples using Ficoll–Paque density gradient centrifugation as previously described, and cryopreserved in liquid nitrogen.83 PBMCs were viably thawed, and total B‐cell populations (CD3‐CD19+) were isolated using fluorescence‐activated cell sorting (BD FACS‐ARIA Fusion Cell Sorter). Purified B cells were sorted into 350 µL of RLT+2ME (Qiagen) and stored at –80°C for future DNA and RNA extractions. DNA and RNA were extracted from the isolated B cells using the Qiagen AllPrep DNA/RNA Micro Kit, according to the manufacturers’ protocols. DNA and RNA were quantified on the Qubit fluorometer using the Qubit dsDNA High Sensitivity (HS) Assay Kit and the Qubit RNA HS Assay Kit (Thermo Fisher Scientific), respectively.
DNA methylation profiling
For DNA methylation profiling, only samples with sufficient DNA yields were used (n = 26). Genomic DNA from 26 samples (200–500 ng) was randomised in a 96‐well plate and sent to HuGe‐F (Erasmus MC, Rotterdam, the Netherlands) for bisulphite treatment and genome‐wide methylation analysis using Illumina Infinium MethylationEPIC BeadChips (the EPIC array). This approach is capable of assessing methylation at over 850 000 CpG sites (EPIC probes) spanning gene bodies, promoters and regulatory elements (ENCODE open chromatin and enhancers).84
Raw data were received as.iDAT files, which were preprocessed using the minfi and MissMethyl packages (available from Bioconductor) in the R statistical environment.85, 86 Assessment of sample quality revealed that all samples had a mean detection P‐value < 0.01, allowing all samples to remain for analysis. The SWAN (Subset‐quantile Within Array Normalization) approach was used to normalise data for technical variation between and within arrays.87 Probes were then filtered to remove those with poor average quality scores (P‐value < 0.01), cross‐reactive probes and probes associated with single nucleotide polymorphisms (SNPs).84 The final data set for analysis comprised methylation data from 770 475 probes. Confounders and covariates were identified using a principal component analysis (Supplementary figure 1) and incorporated into the model for differential analysis. Using available cohort data, covariates with complete data for all individuals were as follows: age, sex, hay fever, wheeze, parent country of birth (within Australia/overseas) and sample position on the EPIC array (plate well and position on chip).
Differential analysis was carried out on the 770 475 probes using the linear regression model with limma.88 Differentially methylated probes were identified as those showing an unadjusted P‐value < 0.05 and a methylation difference (Δβ) of > 0.1. The DMRCate tool was used to determine differentially methylated regions (DMRs), and individual probes within these DMRs were identified using Bedtools.89, 90 The nearest genes (within 1Mb of transcription start site in any one direction) to these DMRs and DMPs were determined using the Web‐based GREAT tool.91 Unsupervised clustering analysis of samples was carried out using the k‐means clustering function on MeV.92 DNA methylation data are available on the GEO repository, accession code GSE166067.
Transcriptomic profiling
Isolated RNA was sent for next‐generation sequencing on the Illumina NovaSeq 6000 instrument to the Translational Genomics Unit at the Victorian Clinical Genetics Services. Libraries were prepared using the Illumina TruSeq Stranded mRNA Kit with a starting input of 100 ng (where available) and subsequently sequenced, with the generation of approximately 20 million 100‐bp paired‐end reads per sample. Raw data were received as fastq files, which were subject to a quality check using FastQC, with all samples passing QC. Reads were then aligned to the human transcriptome (GrCh37 v70) using Bowtie, and gene expression estimates were derived using the mmseq pipeline.93, 94 Genes exhibiting low expression (mean reads per kilobase of transcript, per million of mapped reads (RPKM) < 1 across all samples) were removed from the analysis, leaving expression data for 20 025 genes. The DESeq package (available on Bioconductor) was used to normalise count data and determine gene expression differences between group comparisons.95 RNA‐seq data are available on the GEO repository, accession code GSE165316.
Regulatory element analysis
DMPs found in NA vs SA vs MA comparisons (Figure 3a), and DMPs overlapping open chromatin regions in B cells (Supplementary figure 4) were scanned for transcription factor‐binding motifs using HOMER.96 As a result of differing functionalities of proximal and distal regulatory elements, DMPs were classified as those that mapped to proximal regions (within 5 Kb of a gene transcription start site (TSS)) and those more distal (beyond 5 Kb of TSS) (Figure 6a). DMPs were further grouped according to whether higher or lower methylation was observed in FA groups.
A 200‐bp region around the distal DMPs was scanned for transcription factor‐binding motifs using HOMER (findMotifsGenome.pl). Motifs were identified as those showing enrichment of 10% over random background in at least one of the groups, and a fold change (FC) of 1.5 compared with background sequences. Proximal DMPs were scanned for enriched TF motifs using HOMER (findMotifs.pl). However, given the relatively low numbers of proximal DMPs and therefore associated genes, enrichment cut‐offs were set to more stringent standards to minimise false positives. In this case, enrichment was defined as motifs showing ≥ 15% enrichment and an FC ≥ 2, over background, with a P‐value < 0.05.
DEGs found in NA vs SA vs MA comparisons were similarly scanned for enriched TFs using HOMER (findMotifs.pl), with enrichment defined as motifs showing ≥ 15% enrichment and an FC ≥ 2 over background, with a P‐value < 0.1 (Figure 6c).
Conflict of interest
The authors declare no conflict of interest.
Author contributions
Samira Imran: Formal analysis; Methodology; Writing‐original draft. Melanie Neeland: Conceptualization; Funding acquisition; Methodology; Resources; Supervision; Writing‐review & editing. Jennifer Koplin: Data curation; Project administration; Writing‐review & editing. Shyamali Dharmage: Project administration; Resources; Writing‐review & editing. Mimi LK Tang: Project administration; Resources; Writing‐review & editing. Susan Sawyer: Project administration; Resources; Writing‐review & editing. Thanh Dang: Methodology; Project administration; Resources; Writing‐review & editing. Vicki McWilliam: Data curation; Resources; Writing‐review & editing. Rachel Peters: Data curation; Project administration; Resources; Writing‐review & editing. Kirsten P Perrett: Data curation; Project administration; Supervision; Writing‐review & editing. Boris Novakovic: Conceptualization; Funding acquisition; Methodology; Supervision; Writing‐review & editing. Richard Saffery: Conceptualization; Funding acquisition; Methodology; Resources; Supervision; Writing‐review & editing.
Supporting information
Supplementary figure 1
Supplementary figure 2
Supplementary figure 3
Supplementary figure 4
Supplementary figure 5
Supplementary figure 6
Supplementary table 1
Supplementary table 2
Supplementary table 3
Supplementary table 4
Supplementary table 5
Supplementary table 6
Supplementary table 7
Supplementary table 8
Supplementary table 9
Supplementary table 10
Acknowledgments
This study was funded by an NHMRC (Australia) Project Grant (#1165073) to RS, MN and BN. BN is supported by an NHMRC (Australia) Investigator Grant (#1173314). MN is supported by a Melbourne Children’s LifeCourse Fellowship. KP is supported by a Melbourne Children’s Clinician Scientist Fellowship. We thank the students, parents and schools that participated in the SchoolNuts study.
Contributor Information
Boris Novakovic, Email: boris.novakovic@mcri.edu.au.
Richard Saffery, Email: richard.saffery@mcri.edu.au.
References
- 1.Loh W, Tang MLK. The epidemiology of food allergy in the global context. Int J Environ Res Public Health 2018; 15: e2043. [DOI] [PMC free article] [PubMed] [Google Scholar]
- 2.Peters RL, Koplin JJ, Gurrin LCet al. The prevalence of food allergy and other allergic diseases in early childhood in a population‐based study: HealthNuts age 4‐year follow‐up. J Allergy Clin Immunol 2017; 140: 145–153.e8 [DOI] [PubMed] [Google Scholar]
- 3.Alduraywish SA, Lodge CJ, Vicendese Det al. Sensitization to milk, egg and peanut from birth to 18 years: a longitudinal study of a cohort at risk of allergic disease. Pediatr Allergy Immunol 2016; 27: 83–91. [DOI] [PubMed] [Google Scholar]
- 4.Mullins RJ, Liew WK, Wainstein B, Barnes EH, Campbell DE. Anaphylaxis fatalities in Australia 1997 to 2013. J Allergy Clin Immunol 2016; 137: 1099–1110. [DOI] [PubMed] [Google Scholar]
- 5.Bock SA, Muñoz‐Furlong A, Sampson HA. Fatalities due to anaphylactic reactions to foods. J Allergy Clin Immunol 2001; 107: 191–193. [DOI] [PubMed] [Google Scholar]
- 6.Shah E, Pongracic J. Food‐induced anaphylaxis: who, what, why, and where? Pediatr Ann 2008; 37: 536–541. [DOI] [PubMed] [Google Scholar]
- 7.McWilliam V, Peters R, Tang MLKet al. Patterns of tree nut sensitization and allergy in the first 6 years of life in a population‐based cohort. J Allergy Clin Immunol 2019; 143: 644–650.e645. [DOI] [PubMed] [Google Scholar]
- 8.Andorf S, Purington N, Block WMet al. Anti‐IgE treatment with oral immunotherapy in multifood allergic participants: a double‐blind, randomised, controlled trial. Lancet Gastroenterol Hepatol 2018; 3: 85–94. [DOI] [PMC free article] [PubMed] [Google Scholar]
- 9.Andorf S, Borres MP, Block Wet al. Association of clinical reactivity with sensitization to allergen components in multifood‐allergic children. J Allergy Clin Immunol Pract 2017; 5: 1325–1334.e1324. [DOI] [PMC free article] [PubMed] [Google Scholar]
- 10.Sasaki M, Koplin JJ, Dharmage SCet al. Prevalence of clinic‐defined food allergy in early adolescence: the SchoolNuts study. J Allergy Clin Immunol 2018; 141: 391–398.e394. [DOI] [PubMed] [Google Scholar]
- 11.Sasaki M, Peters RL, Koplin JJet al. Risk factors for food allergy in early adolescence: The SchoolNuts Study. J Allergy Clin Immunol Pract 2018; 6: 496–505. [DOI] [PubMed] [Google Scholar]
- 12.McWilliam VL, Koplin JJ, Field MJet al. Self‐reported adverse food reactions and anaphylaxis in the SchoolNuts study: a population‐based study of adolescents. J Allergy Clin Immunol 2018; 141: 982–990. [DOI] [PubMed] [Google Scholar]
- 13.Hoof I, Schulten V, Layhadi JAet al. Allergen‐specific IgG+ memory B cells are temporally linked to IgE memory responses. J Allergy Clin Immunol 2020; 146: 180–191. [DOI] [PMC free article] [PubMed] [Google Scholar]
- 14.Neeland MR, Martino DJ, Dang TDet al. B‐cell phenotype and function in infants with egg allergy. Allergy 2019; 74: 1022–1025. [DOI] [PubMed] [Google Scholar]
- 15.Cox KM, Commins SP, Capaldo BJet al. An integrated framework using high‐dimensional mass cytometry and fluorescent flow cytometry identifies discrete B cell subsets in patients with red meat allergy. Clin Exp Allergy 2019; 49: 615–625. [DOI] [PMC free article] [PubMed] [Google Scholar]
- 16.Hoh RA, Joshi SA, Lee JYet al. Origins and clonal convergence of gastrointestinal IgE+ B cells in human peanut allergy. Sci Immunol 2020; 5: eaay4209. [DOI] [PMC free article] [PubMed] [Google Scholar]
- 17.Braza F, Chesne J, Castagnet S, Magnan A, Brouard S. Regulatory functions of B cells in allergic diseases. Allergy 2014; 69: 1454–1463. [DOI] [PubMed] [Google Scholar]
- 18.Satitsuksanoa P, van de Veen W, Akdis M. B cells in food allergy. J Allergy Clin Immunol 2021; 147: 49–51. [DOI] [PubMed] [Google Scholar]
- 19.Martino DJ, Saffery R, Allen KJ, Prescott SL. Epigenetic modifications: mechanisms of disease and biomarkers of food allergy. Curr Opin Immunol 2016; 42: 9–15. [DOI] [PubMed] [Google Scholar]
- 20.Martino D, Dang T, Sexton‐Oates Aet al. Blood DNA methylation biomarkers predict clinical reactivity in food‐sensitized infants. J Allergy Clin Immunol 2015; 135: 1319–1328.e12. [DOI] [PubMed] [Google Scholar]
- 21.Martino D, Joo JE, Sexton‐Oates Aet al. Epigenome‐wide association study reveals longitudinally stable DNA methylation differences in CD4+ T cells from children with IgE‐mediated food allergy. Epigenetics 2014; 9: 998–1006. [DOI] [PMC free article] [PubMed] [Google Scholar]
- 22.Peng C, Van Meel ER, Cardenas Aet al. Epigenome‐wide association study reveals methylation pathways associated with childhood allergic sensitization. Epigenetics 2019; 14: 445–466. [DOI] [PMC free article] [PubMed] [Google Scholar]
- 23.Lee KH, Song Y, O'Sullivan M, Pereira G, Loh R, Zhang G. The implications of DNA methylation on food allergy. Int Arch Allergy Immunol 2017; 173: 183–192. [DOI] [PubMed] [Google Scholar]
- 24.Popovic M, Fiano V, Fasanelli Fet al. Differentially methylated DNA regions in early childhood wheezing: an epigenome‐wide study using saliva. Pediatr Allergy Immunol 2019; 30: 305–314. [DOI] [PubMed] [Google Scholar]
- 25.Gunawardhana LP, Baines KJ, Mattes J, Murphy VE, Simpson JL, Gibson PG. Differential DNA methylation profiles of infants exposed to maternal asthma during pregnancy. Pediatr Pulmonol 2014; 49: 852–862. [DOI] [PubMed] [Google Scholar]
- 26.Langie SAS, Szarc Vel Szic K, Declerck Ket al. Whole‐genome saliva and blood DNA methylation profiling in individuals with a respiratory allergy. PLoS One 2016; 11: e0151109. [DOI] [PMC free article] [PubMed] [Google Scholar]
- 27.Scharer CD, Blalock EL, Barwick BGet al. ATAC‐seq on biobanked specimens defines a unique chromatin accessibility structure in naïve SLE B cells. Sci Rep 2016; 6: 27030. [DOI] [PMC free article] [PubMed] [Google Scholar]
- 28.Martino D, Neeland M, Dang Tet al. Epigenetic dysregulation of naive CD4+ T‐cell activation genes in childhood food allergy. Nat Commun 2018; 9: 3308. [DOI] [PMC free article] [PubMed] [Google Scholar]
- 29.Ochiai K, Maienschein‐Cline M, Simonetti Get al. Transcriptional regulation of germinal center B and plasma cell fates by dynamical control of IRF4. Immunity 2013; 38: 918–929. [DOI] [PMC free article] [PubMed] [Google Scholar]
- 30.Turchinovich G, Vu TT, Frommer Fet al. Programming of marginal zone B‐cell fate by basic Kruppel‐like factor (BKLF/KLF3). Blood 2011; 117: 3780–3792. [DOI] [PubMed] [Google Scholar]
- 31.Vu TT, Gatto D, Turner Vet al. Impaired B cell development in the absence of Krüppel‐like factor 3. J Immunol 2011; 187: 5032–5042. [DOI] [PubMed] [Google Scholar]
- 32.Yu Y, Wang J, Khaled Wet al. Bcl11a is essential for lymphoid development and negatively regulates p53. J Exp Med 2012; 209: 2467–2483. [DOI] [PMC free article] [PubMed] [Google Scholar]
- 33.Wang H, Jain S, Li Pet al. Transcription factors IRF8 and PU.1 are required for follicular B cell development and BCL6‐driven germinal center responses. Proc Natl Acad Sci USA 2019; 116: 9511–9520. [DOI] [PMC free article] [PubMed] [Google Scholar]
- 34.Patterson DG, Kania AK, Zuo Z, Scharer CD, Boss JM. Epigenetic gene regulation in plasma cells. Immunol Rev 2021; 303. 10.1111/imr.12975. Online ahead of print. [DOI] [PMC free article] [PubMed] [Google Scholar]
- 35.Garciaz S, N'Guyen Dasi L, Finetti Pet al. Epigenetic down‐regulation of the HIST1 locus predicts better prognosis in acute myeloid leukemia with NPM1 mutation. Clin Epigenetics 2019; 11: 141. [DOI] [PMC free article] [PubMed] [Google Scholar]
- 36.Mzoughi S, Zhang J, Hequet Det al. PRDM15 safeguards naive pluripotency by transcriptionally regulating WNT and MAPK‐ERK signaling. Nat Genet 2017; 49: 1354–1363. [DOI] [PubMed] [Google Scholar]
- 37.Fu W, Ergun A, Lu Tet al. A multiply redundant genetic switch 'locks in' the transcriptional signature of regulatory T cells. Nat Immunol 2012; 13: 972–980. [DOI] [PMC free article] [PubMed] [Google Scholar]
- 38.Haribhai D, Lin W, Edwards Bet al. A central role for induced regulatory T cells in tolerance induction in experimental colitis. J Immunol 2009; 182: 3461–3468 [DOI] [PMC free article] [PubMed] [Google Scholar]
- 39.Elo LL, Järvenpää H, Tuomela Set al. Genome‐wide profiling of interleukin‐4 and STAT6 transcription factor regulation of human Th2 cell programming. Immunity 2010; 32: 852–862. [DOI] [PubMed] [Google Scholar]
- 40.Jung MY, Smrž D, Desai Aet al. IL‐33 induces a hyporesponsive phenotype in human and mouse mast cells. J Immunol 2013; 190: 531–538. [DOI] [PMC free article] [PubMed] [Google Scholar]
- 41.Shah N, Chari A, Scott E, Mezzi K, Usmani SZ. B‐cell maturation antigen (BCMA) in multiple myeloma: rationale for targeting and current therapeutic approaches. Leukemia 2020; 34: 985–1005. [DOI] [PMC free article] [PubMed] [Google Scholar]
- 42.Dezorella N, Katz BZ, Shapiro M, Polliack A, Perry C, Herishanu Y. SLP76 integrates into the B‐cell receptor signaling cascade in chronic lymphocytic leukemia cells and is associated with an aggressive disease course. Haematologica 2016; 101: 1553–1562. [DOI] [PMC free article] [PubMed] [Google Scholar]
- 43.Purvis GSD, Solito E, Thiemermann C. Annexin‐A1: therapeutic potential in microvascular disease. Front Immunol 2019; 10: e938. [DOI] [PMC free article] [PubMed] [Google Scholar]
- 44.Rodríguez‐Caparrós A, García V, Casal Áet al. Notch signaling controls transcription via the recruitment of RUNX1 and MYB to enhancers during T cell development. J Immunol 2019; 202: 2460–2472. [DOI] [PubMed] [Google Scholar]
- 45.Musa J, Aynaud M‐M, Mirabeau O, Delattre O, Grünewald TGP. MYBL2 (B‐Myb): a central regulator of cell proliferation, cell survival and differentiation involved in tumorigenesis. Cell Death Dis 2017; 8: e2895. [DOI] [PMC free article] [PubMed] [Google Scholar]
- 46.Hauser J, Verma‐Gaur J, Wallenius A, Grundström T. Initiation of antigen receptor‐dependent differentiation into plasma cells by calmodulin inhibition of E2A. J Immunol 2009; 183: 1179–1187. [DOI] [PubMed] [Google Scholar]
- 47.Batista CR, Li SK, Xu LS, Solomon LA, DeKoter RP. PU.1 Regulates Ig light chain transcription and rearrangement in Pre‐B cells during B cell development. J Immunol 2017; 198: 1565–1574. [DOI] [PubMed] [Google Scholar]
- 48.Karnowski A, Chevrier S, Belz GTet al. B and T cells collaborate in antiviral responses via IL‐6, IL‐21, and transcriptional activator and coactivator, Oct2 and OBF‐1. J Exp Med 2012; 209: 2049–2064. [DOI] [PMC free article] [PubMed] [Google Scholar]
- 49.Corcoran L, Emslie D, Kratina Tet al. Oct2 and Obf1 as facilitators of B: T cell collaboration during a humoral immune response. Front Immunol 2014; 5: 108. [DOI] [PMC free article] [PubMed] [Google Scholar]
- 50.Mueller K, Quandt J, Marienfeld RBet al. Octamer‐dependent transcription in T cells is mediated by NFAT and NF‐κB. Nucleic Acids Res 2013; 41: 2138–2154. [DOI] [PMC free article] [PubMed] [Google Scholar]
- 51.Arenzana TL, Smith‐Raska MR, Reizis B. Transcription factor Zfx controls BCR‐induced proliferation and survival of B lymphocytes. Blood 2009; 113: 5857–5867. [DOI] [PMC free article] [PubMed] [Google Scholar]
- 52.Giampaolo S, Wójcik G, Klein‐Hessling S, Serfling E, Patra AK. B cell development is critically dependent on NFATc1 activity. Cell Mol Immunol 2019; 16: 508–520. [DOI] [PMC free article] [PubMed] [Google Scholar]
- 53.Antony P, Petro JB, Carlesso G, Shinners NP, Lowe J, Khan WN. B‐cell antigen receptor activates transcription factors NFAT (nuclear factor of activated T‐cells) and NF‐κB (nuclear factor κB) via a mechanism that involves diacylglycerol. Biochem Soc Trans 2004; 32: 113–115. [DOI] [PubMed] [Google Scholar]
- 54.Peng SL, Gerth AJ, Ranger AM, Glimcher LH. NFATc1 and NFATc2 together control both T and B cell activation and differentiation. Immunity 2001; 14: 13–20. [DOI] [PubMed] [Google Scholar]
- 55.Peng C, Hu Q, Yang F, Zhang H, Li F, Huang C. BCL6‐mediated silencing of PD‐1 ligands in germinal center B cells maintains follicular T cell population. J Immunol 2019; 202: 704–713. [DOI] [PubMed] [Google Scholar]
- 56.Wejksza K, Lee‐Chang C, Bodogai Met al. Cancer‐produced metabolites of 5‐lipoxygenase induce tumor‐evoked regulatory B cells via peroxisome proliferator‐activated receptor α. J Immunol 2013; 190: 2575–2584. [DOI] [PMC free article] [PubMed] [Google Scholar]
- 57.Willis SN, Tellier J, Liao Yet al. Environmental sensing by mature B cells is controlled by the transcription factors PU.1 and SpiB. Nat Commun 2017; 8: 1426. [DOI] [PMC free article] [PubMed] [Google Scholar]
- 58.Li P, Spolski R, Liao Wet al. BATF‐JUN is critical for IRF4‐mediated transcription in T cells. Nature 2012; 490: 543–546. [DOI] [PMC free article] [PubMed] [Google Scholar]
- 59.Patton GC, Olsson CA, Skirbekk Vet al. Adolescence and the next generation. Nature 2018; 554: 458–466. [DOI] [PubMed] [Google Scholar]
- 60.Do AN, Watson CT, Cohain ATet al. Dual transcriptomic and epigenomic study of reaction severity in peanut‐allergic children. J Allergy Clin Immunol 2020; 145: 1219–1230. [DOI] [PMC free article] [PubMed] [Google Scholar]
- 61.Martino DJ, Bosco A, McKenna KLet al. T‐cell activation genes differentially expressed at birth in CD4+ T‐cells from children who develop IgE food allergy. Allergy 2012; 67: 191–200. [DOI] [PubMed] [Google Scholar]
- 62.Neeland MR, Andorf S, Dang TDet al. Altered immune cell profiles and impaired CD4 T‐cell activation in single and multi‐food allergic adolescents. Clin Exp Allergy 2021; 51: 674–684. [DOI] [PubMed] [Google Scholar]
- 63.Gómez‐Úriz AM, Milagro FI, Mansego MLet al. Obesity and ischemic stroke modulate the methylation levels of KCNQ1 in white blood cells. Hum Mol Genet 2014; 24: 1432–1440. [DOI] [PubMed] [Google Scholar]
- 64.Feinberg AP, Irizarry RA, Fradin Det al. Personalized epigenomic signatures that are stable over time and covary with body mass index. Sci Transl Med 2010; 2: 49ra67. [DOI] [PMC free article] [PubMed] [Google Scholar]
- 65.Wendell SG, Baffi C, Holguin F. Fatty acids, inflammation, and asthma. J Allergy Clin Immunol 2014; 133: 1255–1264. [DOI] [PMC free article] [PubMed] [Google Scholar]
- 66.Donato R, Cannon BR, Sorci Get al. Functions of S100 proteins. Curr Mol Med 2013; 13: 24–57. [PMC free article] [PubMed] [Google Scholar]
- 67.Xia C, Braunstein Z, Toomey AC, Zhong J, Rao X. S100 proteins as an important regulator of macrophage inflammation. Front Immunol 2018; 8: e1908. [DOI] [PMC free article] [PubMed] [Google Scholar]
- 68.Wright NT, Cannon BR, Zimmer DB, Weber DJ. S100A1: structure, function, and therapeutic potential. Curr Chem Biol 2009; 3: 138–145. [DOI] [PMC free article] [PubMed] [Google Scholar]
- 69.Okada M, Tokumitsu H, Kubota Y, Kobayashi R. Interaction of S100 proteins with the antiallergic drugs, olopatadine, amlexanox, and cromolyn: identification of putative drug binding sites on S100A1 protein. Biochem Biophys Res Comm 2002; 292: 1023–1030. [DOI] [PubMed] [Google Scholar]
- 70.Shishibori T, Oyama Y, Matsushita Oet al. Three distinct anti‐allergic drugs, amlexanox, cromolyn and tranilast, bind to S100A12 and S100A13 of the S100 protein family. Biochem J 1999; 338(Pt 3): 583–589. [PMC free article] [PubMed] [Google Scholar]
- 71.Howell MD, Fairchild HR, Kim BEet al. Th2 Cytokines Act on S100/A11 to Downregulate Keratinocyte Differentiation. J Invest Dermatol 2008; 128: 2248–2258. [DOI] [PubMed] [Google Scholar]
- 72.Ruella M, Barrett DM, Kenderian SSet al. Dual CD19 and CD123 targeting prevents antigen‐loss relapses after CD19‐directed immunotherapies. J Clin Invest 2016; 126: 3814–3826. [DOI] [PMC free article] [PubMed] [Google Scholar]
- 73.Parisi JDS, Corrêa MP, Gil CD. Lack of endogenous annexin A1 increases mast cell activation and exacerbates experimental atopic dermatitis. Cells 2019; 8: 51. [DOI] [PMC free article] [PubMed] [Google Scholar]
- 74.Lee S‐H, Lee P‐H, Kim B‐Get al. Annexin A1 in plasma from patients with bronchial asthma: its association with lung function. BMC Pulm Med 2018; 18: 1. [DOI] [PMC free article] [PubMed] [Google Scholar]
- 75.Hügle B, Schippers A, Fischer Net al. Transcription factor motif enrichment in whole transcriptome analysis identifies STAT4 and BCL6 as the most prominent binding motif in systemic juvenile idiopathic arthritis. Arthritis Res Ther 2018; 20: 98. [DOI] [PMC free article] [PubMed] [Google Scholar]
- 76.Chae DK, Ban E, Yoo YS, Kim EE, Baik JH, Song EJ. MIR‐27a regulates the TGF‐β signaling pathway by targeting SMAD2 and SMAD4 in lung cancer. Mol Carcinog 2017; 56: 1992–1998. [DOI] [PubMed] [Google Scholar]
- 77.Al‐Alawi M, Hassan T, Chotirmall SH. Transforming growth factor β and severe asthma: A perfect storm. Respir Med 2014; 108: 1409–1423. [DOI] [PubMed] [Google Scholar]
- 78.Schmidt‐Weber CB, Blaser K. The role of TGF‐beta in allergic inflammation. Immunol Allergy Clin North Am 2006; 26: 233–244, vi–vii. [DOI] [PubMed] [Google Scholar]
- 79.Palomares O, Martín‐Fontecha M, Lauener Ret al. Regulatory T cells and immune regulation of allergic diseases: roles of IL‐10 and TGF‐β. Genes Immun 2014; 15: 511–520. [DOI] [PubMed] [Google Scholar]
- 80.Mi Y, Shi Z, Li J. Spata19 is critical for sperm mitochondrial function and male fertility. Mol Reprod Dev 2015; 82: 907–913. [DOI] [PubMed] [Google Scholar]
- 81.Manterola M, Brown TM, Oh MY, Garyn C, Gonzalez BJ, Wolgemuth DJ. BRDT is an essential epigenetic regulator for proper chromatin organization, silencing of sex chromosomes and crossover formation in male meiosis. PLoS Genet 2018; 14: e1007209. [DOI] [PMC free article] [PubMed] [Google Scholar]
- 82.Imran S, Neeland MR, Shepherd Ret al. A potential role for epigenetically mediated trained immunity in food allergy. iScience 2020; 23: 101171. [DOI] [PMC free article] [PubMed] [Google Scholar]
- 83.Neeland MR, Koplin JJ, Dang TDet al. Early life innate immune signatures of persistent food allergy. J Allerg Clin Immunol 2018; 142: 857–864.e853. [DOI] [PubMed] [Google Scholar]
- 84.Pidsley R, Zotenko E, Peters TJet al. Critical evaluation of the Illumina MethylationEPIC BeadChip microarray for whole‐genome DNA methylation profiling. Genome Biol 2016; 17: 208. [DOI] [PMC free article] [PubMed] [Google Scholar]
- 85.Fortin J‐P, Triche TJ Jr, Hansen KD. Preprocessing, normalization and integration of the Illumina HumanMethylationEPIC array with minfi. Bioinformatics 2016; 33: 558–560. [DOI] [PMC free article] [PubMed] [Google Scholar]
- 86.Phipson B, Maksimovic J, Oshlack A. missMethyl: an R package for analyzing data from Illumina's HumanMethylation450 platform. Bioinformatics 2016; 32: 286–288. [DOI] [PubMed] [Google Scholar]
- 87.Maksimovic J, Gordon L, Oshlack A. SWAN: subset‐quantile within array normalization for illumina infinium HumanMethylation450 BeadChips. Genome Biol 2012; 13: R44. [DOI] [PMC free article] [PubMed] [Google Scholar]
- 88.Ritchie ME, Phipson B, Wu Det al. limma powers differential expression analyses for RNA‐sequencing and microarray studies. Nucleic Acids Res 2015; 43: e47. [DOI] [PMC free article] [PubMed] [Google Scholar]
- 89.Peters TJ, Buckley MJ, Statham ALet al. De novo identification of differentially methylated regions in the human genome. Epigenetics Chromatin 2015; 8: 6. [DOI] [PMC free article] [PubMed] [Google Scholar]
- 90.Quinlan AR, Hall IM. BEDTools: a flexible suite of utilities for comparing genomic features. Bioinformatics 2010; 26: 841–842. [DOI] [PMC free article] [PubMed] [Google Scholar]
- 91.McLean CY, Bristor D, Hiller Met al. GREAT improves functional interpretation of cis‐regulatory regions. Nat Biotechnol 2010; 28: 495–501. [DOI] [PMC free article] [PubMed] [Google Scholar]
- 92.Howe E, Holton K, Nair S, Schlauch D, Sinha R, Quackenbush J. MeV: MultiExperiment viewer. In Ochs MF, Casagrande JT, Davuluri RV eds. Biomedical Informatics for Cancer Research. 2010: 267–277.
- 93.Langmead B, Trapnell C, Pop M, Salzberg SL. Ultrafast and memory‐efficient alignment of short DNA sequences to the human genome. Genome Biol 2009; 10: R25. [DOI] [PMC free article] [PubMed] [Google Scholar]
- 94.Turro E, Su SY, Goncalves A, Coin LJ, Richardson S, Lewin A. Haplotype and isoform specific expression estimation using multi‐mapping RNA‐seq reads. Genome Biol 2011; 12: R13. [DOI] [PMC free article] [PubMed] [Google Scholar]
- 95.Anders S, Huber W. Differential expression analysis for sequence count data. Genome Biol 2010; 11: R106. [DOI] [PMC free article] [PubMed] [Google Scholar]
- 96.Heinz S, Benner C, Spann Net al. Simple combinations of lineage‐determining transcription factors prime cis‐regulatory elements required for macrophage and B cell identities. Mol Cell 2010; 38: 576–589. [DOI] [PMC free article] [PubMed] [Google Scholar]
Associated Data
This section collects any data citations, data availability statements, or supplementary materials included in this article.
Supplementary Materials
Supplementary figure 1
Supplementary figure 2
Supplementary figure 3
Supplementary figure 4
Supplementary figure 5
Supplementary figure 6
Supplementary table 1
Supplementary table 2
Supplementary table 3
Supplementary table 4
Supplementary table 5
Supplementary table 6
Supplementary table 7
Supplementary table 8
Supplementary table 9
Supplementary table 10