Abstract
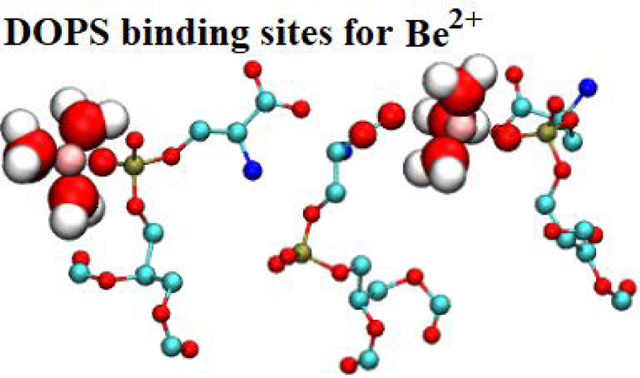
Beryllium has multiple industrial applications, but exposure to its dust during manufacturing is associated with developing chronic inflammation in lungs known as berylliosis. Besides binding to specific alleles of MHC-II, Be2+ was recently found to compete with Ca2+ for binding sites on phosphatidylserine-containing membranes and inhibit recognition of this lipid by phagocytes. Computational studies of possible molecular targets for this small toxic dication are impeded by the absence of a reliable force filed. This study introduces parameters for Be2+ for the CHARMM36 (C36) additive force field that represent interactions with water, including free energy of hydration and ion-monohydrate interaction energy and separation distance; and interaction parameters describing Be2+ affinity for divalent ion binding sites on lipids, namely phosphoryl and carboxylate oxygens. Results from isothermal titration calorimetry (ITC) experiments for the binding affinities of Be2+ to dimethyl phosphate and acetate ions reveal that Be2+ strongly binds to phosphoryl groups. Revised interaction parameters for Be2+ with these types of oxygens reproduce experimental affinities in solution simulations. Surface tensions calculated from simulations of DOPS monolayers with varied concentrations of Be2+ are compared with prior results from Langmuir monolayer experiments, verifying the compacting effect that produces greater surface tensions (lower pressures) for Be2+-bound monolayers at the same surface area in comparison with K+. The new parameters will enable simulations that should reveal the mechanism of Be2+ interference with molecular recognition and signaling processes.
Graphical Abstract
1. Introduction
Polyvalent ions coordinated by biological macromolecules play multiple functional roles. While permanently associated ions are typically involved in catalysis,1 weaker and more transient associations of divalent ions (primarily Ca2+) with proteins and lipids play critical roles in reversible cell adhesion,2 blood clotting, normal and pathological calcification3 as well as intra- and extracellular recognition and signaling reactions.4 Toxicity of some polyvalent ions has been linked to their ability to interfere with calcium-dependent processes. Cadmium ions (Cd2+), for instance, are known to interfere with mechanisms involving Ca2+-calmodulin,5 whereas accumulating Cu2+ can promote undesirable misfolding and aggregation of proteins.6, 7 Toxic pro-inflammatory effects of Be2+ are proposed to be mediated not only by abnormal binding to specific MHC-II alleles,8, 9 but also by its ability to outcompete Ca2+ on the surface of phosphatidylserine domains and thus negatively affect recognition of this signaling lipid by macrophages removing apoptotic cells in a non-inflammatory way.10 The use of molecular dynamics simulations for studies of these events is often ineffective due to either imprecision or absence of force field parameters that would predict realistic affinities, ionic competition, and ion coordination by specific chemical groups.
Interactions of divalent ions with polar electronegative groups present a challenge in molecular dynamics simulations because in pairwise additive non-polarizable force fields, electrostatic interactions are effectively magnified at close range by the inability of atomic electron densities to adjust to the ambient electric field. Salt solutions therefore can be simulated in two regimes: near infinite dilution, in which ionic interactions are shielded, and high concentrations in which close-range interactions are common and can result in unnatural clustering.11–13 Special adjustments are required to correct for overbinding artifacts.
The parameters of the Lennard-Jones (LJ) potential for individual ions in additive force fields are developed to reproduce experimental data in dilute solutions. Interaction potentials describing cation-anion pair interactions and ionic interactions with polar species can be adjusted for atoms of species i and j by changing of the position of the LJ well minimum, described by the parameter . For example, it has been shown that in sodium acetate solutions of more than 1 M concentration, Na+ and acetate over-bind unless is increased.12 Because ions are more concentrated near a charged surface, they are prone to over-bind to charged lipid headgroups in bilayer and monolayer simulations. The artifacts are more severe when the simulated systems contain ions with strong interaction potentials, such as divalent ions especially with small atomic radii.
While not present in large quantities in biological systems, Be2+ has received recent attention for its ability to displace Ca2+ from binding sites in phosphatidylserine (PS).10 While both divalent ions (Ca2+ and Be2+) interact strongly with PS, the smaller atomic radius of Be2+ allows it to outcompete Ca2+ and bind with greater affinity to DOPS liposomes (with equilibrium binding constants 𝐾eq~3∙104 M−1 for Ca2+ and ~3∙105 M−1 for Be2+).10 The smaller size of the Be2+ ion also stipulates a small coordination number (n=4)14 which prevents this ion from adequately substituting Ca2+ in physiological reactions between proteins and lipids.1 Adsorption of Be2+ to PS-containing domains on the surface of apoptotic cells may prevent normal phagocytosis, causing necrotic inflammation and possibly contributing to berylliosis, a chronic inflammation of the lungs associated with exposure to Be2+ dust.10, 15
With the goal of investigating Be2+ binding to PS and its cognate receptors using all-atom molecular dynamics, in this iterative study we first find LJ parameters to describe the interaction of Be2+ with water. Ab initio data for ion-monohydrate interactions is considered, as well as solution properties including free energy of hydration , coordination number, and radial distribution function g(r) peak position. Isothermal titration calorimetry (ITC) experiments are then used to characterize the association of Be2+ with model substances emulating ion-binding groups in PS. Solutions of sodium acetate or dimethyl phosphate (DMP) are titrated into Be(SO4)2 solutions. Resulting binding parameters are used to fit LJ interaction parameters between Be2+ and the free carboxylate and phosphate oxygens, yielding improved agreement with experimental free energy of binding.
The interaction parameters between Be2+ and phosphoryl and carboxylate oxygens are then used in DOPS monolayer simulations. Surface pressures of DOPS monolayers, found from Langmuir experiments, are dependent on salt species and concentration. Relative to Ca2+, which has a larger atomic radius, Be2+ has a stronger compacting effect on DOPS monolayers in these experiments.10 Revised interaction parameters for Be2+ with phosphoryl and carboxylate oxygens reproduce experimental surface tensions for DOPS monolayers, verifying the trend of compaction of the monolayer in the presence of Be2+ relative to K+. This study validates ITC as means to perform consistent parametrization of ion-lipid interactions in molecular dynamics force fields.
2. Methods
2.1. ITC experiments.
Solutions of BeSO4, dimethyl phosphate (C2H7O4P, DMP), or sodium acetate (NaCH3COO, NaAc) were prepared in 10 mM KCl buffered with 2 mM Tris-HCl (pH 7.3) as a background electrolyte. Titrations were carried out on a MicroCal VP-ITC microcalorimeter at 30°C using injections of 10–15 μl separated by 200–300 s time intervals. To avoid subtracting large enthalpies associated with dilution of a divalent ion, solutions containing the small molecule were the titrants and the solutions containing Be2+ were in the chamber initially in all experiments. 4 mM DMP or 20 mM NaAc were titrated into a 2 or 5 mM BeSO4 solution for DMP or NaAc experiments, respectively. Fitting of the integrated thermograms was done with MicroCal Origin software’s one-site fitting routine16 to extract a single binding constant for each reaction. For each experimental setup, a control was performed in which the titrant was injected into pure buffer and the resulting energy subtracted before fitting was performed. Each experiment was repeated three times, and error estimates were calculated from the standard error among trials.
2.2. Molecular dynamics simulations and free energy calculations.
Standard C36 parameters were used for DOPS and DMP.17 These can be found in the C36 lipid FF17 files. Two sets of parameters were tested for acetate. The first is the standard model for soluble acetate found in the CHARMM CGEN force field files,18 referred to hereafter as “acetate, CGEN FF.” Because partial charge assignments for this model differ from those in the DOPS model, a new model for soluble acetate was developed that uses lipid atom types and partial charges similar to those of DOPS, hereafter referred to as “acetate, lipid FF.” Only interaction parameters developed for the lipid FF were tested in DOPS monolayer simulations. See supplemental information appendix S1 for partial charges of both models and additional parameters.
The TIP3P water model19 as modified20 for CHARMM was used as the solvent. For solution simulations requiring counterions, revised Na+ ion LJ interaction parameters for oxygen atoms occurring in carboxylate, carboxylate ester, and phosphate ester groups were employed.12
Simulations of Be2+ in solution with the desired small molecule were used to observe and count common configurations. Be2+-small molecule pairs simulated include: Be2+ with DMP and Be2+ with acetate. Each system contained 60 small molecules, 20 divalent ions, 20 Na+ ions to keep the system electroneutral and between 12,500 and 13,500 water molecules. Simulations of Be2+ with acetate were run for 40 ns, and of Be2+ with DMP for 330 ns, at 303.15 K in the constant number, pressure, and temperature (NPT) ensemble for comparison with ITC data. Equilibration of the systems, determined by stability of the divalent ion/oxygen pair correlation functions, occurred by 30 and 5 ns for the Be2+-acetate systems with default and adjusted parameters, respectively; and by 40 and 165 ns for the Be2+-phosphate systems with default and adjusted parameters, respectively. Only equilibrated segments of trajectories were used to compute configuration probabilities. See supplemental information Figs. S1, S2, and S3 for plots demonstrating stability of the pair correlation functions for systems with revised interaction parameters.
Simulations of aqueous BeCl2 to obtain the radial distribution functions g(r) and evaluate coordination numbers and g(r) peak positions were run at 298.15 K and contained between 570 and 580 TIP3P waters, 55 Be2+, and 110 Cl− distributed using random replacement. Resulting 5.3-molal solutions matched the concentration of a comparison X-ray scattering experiment used to generate the total g(r).21 In the present study, two 30-ns simulations from different starting configurations were run at standard temperature and pressure, with the last 10 ns evaluated and error computed from the standard error in measurements from the two simulations.
Simulations of pure DOPS monolayers contained 40 lipids/leaflet, 40 divalent ions or 80 K+ ions, and 50 waters/lipid. Initial configurations were assembled using the CHARMM-GUI Membrane Builder,22–25 which splits a single bilayer into two oppositely-oriented leaflets separated by water. Two replicates each of DOPS monolayers with Be2+ or K+ at 65.3 and 71.6 Å2/lipid were run for 150 ns in NAMD26 using the constant number, volume, and temperature (NVT) ensemble to simulate the Langmuir trough experiment, with T = 295.15 K for comparison with experimental results.10 After 30-ns equilibration, monolayer surface tensions (γm), and residence times and pair correlation functions g(r) of Be2+ with phosphate, carboxylate, and water oxygens were computed from 30 – 150 ns. To compute γm, pressure output was saved every 1,000 steps.
All solution ion-small molecule simulations and monolayer simulations were run in NAMD26 with a 2-fs timestep using the C36 force field17 with modifications to Lennard-Jones (LJ) parameters for Be2+ and LJ interaction parameters between Be2+ and the deprotonated oxygen of each PS component molecule. A LJ force-switching function was used (10 to 12 Å) to modulate the LJ potential at the cutoff. Long-range electrostatic interactions were evaluated with the Particle mesh Ewald (PME) method.27 Temperature was held constant by Langevin dynamics with a weak coupling constant of 1 ps−1 in NAMD. Pressure was maintained in constant number, pressure, and temperature (NPT) simulations by a NoséHoover-Langevin piston28, 29 at 1 bar.
All pair correlation functions g(r) were computed from trajectories using the program Visual Molecular Dynamics (VMD).30 Plots of g(r) were normalized in VMD unless indicated otherwise. If not normalized, the raw histogram data was plotted for comparison of relative g(r) peak heights of different species pairs.
2.3. Free energy calculations.
Free energy perturbation (FEP) simulations were used to calculate the free energy of hydration of Be2+, and the free energy of binding between Be2+ and small molecules in a given configuration , according to the protocol developed by Deng and Roux.31, 32 The repulsive term, due to its sharp dependence on separation distance, cannot be accurately treated with a linear perturbation. Instead, a soft-core potential is used. It is found in multiple stages with a staging parameter s. The staging parameter s is set to 0.0, 0.2, 0.3, 0.4, 0.5, 0.6, 0.7, 0.8, 0.9, and 1.0. For the electrostatic term, the coupling parameter λ was increased from [0,1] in increments of 0.05, with a 0.1 window size, such that half of each window overlaps the previous window. The free energies from simulations using these different staging or coupling parameters are summed.
To calculate , a Be2+ ion in a vacuum was simulated for the initial stage of the FEP thermodynamic cycle, and in the aqueous phase for the final stage. When calculating free energies of hydration of highly charged species, the potential arising from crossing the liquid-vacuum interface, called the Galvani potential, is expected to contribute significantly:32–34
| [1] |
Here, is the thermodynamic work required to move an ion from the vacuum state into the interior of pure water, and is the work needed to cross the liquid-vacuum interface; z is the ion’s charge, F is Faraday’s constant, and is the Galvani potential of the liquid, which has been calculated to be −0.51 V for TIP3P at standard temperature and pressure.33 Thus, values reported for of Be2+ include (calculated from FEP simulations) and a correction of −11.76 kcal/mol to account for the Galvani potential.
To calculate for a given configuration, Be2+ in the aqueous phase was simulated for the initial stage, and in an appropriate binding configuration for the final stage. Standard errors between free energies calculated from at least three separate thermodynamic cycles are reported. Initial coordinates of the bound configurations for calculating were taken from the equilibrated solution simulations used to count probabilities. Water boxes were pre-equilibrated and contained between 350 and 380 waters. Production simulations of 2 ns for each staging or attenuation parameter were run using the CHARMM program35 in the NPT ensemble with a timestep of 2 fs. Temperature was held constant with the Hoover thermostat36 and the pressure maintained by the Nosé-Hoover piston.37, 38
2.4. Fitting Lennard-Jones parameters for Be2+ in water.
This study introduces CHARMM LJ parameters for Be2+ based on the structure and energetics of the ion’s interactions with water. Target experimental data for the interaction of Be2+ with bulk water included the free energy of hydration,39 coordination number,14 and peak position of the radial distribution function, g(r).21 Additionally, ab initio data of ion-monohydrate binding energy and a derivative molecular mechanics model predicting the ion-monohydrate separation distance40 were used as target data for ion-monohydrate interaction.
Following the FEP protocol of Deng and Roux,31 LJ parameters for Be2+ were varied and the free energy of hydration in TIP3P water was calculated. The ion-monohydrate interaction energy and separation distance were also calculated using CHARMM directives.35 CHARMM LJ parameters ε and rmin were varied along a grid, with and monohydrate interactions calculated for values of ε varied from [−0.0115, −0.0006] in increments of 5 × 10⁻⁵ and rmin varied from [0.2, 1.3] in increments of 0.1. The parameter set that minimized error in all three measurements was chosen.
The chosen ε, rmin pair was then used to find the peak position of g(r) and coordination number of a 5.3-molal aqueous solution of BeCl2. The coordination number can be found by integrating over the first peak of the radial distribution function of Be2+:
| [2] |
The integral is computed from a separation distance r = 0 to r = r1, where r1 is the minimum after the first peak of g(r). Results for ncoor and g(r) peak position were in satisfactory agreement with experiment.
2.5. Adjusting LJ interaction parameters to fit experimental .
FEP was used to obtain the association energy of each observed configuration from bulk solution simulations of divalent ions with PS components described previously. The total free energy of the reaction, , was calculated from the probability (pc) and free energy of each binding configuration:
| [3] |
is related to the equilibrium binding constant of the reaction from ITC by:
| [4] |
where k is Boltzmann’s constant and T is the temperature. In this way, we compared calculated from simulation with the found from ITC, and adjusted simulation parameters iteratively until from simulation was in satisfactory agreement with the experimental value.
In the CHARMM force field, interaction energy between nonbonded pairs is the sum of the Columbic and Lennard-Jones (LJ) contributions:
| [5] |
The first sum on the right-hand side of Eq. [5] accounts for LJ interactions, and the second for Columbic interactions. rij is the distance between atoms i and j, ϵ is the dielectric constant of the media, and qi is the partial atomic charge of the ith atom. Energies depend on the LJ interaction parameters and , given by:
| [6] |
| [7] |
Use of these combining rules implies lack of empirical, interaction-specific parameterization for a given pair of atom types. In the case of highly charged species, the parameters are doubly significant because they affect pair separation and therefore the strength of Coulomb interactions. Additionally, lack of atomic polarizability tends to augment ionic interactions at close range. Historically, pair-specific interactions have been adjusted by increasing .41 The value of can be supplied for a specific atom pair using the “NBFIX” directive in CHARMM or NAMD.
Values of were varied for each Be2+/small molecule pair until from simulation reached satisfactory agreement with the value found from ITC binding experiments. Interacting atom pairs and values of tested for each pair can be found in supplemental information Table S1.
Because DMP and acetate each present Be2+ with a single binding site at biological pH,42 solution configurations of these molecules were defined as the number of associated small molecules per Be2+ ion (NSM). Probabilities of configurations with 0, 1, 2, 3, or 4 associated small molecules (NSM = 0, 1, 2, 3, or 4) were counted using the integral of the pair correlation function from Be2+/small molecule simulations. For example, it was observed that before adjusting LJ interaction parameters, Be2+ could take two possible configurations in association with DMP: It could associate with 2 or 3 molecules of DMP. The g(r) of Be2+ with the deprotonated oxygen of DMP (Odp) was used to count probabilities of bound configurations.
The number of binding events per Be2+ ion, , is associated with the integral of the pair correlation function:
| [8] |
Here, is the pair correlation function of the separation distance between Be2+ and is the average number of Odp associating with a single Be2+ ion. The average binding distance is the position of the first peak of , and the integral is computed over the first peak.
From , the probability of each divalent ion associating with 0, 1, 2, 3, or 4 PS component molecules can be calculated by solving a system of linear equations. The system of equations chosen depends on the possible values of NSM. The sum of all configuration probabilities equals 1:
| [9] |
Here, pi is the probability of a divalent ion associating with i small molecules. To avoid double-counting of free divalent ions, p0 was included with p1 when calculating , because dissociation was observed in FEP simulations where NSM = 1 and p0 > 1. Configurations with probabilities less than 0.02 were neglected. Systems of equations used to find configuration probabilities before and after adjustment of can be found in Table 1.
Table 1.
Systems of linear equations used to evaluate configuration probabilities for Be2+ ion interactions with small ligands.*
| Small Molecule | N SM | System of Equations | |
|---|---|---|---|
| DMP | Lipid FF | 3, 2 | |
| Adjusted | 2, 1 | ||
| Acetate | CGEN FF | 4, 3 | |
| Adjusted | 1, 0 | ||
| Lipid FF** | 3, 2 | ||
| Adjusted | 1, 0 |
NSM = number of associated molecules; = number of associated free oxygens; pi = probability of associating with i small molecules.
New soluble acetate model for Lipid FF. See supplemental information appendix S1.
2.6. Analyzing DOPS monolayer trajectories.
Interfacial tensions (γm) are calculated from simulation using the diagonal elements of the pressure tensor:43
| [10] |
Here, Lz is the size of the simulation box normal to the interface, Pzz is the normal component of the pressure tensor, and Pxx and Pyy are the tangential components. The prefactor of 0.5 is needed to account for the presence of two water-lipid interfaces in the simulation box. For comparison, γm can be calculated from experimental surface pressures (π) by subtracting π from the surface tension of pure water .44 At dyn/cm.45 Error in γm from simulation was estimated from the standard deviation of samples computed over 1-ns blocks.
Residence times of divalent ions at DOPS monolayer binding sites were computed from 30 – 120 ns using the CHARMM program35 and standard errors were computed. From the residence times, expected occupancies were also computed using CHARMM, here defined as the expected number of associations with interacting DOPS oxygen a given time (can be greater than 1). Be2+ and ODP are considered to associate if they are found within association distance rcut, which is 2.1 and 2.5 Å for phosphate and acetate oxygens, respectively, for Be2+; and within 3.4 Å for both species with K+. Water bridging associations were analyzed using the CHARMM directive “ncoor hbond” with “cuthb” set to 2.5 Å between associating species and TIP3P water residues.
3. Results
3.1. ITC results.
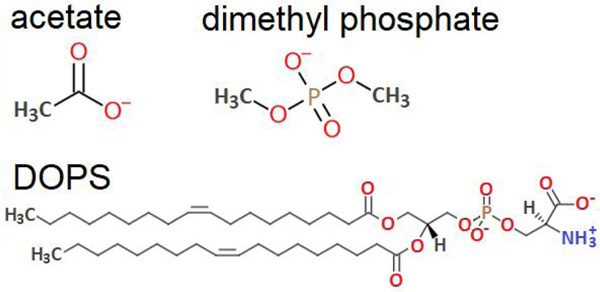
Two possible coordinating atoms for Be2+ in the surface-exposed headgroup of PS are the phosphoryl oxygen (above the glycerol-ester linkage) and the carboxylate oxygen (headgroup terminal). Acetate and DMP, shown in Fig. 1, were chosen as model compounds as they carry the same types of cation-coordinating oxygen atoms. DOPS, used in monolayer simulations, is also shown in Fig. 1.
Figure 1. Structures of acetate, dimethyl phosphate, and DOPS.
DOPS with denoted positions of electronegative ion-binding atoms; and structures of small molecules, acetate and dimethyl phosphate, carrying similar types of oxygens and representing separate ion-binding components of PS.
Be2+ is known to interact strongly with phosphate oxygen,46 which is here assumed to prevent Be2+ from penetrating to the carbonyl oxygens located deeper along the bilayer normal. Monolayer simulations (discussed in Sec. 3.4) corroborate this assumption; Be2+ was not seen to interact with ester carbonyls due to strong coordination by phosphate oxygens.
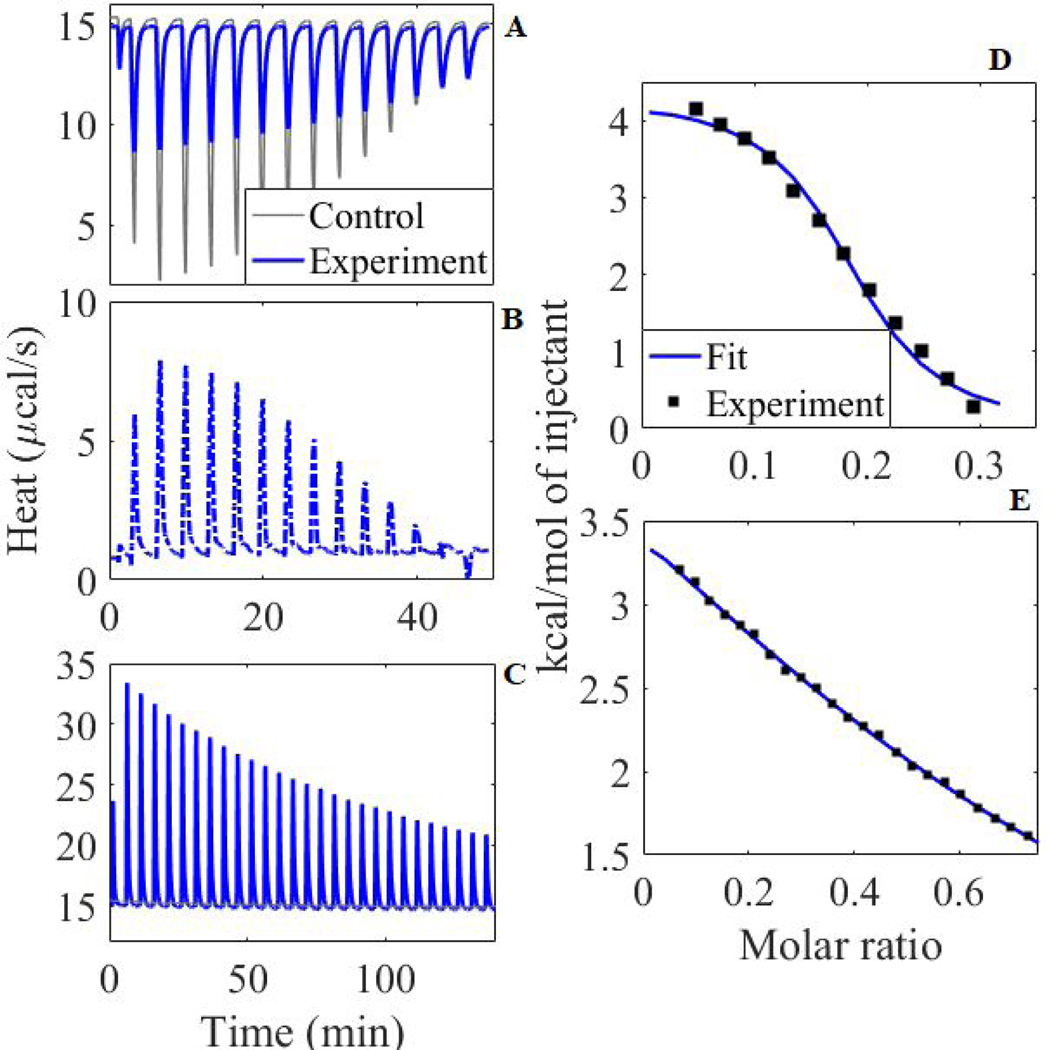
Results in Table 2 indicate that Be2+ binds to DMP with moderate affinity (Kd~2 uM), and with much weaker affinity to acetate (Kd~3 mM). is negative and ΔH positive, indicating entropically-driven reactions, likely due to liberation of water when ions are dehydrated. The control titrations shown in Fig. 2A and C indicate a large heat of dilution for aqueous DMP, but not for acetate. Subtracting the heat of dilution of DMP reverses the sign of ΔH for DMP + Be2+ from negative to positive at the experimental pH, temperature, and concentration levels (Fig. 2B). Strong association with phosphate comports with a known property of Be2+; above pH 3, Be2+ precipitates in phosphate buffer, even in the presence of chelating ligands such as DHBA.46
Table 2.
Thermodynamic Parameters of Binding Obtained from ITC Experiments
| Reaction |
(1/M) |
ΔH
(cal/mol) |
N | S (cal/mol/°C) |
|---|---|---|---|---|
|
| ||||
| Be2+ + DMP | 48050 ± 8800 | 4530 ± 193 | 0.19 ± 0.03 | 36.43 ± 0.26 |
| Be2+ + Acetate | 320 ± 15 | 5946 ± 130 | 0.82 ± 0.02 | 31.03 ± 0.32 |
Figure 2. Titration Results.
Raw titration data for Be2+ into DMP solution (A), with control subtracted (B), and into acetate solution (C); integrated heat for Be2+ into DMP solution (D) and acetate solution (E). In integrated heat plots, molar ratio is shown for small molecule/Be2+ in cell, and control was subtracted from integrated heat. Control in (C) is present but not visible at around 15 kcal/mol.
See supplemental information Figs. S4 and S5 for plots of the raw ITC data from all experiments, including three replicates each of Be2+ interacting with DMP and acetate.
Fig. 2D and E show the fit to the integrated heat of a single trial each of DMP and acetate titration. It is likely that full saturation was not reached in these experiments due to limitations inherent in the systems. This may cause systematic errors in estimates of ΔH or n not reflected in the standard errors in these measurements. The slopes of each fit are clearly defined indicating accurate measure of the rate of change of heat with respect to relative concentration. To assure accurate calculation of , neither ΔH nor n were fixed during fitting. From these reliably converging fits the parameter is extracted.16
3.2. CHARMM LJ parameters for Be2+ interactions with water.
Following the iterative procedure described in Sec. 2.4, in which Be2+ with various values of the LJ parameters and was evaluated for energetic and structural interactions with water, LJ parameters were chosen which yielded satisfactory agreement with all observables. Final LJ parameters for Be2+ are ; kcal/mol. The binding radius is lower in magnitude than other ions47 in the CHARMM FF, reflecting the great binding capacity of this small divalent ion. The next-smallest binding radius of 1.18 belongs to Mg2+. The energy well is shallower than that of Li+, which has εi = −0.0023 kcaol/mol,32, 48 and considerably shallower than that of the larger Ca2+ (εi = −0.12 kcal/mol).49 The shallower LJ energy well contributes to beryllium’s low coordination number (n=4).
Be2+ solution and monohydrate results are listed in Table 3. Final Be2+ LJ parameters yield improved agreement with experimental properties of 5.3-molal BeCl2 solutions, with a g(r) peak position of 1.55 Å and a coordination of 3.94, both within 10 % of experimental values (1.66 Å and 4, respectively14, 21). underestimates experiment by 9 % at 298.15 K (in magnitude). This is because energetic and structural properties were found to be at odds. For example, use of a lower rmin parameter for Be2+ would bring in closer agreement with experiment, but also decrease the g(r) peak position.
Table 3.
Be2+ Interactions with Bulk Water
| Simulation | Target Result from Exp. or QM | Difference | |
|---|---|---|---|
| Exp.14, 21, 39 | |||
|
(kcal/mol) |
−522.0 ± 0.3 | −572 | 8.7 % |
|
g(r) Peak Position* (Å) |
1.55 | 1.66 – 1.67 | −6.60 % |
| Coordination Number * | 3.94 ± 0.08 | 4 QM model results40 |
−1.6 % |
|
Monohydrate Energy
(kcal/mol) |
−131.9 | −139.4, −146.1 | 9.3 % |
|
Monohydrate Separation
(Å) |
1.37 | 1.51 Å | −9.27 % |
5.3 molal aqueous BeCl2 at 298.15 K.
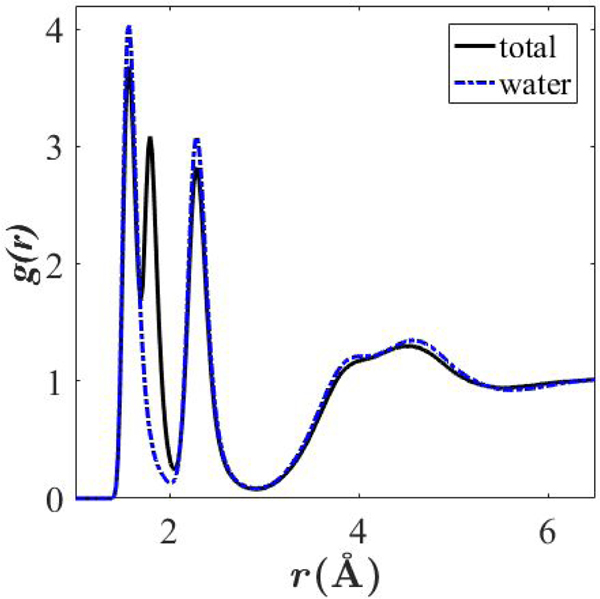
Fig. 3 plots g(r) for Be2+ in a 5.3-molal solution of BeCl2. The pair correlation function between Be2+ and water differs from the total g(r) (between Be2+ and water/Cl−) in that it has a distinct secondary peak attributable to Be2+- Cl− interactions. In the experimental study by Yamaguchi et al,21 g(r) between Be2+ and Cl− is not deduced from experiment, but the authors note a decrease in Cl− coordination by water oxygen in the presence of Be2+, indicating association of the two ionic species at this concentration.
Figure 3. Radial distribution functions for 5.3-molal BeCl solution.
Total radial distribution function for Be2+ (black; Be2+ with water and Cl−) and pair correlation function for Be2+ with water (blue).
QM results for ion-monohydrate interaction energy and separation distance, listed in Table 3, are borrowed from a study by Yang et al.40 The ion-monohydrate separation distance was computed with the atom bond electronegativity equalization method fused with molecular mechanics (ABEEM/MM). ABEEM and van der Waals parameters were fit to the interaction energies. As with solution properties, simulation results from the present study are within 10 % deviation from expected values. Final LJ parameters represent a compromise between accurate interaction energy and separation distance.
3.3. Divalent ion/small molecule interactions and simulation parameters.
With the LJ parameters fit to water interactions, Be2+ showed significant overbinding to both DMP and acetate. This is an expected result from a nonpolarizable FF, in which close-range ionic interactions are not modulated by adjustment of effective atomic dipole moments.
Increasing the interaction parameter between Be2+ and interacting oxygens was sufficient to decrease binding probability and bring within 10 % deviation from ITC results. Table 4 lists the adjusted interaction parameters. For all atom type pairs, the default value was 2.51 (ε = − 0.12 kcal/mol and = 1.7 Å for all three oxygen types). The lipid FF required a lesser increase in than the CGEN FF, likely due to the reduced magnitude of charge assigned to OCL relative to OG2D2 (−0.67 and 0.76, respectively). Full charge distributions for both models can be found in supplemental information Appendix S1.
Table 4.
Final [Å] Interaction Parameters with Be2+.
| Atom Type | Small Molecule | |
|---|---|---|
| O2L | phosphoryl, DMP | 2.92 |
| OG2D2 | carboxylate, CGEN FF | 3.20 |
| OCL | carboxylate, Lipid FF | 3.07 |
Table 5 compares configuration states and probabilities before and after adjustment of . It also gives the integration of the pair correlation function , from which the numbers of associated molecules, NSM, are computed. Because configurations are counted by the number of DMP or acetate ions bound to a single Be2+ atom, clustering is not reflected. Solution simulations with the original LJ parameters did exhibit clustering, but simulations with the adjusted parameters did not.
Table 5.
Configuration States and Probabilities.
| Small Molecule | N SM | Pi | ||
|---|---|---|---|---|
| DMP | Lipid FF | 3.1 | 4, 3 | 0.10, 0.90 |
| Adjusted | 1.31 | 2, 1 | 0.31, 0.69 | |
| Acetate | CGEN FF | 3.5 | 4, 3 | 0.50, 0.50 |
| Adjusted | 0.53 | 1, 0 | 0.53, 0.47 | |
| Lipid FF* | 2.93 | 3, 2 | 0.93, 0.07 | |
| Adjusted | 0.37 | 1, 0 | 0.37, 0.63 |
New soluble acetate model for Lipid FF. See supplemental information Appendix S1.
Table 6 compares resulting with experiment and shows the extent of overbinding when parameters fit to water interactions are used. Interestingly, Be2+ binds more tightly to carboxylate than phosphate with the original values ( is more negative), but both interactions are grossly overestimated. This is significant because, in DOPS bilayers and monolayers, carboxylate sits at the water-lipid interface and encounters solvated Be2+ before phosphate. Overbinding to carboxylates could prevent Be2+ from penetrating deep enough into the headgroup region to bind with phosphate. Final parameters yield that agrees with experiment for Be2+ and acetate and slightly overestimates binding affinity with the phosphate oxygen.
Table 6.
ΔGr from Experiment and Simulation.
| Small Molecule | Original (kcal/mol) |
Final Fit (kcal/mol) |
Exp. (kcal/mol) |
Error, Fit/Exp. |
|---|---|---|---|---|
| DMP Lipid FF |
2.51/−56.6 ± 0.8 | 2.92/−7.09 ± 0.45 | −6.49 ± 0.12 | −9.5 % |
|
| ||||
| Acetate CGEN FF |
2.51/ −72.9 ± 1.5 |
3.20/ −3.38 ± 0.31 |
−3.47 ± 0.03 | −2.6 % |
|
|
||||
| Lipid FF* | 2.51/ −54.3 ± 0.8 |
3.07/ −3.76 ± 0.44 |
−3.47 ± 0.03 | −7.8 % |
New soluble acetate model for Lipid FF. See supplemental information appendix S1.
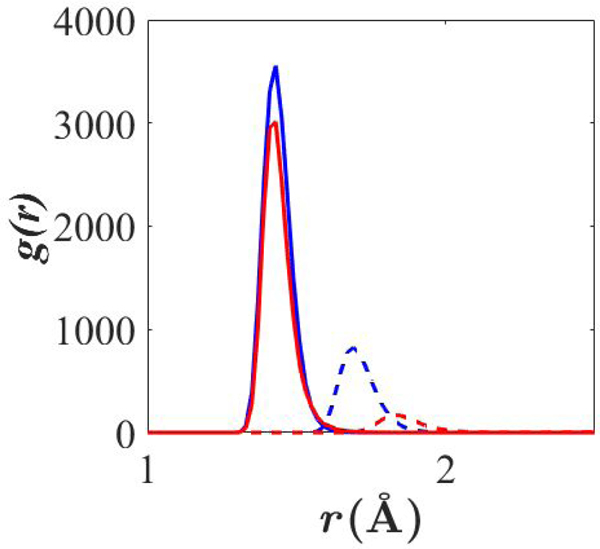
Fig. 4 compares before and after adjustment of lipid FF parameters. Note the adjustment of the LJ interaction parameters increased the separation distance between bound Be2+ and Odp, and decreased the height of the first peak of , both indicating weaker binding after adjustment of the LJ interaction parameters. Additionally, are very similar before parameter adjustment; the curves overlap but DMP peak is slightly higher. Coordination number, determined by integration of the first peak of g(r), is greater for DMP than acetate after adjustment, and coordination is tighter, as can be seen from the closer g(r) peak position.
Figure 4. between Be2+ and free deprotonated oxygens.
Blue: DMP. Red: acetate. Solid: initial . Dashed: final . Lipid FF parameters used.
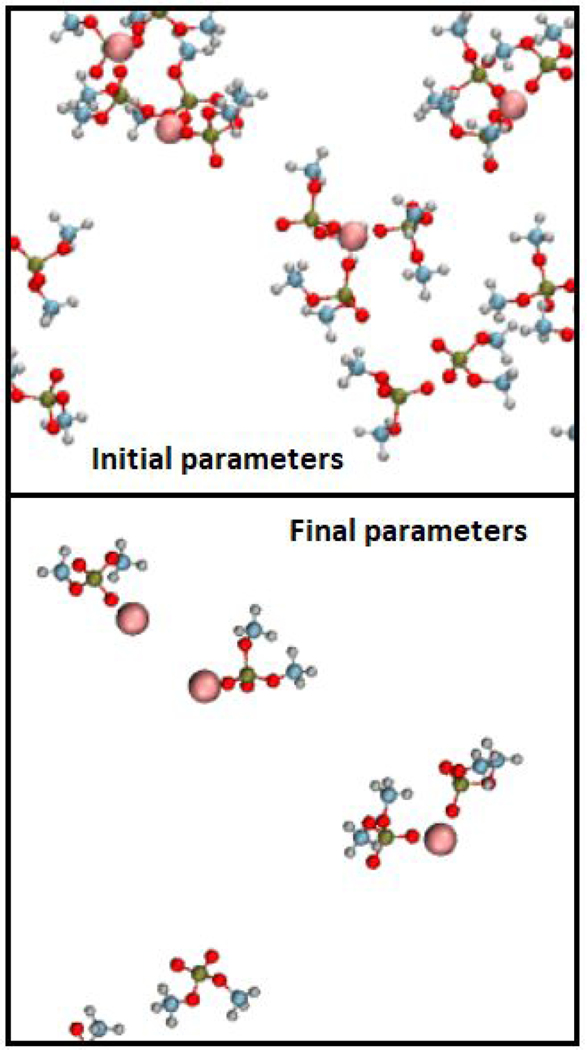
Fig. 5 shows sample configurations of Be2+ in solution with DMP (lipid FF), and similar shots with acetate (lipid FF) can be found in supplemental information Fig. S6. In both figures, water and Na+ ions are present but not shown. Default parameters show extensive clustering with DMP, but the resulting Δ𝐺r is too favorable, indicating these configurations are not realistic. Less clustering is seen with default acetate interaction parameters. In both DMP and acetate systems, adjustment of reduces clustering.
Figure 5. Be2+ in solution with DMP.
Default (top) and adjusted (bottom) LJ interaction parameters. Colors: Be2+, pink; O, red; C, blue; H, gray; P, gold. Water and Na+ ions not shown.
3.4. DOPS monolayer surface tensions and Be2+ coordination.
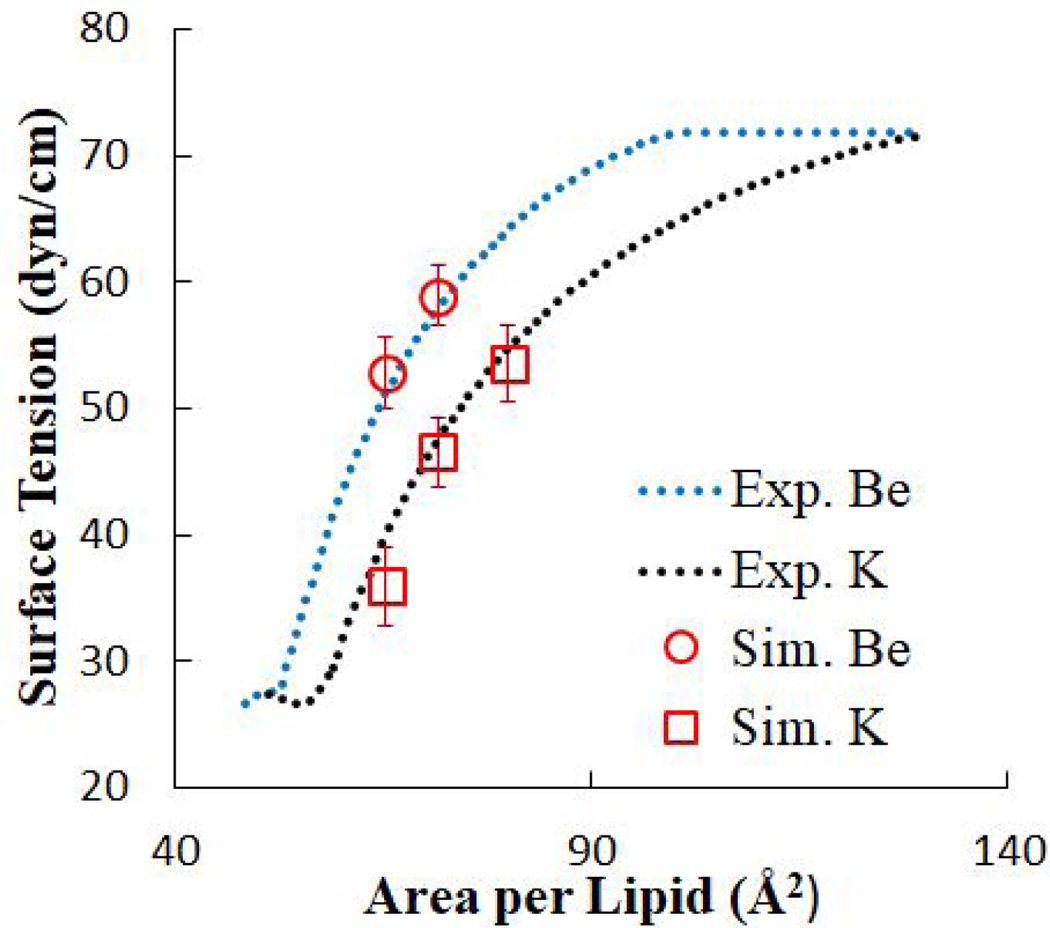
Surface tensions of DOPS monolayers (γm) calculated from simulation agree with experiment for both Be2+ with adjusted interaction parameters and K+. A sample time series of γm for a DOPS monolayer with bound Be2+ and Al = 65.3 Å2/lipid can be found in supplemental information Fig. S7. Al = 65.3 Å2/lipid is of interest because it is the experimental Al for DOPS membranes at 303.15 K.50 γm for the sample trajectory fluctuates between 40 and 70 dyn/cm, with a mean of 52.8 dyn/cm calculated from 30 to 150 ns.
As has been demonstrated experimentally,10 γm and Al are directly related along a pressure-area isotherm; γm is higher at greater Al. Fig. 6 plots the experimental data (provided by Ermakov et al.10) for DOPS monolayers in solutions of 1 mM Be2+ or K+. In the Langmuir experiments, the subphase solution contained 10 mM KCl as a background electrolyte and buffered with 2 mM Tris-HCl (pH 7.3). DOPS monolayers with Be2+ exhibit a greater γm than with K+. At equal γm, DOPS monolayers in the presence of Be2+ have a lesser Al, indicating that Be2+ has a compacting effect on the monolayer. This can be attributed to both strong ionic interactions with the divalent ion and the smaller radius of Be2+ relative to K+. While not as strong as direct ion-oxygen associations, our findings also indicate that Be2+ is able to associate with phosphoryl and carboxylate oxygens through water bridging (see below).
Figure 6. DOPS surface tension isotherms from Langmuir monolayer experiments and simulation.
Bulk ion concentration in experiment: 1mM.10
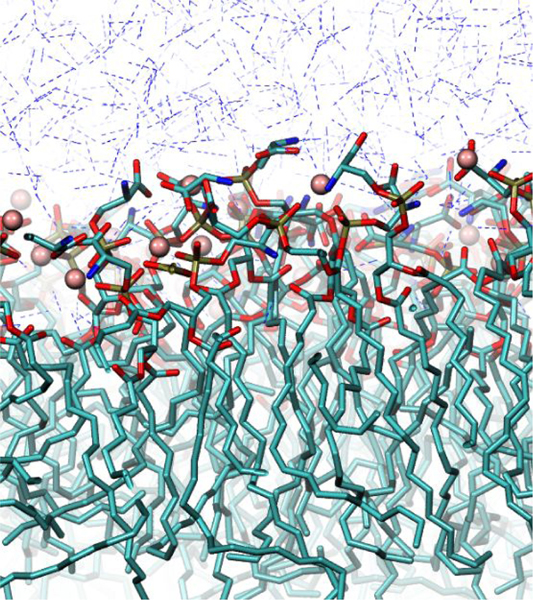
Table 7 compares simulation results for γm, calculated using Eq. [10], with experimental results.10 Because experimental concentrations were too low to match with the simulation box size used, enough ions were added to equilibrate the system (40 Be2+ and 80 K+). In Be2+-DOPS systems, Be2+ saturated the monolayer and, due to long residence times, dissociated infrequently. The bulk concentration of Be2+ in these simulations therefore accurately represents the experimental concentration, in which Be2+ freely saturated the DOPS monolayers and existed in solution in concentrations too low to simulate. Experimental values for γm at 65.3 and 71.6 Å2/lipid are reproduced in simulation using the adjusted interaction parameters. A snapshot for the distribution of Be2+ in an equilibrated monolayer simulation can be seen in Fig. 7.
Table 7.
DOPS monolayer surface tensions. Units of dyn/cm.
Figure 7. DOPS monolayer with bound Be2+.
Al = 65.3 Å2. Be2+: pink sphere, C: teal licorice, O, red licorice, P:, gold licorice, N: blue licorice, water: blue dashed.
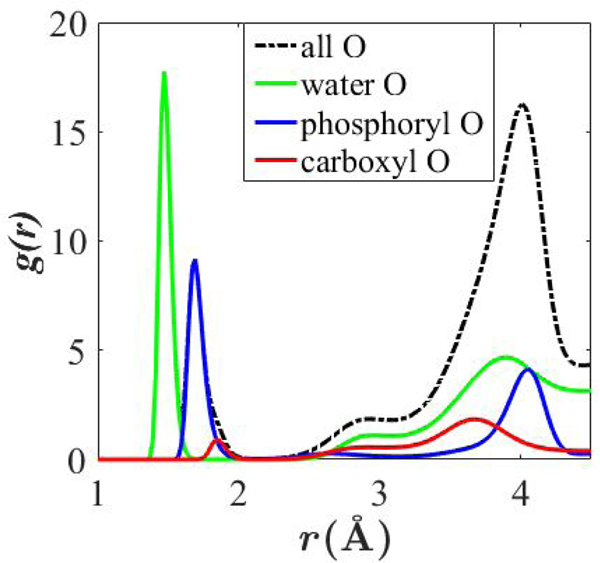
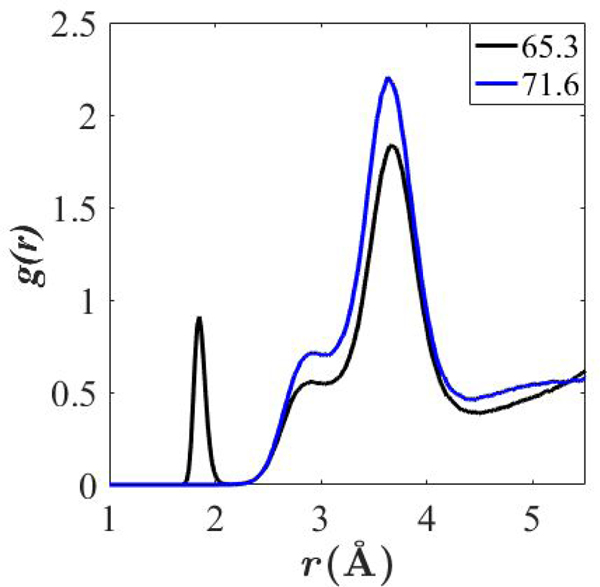
Fig. 8 compares pair correlation functions g(r) for Be2+ with various oxygens in DOPS monolayer simulations at 65.3 Å2/lipid. The carboxylate peak below 2 Å is too small to be visible in g(r) for all oxygens (black line), but the phosphate peak is clearly visible. From g(r) for all oxygens, it is evident that more associations occur with water oxygens than with phosphate oxygens (the integral of this peak is greater). Supplemental information Fig. S8 compares g(r) between K+ and oxygen species.
Figure 8.
Pair correlation functions of Be2+ with various oxygens. Al = 65.3 Å2/lipid. For comparison, g(r) are not normalized.
Preferential association with phosphate relative to acetate is not seen in K+ simulations, although K+ has not been specifically parameterized for these interactions. Solubility data of acetate and phosphate salts indicate that phosphate associates more strongly with ions in general, and with potassium in particular: Potassium acetate is about 17 times as soluble as potassium dihydrogen phosphate at standard temperature and pressure.51 Additionally, the bond dissociation energy of potassium from trimethyl phosphate as determined by threshold collision-induced dissociation (CID) is similar to that of potassium with acetone and greater than with methanol (135, 140, and 92 kcal/mol, respectively).52 Dissociation energies reveal that sodium binds more favorably to trimethyl phosphate than both acetone and methanol (171, 145, and 111 kcal/mol, respectively). Therefore, even fully methylated phosphate associates strongly with ions in solution, with equal or greater affinity than acetate binding sites. However, specific binding affinities of potassium with acetate and dimethyl phosphate are not known.
While g(r) for Be2+ with lipid and water oxygens is similar at 71.6 and 65.3 Å2/lipid, there is one notable difference: The more condensed monolayer shows close association with carboxylates, as can be seen from the pair correlation function of Be2+ with carboxylate oxygens in Fig. 9. The g(r) for the condensed monolayer has a sharp first peak at 1.85 Å, which is lacking in the monolayer with 71.6 Å2/lipid. Both monolayers have secondary peak around 3.5 Å due to the proximity of the carboxylate oxygens to phosphate oxygens, which sit an average of 3.5 Å apart in these simulations.
Figure 9. Pair correlation functions of Be2+ with DOPS carboxylate oxygens.
Averaged over last 60 ns of trajectory for DOPS monolayer simulations with 65.3 and 71.6 Å2/lipid. Al = 65.3 Å2/lipid. For consistency with Fig. 8, g(r) are not normalized.
Tables 8 and 9 quantify the associations between Be2+ or K+ and various oxygens in DOPS monolayer simulations. Ion-oxygen associations in Table 8, computed from pair correlation functions, confirm that Be2+ only associates with carboxylate oxygen in the more condensed monolayer (65.3 Å2/lipid). As would be expected, Be2+ associated with more lipid oxygens overall at 65.3 than at 71.6 Å2/lipid; 1.84 and 1.64 associations, respectively. Each K+ ion associates with about 1 lipid oxygen, and some K+ is solvated. Table 9 lists the average oxygen-ion residence times and occupancies computed from time series of bond distances. For example, the 0. 42 expected occupancy for phosphoryl oxygen and Be2+ signifies that a given phosphoryl oxygen will coordinate an average of 0.42 Be2+ ions at a given time. While the residence time for Be2+ associations with phosphoryl oxygens in DOPS monolayers is significant (about 1/4 of the trajectory length used in the calculation), dissociations do occur. The residence time for associations with carboxylate oxygens, which only occur at higher Al, is much shorter. This is expected given the greater magnitude of between Be2+ and phosphoryl oxygen found from ITC experiments. Residence times for K+ associations are three orders of magnitude smaller than those for Be2+-phosphate interactions and are similar for phosphoryl and carboxylate oxygens. K+ expected occupancies are higher with carboxylate than phosphoryl oxygen, but parameterization of the relevant interaction parameters for potassium is needed to infer physical significance of this difference.
Table 8.
Ion-oxygen associations in DOPS monolayer simulations.
| Phosphate | Carboxylate | Water | Total | |
|---|---|---|---|---|
|
Be2+
|
||||
| 65.3 Å2/lipid | 1.69 | 0.15 | 2.22 | 4.05 |
| 71.6 Å2/lipid | 1.64 | 0.00 | 2.35 | 4.00 |
|
K+
|
||||
| 65.3 Å2/lipid | 0.34 | 0.75 | 5.67 | 6.76 |
| 71.6 Å2/lipid | 0.27 | 0.70 | 5.89 | 6.86 |
Table 9. Residence times and expected occupancy for various oxygen-ion associations in DOPS monolayer simulations.
Computed from 30 – 120 ns. Associations through water bridging included only for Be2+. (Residence times are given in ps or ns timescale.)
| 65.3 Å2/lipid | 71.6 Å2/lipid | |||||||
|---|---|---|---|---|---|---|---|---|
| Phosphoryl | Phosphoryl + water | Carboxylate | Carboxylate + water | Phosphoryl | Phosphoryl + water | Carboxylate | Carboxylate + water | |
| Be2+ | ||||||||
| Residence time | 23.7 ± 1.2 ns | 14.3 ± 0.4 ps | 4.4 ± 0.5 ns | 21.7 ± 0.7 ps | 18.2 ± 1.0 ns | 14.7 ± 0.3 ps | None | 21.0 ± 0.8 ps |
| Occupancy | 0.42 | 0.14 | 0.04 | 0.53 | 0.40 | 0.13 | None | 0.55 |
| K+ | ||||||||
| Residence time | 22.8 ± 0.6 ps | - | 30.5 ± 0.1 ps | - | 21.0 ± 0.4 ps | - | 27.7 ± 0.2 ps | - |
| Occupancy | 0.18 | - | 0.39 | - | 0.14 | - | 0.36 | - |
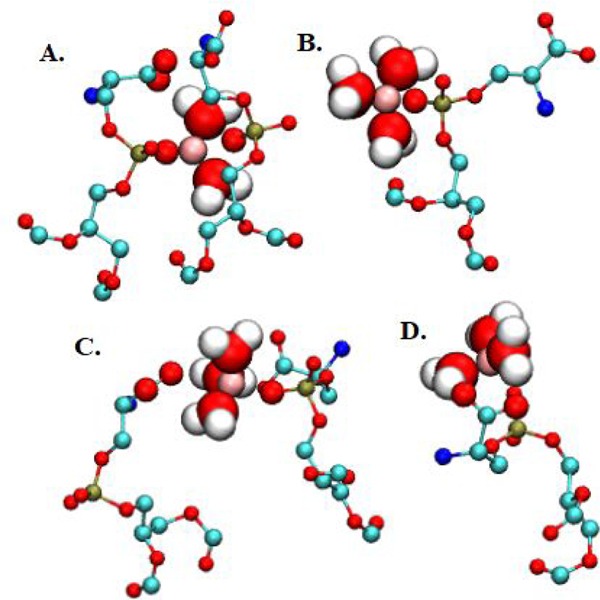
Supplemental informationFig. S9 is a histogram of residence times for Be2+-phosphate associations with Al = 65.3 Å, disregarding association times < 20 ps. Binding events can be separated into three regimes by duration of association. Twenty-one associations endured for the length of trajectory analyzed (90 ns), and another large group dissociated in less than 20 ns. A third regime of 15 associations were stable, but not as long, lasting between 20 and 60 ns. The total number of associations is 67, 1.67 times the number of Be2+ ions in the simulation. Adding associations in the middle regime and the group that did not dissociate yields 21 + 15 = 36, nearly the number of Be2+ ions in the simulation. Thus, each Be2+ ion is coordinating an average of one or two lipids, and while some of these associations are weak, most Be2+ ions tightly coordinate a single phosphoryl oxygen. Fig. 10 shows sample Be2+-ion coordination by DOPS headgroups and snapshot bond distances.
Figure 10. Common Be2+ binding configurations in DOPS monolayers.
DOPS headgroups and Be2+ shown. Snapshot bond lengths (Å) in parentheses. A. Be2+ (pink sphere) coordinating 2 phosphate oxygens (1.68 and 2.7) and 2 water oxygens (avg. 1.48). B. Coordinating 1 phosphate oxygen (1.75) and 3 waters (avg. 1.51). C. Coordinating 1 acetate oxygen (2.5), 1 phosphate oxygen (1.77), and 3 waters (avg. 1.78). D. Water bridge with acetate (3.4 between Be2+ and acetate O; 2.0 between acetate O and water H; 1.5 between Be2+ and water O). Colors: C: teal licorice, O, red licorice, P:, gold licorice, N: blue licorice, water: red dashed interior. Al = 65.3 Å2.
Where Be2+ associates with water, it can form water bridges with both phosphoryl and carboxylate oxygens. Table 9 reports bridging residence times and expected occupancies (“+ water” columns). Decreased association times (ps rather than ns scale) for bridging events indicate the expected weakness of bridged hydrogen bonding relative to direct associations. Bridging between Be2+ and carboxylate oxygens was more common than with phosphoryl oxygens. This is because direct association between Be2+ and phosphoryl oxygen positions carboxylate oxygen at an appropriate distance for a bridging event. Fig. 10D. shows an example configuration of Be2+ directly coordinating phosphoryl oxygen and coordinating carboxylate oxygen through a water bridge. Bridging events were not significantly influenced by Al.
4. Discussion and Conclusions
Previous attempts to parametrize cation interactions with coordinating groups for MD simulations were focusing primarily on ion solvation by water.47, 53 More recently, a study by Lou and Roux41 used osmotic pressure results for sodium and potassium chloride solutions at concentrations from 1 to 5 M to obtain the relevant parameters. This range of concentrations is a factor of 10 greater than physiologically relevant concentrations and the question how well these parameters represent diluted solutions remains.
In this study, we first adjusted LJ parameters for Be2+ interactions with water to reflect the known free energy of ion solvation.21, 39, 54 We then performed ITC titrations of Be2+ with small molecules representing components of PS to determine the free energies of ion interaction with phosphoryl and carboxylate oxygens separately. The results indicate strong association with phosphate oxygen in solution, and considerably weaker association with carboxylates. While previous work12, 13, 41, 55 has relied on osmotic pressure data to find appropriate values for interaction parameters between ion-oxygen pairs, the goal of this study is to observe effects of ion binding (close interactions), of which ITC data is a more direct measure. Osmotic pressure experiments always characterize ionic interactions in fairly concentrated solutions and for this reason may overlook dominant modes for binding which occur in a lower concentration range.
Results reported by Venable et al.12 indicate that interaction parameters for Na+ and K+ ions based on osmotic pressure data are reasonably transferable to simulations of anionic lipid bilayers with these ions. They found that use of osmotic pressure data to correct sodium and potassium overbinding to carboxylates in palmitoyloleoyl phosphatidylserine (POPS) membranes did reduce deuterium order parameters of the palmitate chains, brining results in closer agreement NMR results. However, they consider interactions of lower affinity. In our case, experimental affinities of Be2+ for anionic phospholipids are in the micromolar range, which is most suitable for ITC56, which is also capable of detecting more than one type of binding sites characterized with different affinities.
LJ parameters for Be2+ improve agreement with solution and monohydrate properties obtained from experiment and QM, including free energy of hydration, coordination number, and ion-monohydrate separation distance and interaction energy. While agreement in all measurements is within 10%, structural and energetic results are at odds, indicating the need for a more complex force field to describe solubility of this strongly-interacting ion. A study by Yang and Li40 used QM calculations of ionic interactions with 1 – 7 water molecules to develop LJ parameters for Be2+, Mg2+, and Ca2+ to accompany their seven-site flexible water model with fluctuating charges. While results for Be2+ interaction energies and separation distances agreed well with QM results, the hydration shell for Be2+ was larger than expected in solution (5.8 water molecules), causing the authors to echo the conclusion that Be2+ requires a more complex treatment of nonbonded potential. Azam et al.57 obtain accurate first hydration shell bond averages and coordination numbers using QM charge field molecular dynamics (QMCF/MD) to model a single hydrated Be2+ ion. QMCF/MD utilizes a partitioning scheme in which the system is divided into two parts. The chemically most relevant region, in this case the ion and first and second hydration shells, are treated by ab initio quantum mechanics. The remaining part of the system evolves under an empirical potential. This is computationally expensive relative to all-atom MD and restricts the focus of the simulation to the immediate vicinity of a particular reaction. The authors do not report solution energetics.
Use of the new Be2+ LJ parameters (given in Sec. 3.2) in solution simulations with components of PS result in overbinding to both acetate and dimethyl phosphate, causing clustering. The CGEN FF model for soluble acetate18 exhibits the most overbinding to Be2+ before parameter adjustment, binding even more tightly than to DMP. The carboxylate model based on the lipid FF, which carries a lesser partial charge on the free oxygen (−0.67 rather than −0.76), still exhibits overbinding. Adjustment of the LJ interaction parameter sufficiently reduces binding to all small molecules in solution.
This aspect was not taken into account in a recent study of Be2+-PS interactions. To study Be2+-PS interactions with the C36 FF, Ermakov et al.10 approximated LJ parameters for Be2+ by borrowing from εi Ca2+ (εi = − 0.12, more negative than the present results derived empirically) and setting = 0.35 Å based on experimental Be-O bond distances. The resulting “small calcium” (smallCa2+) yielded the expected coordination number (4), but interaction energies with PS coordinating groups were not considered individually. SmallCa2+ was seen to coordinate both carboxylate and phosphate oxygens when Be2+ was added to simulations of DOPS bilayers in the presence of sodium chloride. As with the present study, dissociations were infrequent, and smallCa2+ was rarely found free in solution at this concentration. The present study shows that coordination of PS binding sites is heavily dependent on interaction parameters. Adjustment of to reflect stronger binding to phosphate oxygens results in pronounced preference for binding to phosphoryl over carboxylate oxygens.
Pair correlation functions directly reflect association probabilities and together with free energy calculations provide a statistical accounting for the free energy of binding in solution. The free energies of Be2+ interaction with water and dimethyl phosphate in solution are similar; free energy of hydration is - 572 kcal/mol,39 and binding to dimethyl phosphate is −6.49 kcal/mol more favorable. Parameterization of Be2+-oxygen interactions is therefore a fine-tuning of two reactions with similar affinities, hydration and binding in solution. We found that even in a saturated solution, a single Be2+ ion associates with only one or two dimethyl phosphate molecules and maintains associations with water. Associations with acetate in solution are considerably weaker. A Be2+ ion may associate with a single acetate molecule, and dissociations are frequent. Final LJ interaction parameters describing Be2+-phosphate and -acetate binding agree well with the equilibrium constants for these reactions found from ITC experiments.
Analysis of K+ associations with DOPS oxygens indicate it binds preferentially to carboxylate over phosphoryl oxygens. However, K+ has not been specifically parameterized for associations with acetate and dimethyl phosphate. Solubility data51 and dissociation energies52 indicate K+ may bind with greater affinity to phosphoryl oxygens in solution. This would corroborate the present results for Be2+, which associates much more strongly with dimethyl phosphate than acetate. Fine tuning the force field for K+ with lipids may be needed but is not the focus of this work.
Surface tensions of DOPS monolayers, recorded in Langmuir experiments, are dependent on salt species and concentration in the subphase. Relative to Ca2+, which has a larger atomic radius, and to monovalent K+, Be2+ has a compacting effect on DOPS monolayers in these experiments.10 Revised interaction parameters for Be2+ with phosphate and carboxylate oxygens reproduce experimental surface tensions for DOPS monolayers and show compaction relative to monolayers equilibrated with K+. In these simulations, Be2+ preferentially associates with phosphate oxygens and maintains associations with water, which penetrates the monolayer. While some associations between Be2+ and carboxylates are present in simulations with 65.3 Å2/lipid (equivalent to experimental Al at 303.15 K)50, less condensed monolayers (71.6 Å2/lipid) show no associations with carboxylates.
The new parameters for Be2+ developed in this study open possibilities of realistic visualization of multiple biochemical processes where we expect interference of this small dication underlying its toxicity. This includes competition between Ca2+ and Be2+ at the surface of phosphatidylserine-containing membranes and domains, Be2+ interference with phosphatidylserine recognition by its receptors on macrophages, components of coagulation cascade, and Ca2+-dependent membrane fusion machinery. A few more steps will be required for full parametrization of this cation for simulations with proteins.
Supplementary Material
Acknowledgements
We thank Richard Pastor for helpful theoretical discussion, Richard Venable for technical advice, and Andriy Anishkin for sharing insight from smallCa2+-DOPS simulations. This research was supported by the Intramural Research Program of the NIH, National Heart, Lung, and Blood Institute, NSF Grant MCB-1149187, and the use of the high-performance computational capabilities at the National Institutes of Health, Bethesda, MD (NHLBI LoBoS and Biowulf clusters), the Maryland Advanced Research Computing Center (MARCC), and the University of Maryland (Deepthought2, http://hpcc.umd.edu).
Footnotes
Supporting Information. Single document containing additional plots of equilibrated systems (Fig. S1 – S3 & S7), ITC results (Fig. S4 & S5), solution snapshots (Fig. S6), and analysis (Fig. S8 & S9); table of interaction parameters tested to select appropriate NBFIX values (Table S1); and description of soluble lipid acetate model (Appendix S1).
References
- 1.Nelsestuen GL; Broderius M; Martin G. Role of Gamma-Carboxyglutamic Acid. Cation Specificity of Prothrombin and Factor X-Phospholipid Binding. J. Biol. Chem 1976, 251, 6886–6893. [PubMed] [Google Scholar]
- 2.Brasch J; Harrison OJ; Honig B; Shapiro L. Thinking Outside the Cell: How Cadherins Drive Adhesion. Trends Cell. Biol 2012, 22, 299–310. [DOI] [PMC free article] [PubMed] [Google Scholar]
- 3.Willems BA; Vermeer C; Reutelingsperger CP; Schurgers LJ The Realm of Vitamin K Dependent Proteins: Shifting from Coagulation toward Calcification. Mol. Nutr. Food Res 2014, 58, 1620–1635. [DOI] [PubMed] [Google Scholar]
- 4.Lemmon MA Membrane Recognition by Phospholipid-Binding Domains. Nat. Rev. Mol. Cell Bio 2008, 9, 99–111. [DOI] [PubMed] [Google Scholar]
- 5.Choong G; Liu Y; Templeton DM Interplay of Calcium and Cadmium in Mediating Cadmium Toxicity. Chem.-Biol. Interact 2014, 211, 54–65. [DOI] [PubMed] [Google Scholar]
- 6.Liu Z; Song F; Ma Z.-l.; Xiong Q; Wang J; Guo D; Sun G. Bivalent Copper Ions Promote Fibrillar Aggregation of Kctd1 and Induce Cytotoxicity. Sci. Rep 2016, 6, 32658. [DOI] [PMC free article] [PubMed] [Google Scholar]
- 7.Tamás MJ; Fauvet B; Christen P; Goloubinoff P. Misfolding and Aggregation of Nascent Proteins: A Novel Mode of Toxic Cadmium Action in Vivo. Curr. Genet.: Microorg. Organelles 2018, 64, 177–181. [DOI] [PMC free article] [PubMed] [Google Scholar]
- 8.Bill JR; Mack DG; Falta MT; Maier LA; Sullivan AK; Joslin FG; Martin AK; Freed BM; Kotzin BL; Fontenot AP Beryllium Presentation to CD4+ T Cells Is Dependent on a Single Amino Acid Residue of the MHC Class II Beta-Chain. J. Immunol. (Baltimore) 2005, 175, 7029–7037. [DOI] [PubMed] [Google Scholar]
- 9.Martin AK; Mack DG; Falta MT; Mroz MM; Newman LS; Maier LA; Fontenot AP Beryllium-Specific CD4+ T Cells in Blood as a Biomarker of Disease Progression. J. Allergy Clin. Immun 2011, 128, 1100–1106. [DOI] [PMC free article] [PubMed] [Google Scholar]
- 10.Ermakov YA; Kamaraju K; Dunina-Brkovskaya A; Vishnyakova KS; Yegorov YE; Anishkin A; Sukharev S. High-Affinity Interactions of Beryllium(2+) with Phosphatidylserine Result in a Cross-Linking Effect Reducing Surface Recognition of the Lipid. Biophys. J 2017, 56, 5457–5470. [DOI] [PubMed] [Google Scholar]
- 11.Luo Y; Roux B t. Simulation of Osmotic Pressure in Concentrated Aqueous Salt Solutions. J. Phys. Chem. Lett 2010, 1, 183–189. [Google Scholar]
- 12.Venable RM; Luo Y; Gawrisch K; Roux B; Pastor RW Simulations of Anionic Lipid Membranes: Development of Interaction-Specific Ion Parameters and Validation Using NMR Data. J. Phys. Chem. B 2013, 117, 10183–10192. [DOI] [PMC free article] [PubMed] [Google Scholar]
- 13.Han K; Venable RM; Bryant AM; Legacy CJ; Shen R; Li H; Roux B; Gericke A; Pastor RW Graph-Theoretic Analysis of Monomethyl Phosphate Clustering in Ionic Solutions. J. Phys. Chem. B 2018, 122, 1484–1494. [DOI] [PMC free article] [PubMed] [Google Scholar]
- 14.Alei MJ; Jackson JA NMR Determination of the Hydration Number of Cations in Aqueous Percholate Solution. The Journal of Chemical Physics. 1964, 41.
- 15.Maier LA; Newman LS, Beryllium Disease, in Environmental and Occupational Medicine, Rom WN and Markowitz MH, Editors. 1998, Lippincott-Raven: Philadelphia, PA, 1017–1031. [Google Scholar]
- 16.Itc Data Analysis in Origin. Tutorial Guide, Version 7.0 in MicroCal, LLC. 2004: Northampton, MA, 1–117. [Google Scholar]
- 17.Klauda JB; Venable RM; Freites JA; O’Connor JW; Tobias DJ; Mondragon-Ramirez C; Vorobyov I; MacKerell AD Jr.; Pastor RW Update of the CHARMM All-Atom Additive Force Field for Lipids: Validation on Six Lipid Types. J. Phys. Chem. B 2010, 114, 7830–7843. [DOI] [PMC free article] [PubMed] [Google Scholar]
- 18.Vanommeslaeghe K; Hatcher E; Acharya C; Kundu S; Zhong S; Shim J; Darian E; Guvench O; Lopes P; Vorobyov I; Mackerell AD CHARMM General Force Field: A Force Field for Drug-Like Molecules Compatible with the CHARMM All-Atom Additive Biological Force Fields. J. Comput. Chem 2010, 31, 671–690. [DOI] [PMC free article] [PubMed] [Google Scholar]
- 19.Jorgensen WL; Chandrasekhar J; Madura JD; Impey RW; Klein ML Comparison of Simple Potential Functions for Simulating Liquid Water. J. Chem. Phys 1983, 79, 926–935. [Google Scholar]
- 20.Durell SR; Brooks BR; Ben-Naim A. Solvent-Induced Forces between Two Hydrophilic Groups. J. Phys. Chem.-US 1994, 98, 2198–2202. [Google Scholar]
- 21.Yamaguchi T; Ohtaki H; Spohr E; Palinkas G; Heinzinger K; Probst MM Molecular Dynamics and X-Ray Diffraction Study of Aqueous Beryllium(II) Chloride Solutions. Z. Naturforsch 1986, 41a, 1175–1185.
- 22.Jo S; Kim T; Im W. Automated Builder and Database of Protein/Membrane Complexes for Molecular Dynamics Simulations. PloS one. 2007, 2, e880. [DOI] [PMC free article] [PubMed] [Google Scholar]
- 23.Jo S; Kim T; Iyer VG; Im W. CHARMM-GUI: A Web-Based Graphical User Interface for CHARMM. J. Comput. Chem 2008, 29, 1859–1865. [DOI] [PubMed] [Google Scholar]
- 24.Jo S; Lim JB; Klauda JB; Im W. CHARMM-GUI Membrane Builder for Mixed Bilayers and Its Application to Yeast Membranes. Biophysical Journal. 2009, 97, 50–58. [DOI] [PMC free article] [PubMed] [Google Scholar]
- 25.Lee J; Cheng X; Swails JM; Yeom MS; Eastman PK; Lemkul JA; Wei S; Buckner J; Jeong JC; Qi Y; Jo S; Pande VS; Case DA; Brooks CL 3rd; MacKerell AD Jr.; Klauda JB; Im W. CHARMM-GUI Input Generator for NAMD, GROMACS, AMBER, OpenMM, and CHARMM/OpenMM Simulations Using the CHARMM36 Additive Force Field. J. Chem. Theory Comput 2016, 12, 405–413. [DOI] [PMC free article] [PubMed] [Google Scholar]
- 26.Phillips JC; Braun R; Wang W; Gumbart J; Tajkhorshid E; Villa E; Chipot C; Skeel RD; Kale L; Schulten K. Scalable Molecular Dynamics with NAMD. J. Comput. Chem 2005, 26, 1781–1802. [DOI] [PMC free article] [PubMed] [Google Scholar]
- 27.Darden T; York D; Pedersen L. Particle Mesh Ewald: An N Log N Method for Ewald Sums in Large Systems. J. Chem. Phys 1993, 98, 10089–10092. [Google Scholar]
- 28.Feller SE; Zhang YH; Pastor RW; Brooks BR Constant-Pressure Molecular-Dynamics Simulation - the Langevin Piston Method. J. Chem. Phys 1995, 103, 4613–4621. [Google Scholar]
- 29.Martyna GJ; Tobias DJ; Klein ML Constant Pressure Molecular Dynamics Algorithms. J. Chem. Phys 1994, 101, 4177–4189. [Google Scholar]
- 30.Humphrey W; Dalke A; Schulten K. VMD - Visual Molecular Dynamics. J. Mol. Graphics 1996, 14, 33–38. [DOI] [PubMed] [Google Scholar]
- 31.Deng Y; Roux B. Hydration of Amino Acid Side Chains: Nonpolar and Electrostatic Contributions Calculated from Staged Molecular Dynamics Free Energy Simulations with Explicit Water Molecules. J. Phys. Chem. B 2004, 108, 16567–16576. [Google Scholar]
- 32.Lamoureux G; Roux B. Absolute Hydration Free Energy Scale for Alkali and Halide Ions Established from Simulations with a Polarizable Force Field. J. Phys. Chem. B 2006, 110, 3308–3322. [DOI] [PubMed] [Google Scholar]
- 33.Harder E; Roux B. On the Origin of the Electrostatic Potential Difference at a Liquid-Vacuum Interface. J. Chem. Phys 2008, 129, 234706. [DOI] [PMC free article] [PubMed] [Google Scholar]
- 34.Yu H; Whitfield TW; Harder E; Lamoureux G; Vorobyov I; Anisimov VM; Mackerell AD Jr.; Roux B. Simulating Monovalent and Divalent Ions in Aqueous Solution Using a Drude Polarizable Force Field. J. Chem. Theory Comput 2010, 6, 774–786. [DOI] [PMC free article] [PubMed] [Google Scholar]
- 35.Brooks BR; Brooks CL; Mackerell AD; Nilsson L; Petrella RJ; Roux B; Won Y; Archontis G; Bartels C; Boresch S; et al. CHARMM: The Biomolecular Simulation Program. J. Comput. Chem 2009, 30, 1545–1614. [DOI] [PMC free article] [PubMed] [Google Scholar]
- 36.Hoover WG Canonical Dynamics - Equilibrium Phase-Space Distributions. Phys. Rev. A 1985, 31, 1695–1697. [DOI] [PubMed] [Google Scholar]
- 37.Nose S; Klein ML Constant Pressure Molecular Dynamics for Molecular Systems. Mol. Phys 1983, 50, 1055–1076. [Google Scholar]
- 38.Andersen HC Molecular Dynamics Simulations at Constant Pressure and/or Temperature. J. Chem. Phys 1980, 72, 2384. [Google Scholar]
- 39.Marcus Y. Thermodynamics of Solvation of Ions. J. Chem. Soc. Faraday T 1991, 87, 2995–2999. [Google Scholar]
- 40.Yang ZZ; Li X. Molecular-Dynamics Simulations of Alkaline-Earth Metal Cations in Water by Atom-Bond Electronegativity Equalization Method Fused into Molecular Mechanics. J. Chem. Phys 2005, 123, 94507. [DOI] [PubMed] [Google Scholar]
- 41.Luo Y; Roux B. Simulation of Osmotic Pressure in Concentrated Aqueous Salt Solutions. J. Phys. Chem. Lett 2010, 1, 183–189. [Google Scholar]
- 42.Smiechowski M. Theoretical Pka Prediction of O-Phosphoserine in Aqueous Solution. Chem. Phys. Lett 2010, 501, 123–129. [Google Scholar]
- 43.Klauda JB; Wu X; Pastor RW; Brooks BR Long-Range Lennard-Jones and Electrostatic Interactions in Interfaces: Application of the Isotropic Periodic Sum Method. J. Phys. Chem. B 2007, 111, 4393–4400. [DOI] [PMC free article] [PubMed] [Google Scholar]
- 44.Small DM The Physical Chemistry of Lipids : From Alkanes to Phospholipids. Handbook of Lipid Research; V. 4. Plenum Press: New York. 1986. [Google Scholar]
- 45.Weast RC, ed. Crc Handbook of Chemistry and Physics, 62nd Edition, 61st ed. ed. 1981, CRC Press: Boca Raton, Fla. [Google Scholar]
- 46.Scott BL; McCleskey TM; Chaudhary A; Hong-Geller E; Gnanakaran S. The Bioinorganic Chemistry and Associated Immunology of Chronic Beryllium Disease. Chem. Commun 2008, 2837–2847. [DOI] [PMC free article] [PubMed]
- 47.Beglov D; Roux B t. Finite Representation of an Infinite Bulk System: Solvent Boundary Potential for Computer Simulations. J. Chem. Phys 1994, 100, 9050–9063. [Google Scholar]
- 48.Noskov SY; Roux B. Control of Ion Selectivity in Leut: Two Na+ Binding Sites with Two Different Mechanisms. J. Mol. Biol 2008, 377, 804–818. [DOI] [PMC free article] [PubMed] [Google Scholar]
- 49.Marchand S; Roux B t. Molecular Dynamics Study of Calbindin D9k in the Apo and Singly and Doubly Calcium‐Loaded States. Proteins: Struct., Funct., Genet 1998, 33, 265–284. [PubMed] [Google Scholar]
- 50.Petrache HI; Tristram-Nagle S; Gawrisch K; Harries D; Parsegian VA; Nagle JF Structure and Fluctuations of Charged Phosphatidylserine Bilayers in the Absence of Salt. Biophysical journal. 2004, 86, 1574–1586. [DOI] [PMC free article] [PubMed] [Google Scholar]
- 51.Seidell A; Linke WF, Solubilities of Inorganic and Metal Organic Compounds a Compilation of Quantitative Solubility Data from the Periodical Literature. 1940, D. Van Nostrand Co.: New York. [Google Scholar]
- 52.Ruan C; Huang H; Rodgers MT A Simple Model for Metal Cation-Phosphate Interactions in Nucleic Acids in the Gas Phase: Alkali Metal Cations and Trimethyl Phosphate. J. Am. Soc. Mass Specrom 2008, 19, 305–314. [DOI] [PubMed] [Google Scholar]
- 53.Ȧqvist J. Ion-Water Interaction Potentials Derived from Free Energy Perturbation Simulations. J. Phys. Chem.-US 1990, 94, 8021–8024. [Google Scholar]
- 54.Alei MJ; Jackson JA NMR Determination of the Hydration Number of Cations in Aqueous Percholate Solution. J. Chem. Phys 1964, 41, 3402. [Google Scholar]
- 55.Luo Y; Jiang W; Yu H; MacKerell AD Jr.; Roux B. Simulation Study of Ion Pairing in Concentrated Aqueous Salt Solutions with a Polarizable Force Field. Faraday Discuss. 2013, 160, 135–149. [DOI] [PMC free article] [PubMed] [Google Scholar]
- 56.Perozzo R; Folkers G; Scapozza L. Thermodynamics of Protein-Ligand Interactions: History, Presence, and Future Aspects. J Recept. Signal Transduct. Res 2004, 24, 1–52. [DOI] [PubMed] [Google Scholar]
- 57.Azam SS; Hofer TS; Bhattacharjee A; Lim LH; Pribil AB; Randolf BR; Rode BM Beryllium(II): The Strongest Structure-Forming Ion in Water? A QMCF MD Simulation Study. J. Phys. Chem. B 2009, 113, 9289–9295. [DOI] [PubMed] [Google Scholar]
Associated Data
This section collects any data citations, data availability statements, or supplementary materials included in this article.


