

Abstract
Aims/Introduction
Studies have found that a plant‐based diet was associated with a lower risk of type 2 diabetes, but evidence is scarce on such associations in China. The aim of this study was to investigate whether a plant‐based diet is related to a lower risk of type 2 diabetes among Chinese adults.
Materials and Methods
A total of 37,985 participants were enrolled from the Henan Rural Cohort Study. An overall plant‐based diet index (PDI) was created by assigning positive and reverse scores to 12 commonly consumed food groups. Multivariate logistic regression models and restricted cubic spline analysis were performed to estimate the odds ratio (OR) and 95% confidence interval (95% CI).
Results
After multivariable adjustment, the risk of type 2 diabetes was inversely associated with the PDI (extreme‐quartile OR = 0.88, 95% CI: 0.79–0.98; P = 0.027), the risk associated with a 1 standard deviation (SD) increase in PDI was 4% lower (95% CI, 0.93–1.00; P trend = 0.043) for type 2 diabetes. Moreover, the odds of type 2 diabetes was decreased with an increment of PDI after fitting restricted cubic splines (P trend < 0.01).
Conclusions
Among Chinese populations, diets higher in plant foods and lower in animal foods were associated with a reduced risk of type 2 diabetes.
Keywords: Plant‐based diet, Rural population, Type 2 diabetes
This is the first study to evaluate the association between the plant‐based diet index (PDI) and type 2 diabetes in a Chinese rural population. In our study, a higher PDI score was associated with a lower risk of type 2 diabetes, and a 1 standard deviation (SD) increase in PDI was associated with a 4% lower risk of type 2 diabetes.
INTRODUCTION
The epidemic of type 2 diabetes poses a major threat to human health. According to the International Diabetes Federation (IDF), 1 in 11 adults aged 20–79 (463 million adults) had diabetes globally in 2019, and most of them had type 2 diabetes1. Asia is one of the main regions of the rapidly emerging global epidemic of type 2 diabetes. The reasons for the escalating epidemic of type 2 diabetes are multiple, in addition to genetic predisposition, which to some extent determines an individual’s susceptibility to type 2 diabetes, a high body mass index (BMI), unhealthy diets, sedentary lifestyles, population aging and high blood pressure are important drivers2, 3. In recent years, people have been pursuing dietary changes that make them feel good, and plant‐based diets have attracted much attention for their contribution to the prevention or management of several major chronic diseases, including type 2 diabetes, cardiovascular disease, and all‐cause mortality4, 5, 6, 7, 8. Furthermore, existing studies have shown that a plant‐based or vegetarian diet was related to a lower risk of type 2 diabetes5, 7, 9, 10, 11, 12.
Diet is an adjustable lifestyle factor associated with a variety of diseases, people generally do not consume a single food, especially in China with a diverse diet, and considering some unknown ingredients and nutrients in foods and possible interactions, it may be better to describe the effects of diet on health in terms of overall dietary patterns. Previously established dietary patterns, such as the Alternative Healthy Eating Index (AHEI), the Alternative Mediterranean diet (AMED), and Dietary Approach to Stop Hypertension (DASH), were basically a comprehensive review of foods and nutrients, while a plant‐based diet focused only on the quality of food intake, so it more directly reflects the impact of food intake on health. In addition, we think that recommendations based on gradual changes in diet are more likely to be accepted than direct changes in diet patterns.
A plant‐based diet has relevance to a lower risk of type 2 diabetes, according to a recent meta‐analysis12, however, the study was based mainly on the findings of western studies, with only two research studies from Asian populations in Singapore and Taiwan9, 10. Given the differences in food and lifestyle between Asia and the West, it seems unreasonable to generalize the results directly to other races. Hence, in this study, we examined whether a diet of more plant‐based foods is associated with a lower risk of type 2 diabetes in a Chinese rural population.
MATERIALS AND METHODS
Study participants
The ongoing population‐based Henan Rural Cohort Study commenced in July 2015, the design of which has been reported previously13. Briefly, 39,259 Chinese men and women aged 18–79 years were included in the cohort between July 2015 and September 2017. Information related to sociodemographics, lifestyle factors, and medical history were collected using validated questionnaires at recruitment. We excluded participants who left blank at least one food item on the questionnaire, and those with implausible energy intake (< 600 or > 3500 kcal/day for women and < 800 or > 4200 kcal/day for men). Finally, a total of 37,985 participants were included in the analytic sample. The study protocol was approved by the Zhengzhou University Life Science Ethics Committee (Code: [2015] MEC (S128)). All participants provided informed consent.
Dietary assessment
Dietary data were collected using a validated, semi‐quantitative food frequency questionnaire (FFQ), which consisted of 13 major food groups (staple foods, livestock, poultry, fish, eggs, dairy, fruits, vegetables, beans, nuts, pickles, cereal, and animal oil). To calculate the average daily intake of each food group, participants were asked to report the frequency (never, day, week, month, year) and the amount (kilograms, grams) of their consumption in the past 12 months. Then the response was converted into the average daily intake by dividing the intake amount of the individual group by their frequency. A validation study has demonstrated the reliability of the food frequency questionnaire14.
The overall plant‐based diet index (PDI) was calculated based on the remaining 12 food groups except for animal oil (considering that only a small proportion of our subjects consumed it). Food groups were ranked into quartiles according to their average daily intake, and given positive or negative scores. For plant‐based foods, individuals in the highest stratum were scored 4, the second highest quartile 3, and so on, and those in the lowest quartile scored 1. The order of scores for the animal‐based food groups was reversed, with participants within the highest quartile receiving a score of 1, followed by those within the second highest quartile scored 2, ending with those in the lowest quartile assigned a score of 4. The scores of the 12 food groups were then summed for each participant to obtain the index, ranging from 12 to 48. A higher index represents better adherence.
Assessment of covariates
Information on the gender, age, education, socioeconomic status, disease history, medication history, family history of disease, tobacco smoking, alcohol drinking, and physical activity, were obtained through in‐person interviews by trained study staff via structured questionnaires. The education level was categorized into primary school or below, junior high school, and senior high school or above. Three levels of socioeconomic status were categorized as the family’s per capita monthly income (< 500, 500–1000, ≥ 1000 yuan [RMB]). Participants who had smoked at least one cigarette a day for the past 6 months were classified as current smokers. For alcohol consumption, current drinkers are thought to be those who reported drinking at least 12 times per year, whether beer, spirit, wine, or other types of alcoholic beverages. According to International Physical Activity Questionnaire (IPAQ)15, the intensity of physical activity was categorized as low, medium, and high. Height and weight measurements were accurate to 0.1 cm and 0.1 kg, respectively, and the BMI was calculated as the weight divided by the square of height (kg/m2). After resting in a sitting position for at least 5 minutes, the subjects’ systolic blood pressure (SBP) and diastolic blood pressure (DBP) were measured using an electronic sphygmomanometer at 30 second intervals and repeated three times, and the mean value of the three records was applied to the statistical analysis. Hypertension was considered if one or more of the following conditions occurred: (1) SBP ≥ 140 mmHg; (2) DBP ≥ 90 mmHg; (3) use of antihypertensive medication within the past 2 weeks.
Diabetes assessment
According to the diagnostic criteria of the American Diabetes Association (ADA)16, participants were defined as having type 2 diabetes if their fasting glucose concentration was ≥ 7.0 mmol/L (126 mg/dL) or participants reported having previously been diagnosed with type 2 diabetes and/or the use of insulin or blood glucose‐lowering drugs in the past 2 weeks.
Statistical analysis
Baseline characteristics of participants stratified by the quartile of PDI were expressed as mean ± SD or percentage. General linear regression and the χ2 test were applied to test the trend of continuous and categorical variables, respectively. We used logistic regression models to estimate the odds ratios (OR) and 95% confidence intervals (95% CI) of type 2 diabetes associated with the dietary index, taking the lowest category as the reference group. Multiple covariates were selected and adjusted in three models: The initial model was adjusted for age and gender; in the second model, we further included education level (primary school or below, junior high school, and senior high school or above), marital status (married or cohabiting, single or divorced or widowed), socioeconomic status, tobacco smoking (never, former, and current smokers), alcohol drinking (never, former, and current drinkers), total energy intake (kcal/d), physical activity (low, moderate, and high), family history of diabetes (yes/no), and hypertension (yes/no); the third model included the second model plus BMI. We estimated the risk of type 2 diabetes for each standard deviation (1 SD) increase in dietary index by treating the scores as continuous variables. Restricted cubic regression splines were performed to further observe the association between continuous PDI and the risk of type 2 diabetes.
We further applied stratified analyses according to gender, age (< 55 and ≥ 55 y), BMI (< 24 and ≥ 24), education level (low education level and high education level), physical activity (low physical activity and high physical activity), per capita monthly income (< 500 and ≥ 500 RMB), tobacco smoking (never/former smokers and current smokers), and alcohol drinking (never/former drinkers and current drinkers). To examine the relationship between plant and animal products and type 2 diabetes, we created separate indices for plant (p‐Index) and animal (a‐Index) foods, and repeated analyses with additional adjustment for them. The p‐Index indicates the subjects’ adherence to all plant‐based foods, the higher the Index, the more plant‐based foods they consume. And the a‐Index indicates the level of participants’ consumption of all animal foods, with lower a‐Index scores indicating a higher consumption of animal foods. The two indices are established based on the above scoring method (for p‐Index, all plant‐based foods were positively rated, individuals in the highest quartile receiving a score of 4, the second highest quartile 3, and so on, and those in the lowest quartile 1. For a‐Index, all animal foods were inversely assigned, with the highest quartile scoring 1, followed by the second highest quartile scored 2, ending with those in the lowest category assigned a score of 4). All analyses were conducted using SAS version 9.1 and SPSS software version 22.0, and a 2‐tailed P value < 0.05 was considered statistically significant.
RESULTS
Characteristic of participants
There were 37,985 participants (14,937 men and 23,048 women) included in the analyses of the incidence of type 2 diabetes after exclusions, with a mean age of 55.67 ± 12.20 years. The characteristics of the study participants according to quartiles of PDI are shown in Table 1. Compared with participants with lower diet scores (quartile 1), those in quartile 4 tended to be older and women, had a lower monthly individual income, and were less likely to have completed higher education (degree or equivalent). Moreover, participants who had higher diet scores were less likely to be smokers or drinkers, tended to have diagnosed hypertension.
Table 1.
Participants’ characteristic according to quartiles of PDI
|
Characteristics |
PDI | ||||
|---|---|---|---|---|---|
| Quartile 1 (n = 8367) | Quartile 2 (n = 8232) | Quartile 3 (n = 11257) | Quartile 4 (n = 10129) | P value | |
| Men, n (% ) | 3806 (45.49) | 3232 (39.26) | 3988 (35.43) | 3911 (38.61) | <0.001 |
| Age (years) (mean ± SD) | 52.56 ± 13.90 | 55.58 ± 12.40 | 57.12 ± 11.36 | 56.72 ± 10.90 | <0.001 |
| Education levels, n (%) | |||||
| Primary school or below | 2913 (34.81) | 3665 (44.52) | 5679 (50.45) | 4837 (47.75) | <0.001 |
| Junior high school | 3555 (42.49) | 3260 (39.60) | 4234 (37.61) | 4022 (39.71) | |
| Senior high school or above | 1899 (22.70) | 1307 (15.88) | 1344 (11.94) | 1270 (12.54) | |
| Per capita monthly income, n (%) | |||||
| < 500 RMB | 2336 (27.92) | 2840 (34.50) | 4396 (39.05) | 4029 (39.78) | <0.001 |
| 500 ~ RMB | 2632 (31.46) | 2819 (34.24) | 3850 (34.20) | 3240 (31.99) | |
| 1000 ~ RMB | 3399 (40.62) | 2573 (31.26) | 3011 (26.75) | 2860 (28.23) | |
| Physical activity | |||||
| Low | 2672 (31.93) | 2655 (32.25) | 3650 (32.43) | 3327 (32.84) | 0.171 |
| Moderate | 3160 (37.77) | 3106 (37.73) | 4277 (37.99) | 3791 (37.43) | |
| High | 2535 (30.30) | 2471 (30.02) | 3330 (29.58) | 3011 (29.73) | |
| Marital status, n (%) | |||||
| Married/cohabiting | 7497 (89.60) | 7383 (89.69) | 10004 (88.87) | 9190 (90.73) | <0.001 |
| Single/divorced/widowed | 870 (10.40) | 849 (10.31) | 1253 (11.13) | 939 (9.27) | |
| Tobacco smoking, n (%) | |||||
| Never | 5685 (67.95) | 5950 (72.28) | 8534 (75.81) | 7524 (74.28) | <0.001 |
| Former | 725 (8.66) | 666 (8.09) | 847 (7.52) | 830 (8.20) | |
| Current smoker | 1957 (23.39) | 1616 (19.63) | 1876 (16.67) | 1775 (17.52) | |
| Alcohol drinking, n (%) | |||||
| Never | 5849 (69.90) | 6320 (76.77) | 9113 (80.95) | 8130 (80.26) | <0.001 |
| Former | 439 (5.25) | 393 (4.78) | 452 (4.02) | 467 (4.61) | |
| Current drinker | 2079 (24.85) | 1519 (18.45) | 1692 (15.03) | 1532 (15.13) | |
| Hypertension, n (%) | 2590 (30.95) | 2727 (33.17) | 3773 (33.53) | 3300 (32.61) | 0.001 |
| Family history of diabetes, n (%) | 360 (4.30) | 358 (4.35) | 458 (4.07) | 417 (4.12) | 0.723 |
| BMI (kg/m2) (mean ± SD) | 24.80 ± 3.53 | 24.84 ± 3.57 | 24.83 ± 3.57 | 24.86 ± 3.59 | 0.747 |
| Animal food group, mean ± SD | |||||
| Livestock (g/day) | 56.12 ± 41.87 | 31.33 ± 32.95 | 20.01 ± 25.05 | 18.66 ± 22.96 | <0.001 |
| Poultry (g/day) | 24.73 ± 18.68 | 12.96 ± 14.68 | 8.10 ± 11.12 | 7.53 ± 10.26 | <0.001 |
| Fish (g/day) | 7.92 ± 6.73 | 3.63 ± 5.01 | 2.11 ± 3.58 | 1.81 ± 3.03 | <0.001 |
| Egg (g/day) | 71.15 ± 49.19 | 62.68 ± 44.85 | 46.87 ± 40.30 | 44.63 ± 39.44 | <0.001 |
| Dairy (g/day) | 26.98 ± 24.76 | 13.90 ± 21.14 | 6.24 ± 15.18 | 4.44 ± 12.85 | <0.001 |
| Plant food group, mean ± SD | |||||
| Staple food (g/day) | 385.98 ± 133.76 | 390.79 ± 134.81 | 410.91 ± 130.08 | 449.42 ± 142.00 | <0.001 |
| Fruits (g/day) | 134.09 ± 115.84 | 121.03 ± 120.38 | 116.35 ± 121.39 | 178.91 ± 162.03 | <0.001 |
| Vegetables (g/day) | 291.46 ± 160.11 | 287.87 ± 160.82 | 297.94 ± 164.81 | 368.51 ± 195.84 | <0.001 |
| Beans (g/day) | 27.13 ± 29.59 | 25.45 ± 29.84 | 24.66 ± 30.74 | 46.16 ± 42.68 | <0.001 |
| Nuts (g/day) | 12.39 ± 16.75 | 12.00 ± 17.59 | 11.85 ± 18.07 | 24.54 ± 26.10 | <0.001 |
| Cereal (g/day) | 43.07 ± 44.82 | 47.23 ± 51.31 | 49.28 ± 54.44 | 89.67 ± 77.92 | <0.001 |
| Pickles (g/day) | 3.52 ± 15.48 | 3.08 ± 14.18 | 3.33 ± 36.75 | 4.86 ± 37.59 | <0.001 |
Values are presented as mean ± SD for continuous variables and n (%) for categorical variables.
PDI, plant‐based diet index; BMI, body mass index; RMB, renminbi; SD, standard deviation.
Dietary pattern index and type 2 diabetes
The OR and 95% CI of the risk of type 2 diabetes based on the quartiles of PDI are presented in Table 2. Participants in the highest quartile showed a 12% (OR: 0.88, 95% CI: 0.79–0.98; P = 0.027) lower risk of type 2 diabetes compared with those in the lowest quartile of PDI after adjustment for multiple potential covariates. When the PDI was assessed continuously, each 1 SD increase in the index had a borderline statistically significant 4% decreased risk of type 2 diabetes (95% CI: 0.93–1.00; P trend = 0.043) (Table 2). In addition, the association between PDI and the risk of type 2 diabetes was also shown in the restrictive cubic splines, indicating that the risk of type 2 diabetes gradually decreased with the continuous increase of PDI (Figure 1). When we analyzed the p‐Index and the a‐Index separately, a significant inverse association was observed between the p‐Index and the risk of type 2 diabetes in the fully adjusted model (OR comparing extreme quartiles: 0.62, 95% CI: 0.53–0.72; OR per 1‐SD increase: 0.86, 95% CI: 0.82–0.90; P trend < 0.001) (Table S1), while the association of the a‐Index with the risk of type 2 diabetes has no significant relevance.
Table 2.
Odds ratio (95% CI) for the risk of type 2 diabetes according to quartiles of PDI
| Q1 | Q2 | Q3 | Q4 | P trend | OR per 1 SD increase | |
|---|---|---|---|---|---|---|
| PDI | ||||||
| Model 1 | 1.00 (reference) | 0.98 (0.88–1.09) | 1.01 (0.91–1.11) | 0.98 (0.89–1.08) | 0.818 | 1.00 (0.97–1.04) |
| Model 2 | 1.00 (reference) | 0.98 (0.88–1.09) | 0.99 (0.90–1.09) | 0.89 (0.80–0.99) | 0.044 | 0.97 (0.93–1.00) |
| Model 3 | 1.00 (reference) | 0.97 (0.87–1.08) | 0.99 (0.89–1.09) | 0.88 (0.79–0.98) | 0.027 | 0.96 (0.93–1.00) |
Model 1: adjusted for age and gender. Model 2: Model 1 + education level, marital status, per capita monthly income, tobacco smoking, alcohol drinking, total energy intake (kcal/d), physical activity, hypertension, and family history of diabetes. Model 3: Model 2 + BMI.
CI, confidence interval; PDI, plant‐based diet index; OR, odds ratio; T2D, type 2 diabetes mellitus.
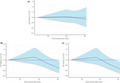
Figure 1.
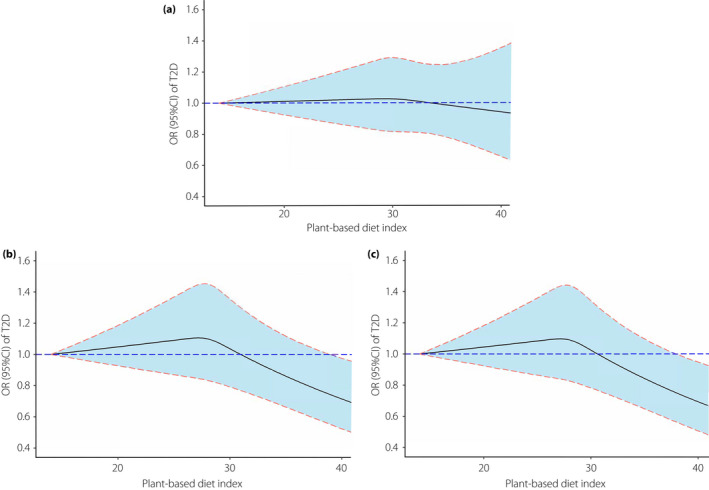
Odds ratios and 95% confidence intervals for the risk of type 2 diabetes along with the change of plant‐based diet index from restricted cubic splines regression model. (a, b, and c indicate model 1, model 2, and model 3, respectively). CI, confidence interval; OR, odds ratio; T2D, type 2 diabetes.
Stratified analyses
For the analyses of subgroups, the associations remained persistent between the PDI and the risk of type 2 diabetes in the subgroups of male, age ≥ 55, BMI ≥ 24, low education level, high physical activity, per capita monthly income < 500 RMB, and nonsmokers. The OR and corresponding 95% CI for the highest versus lowest category of PDI was 0.80 (0.68–0.94) among male, 0.80 (0.70–0.93) among participants with age ≥ 55, 0.87 (0.77–0.98) among participants with BMI ≥ 24, 0.81 (0.69–0.95) among participants with a lower education level, 0.85 (0.75–0.98) among participants with a higher physical activity, 0.77 (0.65–0.92) among participants with a per capita monthly income of < 500 RMB, and 0.87 (0.78–0.98) among nonsmokers, while no association was observed across strata defined by alcohol drinking (Figure 2). In the interaction analysis, a significant effect modification by the per capita monthly income (< 500 and ≥ 500 RMB; P interaction = 0.016) for PDI was observed, but such an association was not found in other stratified analyses (all P interaction > 0.05). Similar results were also observed in the analysis of p‐Index and the risk of type 2 diabetes. Compared with participants with a higher per capita monthly income, the correlation between p‐Index and type 2 diabetes was more significant among those with a lower per capita monthly income (P interaction = 0.018) (Figure S1).
Figure 2.
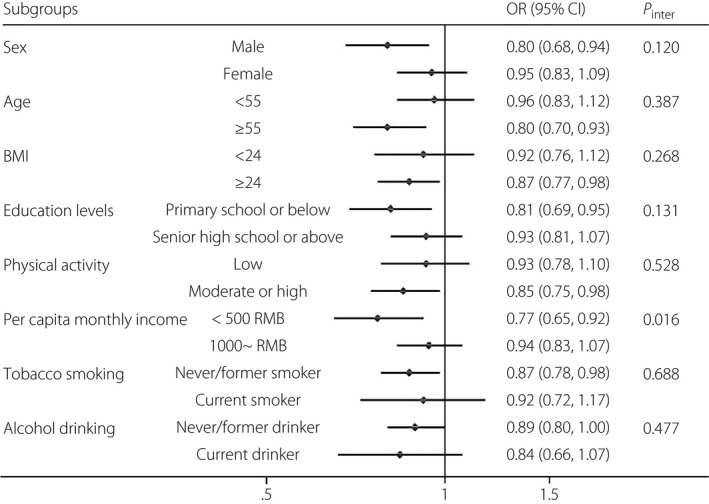
Adjusted odds ratios for type 2 diabetes comparing extreme quartiles of the plant‐based diet index, stratified by selected characteristics. CI, confidence interval; P, probability; OR, odds ratio; RMB, renminbi; T2D, type 2 diabetes.
DISCUSSION
In this large study of Chinese rural adults, we found that a higher score of the overall plant‐based diet was associated with a lower risk of type 2 diabetes [OR (95% CI) comparing extreme quartiles: 0.88 (0.79–0.98)], and each 1 SD increase in PDI was correlated with a 4% reduced risk of type 2 diabetes. The inverse association we observed broadly persisted in subgroup analyses stratified by sex, age, BMI, education level, tobacco smoking, alcohol drinking, and physical activity, although it was stronger among participants with a lower per capita monthly income. The significant inverse correlation between the p‐Index and type 2 diabetes further confirmed the positive impact of plant‐based foods on population health.
In agreement with previous studies5, 7, 12, our results suggest that adherence to an overall plant‐based diet is beneficial for reducing the risk of type 2 diabetes, regardless of the health impact of the specific foods. Evidence from large prospective studies in a US population indicated that a long‐term plant‐based diet is beneficial for reducing the risk of type 2 diabetes7. The Rotterdam Study found that insulin resistance decreased with higher scores on a plant‐based diet [β = −0.05 (−0.06; −0.04)] and the risk of type 2 diabetes [HR = 0.87 (0.79; 0.99)]5. In addition, a prospective study among Chinese urban adults suggested that adopting a plant‐based diet during follow‐up had a positive effect on controlling the occurrence of type 2 diabetes, but the score included only eight food groups and emphasized overall healthy eating, which was somewhat different from the PDI focused on in this study17. Moreover, the Singapore Chinese Health Study (SCHS) found that individuals in the highest category of PDI had a 17% lower risk of developing diabetes compared with those within the lowest category, and similar results from our study extend this finding to the Chinese population9. It is noticeable that what we are emphasizing is changes in plant‐ and animal‐based food intake do not require the complete elimination of animal‐based foods. Given that people usually do not eat isolated nutrients or foods, it seems unrealistic to attribute certain pathophysiological explanations to a few foods, therefore, exploring the effect of diet on disease with a dietary index may be more appropriate to explain the role of diet in the development of chronic disease.
Based on some previous research evidence, several potential mechanisms may explain the beneficial effect of a plant‐based diet on type 2 diabetes. We believe that plant‐based diets are generally high in dietary fiber, antioxidants, chlorogenic acid, unsaturated fat, plant protein, magnesium, and other micronutrients, and low in animal protein and saturated fat. Dietary fiber has a beneficial effect on improving glucose metabolism and controlling weight by reducing postprandial glucose excursions and delaying gastric emptying18, 19. Human epidemiological and intervention studies have shown that antioxidants, such as polyphenols, stimulate insulin‐secreting cells by inhibiting glucose absorption in the intestine, thereby reducing postprandial glycemic responses, and improving insulin sensitivity20, 21. Also diets high in unsaturated fatty acids and low in saturated fats have been shown to have anti‐inflammatory effects22, 23.
Whole grains, vegetables, and fruits are major sources of dietary fiber and antioxidants. A previous meta‐analysis showed that every three servings of whole grains per day reduced the risk of developing type 2 diabetes by 32%24. Compared with lower intake, greater total fruit and vegetable consumption is related to a substantially lower risk of type 2 diabetes25, 26. Legumes and nuts are rich in plant protein and minerals that play a key role in glucose metabolism by effectively lowering cholesterol levels and certain micronutrients27, 28, 29. While animal proteins, which are rich in branched and aromatic amino acids, may be unfavorable to glucose metabolism30, 31, higher levels of saturated fats are also thought to increase the risk of obesity and type 2 diabetes32. Therefore, we believe that a plant‐based diet can enhance blood glucose control and improve inflammation and insulin secretion to a certain extent, thereby reducing the risk of type 2 diabetes. In addition, increasing the consumption of plant food and controlling animal food can effectively reduce the calorie intake, thus leading to weight loss or preventing weight gain, which may have a certain impact on the control of type 2 diabetes.
Consuming a plant‐based diet emphasizes improvements in overall diet quality, which supports individuals to make gradual changes to their diets without completely eliminating certain animal foods, which we believe is more acceptable. In addition, a moderate intake of animal foods such as fish, lean meat, and eggs per day is consistent with the recommendations of most national dietary guidelines33, and the latest evidence suggests that adding animal‐based foods to the diet, such as dairy products, may have beneficial effects on the body by supplementing it with calcium, vitamin D, and potassium34.
In this study, we first assessed the association between dietary index and the risk of type 2 diabetes in a Chinese rural population, the main strengths included the large sample size, comprehensive adjustment of potential covariates, and the population‐based nature of the study. Nevertheless, several limitations should be acknowledged. First, given the nature of cross‐sectional design, causality cannot be determined. Second, dietary data were self‐reported, measurement errors are inevitable. However, previous reliability and validity evaluations suggest that the FFQ used in our study is acceptable as a method to evaluate the diet of rural populations14. Third, we acknowledge that the relationship between some of the components included in our PDI and diabetes is still uncertain, eggs, for example, have been shown in some studies to be related to the beneficial or irrelevant effects of type 2 diabetes35, 36, while an adverse effect was found in an analysis of the American population37. Fourth, although we have carefully controlled multiple confounding factors, the possibility of some unknown confounders may exist. Finally, our study participants consisted largely of a Chinese rural population, considering the differences in diet and lifestyle, the results we observed may not be directly generalized to other ethnic and socioeconomic groups.
We provide evidence that adherence to an overall plant‐based diet is beneficial for reducing the risk of type 2 diabetes in Chinese adults, and our findings support a shift to a diet that emphasizes plant‐based foods to improve health outcomes. Future longitudinal studies and well‐designed intervention trials are necessary to further understand the long‐term impact of a plant‐based diet on the risk of type 2 diabetes.
Disclosure
No conflicts of interest relevant to this article were reported.
Supporting information
Table S1 | Odds ratio (95% CI) for the risk of type 2 diabetes according to quartiles of p‐Index and a‐Index.
Figure S1 | Adjusted odds ratios (ORs) for type 2 diabetes (T2D) comparing extreme quartiles of the p‐Index and a‐Index, stratified by selected characteristics.
ACKNOWLEDGMENTS
This work was supported by the National Key Research and Development Program “Precision Medicine Initiative” of China (grant no: 2016YFC0900803). We sincerely thank all authors for their work in this study.
J Diabetes Investig. 2021; 12: 1569–1576
REFERENCES
- 1.Saeedi P, Petersohn I, Salpea P, et al. Global and regional diabetes prevalence estimates for 2019 and projections for 2030 and 2045: Results from the International Diabetes Federation Diabetes Atlas, 9(th) edition. Diabetes Res Clin Pract 2019; 157: 107843. [DOI] [PubMed] [Google Scholar]
- 2.Chatterjee S, Khunti K, Davies MJ. Type 2 diabetes. Lancet 2017; 389: 2239–2251. [DOI] [PubMed] [Google Scholar]
- 3.Li Y, Wang DD, Ley SH, et al. Time trends of dietary and lifestyle factors and their potential impact on diabetes burden in China. Diabetes Care 2017; 40: 1685–1694. [DOI] [PMC free article] [PubMed] [Google Scholar]
- 4.Appleby PN, Key TJ. The long‐term health of vegetarians and vegans. Proc Nutr Soc 2016; 75: 287–293. [DOI] [PubMed] [Google Scholar]
- 5.Chen Z, Zuurmond MG, van der Schaft N, et al. Plant versus animal based diets and insulin resistance, prediabetes and type 2 diabetes: the Rotterdam Study. Eur J Epidemiol 2018; 33: 883–893. [DOI] [PMC free article] [PubMed] [Google Scholar]
- 6.Kim H, Caulfield LE, Garcia‐Larsen V, et al. Plant‐based diets are associated with a lower risk of incident cardiovascular disease, cardiovascular disease mortality, and all‐cause mortality in a general population of middle‐aged adults. J Am Heart Assoc 2019; 8: e012865. [DOI] [PMC free article] [PubMed] [Google Scholar]
- 7.Satija A, Bhupathiraju SN, Rimm EB, et al. Plant‐based dietary patterns and incidence of type 2 diabetes in US Men and Women: results from three prospective cohort studies. PLoS Med 2016; 13: e1002039. [DOI] [PMC free article] [PubMed] [Google Scholar]
- 8.Satija A, Hu FB. Plant‐based diets and cardiovascular health. Trends Cardiovasc Med 2018; 28: 437–441. [DOI] [PMC free article] [PubMed] [Google Scholar]
- 9.Chen GC, Koh WP, Neelakantan N, et al. Diet quality indices and risk of type 2 diabetes mellitus: The Singapore Chinese Health Study. Am J Epidemiol 2018; 187: 2651–2661. [DOI] [PMC free article] [PubMed] [Google Scholar]
- 10.Chiu THT, Pan WH, Lin MN, et al. Vegetarian diet, change in dietary patterns, and diabetes risk: a prospective study. Nutr Diabetes 2018; 8: 12. [DOI] [PMC free article] [PubMed] [Google Scholar]
- 11.Lee Y, Park K. Adherence to a vegetarian diet and diabetes risk: a systematic review and meta‐analysis of observational studies. Nutrients 2017; 9: 603. [DOI] [PMC free article] [PubMed] [Google Scholar]
- 12.Qian F, Liu G, Hu FB, et al. Association between plant‐based dietary patterns and risk of type 2 diabetes: a systematic review and meta‐analysis. JAMA Intern Med 2019; 179: 1335‐1344. [DOI] [PMC free article] [PubMed] [Google Scholar]
- 13.Liu X, Mao Z, Li Y, et al. Cohort Profile: The Henan Rural Cohort: a prospective study of chronic non‐communicable diseases. Int J Epidemiol 2019; 48: 1756j. [DOI] [PubMed] [Google Scholar]
- 14.Xue Y, Yang K, Wang B, et al. Reproducibility and validity of an FFQ in the Henan Rural Cohort Study. Pub Health Nutr 2020; 23: 34–40. [DOI] [PMC free article] [PubMed] [Google Scholar]
- 15.Craig CL, Marshall AL, Sjostrom M, et al. International physical activity questionnaire: 12‐country reliability and validity. Med Sci Sports Exerc 2003; 35: 1381–1395. [DOI] [PubMed] [Google Scholar]
- 16.American DA. Diagnosis and classification of diabetes mellitus. Diabetes Care 2014; 37(Suppl 1): S81–90. [DOI] [PubMed] [Google Scholar]
- 17.Yu D, Zheng W, Cai H, et al. Long‐term diet quality and risk of type 2 diabetes among urban Chinese adults. Diabetes Care 2018; 41: 723–730. [DOI] [PMC free article] [PubMed] [Google Scholar]
- 18.InterAct C . Dietary fibre and incidence of type 2 diabetes in eight European countries: the EPIC‐InterAct Study and a meta‐analysis of prospective studies. Diabetologia 2015; 58: 1394–1408. [DOI] [PMC free article] [PubMed] [Google Scholar]
- 19.Weickert MO, Pfeiffer AFH. Impact of dietary fiber consumption on insulin resistance and the prevention of type 2 diabetes. J Nutr 2018; 148: 7–12. [DOI] [PubMed] [Google Scholar]
- 20.Hanhineva K, Torronen R, Bondia‐Pons I, et al. Impact of dietary polyphenols on carbohydrate metabolism. Int J Mol Sci 2010; 11: 1365–1402. [DOI] [PMC free article] [PubMed] [Google Scholar]
- 21.Rienks J, Barbaresko J, Oluwagbemigun K, et al. Polyphenol exposure and risk of type 2 diabetes: dose‐response meta‐analyses and systematic review of prospective cohort studies. Am J Clin Nutr 2018; 108: 49–61. [DOI] [PubMed] [Google Scholar]
- 22.Imamura F, Micha R, Wu JH, et al. Effects of saturated fat, polyunsaturated fat, monounsaturated fat, and carbohydrate on glucose‐insulin homeostasis: a systematic review and meta‐analysis of randomised controlled feeding trials. PLoS Med 2016; 13: e1002087. [DOI] [PMC free article] [PubMed] [Google Scholar]
- 23.Telle‐Hansen VH, Gaundal L, Myhrstad MCW. Polyunsaturated fatty acids and glycemic control in type 2 diabetes. Nutrients 2019; 11: 1067. [DOI] [PMC free article] [PubMed] [Google Scholar]
- 24.Aune D, Norat T, Romundstad P, et al. Whole grain and refined grain consumption and the risk of type 2 diabetes: a systematic review and dose‐response meta‐analysis of cohort studies. Eur J Epidemiol 2013; 28: 845–858. [DOI] [PubMed] [Google Scholar]
- 25.Li M, Fan Y, Zhang X, et al. Fruit and vegetable intake and risk of type 2 diabetes mellitus: meta‐analysis of prospective cohort studies. BMJ Open 2014; 4: e005497. [DOI] [PMC free article] [PubMed] [Google Scholar]
- 26.Wang PY, Fang JC, Gao ZH, et al. Higher intake of fruits, vegetables or their fiber reduces the risk of type 2 diabetes: a meta‐analysis. J Diabetes Investig 2016; 7: 56–69. [DOI] [PMC free article] [PubMed] [Google Scholar]
- 27.Becerra‐Tomas N, Diaz‐Lopez A, Rosique‐Esteban N, et al. Legume consumption is inversely associated with type 2 diabetes incidence in adults: a prospective assessment from the PREDIMED study. Clin Nutr 2018; 37: 906–913. [DOI] [PubMed] [Google Scholar]
- 28.Fan M, Li Y, Wang C, et al. Dietary protein consumption and the risk of type 2 diabetes: ADose‐response meta‐analysis of prospective studies. Nutrients 2019; 11: 2783. [DOI] [PMC free article] [PubMed] [Google Scholar]
- 29.Hernandez‐Alonso P, Camacho‐Barcia L, Bullo M, et al. Nuts and dried fruits: an update of their beneficial effects on type 2 diabetes. Nutrients 2017; 9: 673. [DOI] [PMC free article] [PubMed] [Google Scholar]
- 30.Malik VS, Li Y, Tobias DK, et al. Dietary protein intake and risk of type 2 diabetes in US men and women. Am J Epidemiol 2016; 183: 715–728. [DOI] [PMC free article] [PubMed] [Google Scholar]
- 31.Ye J, Yu Q, Mai W, et al. Dietary protein intake and subsequent risk of type 2 diabetes: a dose–response meta‐analysis of prospective cohort studies. Acta Diabetol 2019; 56: 851–870. [DOI] [PubMed] [Google Scholar]
- 32.Guasch‐Ferre M, Becerra‐Tomas N, Ruiz‐Canela M, et al. Total and subtypes of dietary fat intake and risk of type 2 diabetes mellitus in the Prevencion con Dieta Mediterranea (PREDIMED) study. Am J Clin Nutr 2017; 105: 723–735. [DOI] [PubMed] [Google Scholar]
- 33.Herforth A, Arimond M, Alvarez‐Sanchez C, et al. A global review of food‐based dietary guidelines. Adv Nutr 2019; 10: 590–605. [DOI] [PMC free article] [PubMed] [Google Scholar]
- 34.Hess JM, Fulgoni VL, Radlowski EC. Modeling the impact of adding a serving of dairy foods to the healthy Mediterranean‐style eating pattern recommended by the 2015–2020 dietary guidelines for Americans. J Am Coll Nutr 2019; 38: 59–67. [DOI] [PubMed] [Google Scholar]
- 35.Kurotani K, Nanri A, Goto A, et al. Cholesterol and egg intakes and the risk of type 2 diabetes: the Japan Public Health Center‐based Prospective Study. Br J Nutr 2014; 112: 1636–1643. [DOI] [PubMed] [Google Scholar]
- 36.Lee J, Kim J. Egg consumption is associated with a lower risk of type 2 diabetes in middle‐aged and older men. Nutr Res Pract 2018; 12: 396–405. [DOI] [PMC free article] [PubMed] [Google Scholar]
- 37.Djousse L, Gaziano JM, Buring JE, et al. Egg consumption and risk of type 2 diabetes in men and women. Diabetes Care 2009; 32: 295–300. [DOI] [PMC free article] [PubMed] [Google Scholar]
Associated Data
This section collects any data citations, data availability statements, or supplementary materials included in this article.
Supplementary Materials
Table S1 | Odds ratio (95% CI) for the risk of type 2 diabetes according to quartiles of p‐Index and a‐Index.
Figure S1 | Adjusted odds ratios (ORs) for type 2 diabetes (T2D) comparing extreme quartiles of the p‐Index and a‐Index, stratified by selected characteristics.