

Abstract

Salinity is one of the significant factors that affect growth and cellular metabolism, including photosynthesis and lipid accumulation, in microalgae and higher plants. Microchloropsis gaditana CCMP526 can acclimatize to different salinity levels by accumulating compatible solutes, carbohydrates, and lipids as energy storage molecules. We used proteomics to understand the molecular basis for acclimation of M. gaditana to increased salinity levels [55 and 100 PSU (practical salinity unit)]. Correspondence analysis was used for the identification of salinity-responsive proteins (SRPs). The highest number of salinity-induced proteins was observed in 100 PSU. Gene ontology enrichment analysis revealed a separate path of acclimation for cells exposed to 55 and 100 PSU. Osmolyte and lipid biosynthesis were upregulated in hypersaline conditions. Concomitantly, lipid oxidation pathways were also upregulated in hypersaline conditions, providing acetyl-CoA for energy metabolism through the tricarboxylic acid cycle. Carbon fixation and photosynthesis were tightly regulated, while chlorophyll biosynthesis was affected in hypersaline conditions. Importantly, temporal proteome analysis of salinity-induced M. gaditana revealed vital SRPs which could be used for engineering salinity resilient microalgal strains for improved productivity in hypersaline culture conditions.
1. Introduction
Biofuel sourced from algae is considered as an effective renewable alternative to fossil fuels.1 Microalgae can grow in a variety of environmental conditions all year-round and produce valuable products such as biofuel, animal feeds, and pharmaceuticals.2,3 Moreover, many species can accumulate high amounts of lipid under stress, and this phenomenon has been extensively researched in promising biofuel candidates under various stress conditions.4−6 However, limitations such as low lipid productivity and high costs associated with downstream processing have hindered the commercialization of algae-based biofuel.7 A simple approach for enhancing productivity coupled with high growth rate would be to manipulate the environmental parameters. Additionally, identifying protein targets for engineering resilient algal strains is the major factor in the sustainable development of microalgae-based biofuels. Salinity is one of the primary growth-influencing factors for marine microalgae, which could be controlled in an open raceway pond.
Extensive research has been done on increasing lipid accumulation in various microalgal species using salinity stress.8,9 Notably, the halotolerant alga Dunaliella sp. is known to perform well in hypersaline conditions. It accumulates a high amount (∼5 M) of glycerol when exposed to hypersaline conditions.10 Lipid accumulation was enhanced to 59.4% in Chlamydomonas sp. JSC4 by gradually increasing the salinity levels up to 2% (w/v) sea salt.11 Accumulation of lipid or glycerol in such conditions involves a major metabolic shift in re-directing the carbon flux, which causes alteration in the abundance of proteins/enzymes involved in the metabolism of lipid or glycerol.
Appropriately, various proteomic studies can be performed to understand the acclimatization process of microalgae in hypersaline conditions. The proteome of the halotolerant alga Dunaliella sp. has been studied to understand the molecular basis behind the tolerance to hypersaline conditions.12,13 Sithtisarn and colleagues performed a comparative proteomic analysis of a control and a salinity tolerant strain of Chlamydomonas reinhardtii to understand the salinity tolerance mechanism involved.14 Alterations in the proteome of terrestrial plants have also been extensively studied.15,16 The response to salinity appears to be similar in both microalgae and higher plants. Several biosynthetic pathways were affected in hypersaline conditions, including photosynthesis, lipid, carbohydrate, and amino acid metabolism.17 Perturbations in the proteome of microalgae in hypersaline conditions offer insights into the acclimatization strategies, which in turn can be used to develop salinity-tolerant strains.
Microchloropsis gaditana CCMP526, previously known as Nannochloropsis gaditana CCMP526, is one of the six algal species from the genus Nannochloropsis.18 It is a marine microalga known for its high oil accumulating capability and especially its eicosapentaenoic acid content. M. gaditana cultivated in open raceway ponds are prone to evaporation, which increases the salinity of the culture medium. Physiological alterations in the lipid and carbohydrate accumulation have been observed in hypersaline conditions,19 which prompted us to investigate the genes and proteins involved in the salinity response mechanism. A systematic investigation using the NGS-based transcriptomic (RNA-Seq) approach was performed to identify the molecular players in salinity tolerance (Karthikaichamy et al., 2020).20 The results showed active orchestration of carbon flux toward lipid accumulation and osmolyte biosynthesis. Despite the physiological and transcriptomic characterization of salinity response in M. gaditana, the information on the regulation of proteome toward increased salinity levels remained elusive. Therefore, in this work, we aim to identify the salinity-responsive proteins (SRPs) using a DIA (data-independent acquisition) proteomic approach. The traditional proteomic analysis uses data-dependent acquisition (DDA), which is often limited by the number of proteins and peptides that can be analyzed in one run as previously demonstrated in M. gaditana.21 In DIA analysis, all peptides within a defined m/z range are fragmented, resulting in an increase in the number of quantifiable peptides and a more accurate peptide quantification.22 Temporal proteomic analysis was performed on M. gaditana subjected to different salinity levels [38, 55, and 100 PSU (practical salinity unit)]. Time points and salinity levels for sampling were chosen based on the lipid and carbohydrate accumulation from our previous physiological analysis.19 Systematic analysis of the temporal proteome data revealed vital SRPs and the dynamics of key proteins involved in the cellular metabolic shift toward acclimatization in hypersaline conditions.
2. Materials and Methods
2.1. Cultivation and Harvesting
M. gaditana was cultivated in 0.2 μm of filtered sea water (collected from the Gippsland Lakes, Gippsland, Victoria, Australia), supplemented with Guillard’s f/2 nutrients (Guillard, 1975) and 17 mM sodium nitrate, at 25 °C using 500 mL glass bottles (Schott Duran, Germany). Cultures (300 mL) were mixed by bubbling with sterile air (0.2 μm filtered) supplied at a flow rate of 2.5 L min–1. Illumination was provided at 150 μmol·photons·m–2·s–1 (Philips, TLD36W, Amsterdam, The Netherlands) with a light/dark cycle of 12/12 h. Sodium chloride was added to the existing f/2 media (control, 38 PSU) to make f/2 media of different salinities (55 and 100 PSU). A portable refractometer (RHS-10ATC) was used to assess the salinity of the culture media. The growth curve experiment (cell count and OD685) was performed under standard conditions (38 PSU, 25 °C, and 150 μmol·photons·m–2·s–1) to determine the growth phases in M. gaditana. Cells at the mid exponential phase were inoculated in f/2 media of different salinities at a concentration of approximately 4 × 10⁶ cells/mL. Cells were then sampled from three independent cultures at specific time points (0, 1, 6, 24, and 72 h) that were chosen from our earlier physiological study.19 The culture conditions and time points selected for proteomic analysis indicate the major physiological changes in M. gaditana such as carbohydrate and neutral lipid accumulation. The samples were centrifuged (4000×g, 4 °C, 5 min) in a Heraeus Multifuge model 3SR Plus (Thermo Scientific, Australia), and the resulting cell pellet was washed thrice with sterile distilled water to remove any residual salt from the growth medium. The pellet was then stored at −80 °C until further processing.
2.2. Protein Isolation and Sample Preparation for Mass Spectrometry
Protein was isolated using a Bioline II DNA/RNA/Protein extraction kit (Bioline, Australia) following the manufacturer’s protocol. The isolated protein was quantified using the absorbance at 280 nm (Thermo Scientific, Australia). The samples were stored in −80 °C until further processing. Approximately 50 mg of protein was denatured using TCEP (Thermo Scientific, Cat. #77720) to a final concentration of 10 mM. The solution was then incubated at 50–65 °C for 30 min. Chloroacetamide was added to a final concentration of 40 mM to alkylate the reduced protein. The mixture was incubated at room temperature in the dark for 20 min. Trypsin at a dilution of 1:100 was added and incubated overnight at 37 °C with shaking. The reaction was stopped by adding 1% formic acid (FA) (Wei et al.). The samples were then desalted using ZipTips (Agilent, OMIX-Mini Bed 96 C18, A57003MBK). The residual acetonitrile (ACN) was removed using a vacuum concentrator. The sample was dissolved in 20 μL of 0.1% FA and sonicated in a water bath for 10 min. Any insoluble precipitate was removed by centrifuging for 5 min. iRT (indexed retention time) peptides (internal standard) were added before transferring the sample into a mass spectrometry (MS)-compatible vial.
2.3. MS Data Acquisition
2.3.1. DDA MS Analysis
Using a Dionex UltiMate 3000 RSLCnano system equipped with a Dionex UltiMate 3000 RS autosampler, the samples were loaded via an Acclaim PepMap 100 trap column (100 μm × 2 cm, nanoViper, C18, 5 μm, 100 Å; Thermo Scientific) onto an Acclaim PepMap RSLC analytical column (75 μm × 50 cm, nanoViper, C18, 2 μm, 100 Å; Thermo Scientific). The peptides were separated by elution with increasing concentrations of 80% ACN/0.1% FA at a flow rate of 250 nL/min for 158 min and analyzed with an Orbitrap Fusion Tribrid mass spectrometer (Thermo Scientific). Each cycle was set to a fixed cycle time of 4 s consisting of an Orbitrap full MS1 scan (resolution: 120,000; AGC target: 1 × 10⁶; maximum IT: 54 ms; scan range: 375–1575 m/z), followed by several Orbitrap MS2 scans (resolution: 30,000; AGC target: 4 × 10⁵; maximum IT: 118 ms; isolation window: 1.4 m/z; HCD collision energy: 32%). To minimize repeated sequencing of the peptides, dynamic exclusion was set to 15 s, and the “exclude isotopes” option was activated. The raw and analyzed DDA data files have been deposited to the ProteomeXchange Consortium (http://proteomecentral.proteomexchange.org) via the PRIDE partner repository23 with the dataset identifier PXD017164.
2.3.2. Quantification of Proteins Using DIA MS
The identical instrument setup as described above (Dionex UltiMate 3000 LC system coupled to an Orbitrap Fusion Tribrid mass spectrometer) was used to quantify proteins using DIA. Twenty-five sequential DIA windows with an isolation width of 24 m/z between 375 and 975 m/z were acquired (resolution: 30,000; AGC target: 1 × 10⁶; maximum IT: 54 ms; HCD collision energy: 32%; and scan range: 200–2000 m/z) following a full MS1 scan (resolution: 120,000; AGC target: 1 × 10⁶; maximum IT: 54 ms; and scan range: 375–1575 m/z). A 158 min gradient of increasing concentrations of 80% ACN/0.1% FA was used to separate the peptides for the DIA acquisition. The raw and analyzed DIA data files have been deposited to the ProteomeXchange Consortium (http://proteomecentral.proteomexchange.org) via the PRIDE partner repository23 with the dataset identifier PXD017297.
2.3.3. MS Data Analysis
Acquired DDA .raw files were searched against the N. gaditana UniProtKB/SwissProt database (v2017_07) using Byonic (Protein Metrics) embedded into Proteome Discoverer (Thermo Scientific) to obtain the peptide sequence information. Only peptides identified at a false discovery rate (FDR) of 1% based on a decoy database were considered for further analysis. Spectronaut Orion (Biognosys) was used to create the corresponding spectral library as well as to evaluate all DIA data using in-house parameters. To correct for differences in sample density and loading, the peak areas for each peptide were normalized based on the assumption that on average, a similar number of peptides are up- and downregulated. Two-sided t-tests were used to calculate p-values and the FDR for each time point (0, 1, 6, 24, and 72 h) and salinity level (55 and 100 PSU) against control (38 PSU) based on multiple hypotheses testing corrections by the Benjamini–Hochberg method (implemented in R). Gene ontology (GO) terms were enriched using Fisher’s exact test with p-value < 0.05.
3. Results and Discussion
3.1. General Description of Proteomic Results
DIA-based proteomic analysis was employed to investigate the temporal acclimatization strategy of M. gaditana at different salinity levels (55 and 100 PSU) compared to controls at 38 PSU, at various time points (0, 1, 6, 24, and 72 h). These time points represent the critical stages of change in the cellular state in regard to alterations in the photosynthetic rate, carbohydrate, and lipid accumulation.19 To identify the proteins that were expressed in all time points, a Venn diagram was constructed (Figure 1). A total of 1874 proteins were expressed across all the time points, and these proteins were selected for temporal analysis.
Figure 1.
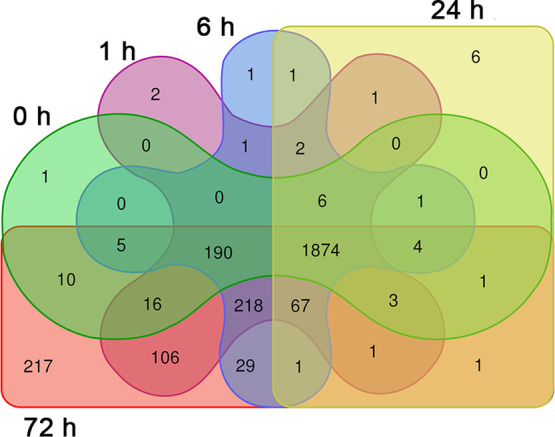
Venn diagram showing the number of differentially expressed proteins at different time points in salinity-stressed M. gaditana.
Out of 1874 proteins, those satisfied the cutoff criteria [p-value < 0.05 and absolute log2(fold change) > 1] in at least a single time point were selected for further analysis. M. gaditana grown in 55 PSU had 456 significantly expressed proteins compared to 1359 proteins in cells exposed to 100 PSU relative to the control condition (38 PSU). The highest number of proteins that were differentially expressed were in cells grown under 100 PSU at 72 h (264 downregulated and 1110 upregulated proteins), suggesting a major proteomic shift toward acclimation in hypersaline conditions. There was also a robust initial response to the change in salinity. Ideally, the protein expression levels should remain the same at 0 h, irrespective of the salinity. However, we observed differential expression of proteins at 0 h in 55 and 100 PSU. This is explained by the time required for harvesting and processing the cells for the proteomic experiment. In 55 and 100 PSU, 157 and 454 proteins were downregulated, respectively (compared to control), at 0 h, which was higher than at any of the other time points (Figure 2). Moreover, 76 and 120 proteins were statistically upregulated in cells exposed to 55 and 100 PSU, respectively, at 0 h, indicating the initial acclimation strategy toward hypersaline conditions. A list of differentially expressed proteins in M. gaditana in hypersaline conditions (55 and 100 PSU) is given in Supporting Information, Table S1.
Figure 2.

Volcano plot showing significantly regulated proteins [p-value < 0.05 and absolute log2(fold change) > 1] as green dots in two different salinity levels (A). 55 PSU vs control and (B) 100 PSU vs control. Values on either side of the plot represent the number of significantly up- and downregulated proteins. The cultivation time point for proteomic analysis is defined as red text in the corresponding plots.
3.2. GO-Term Enrichment Reveals the Path toward Acclimation
The disparity in the number of differentially expressed proteins at various time points and different salinity levels suggests that M. gaditana employs a different strategy for acclimation to salinities of 55 and 100 PSU. To understand the path toward acclimation, statistically significant proteins at different time points were GO-enriched in Blast2GO,24 using a filtering cutoff of p-value < 0.05. Interactive maps were created with the significantly enriched biological process (BP) GO terms (Supporting Information, Tables S2 and S3) using REVIGO.25Figure 3 shows the enriched BP GO terms at different time points for cells exposed to 55 and 100 PSU, except for the 100 PSU cells at 24 h, where the BP terms were not statistically enriched. Therefore, a molecular function GO term was used to describe the acclimation path. The interaction map of enriched GO terms clearly shows that M. gaditana exposed to 55 and 100 PSU uses a distinct strategy to overcome salinity, except at 1 h after the transfer to the elevated salinity, where the GO term for translation is enriched in both 55 and 100 PSU. The initial response to changes in salinity levels was significantly enriched by the photosynthesis GO term in cells in both 55 and 100 PSU. Similarly, proteomic analysis on a halotolerant alga Dunaliella salina revealed the dynamics of expression of essential proteins involved in photosynthesis in hypersaline conditions (3 M NaCl).13
Figure 3.

Interaction map of enriched GO terms at different cultivation time points and salinities in M. gaditana. Bubble color indicates the p-value; bubble size indicates the generality of the GO terms in the underlying GOA (Gene Ontology Annotation) database. p-values of enriched GO terms for 55 and 100 PSU at different time points are provided in Supporting Information, Tables S2 and S3, respectively.
Following our previous study on M. gaditana during the transfer to hypersaline conditions,19 GO terms for carbohydrate metabolism were enriched at 72 h in 100 PSU. Relatively fewer GO terms were enriched at 6 and 24 h after transfer, which is a reflection of the number of differentially expressed proteins in cells growing at 55 and 100 PSU. However, a varied response to different saline conditions was evident across the time points. Salinity-induced ROS accumulation in cells at 55 PSU was observed in our previous study19 and correspondingly the GO terms for response to stress (GO:0033554) and cellular oxidant detoxification (GO:0098869) were enriched at 6 and 24 h, respectively.
In contrast, GO terms for energy-intensive translation (GO:0006412) was enriched at 1 and 6 h after transfer of cells to 100 PSU, suggesting a protein-aided metabolic shift during the later phases (72 h) of acclimation through carbohydrate metabolism (GO:0005975) and homeostatic processes (GO:0042592). The enrichment of the carbohydrate metabolism (GO:0005975) term during the later-phase of growth suggests carbon shunting toward lipid accumulation, which is evident from our physiological19 and transcriptomic20 studies on M. gaditana.
3.3. SRPs Identified by the Correspondence Analysis
Correspondence analysis (CA) was performed to find the association between different time points and differentially expressed proteins in response to salinity conditions (55 and 100 PSU). CA is a multivariate method that is used to reduce the dimensions of a complex dataset into a low-dimensional space while preserving the information.26 CA has been widely used in exploring the interactions between the genes and experimental conditions27 or tissue types.28 The temporal proteomic data were subjected to CA using ‘ade4’, a package for multivariate data analysis in R.29
The data were spread out on a two-dimensional biplot, which accounted for 73.5 and 76.5% of total inertia in cells exposed to 55 and 100 PSU, respectively. In the biplot (Figure 4), each point represents a protein, and the arrows that originate from the origin represent the time points. Proteins closer or along the arrow are upregulated at that particular time point, and the proteins that are on the opposite quadrant of the arrow represent the downregulated protein at that particular time point. Proteins are colored according to the contribution toward the plot; the highest contribution indicates that the protein has been highly expressed at that particular time point.
Figure 4.

CA of differentially expressed proteins in M. gaditana at different time points in 55 and 100 PSU. Biplot showing the association between time points and differentially expressed proteins (numbers along the red arrow represent time points).
3.3.1. Top SRPs in Cells Grown under Hypersaline Conditions
Top 10 proteins, based on their contribution values, for each salinity conditions, are shown in Figure 5. Three uncharacterized proteins were found to be among the top 10 contributors in 55 PSU (W7T9L0, W7TQA5, and W7T0M7) and two were found in cells exposed to 100 PSU (W7U7C1 and W7T797). The top contributor in cells exposed to 55 PSU was W7T3F9, an esterase lipase thioesterase family protein, which was upregulated at 0 and 6 h. It has been GO annotated with acylglycerol lipase activity (GO:0047372) and medium-chain fatty acid catabolic processes (GO:0051793). The gene product (at2g39420) of the protein homologue in Arabidopsis (Q8RXN7_ARATH; E-value: 1.7 × 10–65) was upregulated (∼3-fold) in response to salt and heat stress. It also responds to drought stress and ozone exposure.30,31 The esterase lipase thioesterase family protein is widely involved in mobilizing oil reserves to provide carbon backbones for energy sources during abiotic and heavy metal stress.32,33 The other early response protein is Nudix hydrolase 6-like protein (W7U4T1), which was upregulated ∼64-fold at 0 h. The Arabidopsis Nudix hydrolases positively regulate salicylic acid-mediated signaling and modulate defense responses against abiotic and biotic stress.34,35
Figure 5.

Heatmap of the top 10 differentially expressed proteins in M. gaditana based on the contribution toward the dimensions in the biplot. Color scale indicates the log2 FC value. Significant levels of protein abundance are marked with an asterisk.
Another protein whose abundance is highly modulated during the hypersaline conditions (55 PSU) is quinoprotein amine dehydrogenase, beta chain-like (W7TI92). W7TI92 was upregulated ∼3-fold at 1 and 24 h and downregulated up to 5.5-fold at other time points (0, 6, and 72 h). The quinoprotein amine dehydrogenase, beta chain-like, has a beta-propeller structure, which is similar to the YVTN (Tyr-Val-Thr-Asn) repeat in the N-terminal of archaeal surface proteins. The structural similarity to the archaeal surface proteins is of high significance because it confers protection to the cell under extreme environmental conditions.36 Cystathionine beta-synthase (W7TGG0) which catalyzes the formation of cystathionine from l-serine and l-homocysteine is variably expressed throughout the growth phase and the highest expression is observed at 1 h (∼3-fold). The orthologue of W7TGG0 in rice plants (OsCBSCBSPB4), when overexpressed, was found to be responsible for the increase in biomass and delayed leaf senescence under extreme conditions (high salinity, dehydration, and high temperature).37
An orthologue of W7T0M7 [uncharacterized protein (fragment)] was upregulated by ∼32-fold at 6 h, and a moderate downregulation and upregulation were observed at 1, 24 h and 0, 72 h, respectively. The orthologue (A0A0A7CLB7) found in a fungus Thraustotheca clavate (E-value: 8.4 × 10⁻⁹) is a secreted protein that belongs to the RNase T2 family (IPR033697). Plant T2 RNases scavenge phosphate from ribonucleotides during senescence, and they also respond to wounding or pathogen invasion.38
On the other hand, the top contributing protein in 100 PSU is an uncharacterized protein (W7U7C1), which is predicted to be localized in chloroplasts, mitochondria, and the nucleus. The protein is found in high abundance (∼215-fold) during the initial phases (0 h) of growth in 100 PSU and at a modest upregulation of up to 8-fold and 3-fold at 6 and 72 h, respectively. The paralogue for W7U7C1 is an Hsp70-interacting protein (K8YSA6; E-value: 7.8 × 10–133), which is involved in Hsp70 stabilization in ADP (adenosine diphosphate)-bound conformation.39 Hsp70-interacting protein (Hip), which is ubiquitously found in animals and plants, is involved in the regulation of Hsp70-assisted protein folding and import.40−42 The strong upregulation of W7U7C1 during the initial stages of growth in 100 PSU signifies the importance of protein folding upon stress-induced protein unfolding, thereby maintaining proteostasis under stress conditions.43 One of the most abundant proteins expressed in response to the high saline condition is glutamate decarboxylase (W7TVC7). Relative to the control condition (38 PSU), W7TVC7 was strongly upregulated by 1450-fold at 0 h and then a moderate upregulation (up to 8-fold) was observed at other time points in 100 PSU. Plants produce γ-aminobutyrate by irreversible α-decarboxylation of glutamate by glutamate decarboxylase. γ-Aminobutyric acid acts as a natural defense against pests, and it is also associated with stress response in tobacco and Camellia sinensis (tea) plants.44,45
Proteins involved in translation were variably affected in the highest saline conditions (100 PSU). For instance, the ribosome recycling factor (W7TPY1) and 60S acidic ribosomal protein (W7TV03) responded well to the change in salinity levels. While the ribosome recycling factor protein (W7TPY1), which is involved in translation and chloroplast biogenesis, was upregulated up to 12-fold at 0 and 24 h, the 60S acidic ribosomal protein (W7TV03), which plays an essential part in the elongation of proteins,46 was consistently downregulated (up to ∼11-fold) at all time points, except at 1 h, where a modest upregulation (∼1.8-fold) was observed. The availability of nitrogen could limit the translation of protein, and therefore, plants have evolved a strategy to salvage nitrogen from an N-rich source such as ureides. Guanine deaminase (W7U1P4) is an enzyme involved in purine nucleotide catabolism, in which guanine is converted into xanthine and then to allantoin in further steps of catabolism, which is considered to be the first step of salvaging nitrogen from guanine. Allantoin accumulation is linked with salt stress tolerance in Arabidopsis thaliana.47,48 Likewise, in our study, the levels of guanine deaminase (W7U1P4) was upregulated (up to ∼8-fold) at 0, 24, and 72 h, which indicates a possible salvage mechanism of nitrogen by M. gaditana from purine nucleotides.
3.4. Salinity-Induced Proteome Changes in Cellular Metabolism
The proteome dynamics of M. gaditana was studied under salinity stress conditions. The differentially expressed proteins at various time points were subjected to the GO enrichment analysis, which revealed a diverse response to various high salinity levels (55 and 100 PSU). Similarly, we observed salinity-induced dynamics in the transcriptome of M. gaditana.(20) To understand the fate of cellular metabolism in hypersaline conditions and to establish a relationship between the physiology19 and transcriptome20 of salinity-induced M. gaditana, the differentially expressed proteins were analyzed for their biological significance in the following sections. The schematic overview of the key metabolic changes in salinity-stressed M. gaditana is shown in Figure 6.
Figure 6.

Key metabolic events in salinity-stressed M. gaditana. The regulation of proteins involved in various biosynthetic processes is indicated by green (upregulation) and red arrows (downregulation). LD: lipid droplet, N: nucleus, Mt: mitochondria, Ch: chloroplast, SOD: superoxide dismutase, CAT: catalase, GPDH: glycerol-6-phosphate dehydrogenase, DHAP: dihydroxy acetone phosphate, G3P: glycerol-3-phosphate, TAG: triacylglycerol, LACS: long-chain acyl-CoA synthetase, MDGS: monogalactosyldiacylglycerol synthase, DGAT: diacylglycerol acyltransferase, PPP: pentose phosphate pathway, and LHC: light-harvesting complex.
3.4.1. Mitigation of ROS Levels by Rapid Accumulation of Stress Response Proteins
An imbalance in light harvesting and utilization in salinity-stressed phototrophs could generate ROS, which is deleterious to the cell.49 ROS scavenging and homeostasis are critical for the shift in metabolism after salinity stress is imposed. Several proteins involved in oxidative stress responses were upregulated in hypersaline conditions (55 and 100 PSU) (Supporting Information, Table S4). Overall, the fold change of proteins involved in oxidative stress responses (such as SOD, CAT, and ferredoxin) was upregulated (up to ∼8-fold) at 1 h in 55 PSU and 1 h and 72 h in 100 PSU, except a few proteins such as SOD (W7TM73) and ferredoxins (W7TM71). The other SODs (W7T7U7, W7TGS6, and W7U428) were significantly expressed (upregulation up to ∼5-fold at 1 and 72 h) in 100 PSU. Several glutaredoxins, glutathione transferase (W7TNY9; W7U7N8), ascorbate peroxidase (W7U0U0), and thioredoxins were significantly altered in 100 PSU. ROS accumulation is a signature of the stress response in plants and microalgae. Comparable with the metabolic changes, the salinity-induced ROS accumulation triggered a set of ROS scavenging proteins such as SOD, CAT, glutathione peroxidase, and ferredoxin in M. gaditana. These proteins are involved in maintaining the redox status in higher plants.50−52 Likewise, the SOD level was increased in the halotolerant alga D. salina(13) and in a salinity tolerant strain of C. reinhardtii.(14) Antioxidant proteins help to maintain the ROS level inside the cell, and accumulation of such proteins have been found in salinity-treated plants.49 Mitigation of ROS levels by the rapid accumulation of scavenging enzymes could be an initial step toward the acclimatization of M. gaditana to saline conditions.
3.4.2. Hypersalinity Induces Upregulation of Osmolyte Biosynthesis Proteins
Osmolyte production is one of the primary responses of microalgae toward an increase in salinity.53 The osmolytes are highly soluble, low-molecular-weight molecules primarily accumulated in the cytoplasm. They range from simple carbohydrates such as trehalose, xylose, and sucrose to amino acids such as glycine, proline, or amino acid derivatives such as ornithine.54,55 In our study, we observed an increase in the protein expression levels of key enzymes involved in trehalose, glycine betaine, and glycerol biosynthetic pathways (Supporting Information, Table S5).
Trehalose is a nonreducing disaccharide formed by two glucose molecules linked by alpha-1,1-bond. Accumulation of trehalose during stress conditions such as drought, salt, heat, desiccation, and freeze stress has been reported across various microorganisms, including plants and microalgae.56−58 Moreover, trehalose confers tolerance against abiotic stresses in rice,59 and it is found to be essential for carbohydrate utilization in A. thaliana.60 The levels of trehalose-6-phosphate synthase (W7TQF4), trehalose phosphate synthase (W7TD30 and W7TBU1), and trehalose 6-phosphate phosphatase (W7TFM0) were significantly altered only in 100 PSU, and they were upregulated (up to ∼16-fold) during the later phases of growth (72 h).
The enzyme that primes the trehalose biosynthetic pathway, UDP-glucose pyrophosphorylase 2 (W7TFM0), by providing UDP-glucose as the substrate was significantly altered only in 100 PSU. The protein abundance increased (∼19-fold) at 72 h in 100 PSU. Interestingly, the expression pattern of UDP-glucose pyrophosphorylase 2 is similar to the trehalose biosynthetic proteins, implying the importance of the UDP-glucose pool for trehalose biosynthesis in hypersaline conditions (Figure 7).
Figure 7.

Salinity-induced temporal dynamics of proteins involved in trehalose biosynthesis in M. gaditana. Significant levels of protein abundance are marked with an asterisk.
Other proteins involved in compatible solute biosynthesis include choline dehydrogenase (W7TDH7 and W7TN63), which catalyzes the first step in glycine betaine biosynthesis through betaine aldehyde, and which was significantly altered only in 100 PSU. The maximum upregulation (up to ∼4-fold) occurred at 1 and 72 h postsalinity stress induction. Similar dynamics in betaine biosynthesis was observed in our earlier transcriptomic study. The assimilation of CO2 into glycine betaine in saline conditions was observed in A. halophytica.(61) Also, exogenous addition of glycine betaine to the growth medium of A. thaliana conferred tolerance to abiotic stresses.62
A key enzyme in glycerol (compatible solute) biosynthesis, glycerol-3-phosphate dehydrogenase (W7TIR6), is significantly upregulated (up to ∼8-fold) during later phases of growth (72 h) in 100 PSU. GPDH is located in the mitochondrial inner-membrane space or cytosol and catalyzes the reduction of dihydroxyacetone phosphate into glycerol-3-phosphate. It also links carbohydrate and lipid metabolism by providing glycerol backbones for TAG synthesis.63 Salinity-induced D. salina accumulates a significant amount of glycerol, which is comparable with GPDH activity.13
3.4.3. Proteins Involved in Fatty Acid Metabolism
Fatty acids are energy reservoirs of the cell that can be used under nutrient limitation conditions or any adverse environmental conditions.64 Cell membranes play a vital role in sensing the stress conditions and initiating the acclimatization reactions. The fluidity of plant and algal cell membrane can be altered by changing the fatty acid composition of the membrane. This phenomenon is beneficial for the organism to adapt to the stress conditions.65,66 Salt-induced changes in the neutral lipid content in M. gaditana have already been reported in our previous study.19 Comparable levels of transcript induction of lipid biosynthetic genes were observed in M. gaditana.20
In line with our physiological analysis, we have identified proteins involved in lipid and fatty acid metabolism (Supporting Information, Table S6). Four proteins involved in lipid metabolism were statistically altered in 55 PSU, among which are an esterase lipase thioesterase family protein (W7T3F9), fatty acid desaturase type 2 (W7UCJ8), and 3-oxoacyl-(acyl-carrier-protein) reductase (W7U8F0), which were upregulated more than 2-fold. 3-Oxoacyl-(acyl-carrier-protein) reductase (W7U8F0) is involved in the NADPH-dependent reduction of beta-ketoacyl-ACP substrates in the elongation cycle of fatty acid biosynthesis.67 An instantaneous response to salinity stress was observed with an abundance of esterase lipase thioesterase family protein (W7T3F9) during the early phases of growth (0 h) in both saline conditions (55 and 100 PSU). The implications of esterase lipase thioesterase family protein during the alleviation of salinity stress have been discussed earlier.
In 100 PSU, proteins involved in lipid biosynthesis such as long-chain acyl-CoA synthetase (W7TGG5), diacylglycerol acyltransferase family protein (W7U9S5), monogalactosyldiacylglycerol synthase, long-chain acyl-synthetase 7 (W7TAS6), and several lipases were statistically upregulated (up to ∼8-fold) during the later phases of growth (72 h). The significant upregulation of the proteins involved in lipid metabolism is consistent with our previous physiological studies on M. gaditana.(19) Long-chain acyl-CoA synthetase (LACS) is indispensable for the biosynthesis of fatty acid-derived molecules. In germinating A. thaliana seedlings, LACS activates the free fatty acids to the β-oxidation pathway for the removal of the two-carbon molecule in the form of acetyl-CoA.68 The acetyl-CoA thus formed enters the tricarboxylic acid (TCA) cycle for the production of cellular energy.69 It is therefore evident that M. gaditana prefers β-oxidation of accumulated fatty acid for sustaining the energy requirements in hypersaline conditions. Though we observed several proteins involved in β-oxidation of lipids upregulated, a comparable upregulation (∼8-fold) of the diacylglycerol acyltransferase family protein (W7U9S5), which is involved in TAG synthesis is observed during the later phases (72 h) in 100 PSU. Concurrently, with an exception of one isoform of triose phosphate isomerase (W7T695), all the glycolytic enzymes were upregulated (up to ∼8-fold) in 100 PSU at 72 h (Supporting Information, Table S1). Synchronized upregulation of lipid biosynthetic and glycolytic proteins may also explain the source of acetyl-CoA for TAG biosynthesis. This phenomenon could account for a steady, but a not sharp, increase in the neutral lipid content in M. gaditana.(19)A. thaliana diacylglycerol acyltransferase mutants were sensitive to several stress conditions, implying a possible role in stress mitigation.70 Lipolytic protein g-d-s-l family protein (W7TVB2) was significantly upregulated (up to ∼64-fold) at later phases of growth in 100 PSU. The lipolytic protein g-d-s-l family has been studied in plant species such as Arabidopsis, rice, and maize, and it has been associated with plant development and defense responses.71 For example, overexpression of GDSL-motif lipase increased salinity tolerance in transgenic A. thaliana.72 With evidence pointing toward the upregulation of both β-oxidation and lipid biosynthesis in mitigating stress conditions, we speculate that M. gaditana constantly remodels its lipid composition to accommodate energy and morphological needs in hypersaline conditions. A similar phenomenon was observed in nitrogen-limited oleaginous microalga Monoraphidium neglectum, in which the acyl chains generated due to upregulation of lipase genes were shuttled between membrane lipids and the TAG pool.73
3.4.4. Oxidative PPP Redirects the Carbon Flux toward Fatty Acid Biosynthesis under High Saline Conditions
The primary source of NADPH for desaturation and elongation reactions of polyunsaturated fatty acid is malic enzyme (ME). However, in our study, ME was not significantly upregulated. Various studies have established a connection between ME levels and neutral lipid accumulation.74 Also, the transcript abundance of ME was downregulated in our transcriptomic analysis on M. gaditana.(20) Corresponding to the previous hypothesis established on the use of oxidative PPP as an alternative source to TCA cycle for reducing equivalents, one of the key proteins (glucose-6-phosphate 1-dehydrogenase) involved in the PPP was significantly upregulated (∼16-fold) during the later phases of growth (24 and 72 h) in 100 PSU (Supporting Information, Table S6). Glucose-6-phosphate 1-dehydrogenase (W7TZ08) catalyzes the rate-limiting step of the oxidative PPP and provides reducing equivalents (NADPH) and pentose phosphates for fatty acid and nucleic acid biosynthesis, respectively.75 Thus, M. gaditana establishes lipid homeostasis via simultaneous activation of β-oxidation and TAG biosynthesis proteins in hypersaline conditions. Another rate-limiting enzyme in PPP, 6-phosphogluconate dehydrogenase (PGDH), decarboxylating (W7TN92) was significantly upregulated (up to ∼16-fold) during the later phases of growth (72 h), suggesting that PPP is enhanced under the high saline condition in M. gaditana. PPP is a key pathway in carbohydrate metabolism in plants and links other biosynthetic processes such as lipid, nucleotide, sugar, and aromatic amino acid biosynthesis by providing reducing equivalents (NADPH) and precursor molecules. The increase in abundance of the critical proteins involved in reductive PPP complements the increased glycerol biosynthetic protein abundance. PPP aids in glycerol accumulation by replenishing the carbon intermediates (ribulose-5-P). A similar trend was observed in higher plants (rice and wheat), where salt stress induced the expression of PGDH and GPDH.76 Our results suggest that PPP helps in redirecting the carbon flux toward fatty acid biosynthesis in hypersaline conditions in M. gaditana.
3.4.5. Photosynthesis and Redox Energy Metabolism
Salinity stress is often linked with the reduction in photosynthetic efficiency,19 primarily due to the damage caused by ROS to light-harvesting complexes (LHCs) and oxygen evolution factor proteins of PSI.77 In other instances, cessation of PSII activity was observed in Dunaliella tertiolecta and Nannochloropsis sp. in hypersaline conditions.78,79 A comprehensive list of differentially expressed proteins involved in photosynthesis is provided in Supporting Information, Table S7.
Porphobilinogen deaminase (W7UC09), which catalyzes the primary step of chlorophyll biosynthesis,80 was downregulated (up to ∼4-fold) throughout the growth phase (significant downregulation at 72 h), except at 1 h. The reduction in the abundance of a critical chlorophyll biosynthetic protein was reflected in the reduction of the chlorophyll content in salinity-stressed M. gaditana.(19) Reduction in chlorophyll biosynthetic protein levels was also observed in salinity-stressed D. salina.13 Reduction in chlorophyll levels in stress conditions can be associated either with the cessation of biosynthesis or dilution by cellular growth. The latter was reported in C. reinhardtii,81 while the former phenomenon was observed in our case. Interestingly, various proteins associated with PSII (oxygen-evolving complex, D1 protein, D3 protein, PsbP, cytochrome c, ferredoxin-NADP reductase, PSII 47 kDa protein, and LHC proteins) and PSI (apoprotein A1, A2, and PSI reaction center proteins) were upregulated (up to ∼8-fold) during the initial phases of growth (0 and 1 h) in both the salinity levels (55 and 100 PSU). A few PSII and PSI proteins were also upregulated (up to ∼8-fold) during the later phases of growth in 100 PSU. The inner antenna PSII 47 kDa protein is conserved and is essential for assembling PSII in algae and higher plants.82 Cytochrome b559 subunit alpha (K9ZWI6) and cytochrome b559 subunit beta (K9ZVG9) protect PSII from photoinhibition by enhancing cyclic electron transport in C. reinhardtii,(83) which is significantly upregulated (up to ∼2-fold) in 55 PSU. Enhanced photosynthesis and energy metabolism in hypersaline conditions has been linked with increased CO2 fixation and glycerol biosynthesis in D. salina.(84) While it is unclear to us whether M. gaditana can perform photosynthesis with only a few of the PSI and PSII proteins upregulated, our physiological data suggest that photosynthesis is slightly improved in 55 PSU and heavily affected at 100 PSU.19
Several LHCs of PSII (LHCII) were found to be upregulated (up to ∼5-fold) in 55 (1 h) and 100 PSU (1 and 72 h). Enhancement of LHCII proteins was also observed upon palmella formation in salinity-induced D. salina. It has been shown that photodamage can be caused by energy imbalance due to stress conditions such as over exposure to light and nitrogen limitation.85−87 Additionally, during such stress conditions, the regulation of redox homeostasis in the chloroplast is enhanced by the reversible phosphorylation of LHCII proteins.88,89 LHC proteins, a diverse family of LHC proteins, are known to be involved in both light-harvesting and photoprotection. Strong upregulation of LHCRII proteins in response to light stress in marine diatoms Phaeodactylum tricornutum and Thalassiosira pseudonana suggests the involvement of LHCR proteins in photoprotection.90−92
In photosynthetic microorganisms and higher plants, carbonic anhydrases are responsible for converting HCO3– into CO2, which is then fixed by ribulose 1,5-bisphosphate carboxylase/oxygenase.93 There are multiple forms of carbonic anhydrases involved in a host of reactions in the cell and an external carbonic anhydrase that plays a role in CO2 concentrating mechanisms. Upregulation (up to ∼8-fold) of carbonic anhydrase (W7TZZ4) was observed only in 100 PSU at 72 h. The protein abundance of the target of carbon concentrating mechanism (CCM), ribulose bisphosphate carboxylase (K9ZV74 and K9ZWI1), was not significant. Thus, the protein abundance of carbonic anhydrase could be beneficial for the cell under adverse conditions rather than to invest in an energetic input for Rubisco biosynthesis.94 Upregulation of external CA is induced by hypersaline conditions in Dunaliella salina as dissolved CO2 levels are lower with increasing salinity,13 while Rubisco activity was inhibited in response to hypersaline conditions in D. salina.95
4. Conclusions
The current study aimed to understand the temporal proteome dynamics during acclimatization to hypersaline conditions (55 and 100 PSU). The time points and salinity conditions were chosen based on our previous physiological studies on M. gaditana in hypersaline conditions. Significantly altered proteins at each time point were enriched with GO terms using Fisher’s exact analysis. GO-enrichment revealed the acclimatization path of M. gaditana toward hypersaline conditions. The salinity level of 100 PSU had a significant impact on the proteome of M. gaditana. CA revealed the SRPs, and their possible metabolic implications were analyzed. Proteins involved in lipid and osmolyte biosynthesis were observed to be upregulated in hypersaline conditions, which could be one of the possible strategies of M. gaditana in acclimatizing to hypersaline conditions. Osmolyte helps in retaining the cellular morphology by acting as regulators of turgor pressure. Lipid biosynthetic proteins were upregulated in hypersaline conditions, so as the proteins involved in fatty acid oxidation. The oxidized product could serve as a precursor for various biosynthetic pathways. Protein levels and the physiology of M. gaditana in hypersaline conditions correspond to each other. This study provides a comprehensive overview of the temporal proteome level changes in M. gaditana in hypersaline conditions. A probable acclimatization strategy of M. gaditana in hypersaline conditions was discussed, emphasizing on osmolyte, lipid and photosynthesis, and redox energy metabolism pathways. The proteome analysis suggests a possible route toward acclimatization and potential target proteins for engineering salinity-tolerant oleaginous microalgal strains.
Acknowledgments
The authors acknowledge the technical support from the Monash Proteomics & Metabolomics Facility, Monash University, Australia. This work was supported by the IITB-Monash Research Academy, IITB, Mumbai, India and Reliance Industries Limited, India (IMURA0304). S.S. would like to acknowledge fund support from Department of Biotechnology project—DBT PAN IIT Centre for Bioenergy grant (BT/EB/PANIIT/2012).
Supporting Information Available
The Supporting Information is available free of charge at https://pubs.acs.org/doi/10.1021/acsomega.1c02786.
List of differentially expressed proteins in M. gaditana CCMP526 in hypersaline conditions; functional category enrichment analysis (Fisher’s exact test) of M. gaditana CCMP526 grown in 55 PSU at different time points; functional category enrichment analysis (Fisher’s exact test) of M. gaditana CCMP526 grown in 100 PSU at different time points; temporal abundance of proteins involved in the oxidative stress response in M. gaditana CCMP526 grown in hypersaline conditions; temporal abundance of proteins involved in osmolyte biosynthesis in M. gaditana CCMP526 grown in hypersaline conditions; temporal abundance of proteins involved in fatty acid metabolism in M. gaditana CCMP526 grown in hypersaline conditions; and temporal abundance of proteins involved in photosynthesis in M. gaditana CCMP526 grown in hypersaline conditions (XLSX)
The authors declare no competing financial interest.
Supplementary Material
References
- Georgianna D. R.; Mayfield S. P. Exploiting Diversity and Synthetic Biology for the Production of Algal Biofuels. Nature 2012, 488, 329–335. 10.1038/nature11479. [DOI] [PubMed] [Google Scholar]
- Brennan L.; Owende P. Biofuels from Microalgae—a Review of Technologies for Production, Processing, and Extractions of Biofuels and Co-Products. Renewable Sustainable Energy Rev. 2010, 14, 557–577. 10.1016/j.rser.2009.10.009. [DOI] [Google Scholar]
- Doan T. T. Y.; Sivaloganathan B.; Obbard J. P. Screening of Marine Microalgae for Biodiesel Feedstock. Biomass Bioenergy 2011, 35, 2534–2544. 10.1016/j.biombioe.2011.02.021. [DOI] [Google Scholar]
- Corteggiani Carpinelli E.; Telatin A.; Vitulo N.; Forcato C.; D’Angelo M.; Schiavon R.; Vezzi A.; Giacometti G. M.; Morosinotto T.; Valle G. Chromosome Scale Genome Assembly and Transcriptome Profiling of Nannochloropsis gaditana in Nitrogen Depletion. Mol. Plant 2014, 7, 323–335. 10.1093/mp/sst120. [DOI] [PubMed] [Google Scholar]
- Huertas E.; Montero O.; Lubián L. M. Effects of Dissolved Inorganic Carbon Availability on Growth, Nutrient Uptake and Chlorophyll Fluorescence of Two Species of Marine Microalgae. Aquac. Eng. 2000, 22, 181–197. 10.1016/s0144-8609(99)00038-2. [DOI] [Google Scholar]
- Simionato D.; Sforza E.; Corteggiani Carpinelli E.; Bertucco A.; Giacometti G. M.; Morosinotto T. Acclimation of Nannochloropsis gaditana to Different Illumination Regimes: Effects on Lipids Accumulation. Bioresour. Technol. 2011, 102, 6026–6032. 10.1016/j.biortech.2011.02.100. [DOI] [PubMed] [Google Scholar]
- Wijffels R. H.; Barbosa M. J. An Outlook on Microalgal Biofuels. Science 2010, 329, 796–799. 10.1126/science.1189003. [DOI] [PubMed] [Google Scholar]
- Kim B.-H.; Ramanan R.; Kang Z.; Cho D.-H.; Oh H.-M.; Kim H.-S. Chlorella sorokiniana HS1, a Novel Freshwater Green Algal Strain, Grows and Hyperaccumulates Lipid Droplets in Seawater Salinity. Biomass Bioenergy 2016, 85, 300–305. 10.1016/j.biombioe.2015.12.026. [DOI] [Google Scholar]
- Perrineau M.-M.; Zelzion E.; Gross J.; Price D. C.; Boyd J.; Bhattacharya D. Evolution of Salt Tolerance in a Laboratory Reared Population of Chlamydomonas reinhardtii. Environ. Microbiol. 2014, 16, 1755–1766. 10.1111/1462-2920.12372. [DOI] [PubMed] [Google Scholar]
- Takagi M.; Karseno T.; Yoshida T. Effect of Salt Concentration on Intracellular Accumulation of Lipids and Triacylglyceride in Marine Microalgae Dunaliella Cells. J. Biosci. Bioeng. 2006, 101, 223–226. 10.1263/jbb.101.223. [DOI] [PubMed] [Google Scholar]
- Ho S. H.; Nakanishi A.; Kato Y.; Yamasaki H.; Chang J. S.; Misawa N.; Hirose Y.; Minagawa J.; Hasunuma T.; Kondo A. Dynamic Metabolic Profiling Together with Transcription Analysis Reveals Salinity-Induced Starch-to-Lipid Biosynthesis in Alga Chlamydomonas Sp. JSC4. Sci. Rep. 2017, 7, 45471. 10.1038/srep45471. [DOI] [PMC free article] [PubMed] [Google Scholar]
- Katz A.; Waridel P.; Shevchenko A.; Pick U. Salt-Induced Changes in the Plasma Membrane Proteome of the Halotolerant Alga Dunaliella salina as Revealed by Blue Native Gel Electrophoresis and Nano-LC-MS/MS Analysis. Mol. Cell. Proteom. 2007, 6, 1459–1472. 10.1074/mcp.m700002-mcp200. [DOI] [PubMed] [Google Scholar]
- Wei S.; Bian Y.; Zhao Q.; Chen S.; Mao J.; Song C.; Cheng K.; Xiao Z.; Zhang C.; Ma W.; Zou H.; Ye M.; Dai S. Salinity-Induced Palmella Formation Mechanism in Halotolerant Algae Dunaliella salina Revealed by Quantitative Proteomics and Phosphoproteomics. Front. Plant Sci. 2017, 8, 810. 10.3389/fpls.2017.00810. [DOI] [PMC free article] [PubMed] [Google Scholar]
- Sithtisarn S.; Yokthongwattana K.; Mahong B.; Roytrakul S.; Paemanee A.; Phaonakrop N.; Yokthongwattana C. Comparative Proteomic Analysis of Chlamydomonas reinhardtii Control and a Salinity-Tolerant Strain Revealed a Differential Protein Expression Pattern. Planta 2017, 246, 843–856. 10.1007/s00425-017-2734-4. [DOI] [PubMed] [Google Scholar]
- Aghaei K.; Ehsanpour A. A.; Komatsu S. Proteome Analysis of Potato under Salt Stress. J. Proteome Res. 2008, 7, 4858–4868. 10.1021/pr800460y. [DOI] [PubMed] [Google Scholar]
- Silveira J. A. G.; Carvalho F. E. L. Proteomics, Photosynthesis and Salt Resistance in Crops: An Integrative View. J. Proteom. 2016, 143, 24–35. 10.1016/j.jprot.2016.03.013. [DOI] [PubMed] [Google Scholar]
- Pandit P. R.; Fulekar M. H.; Karuna M. S. L. Effect of Salinity Stress on Growth, Lipid Productivity, Fatty Acid Composition, and Biodiesel Properties in Acutodesmus obliquus and Chlorella Vulgaris. Environ. Sci. Pollut. Res. 2017, 24, 13437–13451. 10.1007/s11356-017-8875-y. [DOI] [PubMed] [Google Scholar]
- Fawley M. W.; Jameson I.; Fawley K. P. The Phylogeny of the Genus Nannochloropsis (Monodopsidaceae, Eustigmatophyceae), with Descriptions of N. australis Sp. Nov. and Microchloropsis Gen. Nov. Phycologia 2015, 54, 545–552. 10.2216/15-60.1. [DOI] [Google Scholar]
- Karthikaichamy A. Temporal Acclimation of Microchloropsis gaditana CCMP526 in Response to Hypersalinity. Bioresour. Technol. 2018, 8, 23. 10.1016/j.biortech.2018.01.062. [DOI] [PubMed] [Google Scholar]
- Karthikaichamy A.; Beardall J.; Coppel R.; Noronha S.; Srivastava S.; Bulach D.. Temporal Transcriptome Profiling of Microchloropsis gaditana CCMP526 under Hyper-Saline Conditions. 2020, bioRxiv:10.1101/2020.06.07.139238, accessed 22-07-2020. [Google Scholar]
- Karthikaichamy A.; Deore P.; Rai V.; Bulach D.; Beardall J.; Noronha S.; Srivastava S. Time for Multiple Extraction Methods in Proteomics? A Comparison of Three Protein Extraction Methods in the Eustigmatophyte Alga Microchloropsis gaditana CCMP526. OMICS 2017, 21, 678–683. 10.1089/omi.2017.0128. [DOI] [PubMed] [Google Scholar]
- Doerr A. DIA Mass Spectrometry. Nat. Methods 2015, 12, 35. 10.1038/nmeth.3234. [DOI] [Google Scholar]
- Vizcaíno J. A.; Csordas A.; Del-Toro N.; Dianes J. A.; Griss J.; Lavidas I.; Mayer G.; Perez-Riverol Y.; Reisinger F.; Ternent T.; Xu Q.-W.; Wang R.; Hermjakob H. Update of the PRIDE Database and Its Related Tools. Nucleic Acids Res. 2016, 44, D447–D456. 10.1093/nar/gkv1145. [DOI] [PMC free article] [PubMed] [Google Scholar]
- Conesa A.; Götz S.; García-Gómez J. M.; Terol J.; Talón M.; Robles M. Blast2GO: A Universal Tool for Annotation, Visualization and Analysis in Functional Genomics Research. Bioinformatics 2005, 21, 3674–3676. 10.1093/bioinformatics/bti610. [DOI] [PubMed] [Google Scholar]
- Supek F.; Bošnjak M.; Škunca N.; Šmuc T. REVIGO Summarizes and Visualizes Long Lists of Gene Ontology Terms. PLoS One 2011, 6, e21800 10.1371/journal.pone.0021800. [DOI] [PMC free article] [PubMed] [Google Scholar]
- Greenacre M. J. Biplots in Correspondence Analysis. J. Appl. Stat. 1993, 20, 251–269. 10.1080/02664769300000021. [DOI] [Google Scholar]
- Fellenberg K.; Hauser N. C.; Brors B.; Neutzner A.; Hoheisel J. D.; Vingron M. Correspondence Analysis Applied to Microarray Data. Proc. Natl. Acad. Sci. 2001, 98, 10781–10786. 10.1073/pnas.181597298. [DOI] [PMC free article] [PubMed] [Google Scholar]
- Kishino H.; Waddell P. J. Correspondence Analysis of Genes and Tissue Types and Finding Genetic Links from Microarray Data. Genome Informatics 2000, 11, 83–95. [PubMed] [Google Scholar]
- Dray S.; Dufour A.-B. The Ade4 Package: Implementing the Duality Diagram for Ecologists. J. Stat. Softw. 2007, 22, 1–20. 10.18637/jss.v022.i04. [DOI] [Google Scholar]
- Abdeen A.; Schnell J.; Miki B. Transcriptome Analysis Reveals Absence of Unintended Effects in Drought-Tolerant Transgenic Plants Overexpressing the Transcription Factor ABF3. BMC Genomics 2010, 11, 69. 10.1186/1471-2164-11-69. [DOI] [PMC free article] [PubMed] [Google Scholar]
- Suzuki N.; Bassil E.; Hamilton J. S.; Inupakutika M. A.; Zandalinas S. I.; Tripathy D.; Luo Y.; Dion E.; Fukui G.; Kumazaki A.; Nakano R.; Rivero R. M.; Verbeck G. F.; Azad R. K.; Blumwald E.; Mittler R. ABA Is Required for Plant Acclimation to a Combination of Salt and Heat Stress. PLoS One 2016, 11, e0147625 10.1371/journal.pone.0147625. [DOI] [PMC free article] [PubMed] [Google Scholar]
- Gao W.; Li H. Y.; Xiao S.; Chye M. L. Acyl-CoA-Binding Protein 2 Binds Lysophospholipase 2 and LysoPC to Promote Tolerance to Cadmium-Induced Oxidative Stress in Transgenic Arabidopsis. Plant J. 2010, 62, 989–1003. 10.1111/j.1365-313X.2010.04209.x. [DOI] [PubMed] [Google Scholar]
- Troncoso-Ponce M. A.; Cao X.; Yang Z.; Ohlrogge J. B. Lipid Turnover during Senescence. Plant Sci. 2013, 205–206, 13–19. 10.1016/j.plantsci.2013.01.004. [DOI] [PubMed] [Google Scholar]
- Ge X.; Xia Y. The Role of AtNUDT7, a Nudix Hydrolase, in the Plant Defense Response. Plant Signaling Behav. 2008, 3, 119–120. 10.4161/psb.3.2.5019. [DOI] [PMC free article] [PubMed] [Google Scholar]
- Jambunathan N.; Mahalingam R. Analysis of Arabidopsis Growth Factor Gene 1 (GFG1) Encoding a Nudix Hydrolase during Oxidative Signaling. Planta 2006, 224, 1–11. 10.1007/s00425-005-0183-y. [DOI] [PubMed] [Google Scholar]
- Jing H.; Takagi J.; Liu J.-h.; Lindgren S.; Zhang R.-g.; Joachimiak A.; Wang J.-h.; Springer T. A. Archaeal Surface Layer Proteins Contain β Propeller, PKD, and β Helix Domains and Are Related to Metazoan Cell Surface Proteins. Structure 2002, 10, 1453–1464. 10.1016/s0969-2126(02)00840-7. [DOI] [PubMed] [Google Scholar]
- Kumar R.; Subba A.; Kaur C.; Ariyadasa T. U.; Sharan A.; Pareek A.; K Sopory S.; L Singla-Pareek S. OsCBSCBSPB4 Is a Two Cystathionine-β-Synthase Domain-Containing Protein from Rice That Functions in Abiotic Stress Tolerance. Curr. Genomics 2018, 19, 50–59. 10.2174/1389202918666170228141706. [DOI] [PMC free article] [PubMed] [Google Scholar]
- Deshpande R. A.; Shankar V. Ribonucleases from T2 Family. Crit. Rev. Microbiol. 2002, 28, 79–122. 10.1080/1040-840291046704. [DOI] [PubMed] [Google Scholar]
- Palleros D. R.; Raid K. L.; Shi L.; Welch W. J.; Fink A. L. ATP-Induced Protein Hsp70 Complex Dissociation Requires K+ but Not ATP Hydrolysis. Nature 1993, 365, 664–666. 10.1038/365664a0. [DOI] [PubMed] [Google Scholar]
- Boorstein W. R.; Ziegelhoffer T.; Craig E. A. Molecular Evolution of the HSP70 Multigene Family. J. Mol. Evol. 1994, 38, 1–17. 10.1007/BF00175490. [DOI] [PubMed] [Google Scholar]
- Boston R. S.; Viitanen P. V.; Vierling E. Molecular Chaperones and Protein Folding in Plants. Plant Mol. Biol. 1996, 32, 191–222. 10.1007/978-94-009-0353-1_9. [DOI] [PubMed] [Google Scholar]
- Miernyk J. A. Protein Folding in the Plant Cell. Plant Physiol. 1999, 121, 695–703. 10.1104/pp.121.3.695. [DOI] [PMC free article] [PubMed] [Google Scholar]
- Kim Y. E.; Hipp M. S.; Bracher A.; Hayer-Hartl M.; Ulrich Hartl F. Molecular Chaperone Functions in Protein Folding and Proteostasis. Annu. Rev. Biochem. 2013, 82, 323–355. 10.1146/annurev-biochem-060208-092442. [DOI] [PubMed] [Google Scholar]
- McLean M. D.; Yevtushenko D. P.; Deschene A.; Van Cauwenberghe O. R.; Makhmoudova A.; Potter J. W.; Bown A. W.; Shelp B. J. Overexpression of Glutamate Decarboxylase in Transgenic Tobacco Plants Confers Resistance to the Northern Root-Knot Nematode. Mol. Breed. 2003, 11, 277–285. 10.1023/A:1023483106582. [DOI] [Google Scholar]
- Mei X.; Chen Y.; Zhang L.; Fu X.; Wei Q.; Grierson D.; Zhou Y.; Huang Y.; Dong F.; Yang Z. Dual Mechanisms Regulating Glutamate Decarboxylases and Accumulation of Gamma-Aminobutyric Acid in Tea (Camellia Sinensis) Leaves Exposed to Multiple Stresses. Sci. Rep. 2016, 6, 23685. 10.1038/srep23685. [DOI] [PMC free article] [PubMed] [Google Scholar]
- Naganuma T.; Nomura N.; Yao M.; Mochizuki M.; Uchiumi T.; Tanaka I. Structural Basis for Translation Factor Recruitment to the Eukaryotic/Archaeal Ribosomes. J. Biol. Chem. 2010, 285, 4747–4756. 10.1074/jbc.m109.068098. [DOI] [PMC free article] [PubMed] [Google Scholar]
- Irani S.; Todd C. D. Ureide Metabolism under Abiotic Stress in Arabidopsis thaliana. J. Plant Physiol. 2016, 199, 87–95. 10.1016/j.jplph.2016.05.011. [DOI] [PubMed] [Google Scholar]
- Lescano C. I.; Martini C.; González C. A.; Desimone M. Allantoin Accumulation Mediated by Allantoinase Downregulation and Transport by Ureide Permease 5 Confers Salt Stress Tolerance to Arabidopsis Plants. Plant Mol. Biol. 2016, 91, 581–595. 10.1007/s11103-016-0490-7. [DOI] [PubMed] [Google Scholar]
- Miller G.; Suzuki N.; Ciftci-Yilmaz S.; Mittler R. Reactive Oxygen Species Homeostasis and Signalling during Drought and Salinity Stresses. Plant, Cell Environ. 2010, 33, 453–467. 10.1111/j.1365-3040.2009.02041.x. [DOI] [PubMed] [Google Scholar]
- Chen S.; Gollop N.; Heuer B. Proteomic Analysis of Salt-Stressed Tomato (Solanum lycopersicum) Seedlings: Effect of Genotype and Exogenous Application of Glycinebetaine. J. Exp. Bot. 2009, 60, 2005–2019. 10.1093/jxb/erp075. [DOI] [PMC free article] [PubMed] [Google Scholar]
- Kav N. N. V.; Srivastava S.; Goonewardene L.; Blade S. F. Proteome-Level Changes in the Roots of Pisum sativum in Response to Salinity. Ann. Appl. Biol. 2004, 145, 217–230. 10.1111/j.1744-7348.2004.tb00378.x. [DOI] [Google Scholar]
- Sugimoto M.; Takeda K. Proteomic Analysis of Specific Proteins in the Root of Salt-Tolerant Barley. Biosci., Biotechnol., Biochem. 2009, 73, 2762–2765. 10.1271/bbb.90456. [DOI] [PubMed] [Google Scholar]
- Flowers T. J.; Colmer T. D. Salinity Tolerance in Halophytes. New Phytol. 2008, 179, 945–963. 10.1111/j.1469-8137.2008.02531.x. [DOI] [PubMed] [Google Scholar]
- Flowers T. J.; Troke P. F.; Yeo A. R. The Mechanism of Salt Tolerance in Halophytes. Annu. Rev. Plant Physiol. 1977, 28, 89–121. 10.1146/annurev.pp.28.060177.000513. [DOI] [Google Scholar]
- Leigh R. A.; Wyn Jones R. G. A Hypothesis Relating Critical Potassium Concentrations for Growth to the Distribution and Functions of This Ion in the Plant Cell. New Phytol. 1984, 97, 1–13. 10.1111/j.1469-8137.1984.tb04103.x. [DOI] [Google Scholar]
- Goddijn O.; van Dun K. Trehalose Metabolism in Plants. Trends Plant Sci. 1999, 4, 315–319. 10.1016/s1360-1385(99)01446-6. [DOI] [PubMed] [Google Scholar]
- Hershkovitz N.; Oren A.; Cohen Y. Accumulation of Trehalose and Sucrose in Cyanobacteria Exposed to Matric Water Stress. Appl. Environ. Microbiol. 1991, 57, 645–648. 10.1128/aem.57.3.645-648.1991. [DOI] [PMC free article] [PubMed] [Google Scholar]
- Hirth M.; Liverani S.; Mahlow S.; Bouget F.-Y.; Pohnert G.; Sasso S. Metabolic Profiling Identifies Trehalose as an Abundant and Diurnally Fluctuating Metabolite in the Microalga Ostreococcus tauri. Metabolomics 2017, 13, 68. 10.1007/s11306-017-1203-1. [DOI] [PMC free article] [PubMed] [Google Scholar]
- Garg A. K.; Kim J.-K.; Owens T. G.; Ranwala A. P.; Choi Y. D.; Kochian L. V.; Wu R. J. Trehalose Accumulation in Rice Plants Confers High Tolerance Levels to Different Abiotic Stresses. Proc. Natl. Acad. Sci. 2002, 99, 15898–15903. 10.1073/pnas.252637799. [DOI] [PMC free article] [PubMed] [Google Scholar]
- Schluepmann H.; Pellny T.; van Dijken A.; Smeekens S.; Paul M. Trehalose 6-Phosphate Is Indispensable for Carbohydrate Utilization and Growth in Arabidopsis thaliana. Proc. Natl. Acad. Sci. 2003, 100, 6849–6854. 10.1073/pnas.1132018100. [DOI] [PMC free article] [PubMed] [Google Scholar]
- Takabe T.; Incharoensakdi A.; Arakawa K.; Yokota S. CO2 Fixation Rate and RuBisCO Content Increase in the Halotolerant Cyanobacterium, Aphanothece halophytica, Grown in High Salinities. Plant Physiol. 1988, 88, 1120–1124. 10.1104/pp.88.4.1120. [DOI] [PMC free article] [PubMed] [Google Scholar]
- Hibino T.; Waditee R.; Araki E.; Ishikawa H.; Aoki K.; Tanaka Y.; Takabe T. Functional Characterization of Choline Monooxygenase, an Enzyme for Betaine Synthesis in Plants. J. Biol. Chem. 2002, 277, 41352–41360. 10.1074/jbc.m205965200. [DOI] [PubMed] [Google Scholar]
- Ou X.; Ji C.; Han X.; Zhao X.; Li X.; Mao Y.; Wong L.-L.; Bartlam M.; Rao Z. Crystal Structures of Human Glycerol 3-Phosphate Dehydrogenase 1 (GPD1). J. Mol. Biol. 2006, 357, 858–869. 10.1016/j.jmb.2005.12.074. [DOI] [PubMed] [Google Scholar]
- Mata-Pérez C.; Sánchez-Calvo B.; Padilla M. N.; Begara-Morales J. C.; Luque F.; Melguizo M.; Jiménez-Ruiz J.; Fierro-Risco J.; Peñas-Sanjuán A.; Valderrama R.; Corpas F. J.; Barroso J. B. Nitro-Fatty Acids in Plant Signaling: Nitro-Linolenic Acid Induces the Molecular Chaperone Network in Arabidopsis. Plant Physiol. 2016, 170, 686–701. 10.1104/pp.15.01671. [DOI] [PMC free article] [PubMed] [Google Scholar]
- Mikami K.; Murata N. Membrane Fluidity and the Perception of Environmental Signals in Cyanobacteria and Plants. Prog. Lipid Res. 2003, 42, 527–543. 10.1016/s0163-7827(03)00036-5. [DOI] [PubMed] [Google Scholar]
- Wada H.; Gombos Z.; Murata N. Contribution of Membrane Lipids to the Ability of the Photosynthetic Machinery to Tolerate Temperature Stress. Proc. Natl. Acad. Sci. 1994, 91, 4273–4277. 10.1073/pnas.91.10.4273. [DOI] [PMC free article] [PubMed] [Google Scholar]
- Lai C.-Y.; Cronan J. E. Isolation and Characterization of β-Ketoacyl-Acyl Carrier Protein Reductase (FabG) Mutants of Escherichia coli and Salmonella enterica Serovar Typhimurium. J. Bacteriol. 2004, 186, 1869–1878. 10.1128/jb.186.6.1869-1878.2004. [DOI] [PMC free article] [PubMed] [Google Scholar]
- Fulda M.; Schnurr J.; Abbadi A.; Heinz E.; Browse J. Peroxisomal Acyl-CoA Synthetase Activity Is Essential for Seedling Development in Arabidopsis thaliana. Plant Cell 2004, 16, 394–405. 10.1105/tpc.019646. [DOI] [PMC free article] [PubMed] [Google Scholar]
- Gerhardt B. Fatty Acid Degradation in Plants. Prog. Lipid Res. 1992, 31, 417–446. 10.1016/0163-7827(92)90004-3. [DOI] [PubMed] [Google Scholar]
- Lu C.; Hills M. J. Arabidopsis Mutants Deficient in Diacylglycerol Acyltransferase Display Increased Sensitivity to Abscisic Acid, Sugars, and Osmotic Stress during Germination and Seedling Development. Plant Physiol. 2002, 129, 1352–1358. 10.1104/pp.006122. [DOI] [PMC free article] [PubMed] [Google Scholar]
- Brick D. J.; Brumlik M. J.; Buckley J. T.; Cao J.-X.; Davies P. C.; Misra S.; Tranbarger T. J.; Upton C. A New Family of Lipolytic Plant Enzymes with Members in Rice, Arabidopsis and Maize. FEBS Lett. 1995, 377, 475–480. 10.1016/0014-5793(95)01405-5. [DOI] [PubMed] [Google Scholar]
- Naranjo M. A.; Forment J.; Roldán M.; Serrano R.; Vicente O. Overexpression of Arabidopsis thaliana LTL1, a Salt-Induced Gene Encoding a GDSL-Motif Lipase, Increases Salt Tolerance in Yeast and Transgenic Plants. Plant, Cell Environ. 2006, 29, 1890–1900. 10.1111/j.1365-3040.2006.01565.x. [DOI] [PubMed] [Google Scholar]
- Jaeger D.; Winkler A.; Mussgnug J. H.; Kalinowski J.; Goesmann A.; Kruse O. Time-Resolved Transcriptome Analysis and Lipid Pathway Reconstruction of the Oleaginous Green Microalga Monoraphidium neglectum Reveal a Model for Triacylglycerol and Lipid Hyperaccumulation. Biotechnol. Biofuels 2017, 10, 197. 10.1186/s13068-017-0882-1. [DOI] [PMC free article] [PubMed] [Google Scholar]
- Zhu B.-H.; Zhang R.-H.; Lv N.-N.; Yang G.-P.; Wang Y.-S.; Pan K.-H. The Role of Malic Enzyme on Promoting Total Lipid and Fatty Acid Production in Phaeodactylum tricornutum. Front. Plant Sci. 2018, 9, 826. 10.3389/fpls.2018.00826. [DOI] [PMC free article] [PubMed] [Google Scholar]
- Wang Y.-P.; Zhou L.-S.; Zhao Y.-Z.; Wang S.-W.; Chen L.-L.; Liu L.-X.; Ling Z.-Q.; Hu F.-J.; Sun Y.-P.; Zhang J.-Y.; Yang C.; Yang Y.; Xiong Y.; Guan K. L.; Ye D. Regulation of G 6 PD Acetylation by SIRT2 and KAT9 Modulates NADPH Homeostasis and Cell Survival during Oxidative Stress. EMBO J. 2014, 33, 1304–1320. 10.1002/embj.201387224. [DOI] [PMC free article] [PubMed] [Google Scholar]
- Krishnaraj S.; Thorpe T. A. Salinity Stress Effects on [14C-1]-and [14C-6]-Glucose Metabolism of a Salt-Tolerant and Salt-Susceptible Variety of Wheat. Int. J. Plant Sci. 1996, 157, 110–117. 10.1086/297326. [DOI] [Google Scholar]
- Subramanyam R.; Jolley C.; Thangaraj B.; Nellaepalli S.; Webber A. N.; Fromme P. Structural and Functional Changes of PSI-LHCI Supercomplexes of Chlamydomonas reinhardtii Cells Grown under High Salt Conditions. Planta 2010, 231, 913–922. 10.1007/s00425-009-1097-x. [DOI] [PubMed] [Google Scholar]
- Gilmour D. J.; Hipkins M. F.; Webber A. N.; Baker N. R.; Boney A. D. The Effect of Ionic Stress on Photosynthesis in Dunaliella tertiolecta. Planta 1985, 163, 250–256. 10.1007/bf00393515. [DOI] [PubMed] [Google Scholar]
- Martínez-Roldán A. J.; Perales-Vela H. V.; Cañizares-Villanueva R. O.; Torzillo G. Physiological Response of Nannochloropsis Sp. to Saline Stress in Laboratory Batch Cultures. J. Appl. Phycol. 2014, 26, 115–121. 10.1007/s10811-013-0060-1. [DOI] [Google Scholar]
- Roberts A.; Gill R.; Hussey R. J.; Mikolajek H.; Erskine P. T.; Cooper J. B.; Wood S. P.; Chrystal E. J. T.; Shoolingin-Jordan P. M. Insights into the Mechanism of Pyrrole Polymerization Catalysed by Porphobilinogen Deaminase: High-Resolution X-Ray Studies of the Arabidopsis thaliana Enzyme. Acta Crystallogr., Sect. D: Biol. Crystallogr. 2013, 69, 471–485. 10.1107/s0907444912052134. [DOI] [PubMed] [Google Scholar]
- Juergens M. T.; Deshpande R. R.; Lucker B. F.; Park J.-J.; Wang H.; Gargouri M.; Holguin F. O.; Disbrow B.; Schaub T.; Skepper J. N.; Kramer D. M.; Gang D. R.; Hicks L. M.; Shachar-Hill Y. The Regulation of Photosynthetic Structure and Function during Nitrogen Deprivation in Chlamydomonas reinhardtii. Plant Physiol. 2015, 167, 558–573. 10.1104/pp.114.250530. [DOI] [PMC free article] [PubMed] [Google Scholar]
- Summer E. J.; Schmid V.; Bruns B. U.; Schmidt G. W. Requirement for the H Phosphoprotein in Photosystem II of Chlamydomonas reinhardtii. Plant Physiol. 1997, 113, 1359–1368. 10.1104/pp.113.4.1359. [DOI] [PMC free article] [PubMed] [Google Scholar]
- Burda K.; Kruk J.; Borgstädt R.; Stanek J.; Strzałka K.; Schmid G. H.; Kruse O. Mössbauer Studies of the Non-Heme Iron and Cytochrome B559 in a Chlamydomonas reinhardtii PSI- Mutant and Their Interactions with α-Tocopherol Quinone. FEBS Lett. 2003, 535, 159–165. 10.1016/s0014-5793(02)03895-4. [DOI] [PubMed] [Google Scholar]
- Liska A. J.; Shevchenko A.; Pick U.; Katz A. Enhanced Photosynthesis and Redox Energy Production Contribute to Salinity Tolerance in Dunaliella as Revealed by Homology-Based Proteomics. Plant Physiol. 2004, 136, 2806–2817. 10.1104/pp.104.039438. [DOI] [PMC free article] [PubMed] [Google Scholar]
- Remmers I. M.; Martens D. E.; Wijffels R. H.; Lamers P. P. Dynamics of Triacylglycerol and EPA Production in Phaeodactylum tricornutum under Nitrogen Starvation at Different Light Intensities. PLoS One 2017, 12, e0175630 10.1371/journal.pone.0175630. [DOI] [PMC free article] [PubMed] [Google Scholar]
- Remmers I. M.; D’Adamo S.; Martens D. E.; de Vos R. C. H.; Mumm R.; America A. H. P.; Cordewener J. H. G.; Bakker L. V.; Peters S. A.; Wijffels R. H.; Lamers P. P. Orchestration of Transcriptome, Proteome and Metabolome in the Diatom Phaeodactylum tricornutum during Nitrogen Limitation. Algal Res. 2018, 35, 33–49. 10.1016/j.algal.2018.08.012. [DOI] [Google Scholar]
- Erickson E.; Wakao S.; Niyogi K. K. Light Stress and Photoprotection in Chlamydomonas reinhardtii. Plant J. 2015, 82, 449–465. 10.1111/tpj.12825. [DOI] [PubMed] [Google Scholar]
- Grieco M.; Tikkanen M.; Paakkarinen V.; Kangasjärvi S.; Aro E.-M. Steady-State Phosphorylation of Light-Harvesting Complex II Proteins Preserves Photosystem I under Fluctuating White Light. Plant Physiol. 2012, 160, 1896–1910. 10.1104/pp.112.206466. [DOI] [PMC free article] [PubMed] [Google Scholar]
- Liang C.; Cao S.; Zhang X.; Zhu B.; Su Z.; Xu D.; Guang X.; Ye N. De Novo Sequencing and Global Transcriptome Analysis of Nannochloropsis Sp. (Eustigmatophyceae) Following Nitrogen Starvation. BioEnergy Res. 2013, 6, 494–505. 10.1007/s12155-012-9269-0. [DOI] [Google Scholar]
- Nymark M.; Valle K. C.; Brembu T.; Hancke K.; Winge P.; Andresen K.; Johnsen G.; Bones A. M. An Integrated Analysis of Molecular Acclimation to High Light in the Marine Diatom Phaeodactylum tricornutum. PLoS One 2009, 4, e7743 10.1371/journal.pone.0007743. [DOI] [PMC free article] [PubMed] [Google Scholar]
- Nymark M.; Valle K. C.; Hancke K.; Winge P.; Andresen K.; Johnsen G.; Bones A. M.; Brembu T. Molecular and Photosynthetic Responses to Prolonged Darkness and Subsequent Acclimation to Re-Illumination in the Diatom Phaeodactylum tricornutum. PLoS One 2013, 8, e58722 10.1371/journal.pone.0058722. [DOI] [PMC free article] [PubMed] [Google Scholar]
- Zhu S.-H.; Green B. R. Photoprotection in the Diatom Thalassiosira pseudonana: Role of LI818-like Proteins in Response to High Light Stress. Biochim. Biophys. Acta, Bioenerg. 2010, 1797, 1449–1457. 10.1016/j.bbabio.2010.04.003. [DOI] [PubMed] [Google Scholar]
- Espie G. S.; Kimber M. S. Carboxysomes: Cyanobacterial RubisCO Comes in Small Packages. Photosynth. Res. 2011, 109, 7–20. 10.1007/s11120-011-9656-y. [DOI] [PubMed] [Google Scholar]
- Young J. N.; Hopkinson B. M. The Potential for Co-Evolution of CO2-Concentrating Mechanisms and Rubisco in Diatoms. J. Exp. Bot. 2017, 68, 3751–3762. 10.1093/jxb/erx130. [DOI] [PubMed] [Google Scholar]
- Booth W. A.; Beardall J. Effects of Salinity on Inorganic Carbon Utilization and Carbonic Anhydrase Activity in the Halotolerant Alga Dunaliella salina (Chlorophyta). Phycologia 1991, 30, 220–225. 10.2216/i0031-8884-30-2-220.1. [DOI] [Google Scholar]
Associated Data
This section collects any data citations, data availability statements, or supplementary materials included in this article.