Abstract
The hallmark of Lafora disease, a fatal neurodegenerative disorder, is the accumulation of intracellular glycogen aggregates called Lafora bodies. Until recently, it was widely believed that brain Lafora bodies were present exclusively in neurons and thus that Lafora disease pathology derived from their accumulation in this cell population. However, recent evidence indicates that Lafora bodies are also present in astrocytes. To define the role of astrocytic Lafora bodies in Lafora disease pathology, we deleted glycogen synthase specifically from astrocytes in a mouse model of the disease (malinKO). Strikingly, blocking glycogen synthesis in astrocytes—thus impeding Lafora bodies accumulation in this cell type—prevented the increase in neurodegeneration markers, autophagy impairment, and metabolic changes characteristic of the malinKO model. Conversely, mice that over-accumulate glycogen in astrocytes showed an increase in these markers. These results unveil the deleterious consequences of the deregulation of glycogen metabolism in astrocytes and change the perspective that Lafora disease is caused solely by alterations in neurons.
Keywords: Lafora disease, glycogen, neurodegeneration, neuroinflammation, epilepsy
It was believed until recently that Lafora disease pathology derives exclusively from the accumulation of glycogen in the brain in the form of so-called Lafora bodies inside neurons. However, Duran et al. now show that it is the accumulation of Lafora bodies inside astrocytes that underlies neurodegeneration in Lafora disease.
Introduction
Glycogen, a branched polymer of glucose, is the only energy reservoir of the brain and it plays important roles in this organ.1,2 Recent work has demonstrated that astrocytes and neurons have an active glycogen metabolism that is key to their normal functioning.1-5 However, in some conditions, glycogen accumulates abnormally in the brain.6,7 The most striking example of this is Lafora disease, a neurodegenerative condition that presents as a severe progressive myoclonus epilepsy characterized by the presence of glycogen aggregates, called Lafora bodies. Lafora bodies are intracellular, aberrant glycogen aggregates that accumulate in several tissues, including the brain. Patients with Lafora disease initially present with myoclonic jerks followed by epileptic seizures resistant to treatment. This phase is followed by rapid neurodegeneration, dementia and finally death within 5–10 years after onset.8,9
Lafora disease is caused by mutations in one of two genes: EPM2A encoding laforin, a dual-specificity phosphatase, and EPM2B encoding malin, an E3 ubiquitin ligase. Mutations in either gene cause the same disease, thus indicating that the two proteins form a functional complex.10–12 Blocking brain glycogen synthesis in mouse models of Lafora disease prevents the progression of the disease.13–15 This observation thus demonstrates that the accumulation of glycogen aggregates underlies the aetiopathology of all aspects of the disease.
Until recently, it was widely assumed that glycogen aggregates in the brains of patients with Lafora disease and animal models accumulate exclusively in neurons8,16 and thus neuronal Lafora bodies were considered to be solely responsible for Lafora disease pathophysiology. In this regard, we demonstrated that glycogen accumulation in neurons induces their death by apoptosis.17 However, there is a growing body of evidence showing that Lafora bodies are also present in astrocytes. In 2011, we reported the presence of glycogen aggregates in both neurons and astrocytes of the malin knockout mouse model (malinKO).18 More recently, we19 and others20 further described the presence of these aggregates in astrocytes of Lafora disease mouse models, by means of co-localization with cell type-specific markers. We classified the glycogen aggregates in the brain into two types: astrocytic corpora amylacea-like bodies (CAL) and neuronal Lafora bodies (nLBs). The former are analogous to corpora amylacea, which are glycogen aggregates that normally accumulate in aged brains.21 In this regard, CAL: (i) are polymorphic; (ii) are found grouped in clusters; and (iii) co-localize with astrocytic markers. In contrast, nLBs: (i) are round and normally larger than CAL; (ii) co-localize with neuronal markers; and (iii) are not present in clusters but are isolated in the form of a single aggregate close to the neuronal nucleus.19
To determine which cell type contributes to the different Lafora disease pathophysiologies, we generated a malinKO mouse model in which the enzyme responsible for glycogen synthesis in the brain, namely the muscle isoform of glycogen synthase (MGS), is specifically ablated from astrocytes (malinKO+MGSGfap-KO). Our results show that most glycogen aggregates observed in the brains of malinKO mice are not present in the malinKO+MGSGfap-KO animals, thereby proving that these aggregates accumulate in astrocytes. Furthermore, the latter animals did not show an increase in neurodegeneration markers, autophagy impairment, or the metabolic changes typical of the malinKO mouse model, indicating that these symptoms are a consequence of the accumulation of astrocytic CAL. To corroborate these results, we generated mice that over-accumulate glycogen specifically in astrocytes. These animals also showed an increase in neurodegeneration markers. In contrast, the epileptic phenotype was not corrected in malinKO+MGSGfap-KO mice, indicating that the accumulation of astrocytic Lafora bodies is not the main driver of this symptom. Taken together, these results demonstrate the contribution of astrocytes to the pathology of Lafora disease and have important implications regarding the role of astrocytic metabolism in neurodegenerative diseases.
Materials and methods
Generation of malinKO+MGSGfap-KO and 9A-MGSGfap mice
To generate a malinKO mouse that is unable to accumulate glycogen in astrocytes (malinKO+MGSGfap-KO), we took advantage of our MGS conditional knockout model, which is based on Cre-Lox technology.1 The ablation of MGS specifically in astrocytes (MGSGfap-KO) was achieved by crossing this conditional knockout with mice expressing Cre recombinase under the control of a Gfap promoter (Gfap-Cre mice).5 The resulting mouse was then crossed with malinKO, the descendants were genotyped for the three alleles involved (malin, MGS and Cre), and the suitable genotypes were intercrossed to generate all the experimental groups. To generate mice that over-accumulate glycogen in astrocytes (9A-MGSGfap mice), we took advantage of our mouse model conditionally expressing a non-inactivatable form of MGS (9A-MGS).17 Again, we combined this animal with Gfap-Cre mice to drive the expression of 9A-MGS specifically to astrocytes.
Animal studies
All procedures were approved by the Barcelona Science Park’s Animal Experimentation Committee and were carried out following Spanish (BOE 34/11370-421, 2013) and European Union (2010/63/EU) regulations, and The National Institutes of Health guidelines for the care and use of laboratory animals. Mice were maintained in collective cages (up to five animals per cage) on a 12/12 h light/dark cycle under specific pathogen-free conditions in the Animal Research Center at the Barcelona Science Park. Animals were allowed access ad libitum to commercial mouse chow and water. After weaning at 3 weeks of age, tail clippings were taken for genotyping by quantitative PCR (performed by Transnetyx).
Biochemical analyses
Mice were deeply anaesthetized and then decapitated, and the brain was quickly removed and placed in liquid nitrogen. Whole brains were then pulverized in liquid nitrogen. For western blot analyses, fractions of the powder were weighed and homogenated in 10 volumes of ice-cold buffer containing 25 mM Tris-HCl (pH 7.4), 25 mM NaCl, 1% TritonTM X-100, 0.1% SDS, 0.5 mM EGTA, 10 mM sodium pyrophosphate, 1 mM sodium orthovanadate, 10 mM NaF, 25 nM okadaic acid and a protease inhibitor cocktail tablet (Roche). Homogenates were loaded in 10% acrylamide gels for SDS-PAGE and transferred to Immobilon membranes (Millipore). Antibodies against MGS (from Cell Signaling), laforin (a gift from Dr Santiago Rodríguez de Córdoba) and p62 (from Progen) were used. Proteins were detected by the ECL method (Immobilon Western Chemiluminescent HRP Substrate, Millipore). Loading control of the western blot membrane was performed using the RevertTM total protein stain. For glycogen measurements, fractions of the brain powder were boiled in 30% KOH for 15 min and glycogen was determined by an amyloglucosidase-based assay, as previously described.3 For quantitative (q)PCR, total RNA was isolated from fractions of brain powder using TRIzol® reagent (Life Technologies), purified with an RNeasy® Mini Kit (Qiagen) and treated with DNase I (Qiagen) to degrade genomic DNA. Reverse transcription was performed using qScript cDNA Synthesis Kit (Quanta Biosciences). Quantitative PCR was performed using a QuantStudioTM 6 Flex (Applied Biosystems). The following mouse-specific SYBR® Green sets of primers (Sigma) were used: C3 (forward: 5′-TCCTGAACTGGTCAACATGG-3′; reverse: 5′-AAACTGGGCAGCACGTATTC-3′); Ccl2 (forward: 5′-AGGTGTCCCAAAGAAGCTGTAG-3′; reverse: 5′-TCTGGACCCATTCCTTCTTG-3′); Lcn2 (forward: 5′-CAGAAGGCAGCTTTACGATG-3′; reverse: 5′-CCTGGAGCTTGGAACAAATG-3′); Cxcl10 (forward: 5′-CCGTCATTTTCTGCCTCATC-3′; reverse: 5′-CTCGCAGGGATGATTTCAAG-3′) and β-actin (Actβ, Actb), used as a housekeeping gene (forward: 5′-ACTGAGCTGCGTTTTACACC-3′; reverse: 5′-AGCCATGCCAATGTTGTCTC-3′). Samples were run as triplicates. For representation of the results, dCt was calculated as Ct (Actβ) − Ct (gene of interest), and average dCt from control hippocampus was used to calculate ddCT. Results are expressed as 2ddCt in relative units.
Histology
Animals were anaesthetized and perfused transcardiacally with PBS containing 4% of paraformaldehyde. Brains were removed, postfixed overnight with PBS 4% paraformaldehyde and embedded in paraffin. Paraffin coronal brain sections (3-μm thick) were cut using a Leica microtome. Periodic acid-Schiff (PAS) staining was carried out using an Artisan Link Pro machine (AR16592-2 kit, Artisan, Dako, Agilent). Immunostainings were performed using primary antibodies against MGS (ref. 3886 from Cell Signaling), GFAP (ref. MAB360, from Merck Millipore), and Iba1 (ref. 019-19741 from Wako). The secondary antibodies used were Goat Anti-Mouse (P0447, Dako, Agilent) or a BrightVision Poly-HRP-Anti Rabbit IgG (Immunologic, DPVR-110HRP). Antibody complexes were revealed with 3,3′-diaminobenzidine (K3468, Dako) with the same time exposure per antibody. Brightfield images were acquired with a NanoZoomer-2.0 HT C9600 digital scanner (Hamamatsu) equipped with a 20× objective. All images were visualized with the NDP.view 2 software (Hamamatsu, Photonics, France). QuPAth software was used to perform image analysis for quantifying the area of GFAP- or Iba1-positive pixels22 in haematoxylin-counterstained sections. The region of interest (hippocampus area) was selected manually. Results are the percentage of the positive area following the equation: % of positive pixels = positive pixels × 100 / (positive + negative pixels).
Assessment of kainate-induced epilepsy
Animals were placed in individual cages and administered three consecutive intraperitoneal injections of kainate (8 mg/kg per dose, 24 mg/kg total), one every 30 min from the onset of the experiment in order to induce convulsive non-lethal seizures. Seizure stages after kainate injections were evaluated as described previously.23–25 After the first kainate injections, the animals developed hypoactivity and immobility (Stages I–II). After successive injections, hyperactivity (Stage III) and scratching (Stage IV) were often observed. Some animals progressed to a loss of balance control (Stage V) and further chronic whole-body convulsions (Stage VI). Extreme behavioural manifestations such as uncontrolled hopping or ‘popcorn behaviour’ and continuous seizures (more than 1 min without control of body movement) were included in Stage VI. All behavioural assessments were performed blind to the experimental group (genotype) in situ, and were also recorded and reanalysed blind to the first analysis. Analysis consisted of recording the time spent until the onset of the first seizure, the number of seizures per animal and the time spent in each stage by each animal.
Gas chromatography-mass spectrometry quantitation of metabolites
Brain metabolomics analysis was performed based on our previously established methods.26–28 Twenty milligrams of each pulverized tissue were extracted in 1 ml of 50% methanol containing 20 μM l-norvaline as an internal procedural control and separated into polar (aqueous layer) and insoluble fractions by 15 000 rpm centrifugation at 4°C for 10 min. The pellet was subsequently washed three times with 50% methanol and once with 100% methanol to remove polar contaminants. Polar fractions were dried at 10−3 mBar using a SpeedVac (Thermo) and stored at −80°C until derivatization steps were performed. Hydrolysis of the protein/glycogen fraction was performed by first resuspending the dried pellet in ddH2O, followed by the addition of equal part 6 M HCl. Samples were vortexed thoroughly and incubated at 95°C for 2 h. Hydrolysis was quenched with 100% methanol with 40 μM l-norvaline, samples incubated on ice for 30 min, and the supernatant collected after centrifugation at 15 000 rpm at 4°C for 10 min. The collected supernatant was subsequently dried by vacuum centrifuge at 10−3 mBar.
Dried polar and glycogen samples were derivatized by the addition of 20 mg/ml methoxyamine hydrochloride in pyridine and incubated for 1.5 h at 30°C. N-methyl-trimethylsilyl-trifluoroacetamide (MSTFA) was then sequentially added to samples, followed by an incubation time of 30 min at 37°C with thorough mixing between addition of solvents. The mixture was then transferred to a v-shaped amber glass chromatography vial and analysed by gas-chromatography mass spectrometry (GC-MS). An Agilent 7800B gas chromatograph coupled to a 5977B mass spectrometry detector was used for this study. GC-MS protocols were similar to those described previously,25,26 except a modified temperature gradient was used for GC: the initial temperature was 130°C, held for 4 min, rising at 6°C/min to 243°C, then rising at 60°C/min to 280°C, and held for 2 min. The electron ionization (EI) energy was set to 70 eV. Scan (m/z : 50–800) and full scan modes were used for metabolomics analysis. Mass spectra were translated to relative metabolite abundance using the Automated Mass Spectral Deconvolution and Identification System (AMDIS) software matched to the FiehnLib metabolomics library (available through Agilent) for retention time and fragmentation pattern. Quantitation was performed using the software Mnova (Mestrelab) with a primary ion and at least two or more matching qualifying ions. Relative abundance was corrected for recovery using the l-norvaline standard and adjusted to protein input.
Data collection and statistical analysis
For the biochemical analyses, image quantification and behavioural assessment of seizure susceptibility after kainate administration, computed results were processed for statistical analysis with PRISM 8.0 (GraphPAD Software, San Diego, USA). Data are presented as the mean ± standard error of the mean (SEM). Normality of the distributions was checked via the Shapiro-Wilk test. All the tests performed were two-sided. Statistical significance of differences between groups was inferred by Student’s t-test or two-way ANOVA, followed by the Bonferroni post hoc comparison for all pairwise multiple comparison procedures. Statistical significance was set at P < 0.05.
Data availability
Raw data and images are available upon request from the corresponding author.
Results
Accumulation of glycogen is prevented in young malinKO+MGSGfap-KO mice
To generate a mouse model of Lafora disease that is unable to accumulate glycogen specifically in astrocytes, we bred malinKO mice13,18 with an astrocyte-specific knockout of MGS5 to obtain malinKO+MGSGfap-KO animals. We examined the accumulation of glycogen in the brains of young (3-month-old) malinKO+MGSGfap-KO animals, an age at which malinKO mice already show a great number of Lafora bodies in this organ. To this end, PAS staining and MGS immunostaining were performed in coronal brain sections, and total brain glycogen content was biochemically quantified. A considerable number of glycogen aggregates were observed in malinKO brains after PAS staining and MGS immunostaining, as previously reported.13 In contrast, malinKO+MGSGfap-KO animals showed a dramatic reduction in the number of aggregates (Fig. 1A). The biochemical determination of glycogen content also revealed an increase in the brains of malinKO mice (P < 0.0001) while glycogen levels in malinKO+MGSGfap-KO brains were lower than those of wild-type controls (P < 0.0001) (Fig. 1B).
Figure 1.
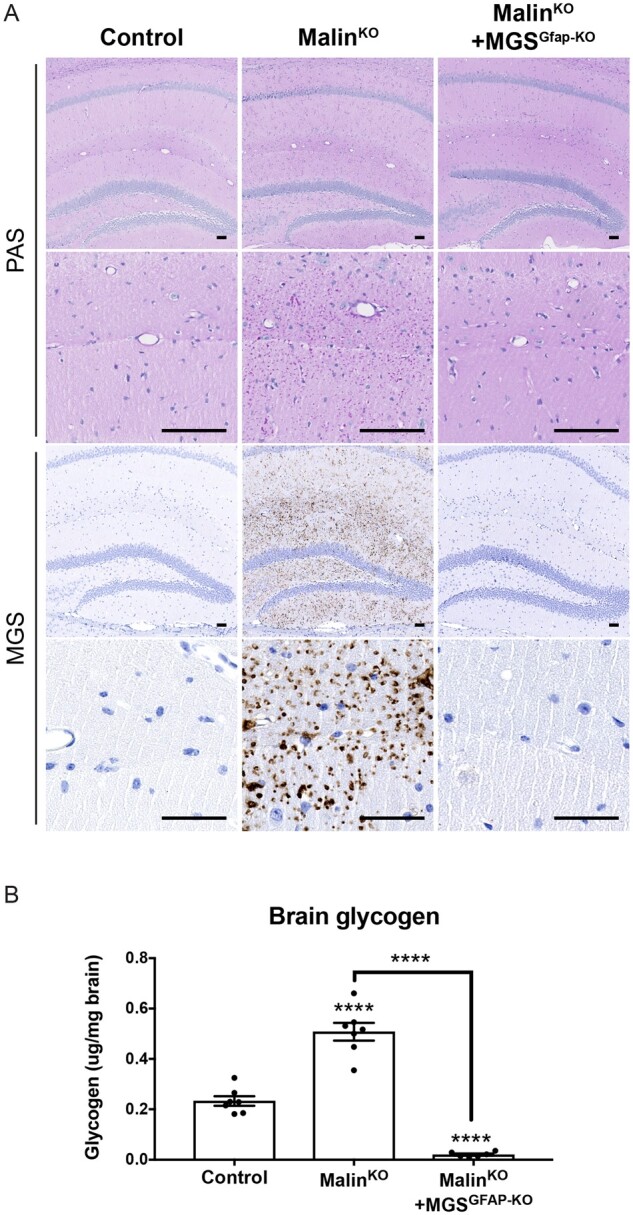
Accumulation of glycogen in the brains of 3-month-old mice. Lafora bodies are abundant in malinKO hippocampi but greatly diminished in malinKO+MGSGfap-KO hippocampi. (A) Low and high power photomicrographs illustrating the distribution of Lafora bodies after periodic acid-Schiff (PAS) staining and MGS immunostaining of the hippocampi of 3-month-old littermates from the different groups. Scale bar = 100 μm. (B) Glycogen content of total brain. Control (n = 7), malinKO (n = 7), malinKO+MGSGfap-KO (n = 6). Data are expressed as mean ± SEM. ****P < 0.0001.
MalinKO+MGSGfap-KO mice accumulate neuronal Lafora bodies but not corpora amylacea-like bodies
We previously reported that most aggregates that accumulate in malinKO hippocampi correspond to astrocytic CAL, although some nLBs were detected in the CA2-CA3 region.19 As expected, the hippocampi of malinKO+MGSGfap-KO brains contained nLBs but were devoid of CAL (Fig. 2, top panels). Likewise, nLBs, but not CAL, were present in the cortices of malinKO+MGSGfap-KO animals (Fig. 2, middle panels). The cerebella of malinKO+MGSGfap-KO mice were almost completely free of the glycogen aggregates typical of malinKO cerebella, thereby indicating that these aggregates were mainly astrocytic CALs (Fig. 2, bottom panels). These results confirm that most brain Lafora bodies are in fact astrocytic and that they correspond to the CAL morphology.19
Figure 2.
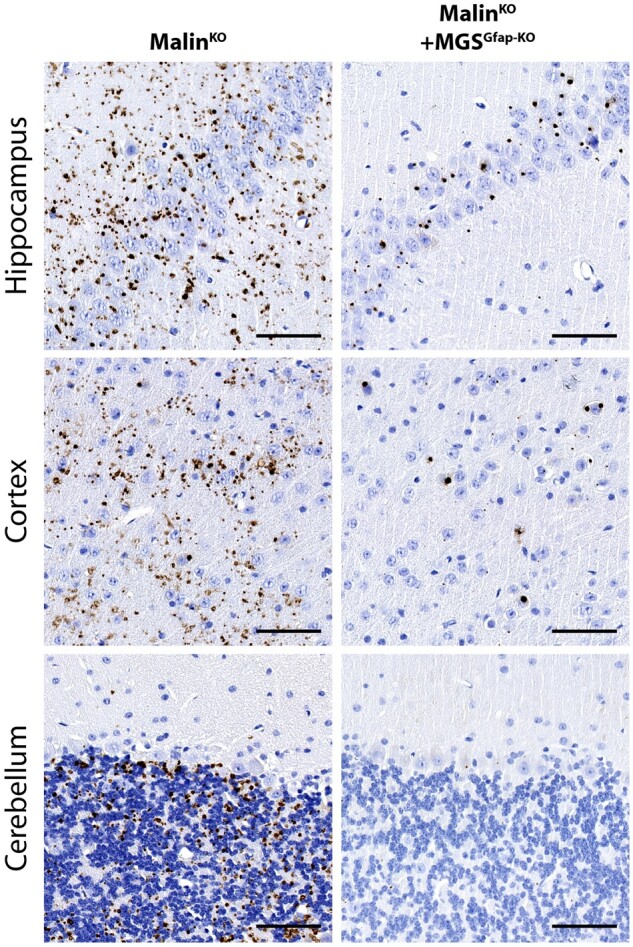
MalinKO+MGSGfap-KO brains contain nLBs but not CAL. MGS immunostainings of the CA3-CA2 region of the hippocampus (top), the cortex (middle) and the cerebellum (bottom) of 3-month-old mice. Scale bar = 100 μm.
Western blot analyses of brain extracts
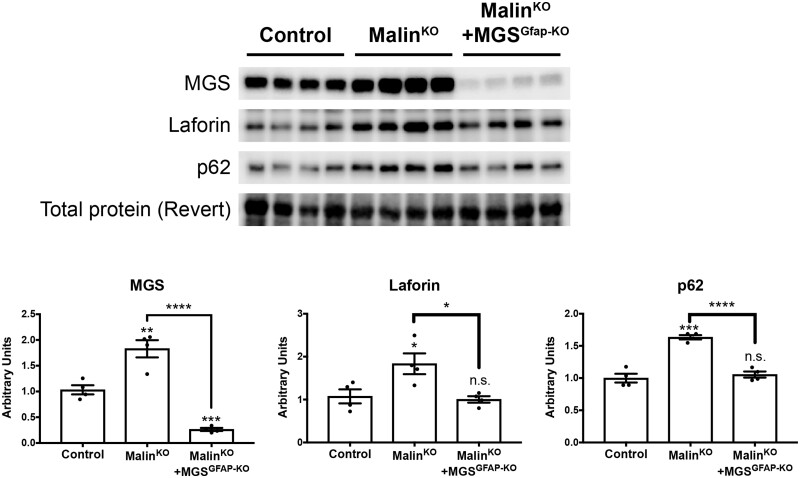
We next analysed the levels of MGS and laforin in brain extracts of the different groups by western blot. MGS and laforin were increased in the brains of young malinKO animals (P = 0.0056 and P = 0.0407, respectively), reproducing the results previously reported for older animals.13,18 In contrast, in the brains of young malinKO+MGSGfap-KO mice, MGS levels were decreased and laforin showed normal levels (P = 0.0002 and P = 0.7056, respectively). These findings thus indicate that the accumulation of these proteins in malinKO brains takes place mainly in astrocytes (Fig. 3). In older malinKO brains, the autophagy adaptor p62 is increased, which has been described as an indicator of autophagy impairment in these animals.29 We found that young malinKO animals also presented an increase in p62 levels in the brain (P = 0.0002). Importantly, p62 levels were normalized in malinKO+MGSGfap-KO animals (P < 0.0001 with respect malinKO), thereby indicating again that this increase was due mainly to the astrocytic population (Fig. 3).
Figure 3.
Accumulation of proteins is prevented in malinKO+MGSGfap-KO brains. Western blotting for MGS, laforin and p62 of total brain homogenates of 3-month-old mice. (A) Representative blots. (B) Quantification of the bands normalized to Revert. Data are expressed as mean ± SEM. *P < 0.05; **P < 0.01; ***P < 0.001; ****P < 0.0001; n.s. = non-significant. n = 4 animals per group. Revert was used as loading control.
Assessment of pathology in aged malinKO+MGSGfap-KO
The results described thus far established that most Lafora bodies in malinKO brains accumulate in astrocytes. We next analysed whether these astrocytic Lafora bodies contribute to the pathology of Lafora disease. Three-month-old malinKO animals do not show signs of brain damage, which appear at older ages.18,30 We therefore used 11-month-old animals from the different groups to dissect the specific contribution of glycogen accumulation in astrocytes to the pathology of the disease. The analysis of this process in the brains of these aged groups reproduced the results obtained with younger animals (Supplementary Fig. 1). Old malinKO+MGSGfap-KO mice presented nLBs, but not CALs (Supplementary Fig. 1A), and low levels of brain glycogen, while malinKO brains showed a clear increase in glycogen with respect to controls (Supplementary Fig. 1B). Western blot analyses also revealed increased levels of MGS, laforin and p62 in malinKO brains. In contrast, these parameters were reduced in the brains of malinKO+MGSGfap-KO animals (Supplementary Fig. 1C).
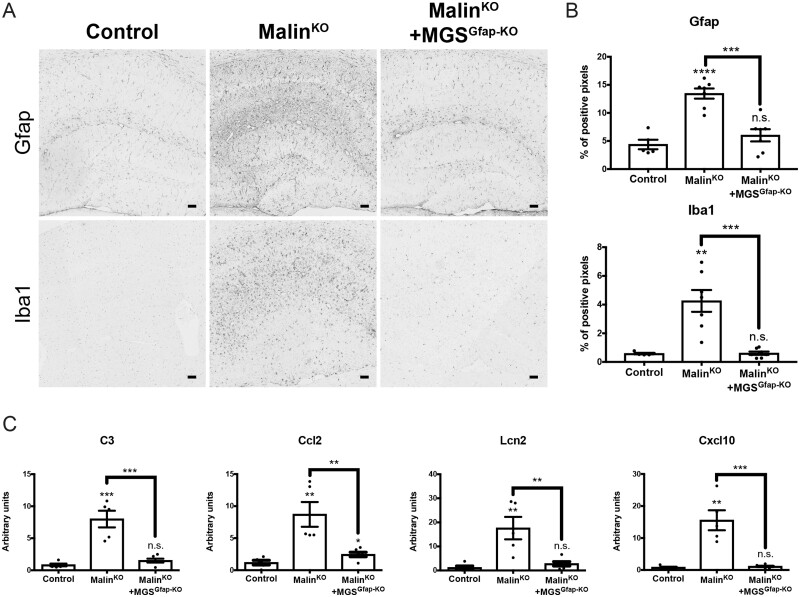
Histological markers, namely GFAP for astrogliosis and Iba1 for microgliosis, have been widely used to assess brain damage in Lafora disease mouse models.13,14,30–32 The analysis of these markers showed increased staining in aged malinKO brains [GFAP (P < 0.0001), Iba1 (P = 0.0024)], as we previously described.9 The increase was particularly prominent in the hippocampus, a region that accumulates numerous CAL.4 Strikingly, the levels of these markers were normalized in the brains of malinKO+MGSGfap-KO mice [GFAP (P = 0.2993), Iba1 (P = 0.8521)] (Fig. 4A and B). In line with these histological markers, the upregulation of genes encoding mediators of the inflammatory response has also been reported in mouse models of Lafora disease.30,31The analysis of some of these genes, namely C3, Ccl2, Lcn2 and Cxcl10, by qPCR confirmed the upregulation of their expression in malinKO brains (P = 0.0006, P = 0.0051, P = 0.0083 and P = 0.0015, respectively). Consistent with the histological results, the expression of these genes was similar to normal levels in malinKO+MGSGfap-KO brains (P = 0.1098, P = 0.0325, P = 0.2041 and P = 0.3590, respectively) (Fig. 4C). Cumulatively, these results indicate that astrogliosis and microgliosis in malinKO brains are mainly a result of the accumulation of glycogen in astrocytes.
Figure 4.
Analysis of brain damage in malinKO+MGSGfap-KO mice. Neuroinflammation markers are increased in the brains of old malinKO mice but normalized in malinKO+MGSGfap-KO mice. (A) GFAP and Iba1 immunostainings of hippocampi from the different groups. (B) Quantification of hippocampal area of the immunostainings. Data are expressed as mean ± SEM of percentage of positive pixels [control (n = 5), malinKO (n = 7), malinKO+MGSGfap-KO (n = 7)]. (C) Quantitative PCR analysis of genes involved in the inflammatory response. Data are expressed as mean ± SEM of 2ΔΔCt in relative units for each genotype analysed [control (n = 5), malinKO (n = 5), malinKO+MGSGfap-KO (n = 6)]. **P < 0.01; ***P < 0.001; ****P < 0.0001; n.s. = non-significant.
Glycogen overaccumulation in astrocytes per se induces astrogliosis and neuroinflammation
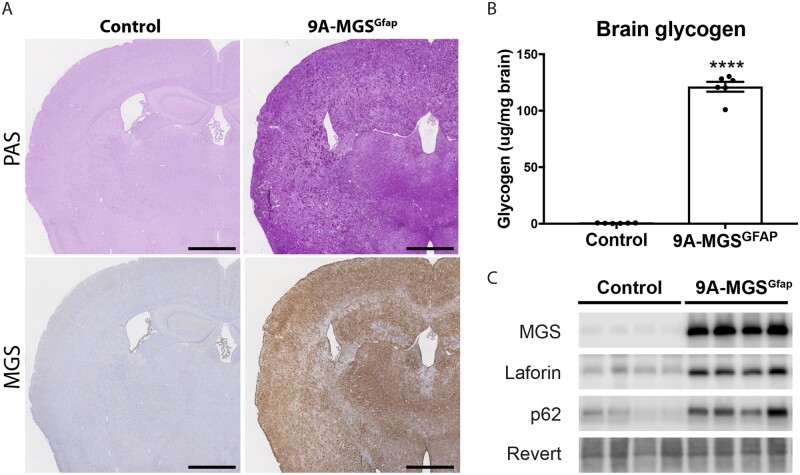
After the above results, we next examined whether the overaccumulation of glycogen in astrocytes per se induces the changes in brain damage markers that we described in malinKO brains. To this end, we took advantage of our animal model, in which a non-inactivatable form of MGS (9A-MGS) can be expressed in a cell-type-specific manner.17 We crossed this mouse model with Gfap-Cre mice to induce the accumulation of glycogen in astrocytes (9A-MGSGfap). PAS staining, MGS immunostaining and biochemical determination of glycogen in the brains of 3-month-old 9A-MGSGfap mice revealed a conspicuous accumulation of glycogen (P < 0.0001) (Fig. 5A and B). Western blot analyses in total brain homogenates of these mice revealed that MGS overexpression was accompanied by an increase in laforin, thereby mimicking the results obtained in the brains of malinKO mice. Also, the autophagy marker p62 showed increased levels in the brains of 9A-MGSGfap mice (Fig. 5C).
Figure 5.
Accumulation of glycogen in 9A-MGSGfap mice. (A) PAS staining and MGS immunostaining of 9A-MGSGfap in consecutive serial coronal sections. (B) Glycogen content of total brain (n = 6 animals per group). Data are expressed as mean ± SEM. ****P < 0.0001. (C) Western blotting for MGS, laforin and p62 of total brain homogenates. Revert was used as loading control.
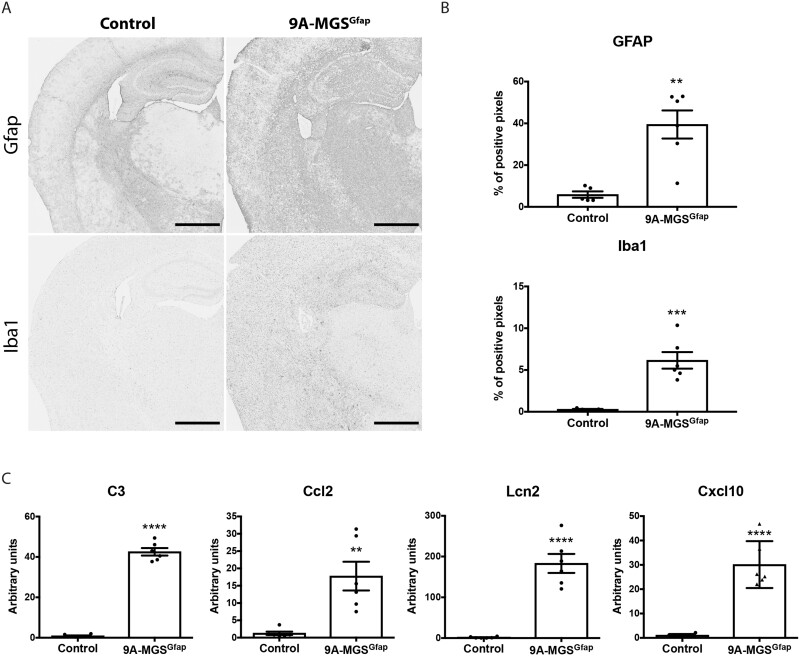
We analysed the presence of GFAP and Iba1 in these brains. Interestingly, both markers were dramatically increased in 9A-MGSGfap animals when compared to control littermates (P = 0.0016 and P = 0.0005, respectively) (Fig. 6A and B). These results indicate that the accumulation of glycogen in astrocytes per se induces astrogliosis and microgliosis. The inflammatory phenotype in the 9A-MGSGfap model was again confirmed by qPCR analysis of genes involved in the inflammatory response [C3 (P < 0.0001), Ccl2 (P = 0.0027), Lcn2 (P < 0.0001) and Cxcl10 (P < 0.0001)] (Fig. 6C). Taken together, the results obtained with the 9A-MGSGfap mice confirm that the overaccumulation of glycogen in astrocytes per se induces brain damage.
Figure 6.
Analysis of brain damage in 9A-MGSGfap mice. Neuroinflammation markers are increased in the brains of 9A-MGSGfap mice. (A) GFAP and Iba1 immunostainings of hippocampi. (B) Quantification of the hippocampal area of the immunostainings. Data are expressed as mean ± SEM of percentage of positive pixels [control (n = 5), 9A-MGSGfap (n = 6)]. (C) Quantitative PCR analysis of genes involved in the inflammatory response. Data are expressed as mean ± SEM of 2ΔΔCt in relative units for each genotype analysed (n = 6 animals per group). **P < 0.01. ***P < 0.001. ****P < 0.0001.
Analysis of susceptibility to kainate-induced epilepsy in malinKO+MGSGfap-KO
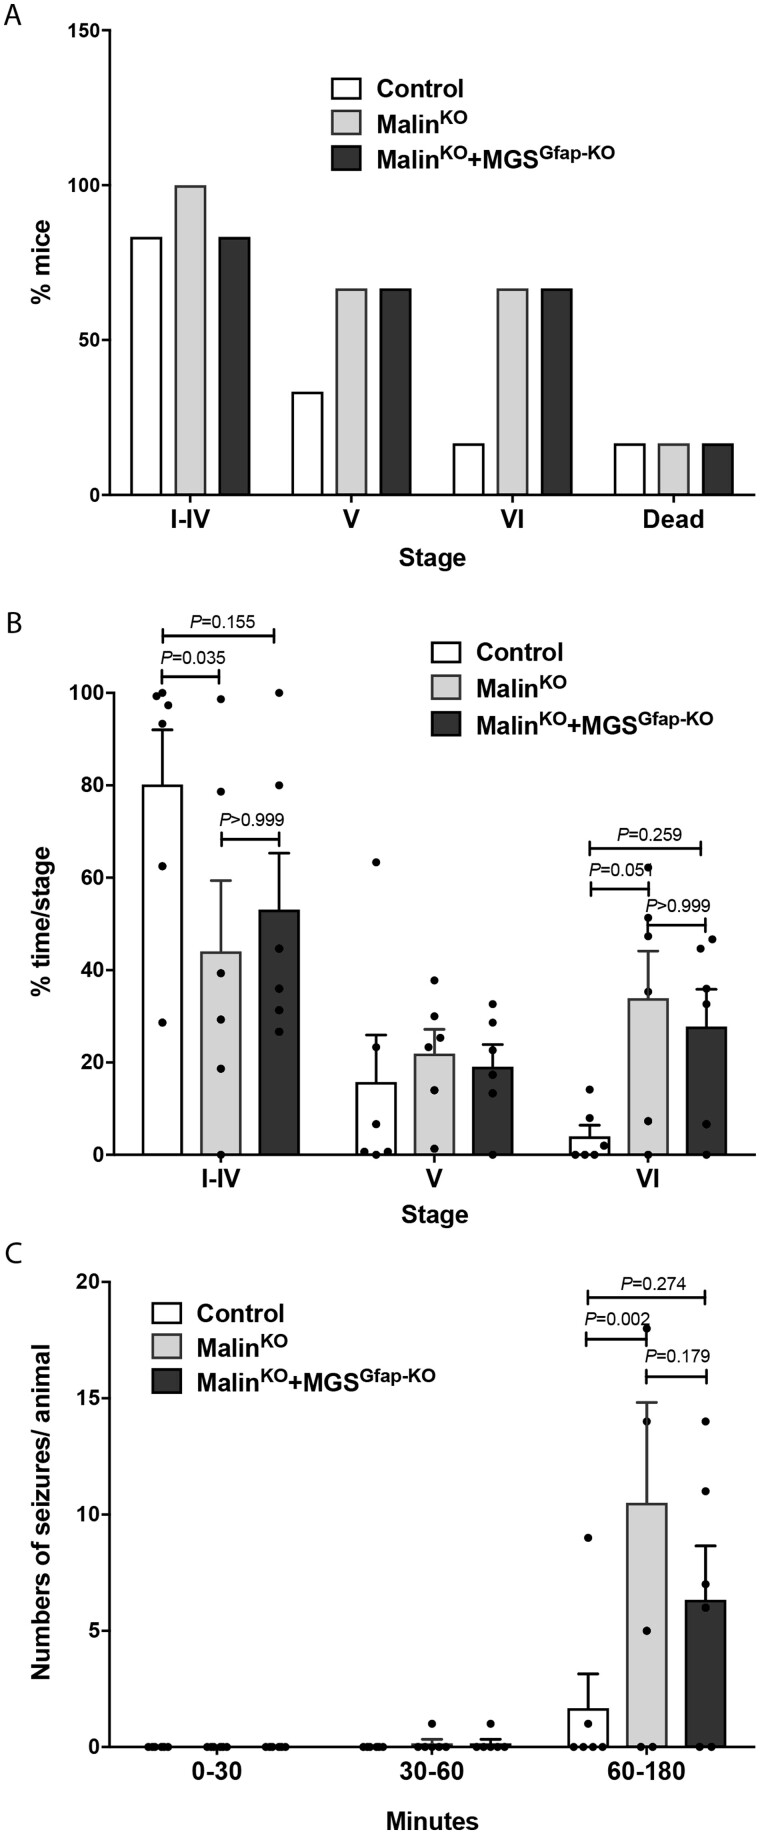
The accumulation of Lafora bodies in malinKO brains also leads to increased susceptibility to kainate-induced epilepsy,13,18 which is in accordance with early Lafora disease symptoms. To analyse the contribution of astrocytic Lafora bodies to this epileptic phenotype, we measured the susceptibility of malinKO and malinKO+MGSGfap-KO animals to kainate-induced seizure. Mice received three consecutive kainate injections (8 mg/kg, i.p. every 30 min) and were video-recorded for 180 min after the first injection to monitor their behaviour (i.e. epileptic events). Mice from the three groups reached similar severity stages. However, an increased proportion of malinKO and malinKO+MGSGfap-KO animals reached the highest severity stages (Stages V and VI, Fig. 7A). Analysis of the time spent in each stage revealed that malinKO mice spent significantly less time in stages I to IV (P = 0.035) and more time in stage VI (P = 0.051) when compared to control animals, indicating an increased susceptibility to kainate-induced seizures. MalinKO+MGSGfap-KO animals were positioned in-between the two groups, not being significantly different from either control or malinKO animals in any stage (Fig. 7B). Similarly, when we analysed the number of seizures per animal correlated by time, we found significant differences between control and malinKO animals after the third kainate administration (P = 0.002), with malinKO+MGSGfap-KO animals again showing an intermediate response in-between the two genotypes (Fig. 7C). In summary, malinKO mice were more susceptible to kainate-induced epilepsy with respect to control littermates, as previously reported. This increase was not significantly reduced in malinKO+MGSGfap-KO mice. This observation thus indicates that astrocytic Lafora bodies are not the main driver of the increase in the susceptibility to kainate-induced epilepsy in malinKO animals.
Figure 7.
Study of kainate-induced epilepsy. Eleven-month-old mice were subjected to three kainate injections (8 mg/kg every 30 min), and epileptic responses were analysed for 180 min after the first injection. (A) Percentage of mice reaching seizure Stages I to VI and kainate-induced mortality. (B) Percentage of time spent in each stage during the course of the experiment. Data are expressed as average ± SEM. n = 6 mice/group. Two-way ANOVA P-values display post hoc Bonferroni differences. (C) Number of seizures experienced per animal divided by time segments after the first, second and third kainate injections. Data are expressed as average ± SEM. n = 6 animals per group. Two-way ANOVA P-values display post hoc Bonferroni differences.
Metabolomic profiles
Neurophysiological impairments are difficult to detect in Lafora disease mouse models,12,33,34 and recent work demonstrated that Lafora disease causes changes in the cerebral metabolome.26 Therefore, we used the Lafora disease brain metabolic signature to assess disease status. To this end, we used GC-MS to define the cerebral metabolome of malinKO, malinKO+MGSGfap-KO and control animals. We performed targeted metabolomics analysis of central carbon metabolites involved in glycolysis, the pentose phosphate pathway (PPP), the TCA cycle, and amino acid metabolism. Using this information-rich metabolomics dataset, we performed supervised clustering analysis to assess the overall metabolic profiles. In line with our hypothesis, distinct clustering was observed between malinKO animals and control animals (Fig. 8A). Importantly, the malinKO+MGSGfap-KO mice clustered and partially overlapped with the control animals, demonstrating a partial normalization of brain metabolism. Corroborating these findings, similar trends were observed using Ward hierarchical cluster analysis, where malinKO+MGSGfap-KO more closely clustered with control rather than malinKO mice (Fig. 8B). Additionally, metabolites used to generate these analyses were related to glycogen metabolism, glycolysis, TCA cycle, and amino acids (Fig. 8B). Taken together, these data strongly suggest that astrocytic Lafora bodies are the main contributors to the metabolic alterations present in malinKO mice.
Figure 8.
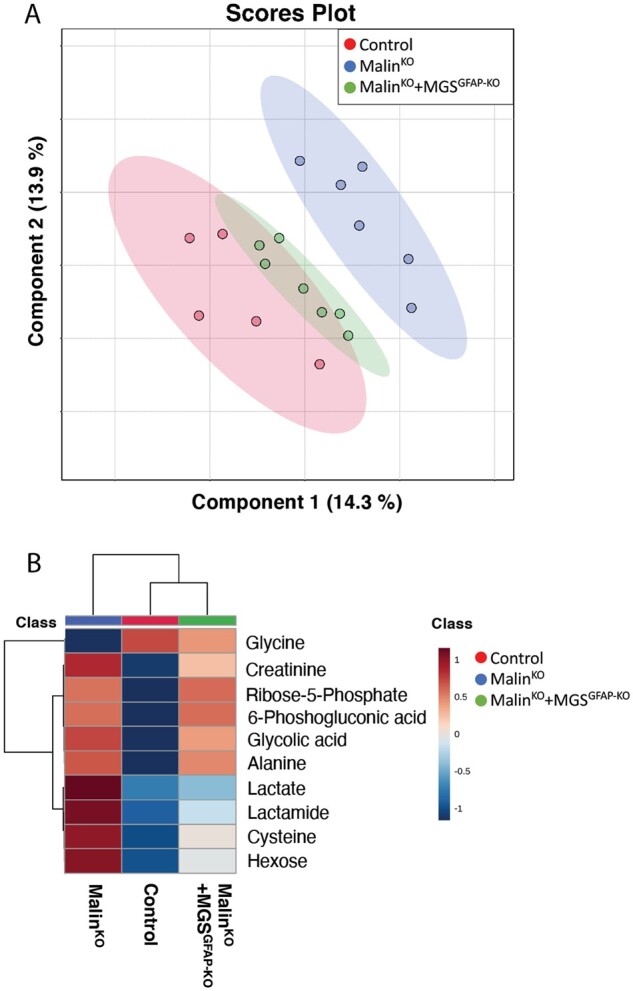
Metabolic profiles. (A) Sparse partial least squares-discriminant analysis (sPLS-DA) multivariate analysis of control (red), malinKO (blue) and malinKO+MGSGfap-KO (green) brains. (B) Heat map clustering showing the 10 most affected metabolites from sPLS-DA multivariate analysis.
Discussion
Lafora disease is a devastating condition for which there is no current treatment. Demonstration that the accumulation of glycogen in the nervous system underlies the pathophysiology of the disease identified glycogen synthase as a druggable target and opened up the possibility of designing potential treatments.26,35 Traditionally, it was considered that under normal conditions glycogen is present exclusively in astrocytes,36 while in Lafora disease, Lafora bodies accumulate exclusively in neurons.16 These two concepts represented a paradox that was difficult to understand. However, we first demonstrated that neurons have an active glycogen metabolism,3,4 which explains why they can accumulate aberrant glycogen in conditions like Lafora disease. Also, we13,19 and others20 showed that Lafora bodies are not exclusive to neurons and that astrocytes also accumulate these aggregates in Lafora disease. Here we reveal that the accumulation of glycogen aggregates in astrocytes contributes to the pathophysiology of Lafora disease.
The analysis of the Lafora bodies present in malinKO+MGSGfap-KO brains demonstrates that the vast majority of aggregates accumulate in astrocytes, thereby confirming our previous indirect results obtained by co-localization with neuronal and astrocytic markers.19 Furthermore, biochemical quantification showing low levels of glycogen in the brains of malinKO+MGSGfap-KO mice also indicates that neuronal Lafora bodies represent a very small fraction of the glycogen accumulated in malinKO brains. Lafora bodies have traditionally been classified into type I, type II and type III subtypes. The first type accounts for the largest proportion of total Lafora bodies, they affect the neuropil and they are granular, polymorphic, ‘dust-like’ particles. In contrast, type II Lafora bodies and the more rare type III are bigger and spherical and they are always located in the neuronal perikaryon.16,37 Based on these characteristics, type I Lafora bodies correspond to CAL, and type II and III to nLBs.19 It has been hypothesized that type II Lafora bodies are formed only when the production of type I Lafora bodies is insufficient to contain the polyglucosans generated.16 In light of our results, this hypothesis can be discarded, since type I and type II Lafora bodies are in fact generated in different cell types, i.e. type I Lafora bodies in astrocytes and type II and III in neurons. Along the same line, our results demonstrate that astrocytic Lafora bodies are formed in the astrocytes themselves and do not derive from neurons. Likewise, they show that neurons generate Lafora bodies and do not import them from astrocytes.
Neuropathology has classically been dominated by neuron-centric views, in which pathology is focused on the survival or death of neurons. However, astrocytes are emerging as a central element of neuropathology. Astrocytes play essential roles in brain function,38,39 and astrocytic dysfunction has been shown to contribute to the pathology of disorders like Alzheimer’s disease,40 Huntington’s disease,41 Parkinson’s disease42,43 and amyotrophic lateral sclerosis.44 However, whether astrocytic dysfunction reflects cell-autonomous mechanisms in these diseases is not yet clear. Neuroinflammation is one of the most important traits in the pathophysiology of Lafora disease.30 Here we show that neuroinflammation is corrected in malinKO+MGSGfap-KO mice, as shown by GFAP and Iba1 immunostaining, as well as by the expression of genes encoding mediators of the inflammatory response. In line with these observations, 9A-MGSGfap animals showed clear signs of neuroinflammation. Although in this model the accumulation of glycogen in astrocytes is very high, and thus it does not faithfully mimic Lafora disease, these results indicate that the overaccumulation of glycogen in astrocytes per se induces this pathophysiological trait. Furthermore, autophagy markers were also normalized in malinKO+MGSGfap-KO brains and altered in 9A-MGSGfap brains. These findings indicate that dysfunctions in autophagy, which had been proposed as the underlying cause of Lafora disease,11,45 also occur mainly in astrocytes. Similarly, our metabolomics analyses indicated that the metabolic alterations characteristic of malinKO brains are partially corrected in malinKO+MGSGfap-KO brains. These results demonstrate not only that the impairment of astrocytic function plays a role in the pathophysiology of Lafora disease but that it is a primary role, resulting from the accumulation of Lafora bodies in the astrocytes themselves, and not a secondary role derived of the accumulation of neuronal Lafora bodies. Our findings unveil astrocytes as a key target in the treatment of Lafora disease and make Lafora disease one of the few examples of neurodegenerative diseases in which a cell-autonomous dysfunction of astrocytes has been demonstrated.
Targeted metabolomics analyses and supervised clustering analysis revealed rescue of a wide range of interconnecting metabolic pathways. These include central carbon metabolic pathways (hexose and lactate), amino acid metabolism (glycine and cysteine), and lipid metabolism (lactamide). Thus, these data suggest a change in malinKO+MGSGfap-KO brain metabolism towards control metabolism. Brain metabolism is the biochemistry that underlines brain physiology, and shifts within these pathways towards control levels suggest partial rescue of the diseased phenotype. However, the total pooled metabolites analysed here only represent a change in metabolism. Isotopic tracing is required to obtain detailed flux data such as substrate utilization and direction of change for each individual pathway.
The many roles of astrocytes in the regulation of neuronal excitability make them key players in the pathogenesis of epilepsy.46,47 Furthermore, neuroinflammation, which is rescued in malinKO+MGSGfap-KO mice, has been shown to play a role in epileptogenesis.48 For these reasons, we examined whether the accumulation of Lafora bodies in astrocytes also underlies the epileptic phenotype of Lafora disease. However, susceptibility to kainate-induced epilepsy was not rescued in malinKO+MGSGfap-KO mice. Indeed, these mice showed only a minor improvement in the number and severity of seizures, which could be due to the absence of neuroinflammation. These results therefore strongly suggest that astrocytic Lafora bodies are not the main contributors to the increased susceptibility to kainate-induced epilepsy, and thus this pathological trait would be more attributable to neurons. In this regard, deletion of PPP1R3D in the mouse model of Lafora disease leads to reduced nLBs and a trend towards decreased susceptibility to kainate-induced seizures.49
The results presented here are consistent with those reported for adult polyglucosan body disease (APBD), in which accumulation of abnormal glycogen in astrocytes is sufficient to cause the disease.50 Interestingly, patients with APBD share symptoms with Lafora disease, like dementia, but they do not present an epileptic phenotype. These data again suggest that the Lafora disease epilepsy derives from the accumulation of aberrant glycogen in neurons.
The accumulation of aberrant glycogen in astrocytes is not exclusive to Lafora disease and APBD. Ageing and some neurodegenerative conditions (including Alzheimer’s, Huntington’s, Parkinson’s and Pick’s diseases) also lead to the appearance of astrocytic glycogen aggregates known as corpora amylacea.51,52 Thus, the results presented here will impact beyond Lafora disease and open up the question of whether glycogen accumulation in astrocytes contributes to the cognitive decline associated with ageing and to the pathology of these other neurodegenerative diseases.
In summary, our results shed new light on the pathophysiological bases of Lafora disease, moving it from a neurocentric perspective to one in which astrocytes are also key players. Based on the results presented here, we propose that the accumulation of CAL in astrocytes underlies autophagy impairment, metabolic alterations and neuroinflammation, while epilepsy is mainly the result of nLB-induced neuronal dysfunction. By expanding a growing body of evidence supporting the involvement of glial cells in neurodegenerative diseases, our results have important implications for the design of treatments for Lafora disease and other disorders.
Supplementary Material
Acknowledgements
The authors thank Anna Adrover and Emma Veza for technical assistance. Thanks also go to Tanya Yates for correcting the English manuscript.
Funding
IRB Barcelona and IBEC are the recipient of a Severo Ochoa Award of Excellence from MINECO (Government of Spain). This study was supported by grants from MINECO (BFU2017-84345-P to J.D. and J.J.G. and RTI2018-099773-B-I00 to J.A.D. and A.H.), the CIBER de Diabetes y Enfermedades Metabólicas Asociadas (ISCIII, Ministerio de Ciencia e Innovación), a grant from the National Institutes of Health (NIH-NINDS) (P01 NS097197) to J.J.G. and M.S.G., NIH grant R35 NS116824 to M.S.G., and NIH grant R01 AG066653 to R.C.S. The project leading to these results also received funding from ‘la Caixa’ Foundation (ID 100010434) under the agreement LCF/PR/HR19/52160007 with J.A.D.
Competing interests
The authors report no competing interests.
Supplementary material
Supplementary material is available at Brain online.
Glossary
- CAL
corpora amylacea-like bodies
- MGS
muscle glycogen synthase
- nLBs
neuronal Lafora bodies
References
- 1.Duran J, Saez I, Gruart A, Guinovart JJ, Delgado-Garcia JM.. Impairment in long-term memory formation and learning-dependent synaptic plasticity in mice lacking glycogen synthase in the brain. J Cereb Blood Flow Metab. 2013;33(4):550–556. [DOI] [PMC free article] [PubMed] [Google Scholar]
- 2.Lopez-Ramos JC, Duran J, Gruart A, Guinovart JJ, Delgado-Garcia JM.. Role of brain glycogen in the response to hypoxia and in susceptibility to epilepsy. Front Cell Neurosci. 2015;9:431. [DOI] [PMC free article] [PubMed] [Google Scholar]
- 3.Saez I, Duran J, Sinadinos C, et al. Neurons have an active glycogen metabolism that contributes to tolerance to hypoxia. J Cereb Blood Flow Metab. 2014;34(6):945–955. [DOI] [PMC free article] [PubMed] [Google Scholar]
- 4.Duran J, Gruart A, Varea O, López-Soldado I, Delgado-García JM, Guinovart JJ.. Lack of neuronal glycogen impairs memory formation and learning-dependent synaptic plasticity in mice. Front Cell Neurosci. 2019;13:374. [DOI] [PMC free article] [PubMed] [Google Scholar]
- 5.Duran J, Brewer MK, Hervera A, et al. Lack of astrocytic glycogen alters synaptic plasticity but not seizure susceptibility. Mol Neurobiol. 2020;57(11):4657–4666. [DOI] [PMC free article] [PubMed] [Google Scholar]
- 6.Duran J, Guinovart JJ.. Brain glycogen in health and disease. Mol Aspects Med. 2015;46:70–77. [DOI] [PubMed] [Google Scholar]
- 7.Duran J, Gruart A, Lopez-Ramos JC, Delgado-Garcia JM, Guinovart JJ.. Glycogen in astrocytes and neurons: Physiological and pathological aspects. Adv Neurobiol. 2019;23:311–329. [DOI] [PMC free article] [PubMed] [Google Scholar]
- 8.Turnbull J, Tiberia E, Striano P, et al. Lafora disease. Epileptic Disord. 2016;18(S2):38–62. [DOI] [PMC free article] [PubMed] [Google Scholar]
- 9.Gentry MS, Guinovart JJ, Minassian BA, Roach PJ, Serratosa JM.. Lafora disease offers a unique window into neuronal glycogen metabolism. J Biol Chem. 2018;293(19):7117–7125. [DOI] [PMC free article] [PubMed] [Google Scholar]
- 10.Gentry MS, Worby CA, Dixon JE.. Insights into Lafora disease: Malin is an E3 ubiquitin ligase that ubiquitinates and promotes the degradation of laforin. Proc Natl Acad Sci U S A. 2005;102(24):8501–8506. [DOI] [PMC free article] [PubMed] [Google Scholar]
- 11.Singh S, Ganesh S.. Lafora progressive myoclonus epilepsy: A meta-analysis of reported mutations in the first decade following the discovery of the EPM2A and NHLRC1 genes. Hum Mutat. 2009;30(5):715–723. [DOI] [PubMed] [Google Scholar]
- 12.García-Cabrero AM, Marinas A, Guerrero R, de Córdoba SR, Serratosa JM, Sánchez MP.. Laforin and malin deletions in mice produce similar neurologic impairments. J Neuropathol Exp Neurol. 2012;71(5):413–421. [DOI] [PubMed] [Google Scholar]
- 13.Duran J, Gruart A, Garcia-Rocha M, Delgado-Garcia JM, Guinovart JJ.. Glycogen accumulation underlies neurodegeneration and autophagy impairment in Lafora disease. Hum Mol Genet. 2014;23(12):3147–3156. [DOI] [PubMed] [Google Scholar]
- 14.Turnbull J, DePaoli-Roach AA, Zhao X, et al. PTG depletion removes Lafora bodies and rescues the fatal epilepsy of Lafora disease. PLoS Genet. 2011;7(4):e1002037. [DOI] [PMC free article] [PubMed] [Google Scholar]
- 15.Pederson BA, Turnbull J, Epp JR, et al. Inhibiting glycogen synthesis prevents lafora disease in a mouse model. Ann Neurol. 2013;74(2):297–300. [DOI] [PMC free article] [PubMed] [Google Scholar]
- 16.Machado-Salas J, Avila-Costa MR, Guevara P, et al. Ontogeny of Lafora bodies and neurocytoskeleton changes in Laforin-deficient mice. Exp Neurol. 2012;236(1):131–140. [DOI] [PMC free article] [PubMed] [Google Scholar]
- 17.Duran J, Tevy MF, Garcia-Rocha M, Calbó J, Milán M, Guinovart JJ.. Deleterious effects of neuronal accumulation of glycogen in flies and mice. EMBO Mol Med. 2012;4(8):719–729. [DOI] [PMC free article] [PubMed] [Google Scholar]
- 18.Valles‐Ortega J, Duran J, Garcia‐Rocha M, et al. Neurodegeneration and functional impairments associated with glycogen synthase accumulation in a mouse model of Lafora disease. EMBO Mol Med. 2011;3(11):667–681. [DOI] [PMC free article] [PubMed] [Google Scholar]
- 19.Auge E, Pelegri C, Manich G, et al. Astrocytes and neurons produce distinct types of polyglucosan bodies in Lafora disease. Glia. 2018;66(10):2094–2107. [DOI] [PMC free article] [PubMed] [Google Scholar]
- 20.Rubio-Villena C, Viana R, Bonet J, et al. Astrocytes: New players in progressive myoclonus epilepsy of Lafora type. Hum Mol Genet. 2018;27(7):1290–1300. [DOI] [PMC free article] [PubMed] [Google Scholar]
- 21.Auge E, Duran J, Guinovart JJ, Pelegri C, Vilaplana J.. Exploring the elusive composition of corpora amylacea of human brain. Sci Rep. 2018;8(1):13525. [DOI] [PMC free article] [PubMed] [Google Scholar]
- 22.Bankhead P, Loughrey MB, Fernandez JA, et al. QuPath: Open source software for digital pathology image analysis. Sci Rep. 2017;7(1):16878. [DOI] [PMC free article] [PubMed] [Google Scholar]
- 23.Rangel A, Burgaya F, Gavín R, Soriano E, Aguzzi A, Del Río JA.. Enhanced susceptibility of Prnp-deficient mice to kainate-induced seizures, neuronal apoptosis, and death: Role of AMPA/kainate receptors. J Neurosci Res. 2007;85(12):2741–2755. [DOI] [PubMed] [Google Scholar]
- 24.Rangel A, Madroñal N, Gruart A, et al. Regulation of GABA(A) and glutamate receptor expression, synaptic facilitation and long-term potentiation in the hippocampus of prion mutant mice. PLoS One. 2009;4(10):e7592. [DOI] [PMC free article] [PubMed] [Google Scholar]
- 25.Carulla P, Bribian A, Rangel A, et al. Neuroprotective role of PrPC against kainate-induced epileptic seizures and cell death depends on the modulation of JNK3 activation by GluR6/7-PSD-95 binding. Mol Biol Cell. 2011;22(17):3041–3054. [DOI] [PMC free article] [PubMed] [Google Scholar]
- 26.Brewer MK, Uittenbogaard A, Austin GL, et al. Targeting pathogenic Lafora bodies in Lafora disease using an antibody-enzyme fusion. Cell Metab. 2019;30(4):689–705.e686. [DOI] [PMC free article] [PubMed] [Google Scholar]
- 27.Sun RC, Dukhande VV, Zhou Z, et al. Nuclear glycogenolysis modulates histone acetylation in human non-small cell lung cancers. Cell Metab. 2019;30(5):903–916.e907. [DOI] [PMC free article] [PubMed] [Google Scholar]
- 28.Andres DA, Young LEA, Veeranki S, et al. Improved workflow for mass spectrometry-based metabolomics analysis of the heart. J Biol Chem. 2020;295(9):2676–2686. [DOI] [PMC free article] [PubMed] [Google Scholar]
- 29.Criado O, Aguado C, Gayarre J, et al. Lafora bodies and neurological defects in malin-deficient mice correlate with impaired autophagy. Hum Mol Genet. 2012;21(7):1521–1533. [DOI] [PubMed] [Google Scholar]
- 30.Lahuerta M, Gonzalez D, Aguado C, et al. Reactive glia-derived neuroinflammation: A novel hallmark in Lafora progressive myoclonus epilepsy that progresses with age. Mol Neurobiol. 2020;57(3):1607–1621. [DOI] [PMC free article] [PubMed] [Google Scholar]
- 31.Lopez-Gonzalez I, Viana R, Sanz P, Ferrer I.. Inflammation in Lafora disease: Evolution with disease progression in Laforin and Malin knock-out mouse models. Mol Neurobiol. 2017;54(5):3119–3130. [DOI] [PMC free article] [PubMed] [Google Scholar]
- 32.Rai A, Mishra R, Ganesh S.. Suppression of leptin signaling reduces polyglucosan inclusions and seizure susceptibility in a mouse model for Lafora disease. Hum Mol Genet. 2017;26(24):4778–4785. [DOI] [PubMed] [Google Scholar]
- 33.Ganesh S, Delgado-Escueta AV, Sakamoto T, et al. Targeted disruption of the Epm2a gene causes formation of Lafora inclusion bodies, neurodegeneration, ataxia, myoclonus epilepsy and impaired behavioral response in mice. Hum Mol Genet. 2002;11(11):1251–1262. [DOI] [PubMed] [Google Scholar]
- 34.Sanchez-Elexpuru G, Serratosa JM, Sanchez MP.. Sodium selenate treatment improves symptoms and seizure susceptibility in a malin-deficient mouse model of Lafora disease. Epilepsia. 2017;58(3):467–475. [DOI] [PMC free article] [PubMed] [Google Scholar]
- 35.Gentry MS, Afawi Z, Armstrong DD, et al. The 5th International Lafora Epilepsy Workshop: Basic science elucidating therapeutic options and preparing for therapies in the clinic. Epilepsy Behav. 2020;103(Pt A):106839. [DOI] [PMC free article] [PubMed] [Google Scholar]
- 36.Cataldo AM, Broadwell RD.. Cytochemical identification of cerebral glycogen and glucose-6-phosphatase activity under normal and experimental conditions. II. Choroid plexus and ependymal epithelia, endothelia and pericytes. J Neurocytol. 1986;15(4):511–524. [DOI] [PubMed] [Google Scholar]
- 37.Van Hoof F, Hageman-Bal M.. Progressive familial myoclonic epilepsy with Lafora bodies. Electron microscopic and histochemical study of a cerebral biopsy. Acta Neuropathol. 1967;7(4):315–336. [DOI] [PubMed] [Google Scholar]
- 38.Goubard V, Fino E, Venance L.. Contribution of astrocytic glutamate and GABA uptake to corticostriatal information processing. J Physiol. 2011;589(Pt 9):2301–2319. [DOI] [PMC free article] [PubMed] [Google Scholar]
- 39.Bellot-Saez A, Kekesi O, Morley JW, Buskila Y.. Astrocytic modulation of neuronal excitability through K(+) spatial buffering. Neurosci Biobehav Rev. 2017;77:87–97. [DOI] [PubMed] [Google Scholar]
- 40.Assefa BT, Gebre AK, Altaye BM.. Reactive astrocytes as drug target in Alzheimer's disease. BioMed Res Internat. 2018;2018:4160247- [DOI] [PMC free article] [PubMed] [Google Scholar]
- 41.Benraiss A, Wang S, Herrlinger S, et al. Human glia can both induce and rescue aspects of disease phenotype in Huntington disease. Nat Commun. 2016;7:11758. [DOI] [PMC free article] [PubMed] [Google Scholar]
- 42.Miyazaki I, Asanuma M.. Therapeutic strategy of targeting astrocytes for neuroprotection in Parkinson's disease. Curr Pharm Des. 2017;23(33):4936–4947. [DOI] [PubMed] [Google Scholar]
- 43.Kuter K, Olech Ł, Głowacka U, Paleczna M.. Astrocyte support is important for the compensatory potential of the nigrostriatal system neurons during early neurodegeneration. J Neurochem. 2019;148(1):63–79. [DOI] [PubMed] [Google Scholar]
- 44.Yamanaka K, Komine O.. The multi-dimensional roles of astrocytes in ALS. Neurosci Res. 2018;126:31–38. [DOI] [PubMed] [Google Scholar]
- 45.Puri R, Suzuki T, Yamakawa K, Ganesh S.. Dysfunctions in endosomal-lysosomal and autophagy pathways underlie neuropathology in a mouse model for Lafora disease. Hum Mol Genet. 2012;21(1):175–184. [DOI] [PubMed] [Google Scholar]
- 46.Coulter DA, Steinhauser C.. Role of astrocytes in epilepsy. Cold Spring Harbor Perspect Med. 2015;5(3):a022434. [DOI] [PMC free article] [PubMed] [Google Scholar]
- 47.Boison D, Steinhauser C.. Epilepsy and astrocyte energy metabolism. Epilepsy and astrocyte energy metabolism . Glia. 2018;66(6):1235–1243. [DOI] [PMC free article] [PubMed] [Google Scholar]
- 48.Rana A, Musto AE.. The role of inflammation in the development of epilepsy. J Neuroinflammation. 2018;15(1):144. [DOI] [PMC free article] [PubMed] [Google Scholar]
- 49.Israelian L, Nitschke S, Wang P.. Ppp1r3d deficiency preferentially inhibits neuronal and cardiac Lafora body formation in a mouse model of the fatal epilepsy Lafora disease. J Neurochem. 2021;157(6):1897–1910. [DOI] [PMC free article] [PubMed] [Google Scholar]
- 50.Dainese L, Monin ML, Demeret S, et al. Abnormal glycogen in astrocytes is sufficient to cause adult polyglucosan body disease. Gene. 2013;515(2):376–379. [DOI] [PMC free article] [PubMed] [Google Scholar]
- 51.Pirici I, Mărgăritescu C, Mogoantă L, et al. Corpora amylacea in the brain form highly branched three-dimensional lattices. Roman J Morphol Embryol. 2014;55(3 Suppl):1071–1077. [PubMed] [Google Scholar]
- 52.Rohn TT.Corpora amylacea in neurodegenerative diseases: Cause or effect? Int J Neurol Neurother. 2015;2(3):031. [DOI] [PMC free article] [PubMed] [Google Scholar]
Associated Data
This section collects any data citations, data availability statements, or supplementary materials included in this article.
Supplementary Materials
Data Availability Statement
Raw data and images are available upon request from the corresponding author.


