Abstract
Background
The process of spinal cord injury involves acute, subacute, and chronic stages; however, the specific pathological mechanism remains unclear. In this study, weighted gene co-expression network analysis (WGCNA) was used to clarify specific modules and hub genes that associated with SCI.
Methods
The gene expression profiles GEO Series (GSE)45006 and GEO Series (GSE)2599 were downloaded, and the co-expression network modules were identified by the WGCNA package. The protein-protein interaction (PPI) network and Venn diagram were constructed to identify hub genes. Quantitative real-time polymerase chain reaction (QRT-PCR) was used to quantify the degree of the top five candidate genes. Correlation analysis was also carried out between hub genes and immune infiltration.
Results
In total, 14,402 genes and seven modules were identified. The brown module was considered to be the most critical module for the chronic stage of SCI, which contained 775 genes that were primarily associated with various biological processes, including extracellular structure organization, lysosome, isoprenoid biosynthesis, response to nutrients, response to wounding, sulfur compound metabolic process, cofactor metabolic process, and ossification. Furthermore, C-X-C motif chemokine ligand 10 (CXCL10), myxovirus (influenza virus) resistance 1 (MX1), signal transducer and activator of transcription 1 (STAT1), interferon regulatory factor 7 (IRF7) and radical S-adenosyl methionine domain containing 2 (RSAD2) were identified as the hub genes in the PPI and Venn diagram network, and verified by qRT-PCR. Immune infiltration analysis revealed that CD8+ T cells, macrophages, neutrophils, plasmacytoid dendritic cells, helper T cells, Th2 cells, and tumor-infiltrating lymphocytes may be involved in the SCI process.
Conclusions
There were significant differences among the five hub genes (CXCL10, IRF7, MX1, RSAD2, and STAT1) of the brown module, which may be potential diagnostic and prognostic markers of SCI, and immune cell infiltration may play an important role in the chronic stage of SCI.
Keywords: Spinal cord injury (SCI), weighted gene co-expression network analysis (WGCNA), chronic stage, bioinformatics analysis
Introduction
In terms of self-healing ability, the central nervous system (CNS) is the most deficient system. As an important part of the CNS, spinal cord injury (SCI) is a common cause of disability. Severe injury to the spinal cord is accompanied by serious conduction obstacles of up and down pathways. With the development of transportation and the prevalence of extreme sports, the incidence of SCI continues to increase. According to the latest statistics, SCI affects more than 27.04 million people worldwide (1). Physical injury leads to hemorrhage and swelling of the injured spinal cord, ischemia, anoxia, and necrosis of neurons and glial cells. With the development of spinal cord edema and inflammation, necrosis and apoptosis of neurons and glial cells spread to tissues outside the injury center. The formation of glial scars can stabilize the spread of secondary injury, but also prevents the regeneration of axons (2-6). Inflammatory reaction, edema, ischemia, hypoxia, excitotoxicity, free radical injury, lipid peroxidation, apoptosis, formation of glial scars, and other secondary injuries (7,8) seriously affect the plasticity and functional recovery of nerves.
At present, a large number of experimental studies have shown that genes are up-regulated or down regulated after SCI, including interleukin-10, tropomyosin 4, B-cell lymphoma-2 associated X protein, B-cell lymphoma-2, vascular endothelial growth factor, caspase-3, aquaporin 4, etc. (9,10). However, most of these studies mainly focused on the relationship between single gene or protein and the changes in inflammation, apoptosis, and edema after SCI.
With the popularization of high-throughput sequencing technology, such as gene chip and RNA sequencing, analysis via comprehensive mining of public databases by bioinformatics emerged. Weighted gene co-expression network analysis (WGCNA) is a method for analyzing gene expression patterns in multiple samples. Genes are clustered through similar gene expression patterns to form modules that are analyzed for their relationship to specific characteristics, such as clinical information about patients (11,12). These modules and their key genes can be used to identify candidate biomarkers or therapeutic targets (13). Therefore, WGCNA is expected to be a powerful tool to reveal the possible pathological mechanism of SCI from the perspective of gene regulation.
In this study, we first time used the WCGA to mine the gene expression data that downloaded from Gene Expression Omnibus (GEO) database of the National Center for Biotechnology Information (NCBI). The weighted gene co-expression network (WGCN) system of SCI was explored to identify relevant modules and key regulatory genes. At the same time, biological methods were used for functional annotation and functional analysis of gene modules and key genes. We present the following article in accordance with the STREGA reporting checklist (available at https://dx.doi.org/10.21037/atm-21-3586).
Methods
Microarray data sources and processing
The study was conducted in accordance with the Declaration of Helsinki (as revised in 2013).
The aneurysm clip compression model of animal SCI mimics the main mechanism of human SCI, namely, acute shock and continuous compression. Also, its histopathology and behavioral results are very similar to human SCI. To understand the unique molecular events behind this injury model, we used the microarray gene chip method to analysis the overall genetic expression in the acute, subacute, and chronic phases of the spinal cord of moderate to severe injury rats. The series matrix file GSE45006 was downloaded from the NCBI GEO public database. There were 24 groups of transcriptional group data, including sham operation control groups (n=4), 1 day after SCI (n=4), 3 days after SCI (n=4), 1 week after SCI (n=4), 2 weeks after SCI (n=4), and 8 weeks after SCI (n=4) groups for the WGCNA co-expression network construction. The series matrix file data GSE2599 were also downloaded from the NCBI GEO public database. There were six transcriptional groups data, including 35 days after SCI groups (n=3) and uninjured control groups (n=3), which were used for subsequent model validation.
WGCNA
The R package ‘WGCNA’ was used to build the co-expression network of all genes in the GSE45006 data set. The top 5,000 genes were identified by this algorithm for further studies. The weighted adjacency matrix was transformed into the topological overlap matrix (TOM) to examine the network interaction, and used the hierarchical clustering method to create a cluster tree structure of the TOM matrix.
Functional enrichment analysis of gene modules
In order to obtain the biological functions and signal pathways involved in the WGCNA interest module, we used the Metascape database (www.metascape.org) to annotate and visualize genes in the specific module. The Gene Ontology (GO) analysis and Kyoto Encyclopedia of Genes and Genomes (KEGG) pathway analysis were carried out. The minimum overlap was ≥3, and P≤0.01 was considered statistically significant.
Identification of key genes in functional modules
All of the interest module genes were extracted, and a protein-protein interaction (PPI) network was constructed using the PPI networks functional enrichment analysis database (version 11.0, https://string-db.org), which was pictured using Cytoscape software v3.7.2 (http://www.cytoscape.org/). The degree of each gene was calculated, and the top five degree overlapping genes between GSE45006 and GSE2599 were selected as the hub genes. The classical t-test was conducted to compare and identify some differences between the hub gene expressions of these two groups of GSE45006, with a P<0.05 indicating statistical significance. Moreover, we used the ggplot2 package of R (http://www.bioconductor.org) to draw the bar plots of hub gene expression.
SCI
A total of 30 adult female Wistar rats weighing 250±25 g (10-week-old) were purchased from Gempharmatech Co. Ltd and were housed in a humidity- and temperature-controlled environment. Experiments were performed under a project license (IRM-DWLL-2019039) granted by the Ethics Committee of the Institute of Radiation Medicine, Chinese Academy of Medical Science & Peking Union Medical College (CAMS & PUMC), in compliance with National Institutes of Health in the Guide for the Care and Use of Laboratory Animals. The contusion SCI model was established using a New York University Impactor device (NYU, New York, USA) as previously described.
Quantitative real-time polymerase chain reaction (qRT-PCR) verification
Briefly, Total RNA was isolated from the rats using TRIZOL reagent (Invitrogen Corp, Carlsbad, CA), and was polyadenylated and reverse-transcribed with a poly(T) adapter into cDNA according to the manufacturer’s instructions. Real-time PCR was performed using SYBR green (Takara) dye in a thermal cycler with the following parameters: an initial denaturation step at 95 °C for 30 min; 40 cycles at 95 °C for 5 seconds; and 60 °C for 30 seconds. The complete experimental process was performed for each sample in triplicate. The mRNA- specific primers are in Table 1.
Table 1. mRNA-specific primers of hub genes.
| Gene | Primer | Sequence (5'-3') | PCR products |
|---|---|---|---|
| b-actin | Forward | CACGATGGAGGGGCCGGACTCATC | 240 bp |
| Reverse | TAAAGACCTCTATGCCAACACAGT | ||
| Rat MX1 | Forward | AGTATGAGGAGAAGGTGCGG | 222 bp |
| Reverse | CTCCCTGCTTCAGTTGCTTC | ||
| Rat IRF7 | Forward | CTGCTTTCTGGTGATGCTGG | 161 bp |
| Reverse | GTAGCTTCCATCTGCCATGC | ||
| Rat RSAD2 | Forward | ATGTTCTCATTGGTCGTGGC | 182 bp |
| Reverse | GAAAACCTTCCAGCGGACAG | ||
| Rat STAT1 | Forward | AGAGCGACCAGAAACAGGAA | 171 bp |
| Reverse | CACTCTGCTGTCTTCGCTTC | ||
| Rat CXCl10 | Forward | CAAGTGCTGCTGTCGTTCTC | 177 bp |
| Reverse | TCTCAACATGCGGACAGGAT |
Correlation analysis between hub genes and immune infiltration
To analyze correlation of hub genes and infiltrating immune cells, the “ggstatsplot” package (https://github.com/IndrajeetPatil/ggstatsplot) was used and visualize the results.
Flow cytometric analysis
The Central epicenters of injured spinal cord were separated and placed in Hank’s Balanced Salt Solution (GIBCO, NY). The tissue samples were filtered by 70 µm filter and the cell concentration was adjusted to 2×10⁶/mL. Cells were immobilized with paraformalin (4%, W/V) in PBS, permeated with 0.1% saponin at room temperature, and finally supplemented with CD4, CD19 antibodies in the dark, and evaluated by flow cytometry (BD Biosciences, SAN Jose, CA, USA).
Statistical analysis
All data were shown as mean ± standard error of the mean (SEM). GraphPad Prism 6.0 (GraphPad Software, Inc., La Jolla, CA, USA) was used for statistical analysis and image construction. Comparisons among multiple groups were performed with a one-way analysis of variance (ANOVA) followed by a Bonferroni correction. Significant differences in behavioural results were analyzed with a repeated-measures 2-way ANOVA and Tukey’s post hoc test. A P value <0.05 was considered statistically significant.
Results
Data processing
After normalization, the median lines of the box plot of GSE45006 datasets were at the same level. Successful normalization is shown in Figure 1. All filtered 14,402 probes were used for WGCNA.
Figure 1.
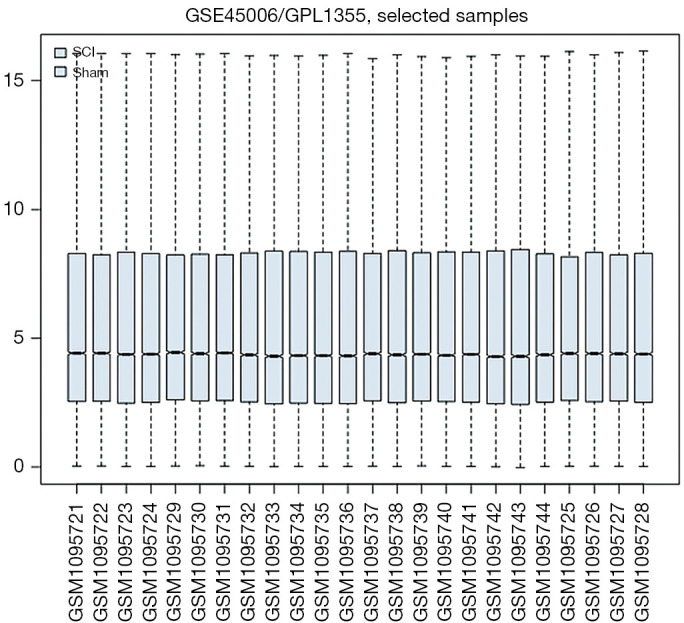
The box plots of gene expression in sham and spinal cord injury specimens. The x axis is the sample and the y axis is the gene expression level. The black line in the middle is the median of the expressed values.
Screening gene modules
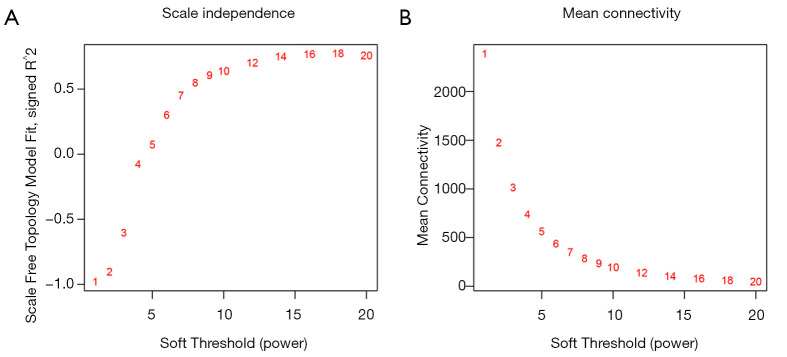
The expression matrix of the first 5,000 differentially expressed genes was extracted, which was used as input data for network construction. The weighting coefficient β was selected according to the scale-free network rule. According to the rules of the scale-free network, the larger the correlation coefficient, the more significant the scale-free characteristic of the network. Therefore, the correlation coefficient between the log (k) of the number of connected nodes k and the log (p[k]) of the probability of occurrence of the node was calculated under different β conditions. When the correlation coefficient was 0.55, β=18 was selected as the standard for module identification (Figure 2A). At the same time, the mean connectivity was 1, which indicated that the gene modules were built according to the closely approximate scale-free topology standard (Figure 2B).
Figure 2.
The topology network analysis under various soft threshold power. (A) The scale-free fitting index as a function of soft threshold power. (B) The connectivity as a function of soft threshold power.
WGCNA analysis
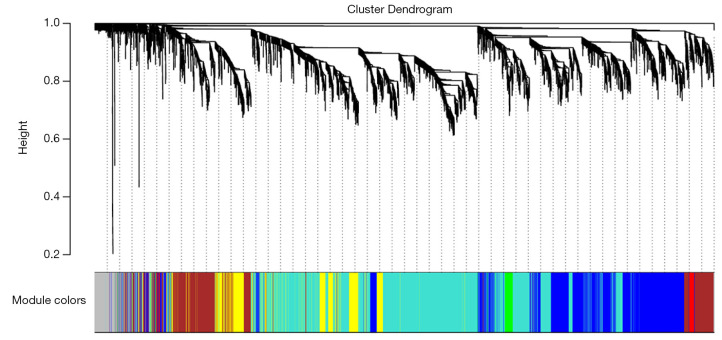
After the weighting coefficient β was determined, the expression matrix of differential genes was transformed into an adjacency matrix, topological matrix, and dissimilarity matrix between genes. Based on the TOM, gene clustering was conducted via the hierarchical clustering method, and identifying modules of the system cluster tree was conducted via the dynamic cutting algorithm. Seven different co-expression modules were obtained and represented in different colors when the criteria of the correlation coefficient square of eigengene was >0.9, the soft threshold power was 18, the number of genes was above 100, and the cut height was equal to 0.95 (Figure 3). These modules were classified from smallest to the largest number of gene involved. The result is displayed in Table 2.
Figure 3.
A cluster dendrogram of genes with different similarities based on topological overlap, and assigned module colors. Results seven co-expression modules were constructed and displayed in different colors.
Table 2. The number of genes in the 7 modules.
| Module colors | Number |
|---|---|
| Blue | 1,285 |
| Brown | 775 |
| Green | 84 |
| Grey | 248 |
| Red | 52 |
| Turquoise | 2,003 |
| Yellow | 553 |
Gene co-expression modules corresponded to clinic traits
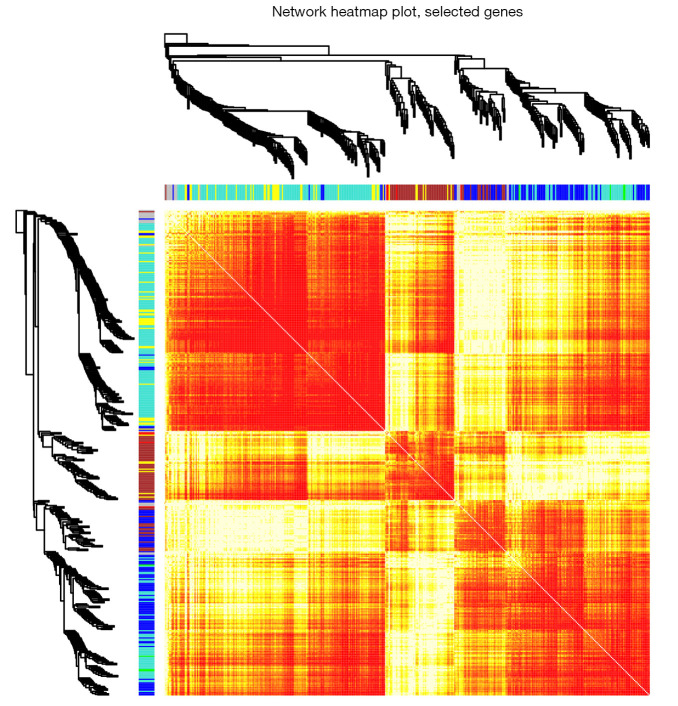
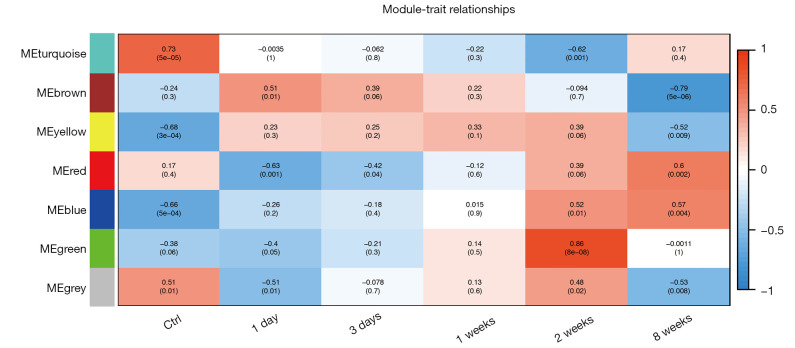
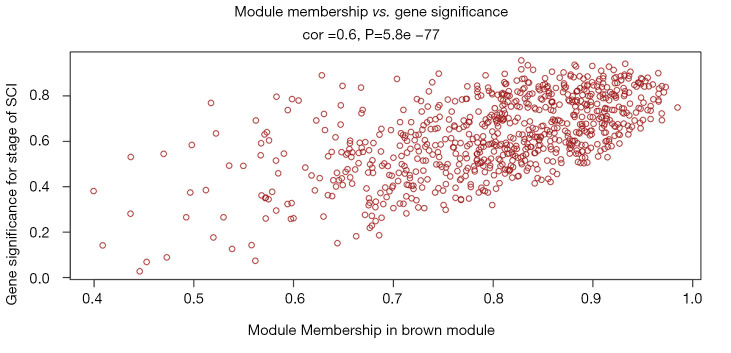
We plotted the interactions among the identified modules, and the heat map described the TOM of all included genes in the analysis (Figure 4). The light color indicated low overlap, and a darker red color indicated increased overlap. The results revealed that gene expression was relatively independent among the modules. We associated the modules with clinical features and looked for the most significant associations. The results showed that the relationship between the brown module and the chronic stage of SCI was the most significant (r=−0.79, P=5E-06, Figure 5). In this study, the hub genes that referred to the brown module were considered to be the genes most related to the chronic stage of SCI. The correlation analysis of module membership and gene significance showed that the selected module genes had a good correlation with the brown module (cor=0.6, P=5.8E-77, Figure 6).
Figure 4.
The heatmap plot of gene networks.
Figure 5.
Module-trait associations. Each row corresponds to a module trait gene, and each column corresponds to a trait.
Figure 6.
Scatter plot between brown module membership and the gene significance for the stage of SCI. SCI, spinal cord injury.
Functional enrichment analysis
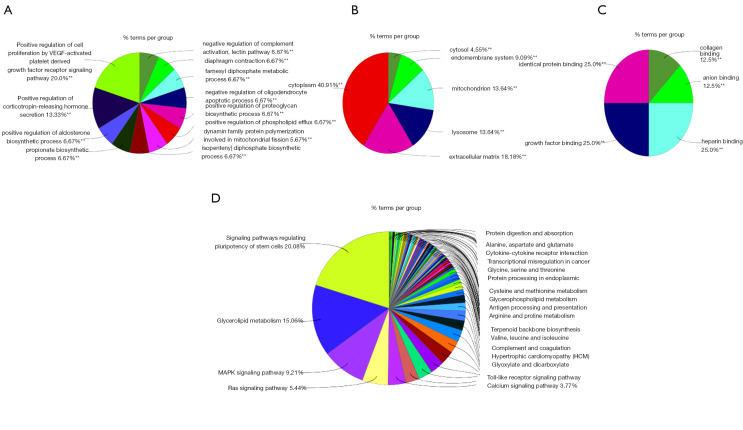
A GO and KEGG bioinformatics analysis of genes in the brown module was conducted (Figure 7), and the results exhibited that, in terms of the cellular components, these genes were primarily expressed in cholesterol biosynthesis. As for biological processes, these genes were mainly expressed in extracellular structure organization, lysosome, isoprenoid biosynthesis, response to nutrients, response to wounding, sulfur compound metabolic process, cofactor metabolic process, and ossification. Finally, the molecular function results indicated that the genes were mainly enriched in negative regulation of cell proliferation, as well as the regulation of cartilage development, regulation of steroid metabolic process, regulation of response to external stimuli, regulation of response to wound, urogenital system development, regulation of hemopoiesis, positive regulation of cell-substrate adhesion, membranous septum morphogenesis, positive regulation of lipid transport, and positive erythrocyte differentiation.
Figure 7.
The GO and KEGG enrichment analysis of the core genes. (A) The biological process analysis. (B) The cellular component analysis. (C) The molecular function analysis. (D) KEGG pathway analysis. **P<0.01. GO, Gene Ontology; KEGG, Kyoto Encyclopedia of Genes and Genomes.
KEGG pathway enrichment analysis of key genes showed that signaling pathways regulating the pluripotency of stem cells and glycosphingolipid biosynthesis, as well as the mitogen-activated protein kinase (MAPK), Toll-like receptor (TLR), and calcium signaling pathways were the most over-represented pathways.
PPI analysis of genes in interested modules
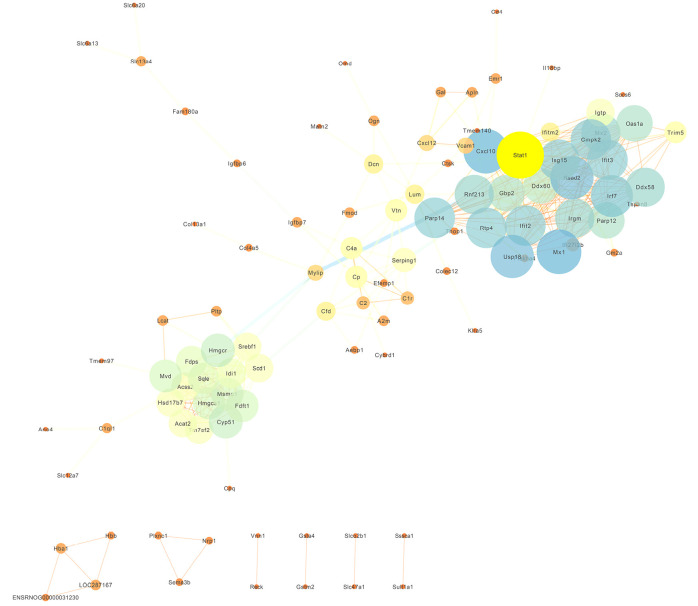
In order to study the interaction among these first 400 genes in the important brown module, a PPI network was constructed. The PPI network was composed of 367 interactions and 102 genes, and the hub genes in the brown module were bold with yellow (Figure 8).
Figure 8.
The PPI network of the brown module. The circles represent the hub genes in the modules, and the lines show the interaction between the hub genes. The different colors represent the different clustering genes. The thicker line represents higher connection strengths. PPI, protein-protein interaction.
Identification of hub genes
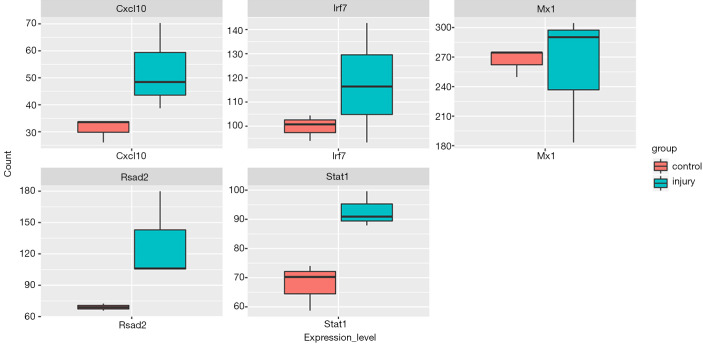
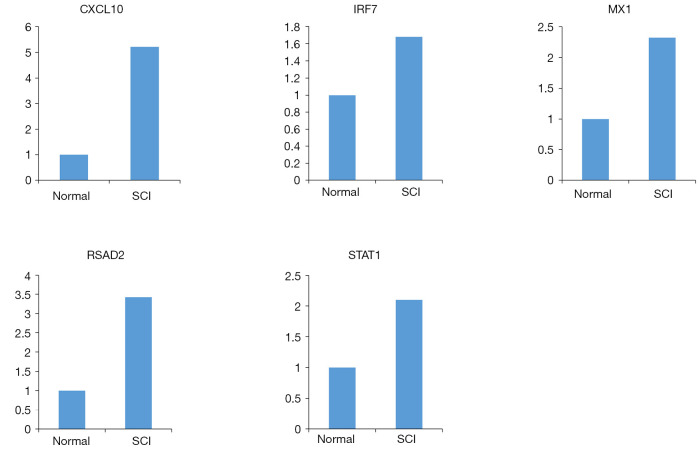
The GSE 2599 series matrix file data was downloaded from the GEO public database, and 1,394 differentially expressed genes were identified. These different genes were intersected with the hub genes of the brown module of GSE45006. Finally, 153 key candidate genes related to the chronic stage of SCI were confirmed in the Venn diagram (Figure 9). The overlapping genes were defined as key genes. The top five degrees intersected genes in the Vsenn diagram including C-X-C motif chemokine ligand 10 (CXCL10), interferon regulatory factor 7 (IRF7), myxovirus (influenza virus) resistance 1 (MX1), radical S-adenosyl methionine domain containing 2 (RSAD2), and signal transducer and activator of transcription 1 (STAT1), were displayed in Figure 10. In addition, to validate the bioinformatic chip analysis results, qRT-PCR was used to quantify the top five degree intersected genes (Figure 11), including CXCL10, IRF7, MX1, RSAD2, and STAT1 detected by qRT-PCR were significantly correlated with the corresponding gene alteration of the microarray data, and the mRNA expression levels of CXCL10, IRF7, MX1, RSAD2, and STAT1 were up-regulated in the chronic phases of the SCI groups compared with those in the normal spinal cord groups (P<0.05).
Figure 9.
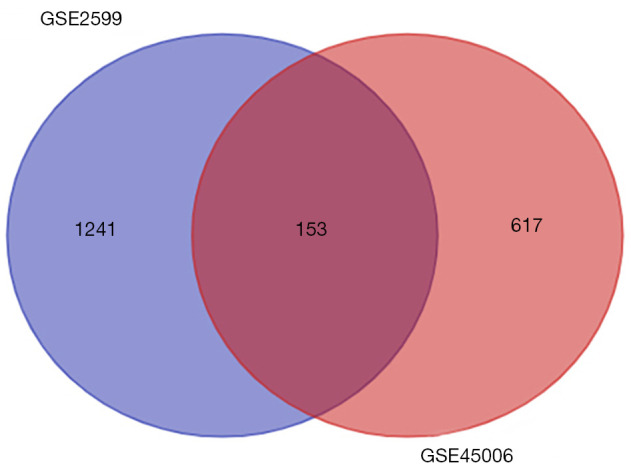
Venn diagram analysis of hub genes between GSE2599 and GSE45006.
Figure 10.
The expression levels of five key candidate genes based on PPI network data. The mRNA expression patterns of CXCl10, IRF7, MX1, RSAD2, and STAT1 genes based on the PPI count data. PPI, protein-protein interaction.
Figure 11.
qRT-PCR validation. qRT-PCR verification of five candidate genes in three pairs of the chronic phases of SCI samples of rats and normal spinal cord samples of rats. Expression of spinal cord injury vs. normal samples was analyzed using qRT-PCR, and summarized as mean average ± SE with P<0.05. qRT-PCR, quantitative real-time polymerase chain reaction; SCI, spinal cord injury; SE, standard error.
Correlation analysis between hub genes and immune infiltration
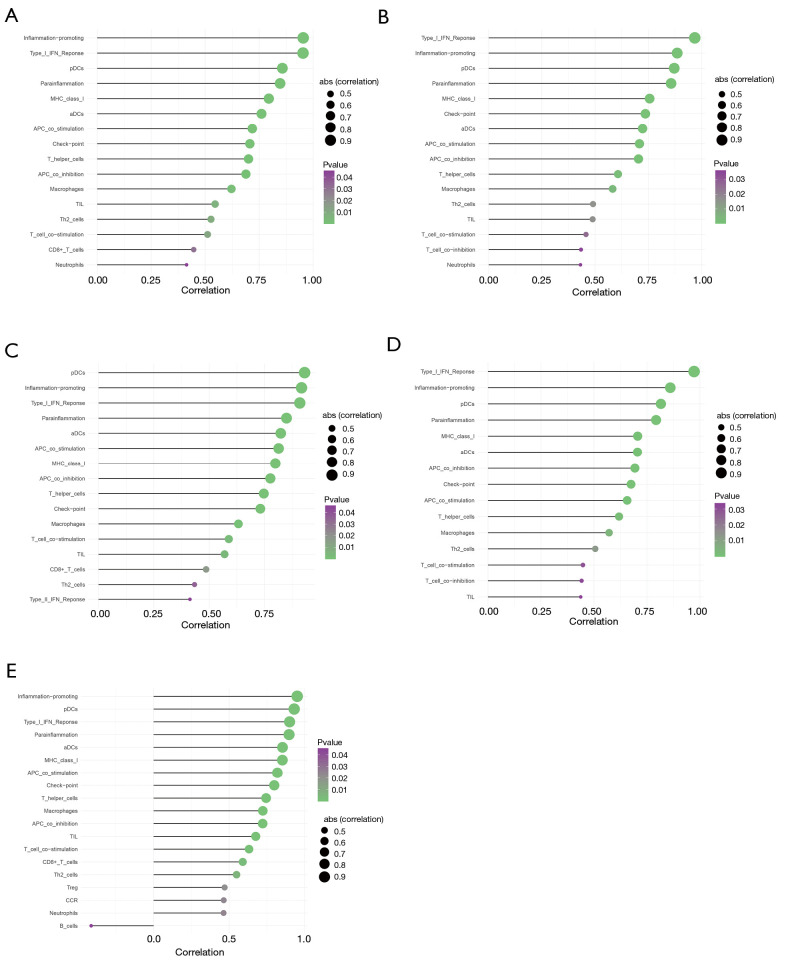
Immune infiltration analysis found that cluster of differentiation (CD)8+ T cells, macrophages, neutrophils, plasmacytoid dendritic cells (pDCs), helper T cells, T helper (Th)2 cells, and tumor-infiltrating lymphocyte (TILs) may be involved in the SCI process. Correlation analysis showed the following: (I) CXCL10 was positively correlated with the promotion of inflammation (cor=0.953913043, P=1.78E-06, Figure 12A); (II) interfern regulation factor (IRF)7 was positively correlated with type I (interfern regulation factor) IFN response (cor=0.968695652, P=1.43E-06, Figure 12B); (III) MX Dynamin Like GTPase 1 (MX1) was positively correlated with pDCs (cor=0.931304348, P=2.29E-06, Figure 12C); (IV) RSAD2 was positively correlated with type I IFN response (cor=0.972173913, P=1.34E-06, Figure 12D); and (V) STAT1 was positively correlated with the promotion of inflammation (cor=0.951304348, P=1.85E-06, Figure 12E).
Figure 12.
Correlation analysis between hub genes and infiltrating immune cells. CXCL10 (A), IRF7 (B), MX1 (C), RSAD2 (D), STAT1 (E) and infiltrating cells.
Infiltration immune cells in animal model of SCI
The number of infiltration immune cells were detected by flow cytometric analysis. As the results shown in Figure 13, the CD4+ T cells and CD19+ B cells were all increased significantly in SCI rats.
Figure 13.
The number of lymphocytes in the center of spinal cord injury of Rats. CD4+ cells (A), CD19+ cells (B). ***P<0.001. SCI, spinal cord injury.
Discussion
After SCI, primary and secondary injuries lead to sensory and motor dysfunction, which seriously affects the quality of life of families. Therefore, studying and treating SCI is crucial (14,15). In this study, seven co-expression modules were constructed using 5,000 genes from 24 sham operation control and SCI rat samples by WGCNA to test the relationship between the clinical traits of SCI and transcriptome data. Compared to other bioinformatics methods, WGCNA has many obvious advantages, since the analysis focuses on the relationship between clinical traits and co-expression modules, and thus the results are more complete, and have a higher reliability and biological significance (16,17). Genes in the same module are considered to be interrelated in function. Therefore, this analysis can identify biologically relevant modules and hub genes that could eventually be used as biomarkers for the detection or treatment of SCI.
In particular, in the chronic repair period after spinal cord injury, glial scars formed by cells such as astrocytes in the damaged area secretes a series of inhibitory proteins and cytokines, such as the Chondroitin Sulfate Proteoglycan (NG) 2 glycoprotein, to inhibit axon regeneration (18,19). Moreover, microglia in the damaged area remain active for weeks or even months, resulting in local chronic inflammation (20). Thus, the treatment of chronic SCI is more difficult. Our WGCNA analysis showed that the brown module was considered the module most related to the chronic stage of SCI (8 weeks). The results of GO enrichment analysis showed that the interaction between different modules varied, which was related to their distinct regulatory functions. Therefore, the brown module was found to be mainly related to the negative regulation of cell proliferation, as well as regulation of the response to wound and external stimuli, which were important molecular functions during SCI. Signaling pathways regulating the pluripotency of stem cells and glycosphingolipid biosynthesis, as well as the MAPK, TLR, and calcium signaling pathways were the most over-represented pathways related to the hub genes. The MAPK signaling pathway, as one of the important pathways regulating cell proliferation and apoptosis, can be activated by inflammatory cytokines and oxidative stress products released by SCI damage area, and participate in the proliferation and apoptosis of damaged local cells (21). Previous studies have shown that the p38 MAPK signaling pathway may participate in the regulation and conduction of apoptosis- and inflammatory response-related signals, which might be involved in the formation of local superoxide after SCI, thereby further aggravating SCI. However, it had also been demonstrated that maintaining p38 MAPK activity after SCI was beneficial to the recovery of neural function (22-24). It can be seen that the function of this kind of signaling pathway is complex, and the related signaling pathway network requires further study. Our results showed that the TLR signaling pathway had four associated genes, including our hub genes CXCL10, IRF7, and STAT1. TLRs can detect tissue damage (such as SCI) and induce an aseptic inflammatory response in neurons and glial subtypes (including microglia, astrocytes, and oligodendrocytes) in the CNS via the binding of endogenous ligands released by stress or damaged cells. In rats with persistent compressive SCI, the gene expression profile showed that TLR expression increased through the chronic phase of SCI (25); in particular, TLR2 and TLR4 play some neuroprotective roles in SCI (26). Furthermore, Wan et al. showed that miR-129-5p could inhibit apoptosis and the inflammatory response via the TLR4 pathway and reduce SCI in mice (27). Church et al. also reported new roles for TLR4 in repairing endogenous SCI, and showed that TLR supported the preservation of oligodendrocyte cell lines, long-term replacement of oligodendrocyte and oligodendrocyte progenitor cells, and chronic functional recovery of SCI (28).
One co-expression module was constructed, and the hub genes CXCL10, IRF7, MX1, RSAD2, and STAT1 related to the chronic stage of SCI were identified. Part of the inflammatory response is caused by the rapid influx of immune cells, including inflammatory monocytes and neutrophils, through the ruptured blood-spinal barrier. These cells infiltrate the site of injury within hours and secrete pro-inflammatory cytokines, reactive oxygen species, and nitric oxide, all of which may cause additional neuron cell death, axonal demyelination, and functional deficits following spinal cord injury (29,30). Neutrophils are the first peripheral immune cells to be recruited to SCI lesion sites (31), and macrophages play a beneficial role in creating a supportive environment for regrowing axons by phagocytosing myelin and axonal debris after SCI (32). However, the mechanisms by which these cells are modulated in the injured spinal cord remain unclear. To further explain the role of immune cell infiltration and hub genes in the chronic spinal cord injury, we conducted a comprehensive correlation analysis between hub genes and immune infiltration. Immune infiltration analysis found that CD8+ T cells, macrophages, neutrophils, pDCs, helper T cells, Th2 cells, and TILs may be involved in the chronic phase of the SCI process. Additionally, MX1 was significantly associated with pDCs.
CXCL10, namely interferon γ-inducible protein 10, belongs to the non-Glu-Leu-Arg (ELR) category of the CXC chemokine superfamily. Current research indicates that CXCL10 is involved in the immune regulation of various diseases. It mainly mediates the Thl-type inflammatory response, as well as the chemotaxis of monocytes and T cells, which can strengthen the process of Thl response and destroy the process of Th2 response. CXCL10 chemotactically accumulates leukocytes to the site of inflammation, and also plays an important role in tumor growth, angiogenesis, and organ sclerosis (33). Mordillo-Mateos et al. reported that there is a link between changes in circulating chemokine profiles during subacute traumatic SCI and pain development, as well as the severity of more chronic stages. In the early stage of the subacute phase, the levels of CXCL10 and C-C Motif Chemokine Ligand 2 (CCL2) in patients with pain were higher than those in patients without pain, and CXCL10 exhibits a downward trend over time (34). Gonzalez et al. demonstrated that CXCL10 aggravates secondary degeneration by blocking the function of CXCL10 before SCI, which suggests that an anti-CXCL10 antibody is a feasible treatment strategy for SCI (35). In addition, anti-CXCL10 antibody therapy provided an environment to reduce apoptosis and increase axonal sprouting following adult SCI (36).
IRF7 is a part of the interferon regulatory transcription factor family. IRFs participate in the regulation of various biological functions, such as the immune response, inflammation, and apoptosis response (37). Cohen et al. found that the ability of pro-inflammatory to anti-inflammatory (M1-to-M2) phenotype transformation of macrophages is controlled by IRF7, which is down-regulated by the Transforming Growth Factor Beta 1 (TGFB1) pathway. In vivo induction of the expression of IRF7 in microglia can reduce its pro-inflammatory activity after SCI (37).
STAT1 is the first member of the STAT family to be discovered. It is a conserved C-terminal activation region that is activated by tyrosine kinase and mitogen-activated protein kinase. Amino acid and serine residues are phosphorylated to form a dimer and translocate into the nucleus to regulate target genes. It primarily plays a role in promoting apoptosis, inhibiting cell proliferation, negatively dividing the cell cycle, inhibiting tumor angiogenesis, attenuating tumor migration and invasion ability, etc. (38). Osuka et al. showed that neuronal death after cerebral ischemia is related to STAT1, and STAT3 was found to regulate cell survival, which suggests that regulating the functional balance of STAT1 and STAT3 may determine the survival situation of neurons after SCI (38). Wu et al.’s results indicated that selective STAT1 inhibition can reduce the injury of nerve tissue and locomotor dysfunction by regulating the inflammatory response and possible apoptosis (39). Wu et al. also believed that STAT1 inhibitors reduced SCI by reducing apoptosis (40).
In conclusion, the brown module was considered to be the most critical module for the chronic stage of SCI. There were significant differences among the five hub genes, including CXCL10, IRF7, MX1, RSAD2, and STAT1, of the brown module, which may be potential diagnostic and prognostic markers of SCI. Immune cell infiltration may also play an important role in the chronic stage of SCI.
Supplementary
The article’s supplementary files as
Acknowledgments
Funding: This study was supported by the National Key Research and Development Project of Stem Cell and Transformation Research (2019YFA0112100) and the Tianjin Key Research and Development Plan, Key Projects for Science and Technology Support (19YFZCSY00660).
Ethical Statement: The authors are accountable for all aspects of the work in ensuring that questions related to the accuracy or integrity of any part of the work are appropriately investigated and resolved. The study was conducted in accordance with the Declaration of Helsinki (as revised in 2013). Experiments were performed under a project license (IRM-DWLL-2019039) granted by the Ethics Committee of the Institute of Radiation Medicine, Chinese Academy of Medical Science & Peking Union Medical College (CAMS & PUMC), in compliance with National Institutes of Health in the Guide for the Care and Use of Laboratory Animals.
Reporting Checklist: The authors have completed the STREGA reporting checklist. Available at https://dx.doi.org/10.21037/atm-21-3586
Data Sharing Statement: Available at https://dx.doi.org/10.21037/atm-21-3586
Conflicts of Interest: All authors have completed the ICMJE uniform disclosure form (available at https://dx.doi.org/10.21037/atm-21-3586). The authors have no conflicts of interest to declare.
(English Language Editor: A. Kassem)
References
- 1.GBD 2016 Traumatic Brain Injury and Spinal Cord Injury Collaborators. Global, regional, and national burden of traumatic brain injury and spinal cord injury, 1990-2016: a systematic analysis for the Global Burden of Disease Study 2016. Lancet Neurol 2019;18:56-87. [DOI] [PMC free article] [PubMed] [Google Scholar]
- 2.Tran AP, Warren PM, Silver J. The Biology of Regeneration Failure and Success After Spinal Cord Injury. Physiol Rev 2018;98:881-917. 10.1152/physrev.00017.2017 [DOI] [PMC free article] [PubMed] [Google Scholar]
- 3.Yao X, Zhang Y, Hao J, et al. Deferoxamine promotes recovery of traumatic spinal cord injury by inhibiting ferroptosis. Neural Regen Res 2019;14:532-41. 10.4103/1673-5374.245480 [DOI] [PMC free article] [PubMed] [Google Scholar]
- 4.Huang H, Young W, Skaper S, et al. Clinical Neurorestorative Therapeutic Guidelines for Spinal Cord Injury (IANR/CANR version 2019). J Orthop Translat 2020;20:14-24. 10.1016/j.jot.2019.10.006 [DOI] [PMC free article] [PubMed] [Google Scholar]
- 5.Fan B, Wei Z, Yao X, et al. Microenvironment Imbalance of Spinal Cord Injury. Cell Transplant 2018;27:853-66. 10.1177/0963689718755778 [DOI] [PMC free article] [PubMed] [Google Scholar]
- 6.Ma C, Zhang P, Shen Y X . Progress in research into spinal cord injury repair: Tissue engineering scaffolds and cell transdifferentiation. Journal of Neurorestoratology 2019;7:196-206. 10.26599/JNR.2019.9040024 [DOI] [Google Scholar]
- 7.Alizadeh A, Dyck SM, Karimi-Abdolrezaee S. Traumatic Spinal Cord Injury: An Overview of Pathophysiology, Models and Acute Injury Mechanisms. Front Neurol 2019;10:282. 10.3389/fneur.2019.00282 [DOI] [PMC free article] [PubMed] [Google Scholar]
- 8.Gong L, Lv Y, Li S, et al. Changes in transcriptome profiling during the acute/subacute phases of contusional spinal cord injury in rats. Ann Transl Med 2020;8:1682. 10.21037/atm-20-6519 [DOI] [PMC free article] [PubMed] [Google Scholar]
- 9.Cabrera-Aldana EE, Ruelas F, Aranda C, et al. Methylprednisolone Administration Following Spinal Cord Injury Reduces Aquaporin 4 Expression and Exacerbates Edema. Mediators Inflamm 2017;2017:4792932. 10.1155/2017/4792932 [DOI] [PMC free article] [PubMed] [Google Scholar]
- 10.Chen MH, Ren QX, Yang WF, et al. Influences of HIF-lα on Bax/Bcl-2 and VEGF expressions in rats with spinal cord injury. Int J Clin Exp Pathol 2013;6:2312-22. [PMC free article] [PubMed] [Google Scholar]
- 11.Langfelder P, Horvath S. WGCNA: an R package for weighted correlation network analysis. BMC Bioinformatics 2008;9:559. 10.1186/1471-2105-9-559 [DOI] [PMC free article] [PubMed] [Google Scholar]
- 12.Wang H, Liu J, Li J, et al. Identification of gene modules and hub genes in colon adenocarcinoma associated with pathological stage based on WGCNA analysis. Cancer Genet 2020;242:1-7. 10.1016/j.cancergen.2020.01.052 [DOI] [PubMed] [Google Scholar]
- 13.Zhu XL, Ai ZH, Wang J, et al. Weighted gene co-expression network analysis in identification of endometrial cancer prognosis markers. Asian Pac J Cancer Prev 2012;13:4607-11. 10.7314/APJCP.2012.13.9.4607 [DOI] [PubMed] [Google Scholar]
- 14.Saxena T, Loomis KH, Pai SB, et al. Nanocarrier-mediated inhibition of macrophage migration inhibitory factor attenuates secondary injury after spinal cord injury. ACS Nano 2015;9:1492-505. 10.1021/nn505980z [DOI] [PubMed] [Google Scholar]
- 15.Yao X, Sun C, Fan B, et al. Neurotropin exerts neuroprotective effects after spinal cord injury by inhibiting apoptosis and modulating cytokines. J Orthop Translat 2021;26:74-83. 10.1016/j.jot.2020.02.011 [DOI] [PMC free article] [PubMed] [Google Scholar]
- 16.Li D, Dossa K, Zhang Y, et al. GWAS Uncovers Differential Genetic Bases for Drought and Salt Tolerances in Sesame at the Germination Stage. Genes (Basel) 2018;9:87. 10.3390/genes9020087 [DOI] [PMC free article] [PubMed] [Google Scholar]
- 17.Shi K, Bing ZT, Cao GQ, et al. Identify the signature genes for diagnose of uveal melanoma by weight gene co-expression network analysis. Int J Ophthalmol 2015;8:269-74. [DOI] [PMC free article] [PubMed] [Google Scholar]
- 18.Cregg JM, DePaul MA, Filous AR, et al. Functional regeneration beyond the glial scar. Exp Neurol 2014;253:197-207. 10.1016/j.expneurol.2013.12.024 [DOI] [PMC free article] [PubMed] [Google Scholar]
- 19.Wanner IB, Anderson MA, Song B, et al. Glial scar borders are formed by newly proliferated, elongated astrocytes that interact to corral inflammatory and fibrotic cells via STAT3-dependent mechanisms after spinal cord injury. J Neurosci 2013;33:12870-86. 10.1523/JNEUROSCI.2121-13.2013 [DOI] [PMC free article] [PubMed] [Google Scholar]
- 20.David S, Greenhalgh AD, Kroner A. Macrophage and microglial plasticity in the injured spinal cord. Neuroscience 2015;307:311-8. 10.1016/j.neuroscience.2015.08.064 [DOI] [PubMed] [Google Scholar]
- 21.Ye J, Xue R, Ji ZY, et al. Effect of NT-3 on repair of spinal cord injury through the MAPK signaling pathway. Eur Rev Med Pharmacol Sci 2020;24:2165-72. [DOI] [PubMed] [Google Scholar]
- 22.Ji RR, Woolf CJ. Neuronal plasticity and signal transduction in nociceptive neurons: implications for the initiation and maintenance of pathological pain. Neurobiol Dis 2001;8:1-10. 10.1006/nbdi.2000.0360 [DOI] [PubMed] [Google Scholar]
- 23.Kumar S, Boehm J, Lee JC. p38 MAP kinases: key signalling molecules as therapeutic targets for inflammatory diseases. Nat Rev Drug Discov 2003;2:717-26. 10.1038/nrd1177 [DOI] [PubMed] [Google Scholar]
- 24.Song Y, Liu J, Zhang F, et al. Antioxidant effect of quercetin against acute spinal cord injury in rats and its correlation with the p38MAPK/iNOS signaling pathway. Life Sci 2013;92:1215-21. 10.1016/j.lfs.2013.05.007 [DOI] [PubMed] [Google Scholar]
- 25.Chamankhah M, Eftekharpour E, Karimi-Abdolrezaee S, et al. Genome-wide gene expression profiling of stress response in a spinal cord clip compression injury model. BMC Genomics 2013;14:583. 10.1186/1471-2164-14-583 [DOI] [PMC free article] [PubMed] [Google Scholar]
- 26.Freria CM, Velloso LA, Oliveira AL. Opposing effects of Toll-like receptors 2 and 4 on synaptic stability in the spinal cord after peripheral nerve injury. J Neuroinflammation 2012;9:240. 10.1186/1742-2094-9-240 [DOI] [PMC free article] [PubMed] [Google Scholar]
- 27.Wan G, An Y, Tao J, et al. MicroRNA-129-5p alleviates spinal cord injury in mice via suppressing the apoptosis and inflammatory response through HMGB1/TLR4/NF-κB pathway. Biosci Rep 2020;40:BSR20193315. 10.1042/BSR20193315 [DOI] [PMC free article] [PubMed] [Google Scholar]
- 28.Church JS, Kigerl KA, Lerch JK, et al. TLR4 Deficiency Impairs Oligodendrocyte Formation in the Injured Spinal Cord. J Neurosci 2016;36:6352-64. 10.1523/JNEUROSCI.0353-16.2016 [DOI] [PMC free article] [PubMed] [Google Scholar]
- 29.Donnelly DJ, Popovich PG. Inflammation and its role in neuroprotection, axonal regeneration and functional recovery after spinal cord injury. Exp Neurol 2008;209:378-88. 10.1016/j.expneurol.2007.06.009 [DOI] [PMC free article] [PubMed] [Google Scholar]
- 30.Park J, Zhang Y, Saito E, et al. Intravascular innate immune cells reprogrammed via intravenous nanoparticles to promote functional recovery after spinal cord injury. Proc Natl Acad Sci U S A 2019;116:14947-54. 10.1073/pnas.1820276116 [DOI] [PMC free article] [PubMed] [Google Scholar]
- 31.Fleming JC, Norenberg MD, Ramsay DA, et al. The cellular inflammatory response in human spinal cords after injury. Brain 2006;129:3249-69. 10.1093/brain/awl296 [DOI] [PubMed] [Google Scholar]
- 32.Lim EF, Hoghooghi V, Hagen KM, et al. Presence and activation of pro-inflammatory macrophages are associated with CRYAB expression in vitro and after peripheral nerve injury. J Neuroinflammation 2021;18:82. 10.1186/s12974-021-02108-z [DOI] [PMC free article] [PubMed] [Google Scholar]
- 33.Chen Y, Yin D, Fan B, et al. Chemokine CXCL10/CXCR3 signaling contributes to neuropathic pain in spinal cord and dorsal root ganglia after chronic constriction injury in rats. Neurosci Lett 2019;694:20-8. 10.1016/j.neulet.2018.11.021 [DOI] [PubMed] [Google Scholar]
- 34.Mordillo-Mateos L, Sánchez-Ramos A, Coperchini F, et al. Development of chronic pain in males with traumatic spinal cord injury: role of circulating levels of the chemokines CCL2 and CXCL10 in subacute stage. Spinal Cord 2019;57:953-9. 10.1038/s41393-019-0311-3 [DOI] [PubMed] [Google Scholar]
- 35.Gonzalez R, Hickey MJ, Espinosa JM, et al. Therapeutic neutralization of CXCL10 decreases secondary degeneration and functional deficit after spinal cord injury in mice. Regen Med 2007;2:771-83. 10.2217/17460751.2.5.771 [DOI] [PubMed] [Google Scholar]
- 36.Glaser J, Gonzalez R, Sadr E, et al. Neutralization of the chemokine CXCL10 reduces apoptosis and increases axon sprouting after spinal cord injury. J Neurosci Res 2006;84:724-34. 10.1002/jnr.20982 [DOI] [PubMed] [Google Scholar]
- 37.Cohen M, Matcovitch O, David E, et al. Chronic exposure to TGFβ1 regulates myeloid cell inflammatory response in an IRF7-dependent manner. EMBO J 2014;33:2906-21. 10.15252/embj.201489293 [DOI] [PMC free article] [PubMed] [Google Scholar]
- 38.Osuka K, Watanabe Y, Usuda N, et al. Activation of STAT1 in neurons following spinal cord injury in mice. Neurochem Res 2011;36:2236-43. 10.1007/s11064-011-0547-6 [DOI] [PubMed] [Google Scholar]
- 39.Wu Y, Yang L, Mei X, et al. Selective inhibition of STAT1 reduces spinal cord injury in mice. Neurosci Lett 2014;580:7-11. 10.1016/j.neulet.2013.11.055 [DOI] [PubMed] [Google Scholar]
- 40.Wu YX, Gao CZ, Fan KL, et al. STAT1 inhibitor alleviates spinal cord injury by decreasing apoptosis. Genet Mol Res 2016. 10.4238/gmr.15017271 [DOI] [PubMed] [Google Scholar]
Associated Data
This section collects any data citations, data availability statements, or supplementary materials included in this article.
Supplementary Materials
The article’s supplementary files as


