

SUMMARY
With the increasing prevalence of type 2 diabetes and fatty liver disease, there is still an unmet need to better treat hyperglycemia and hyperlipidemia. Here, we identify Isthmin-1 (Ism1) as an adipokine, and one that has a dual role in increasing adipose glucose uptake while suppressing hepatic lipid synthesis. Ism1 ablation results in impaired glucose tolerance, reduced adipose glucose uptake and reduced insulin sensitivity, demonstrating an endogenous function for Ism1 in glucose regulation. Mechanistically, Ism1 activates a PI3K-AKT signaling pathway independently of the insulin and insulin-like growth factor receptors. Notably, while the glucoregulatory function is shared with insulin, Ism1 counteracts lipid accumulation in the liver by switching hepatocytes from a lipogenic to a protein synthesis state. Furthermore, therapeutic dosing of recombinant Ism1 improves diabetes in diet-induced obese mice and ameliorates hepatic steatosis in a diet-induced fatty liver mouse model. These findings uncover an unexpected, bioactive protein hormone that might have simultaneous therapeutic potential for diabetes and fatty liver disease.
eTOC blurb
Here, Zewen Jiang et al. describe the discovery of Isthmin-1 (ISM1) as an adipose-secreted polypeptide hormone. ISM1 has dual roles in increasing adipocyte glucose uptake while suppressing hepatic lipid synthesis, thus improving hyperglycemia and reducing lipid accumulation in mouse models. ISM1, therefore, may offer a new therapeutic opportunity to simultaneously treat diabetes and fatty liver disease.
Graphical Abstract

INTRODUCTION
The growing epidemic of metabolic disorders has increased the need for a greater mechanistic understanding of the molecular basis for glucose and lipid regulation in normal physiology and pathophysiology. Glucose homeostasis balances glucose uptake, mainly by skeletal muscle, heart and adipose tissue, and glucose production, predominantly by the liver, kidney and gut (Petersen et al., 2017; Samuel and Shulman, 2016). Activation of brown or beige fat in humans has been shown to increase both basal and insulin-stimulated whole-body glucose disposal, demonstrating a physiologically significant role for these tissues in glucose regulation (Chondronikola et al., 2014). By using 18F-fluoro-2-deoxy-d-glucose positron emission tomography (18F-FDG-PET), several groups have shown that glucose uptake into thermogenic adipose tissues in humans can be induced by cold exposure or by pharmacological activation of the β-adrenergic receptors (Cypess et al., 2009; Saito et al., 2009; van Marken Lichtenbelt et al., 2009; Virtanen et al., 2009). These findings are in agreement with studies in rodents showing that loss of the futile creatine cycle from adipose tissues causes obesity and worsens glucose tolerance (Kazak et al., 2019, 2017). Furthermore, brown fat transplanted into the visceral cavity of mice can improve glucose tolerance and improve insulin sensitivity (Cohen et al., 2014; Kajimura et al., 2009; Stanford et al., 2013).
There is mounting evidence that thermogenic adipose tissue can mediate some of the beneficial effects through secreted factors, but the molecules and pathways remain incompletely understood. Several studies have identified autocrine or paracrine mediators of glucose metabolism, including fibroblast growth factor 21 (FGF21) (Fisher et al., 2012), interleukin-6 (IL-6) (Stanford et al., 2013), slit2-C (Svensson et al., 2016) and neuregulin 4 (Wang et al., 2014). Two pathways have been proposed to increase glucose uptake in adipose tissue: insulin-dependent glucose uptake during anabolic processes and insulin-independent glucose uptake by molecules such as fibroblast growth factor 21 (FGF21), or norepinephrine during thermogenesis (Dallner et al., 2006; Fisher et al., 2012). Importantly, under hyperinsulinemia, insulin promotes lipid synthesis, a process that contributes to the development of non-alcoholic fatty liver disease (Kim et al., 1998b; Petersen and Shulman, 2018; Sanyal et al., 2001). As a consequence, hyperinsulinemia further exacerbates the metabolic triad of hyperglycemia, hypertriglyceridemia and insulin resistance. Current insulin therapies and insulin-sensitizing agents are often associated with undesirable effects, such as increases in hepatic lipid synthesis. Identifying pathways to simultaneously increase peripheral glucose uptake while suppressing hepatic lipid accumulation would be beneficial for an overall improvement of metabolic syndrome. Interestingly, mice lacking beige adipose tissue have worsened hepatic steatosis, suggesting the existence of fat-derived paracrine factors that can regulate lipid accumulation (Cohen et al., 2014).
Here, we demonstrate an unusual dual metabolic role for the poorly understood secreted protein Isthmin-1 (ISM1). Ism1 was first identified as a gene expressed in the Xenopus midbrain-hindbrain organizer called Isthmus, with a proposed role during early brain development (Osoŕio et al., 2014; Valle-Rios et al., 2014; Venugopal et al., 2015). The Ism1 gene is conserved in mice and humans, but the function in adult physiology has remained elusive. We show with genetic models and pharmacological approaches that Ism1 is a signaling polypeptide factor that regulates glucose uptake while suppressing lipid accumulation. Therefore, Ism1 is a bioactive peptide hormone that dissociates glucose uptake from lipid synthesis, providing new insights into metabolic regulation while also offering new therapeutic avenues for the simultaneous treatment of glucose and lipid-associated disorders.
RESULTS
Ism1 is an adipokine that induces glucose uptake in human and mouse adipocytes
Activation of thermogenic adipose tissue is associated with improved metabolic health, but the secreted factors from such adipocytes remain understudied. To identify adipose tissue-derived proteins with hormone-like properties, we combined bioinformatic analyses with expression data on mature brown and white adipocytes. First, we utilized an RNA sequencing dataset from mature adipocytes isolated from murine inguinal (iWAT), epididymal (eWAT), and brown adipocytes (BAT) using ucp1-TRAP mice (Long et al., 2014) and applying the secreted prediction software SignalP. This filter generated 512 predicted secreted proteins. Second, to capture only those proteins that were bona fide secreted factors via classical secretion, we screened these genes against peptides detected from the TMT multiplexed proteomic secretome from cultured adipocytes derived from “beiged” ap2-PRDM16 mice (Svensson et al., 2016). This generated a list of 16 proteins that we classify as “hormone-like” (Fig S1A and Table S1). Two independent peptides were found specific to the protein Ism1 in secreted medium from cultured adipocytes, confirming the presence and identity of the mature protein as a secreted molecule with an average peptide intensity of 150 in adipocytes (Fig 1A–B). Ism1 is also enriched in mature brown fat cells compared to iWAT and eWAT by RNA sequencing of the adiponectin-TRAP mice (Fig S1A) (Chen et al., 2017) and has higher expression in BAT relative to iWAT (Fig S1B). Furthermore, Ism1 expression is higher in ap2-prdm16 “beiged” inguinal white fat (Fig S1C–D) and is induced in iWAT upon cold exposure (Fig S1E–F). Importantly, RNA and protein analyses of isolated mature adipocytes demonstrate that Ism1 is almost exclusively expressed in mature fat cells (Fig 1C–D), while negligible Ism1 expression is seen in the stromal vascular fractions from the adipose tissue. The shared expression signatures between Ism1, Adipoq, and Pparg (Fig 1C) are also evident by the robust increase of Ism1 during differentiation (Fig 1E). Besides adipose tissues, Ism1 is also expressed in other cell types, such as in the skin, in mucosal tissues, and in immune cells (Valle-Rios et al., 2014; Venugopal et al., 2015). Here we observe robust expression of Ism1 in mature fat cells, but no function in adipose tissue or in metabolism has previously been described, to the best of our knowledge.
Figure 1. Ism1 is an adipokine that induces glucose uptake in human and mouse adipocytes.

(A) LC-MS analysis detection of mouse Ism1 peptides in red from adipocyte conditioned media (n = 2). Representative of 2 biological replicates.
(B) LC-MS analysis using TMT-labeling demonstrating relative Ism1 protein secretion in conditioned media from wt (n = 2) or ap2-prdm16tg (n = 2) adipocytes. Representative of 2 biological replicates.
(C) qRT-PCR of Ism1, Adipoq, Pparg and Pdgfr-a in isolated mature brown fat adipocytes and in the stromal vascular fraction (n = 3). 1 technical replicate of 3 biological samples.
(D) Representative western blots (n = 2 in total) of Ism1 and β-actin in isolated mature brown fat adipocytes and in the stromal vascular fraction. Recombinant Ism1 protein was used as standard.
(E)Ism1 gene expression levels in brown fat adipocytes during differentiation (n = 3). 1 technical replicate of 3 biological samples.
(F) Representative silverstain and Ism1 immunoblot (n = 3 in total) of native and deglycosylated recombinant mouse Ism1.
(G) Representative size exclusion chromatography (n = 2 in total) of recombinant Ism1 protein under native conditions.
(H) Representative LC-MS analysis of recombinant Ism1 protein showing high purity by spectral counts and number of unique peptides (1 biological replicate).
(I) 2-deoxy-H3-glucose uptake in human SGBS adipocytes treated with insulin or Ism1 protein for 30 minutes (n=6). 1 technical replicate of 6 biological samples.
(J) 2-deoxy-H3-glucose uptake in mouse primary adipocytes treated with control or Ism1 (n = 15). 1 technical replicate of 15 biological samples across four biologically independent experiments.
(K) 2-deoxy-H3-glucose uptake in mouse primary adipocytes treated with insulin, Ism1, or a combination of Ism1 and insulin for 1h (n = 3). 1 technical replicate of 3 biological samples.
(L) 2-deoxy-H3-glucose uptake in human primary skeletal muscle cells treated with Ism1 or insulin for 1h (n = 3). 1 technical replicate of 3 biological samples.
(M) Representative images (n = 4 of two biological samples) of membrane localization of GLUT4 in primary adipocytes after treatment with 100 nM insulin or 100 nM Ism1 protein for 24 hours.
(N) Representative protein levels of Glut4 in isolated plasma membranes in primary mouse adipocytes (n = 3 biological samples) treated with 100 nM Ism1 protein or 100 nM insulin for 4h compared with the cytosolic fractions. Pdgfr-α is used as loading control.
(O)Ism1 and Adipoq gene expression levels in lacZ-shRNA or Ism1-shRNA adipocytes (n = 4).
(P) 2-deoxy-H3-glucose uptake in lacZ-shRNA or Ism1-shRNA adipocytes (n = 4 biological replicates).
(Q) Representative western blot (n = 2 in total) of pAKTS473, total AKT and β-actin in lacZ-shRNA or Ism1-shRNA adipocytes.
(R) Quantification of pARTS473/total ART protein expression quantified from two independent experiments (n = 2 biological replicates in total from 2 independent experiments) in lacZ-shRNA or Ism1-shRNA adipocytes.
(S) 2-deoxy-H3-glucose uptake in Ism1-shRNA adipocytes treated with indicated concentrations of insulin for 1h compared with lacZ-shRNA (n = 3 biological replicates).
(T) Representative western blot (n = 1 biological replicate of 2 biological samples) of pAKTS473, total AKT, and β-actin in lacZ-shRNA or Ism1-shRNA adipocytes treated with indicated concentrations of insulin for 5 min.
(U) Quantification of protein expression pAKTS473/total AKT quantified from 2 independent experiments with 1 replicate per sample.
Data are presented as mean ± S.E.M of biologically independent samples. *P < 0.05, **P < 0.01, ***P < 0.001 by two-tailed Student’s t-test (c, e, i, j, k, 1, o, p, r, s, u).
To test Ism1’s possible metabolic functions, we generated recombinant mouse Ism1 protein with a C-terminal myc-his tag in mammalian HEK 293 Expi cells followed by a His trap FF column purification. The protein underwent buffer exchange and was stored in PBS −80 °C at a concentration of >1 mg/ml. SDS-gel electrophoresis analysis demonstrates a single purified mature protein around 60~65 kDa under reducing conditions (Fig 1F), similar to commercially available recombinant mouse Ism1 protein (Fig S1G). The identity of the protein is also validated using an Ism1 antibody (Fig 1F). Treatment with deglycosylating enzymes, including PNGase F demonstrates a band shift from 65 kDa to 60 kDa, suggesting that Ism1 is N-glycosylated (Fig 1F). Glycan analysis by LC-MS/MS confirms the presence of several N-linked glycan masses at the N-terminus of the Ism1 protein and reveals novel glycosylation and phosphorylation sites on Ism1 (Table S2). Size exclusion chromatography fractionation under native conditions shows that the Ism1 protein elutes as a single peak, but likely forms dimers or oligomers (Fig 1G). Importantly, the Ism1 protein is highly pure and devoid of other protein contaminants, as demonstrated by global protein analysis by LC-MS/MS (Fig 1H and Table S3). Approximately 1800 peptides for Ism1 are found in the purified Ism1 protein preparations, while < 2 peptides are found for ligands such as platelet-derived growth factor, epidermal growth factor, and insulin, demonstrating the purity of the protein (Table S3). Importantly for in vivo work, the protein was tested for the presence of endotoxin with levels below 0.1 EU/ml (Fig S1H). There is no evidence of compromised stability when the protein is incubated at 37°C for up to 200 hours, as shown by a protein aggregation assay measuring increasing transmittance as a function of time (Fig S1I). Insulin, well known to form aggregated fibrils, is used as a positive control. The yield for a representative preparation of recombinant Ism1 protein is consistently around 50 mg/L. These data demonstrate the efficient production of highly pure recombinant Ism1 protein for in vitro and in vivo studies.
Important adipose tissue functions include glucose and fatty acid uptake (Himms-Hagen, 1989; Kajimura et al., 2015), Ucp1-dependent and Ucp1-independent respiration (Long et al., 2016), mitochondrial biogenesis, and the running of the futile creatine cycle (Kazak et al., 2017) and calcium2+ cycling (Ikeda et al., 2017). To first investigate the potential role of Ism1 in thermogenesis, we explored whether Ism1 controls any aspects of heat generation. For classical Ucp1 gene expression induction, we treated primary mature mouse adipocytes for 24h with either vehicle or Ism1 protein in doses ranging from 50 to 200 nM. Whereas the cAMP activator forskolin effectively induces Ucp1 expression, Ism1 treatment has no effect (Fig S1J). Similarly, Ism1 treatment has no effect on genes controlling the alternative thermogenic pathways, including futile creatine cycling (Crt, Gatm, Gamt, Ckmt1), ATP-dependent calcium2+ cycling (Serca2b), or Pm20d1, an enzyme responsible for generating endogenous uncouplers of mitochondrial respiration (Fig S1K). Furthermore, Ism1 does not increase the basal respiration rate, the norepinephrine-induced cellular respiration rate, or the maximal respiration rate using Seahorse flux analysis (Fig S1L). Lastly, both Ism1 and insulin slightly suppress lipolysis as measured by glycerol release, while isoproterenol, as expected, robustly increases lipolysis in differentiated adipocytes (Fig S1M). These results suggest that Ism1 does not acutely induce thermogenesis, lipolysis, or cellular oxygen consumption in adipocytes under these conditions.
Adipose tissue plays a role in glucose regulation by accounting for 10-15% of the total glucose uptake (Kahn, 1996). Therefore, we next asked whether Ism1 increases glucose uptake in adipocytes. Fully differentiated human SGBS adipocytes (Fischer-Posovszky et al., 2008; Wabitsch et al., 2001) were treated with Ism1 or insulin at doses ranging from 10 nM to 200 nM before assaying for glucose uptake using [3H]-2-deoxy-glucose. As expected, insulin induces an increase in glucose uptake in SGBS cells starting from 20 nM (Fig 1I). Interestingly, Ism1 also induces a 1.5-fold increase in glucose uptake starting from 20 nM, as robustly as insulin in SGBS cells (Fig 1I). In addition to human SGBS adipocytes, 100 nM Ism1 increases glucose uptake in primary mouse adipocytes, consistently around 1.5-fold across multiple experiments (Fig 1J). Importantly, the effect of Ism1 is seen in the absence of insulin. Expectedly, insulin induced a higher glucose induction than Ism1, but the addition of 100 nM Ism1 in cells treated with 50 nM insulin further increased insulin-induced uptake in adipocytes (Fig 1K). In addition, prolonged Ism1 treatment does not lead to desensitization, as a 24h protein treatment induced a similar degree of glucose uptake induction as 4h (Fig S1N). Importantly, 100 nM albumin used as a protein control had no effect on glucose uptake, demonstrating the specific bioactivities of Ism1 (Fig S1N).
The induction of glucose uptake is not restricted to adipocytes, as experiments in human primary skeletal muscle cells showed a 5-fold induction of glucose uptake at 50 nM Ism1 and 7-fold at 200 nM Ism1 compared with control cells (Fig 1L). Surprisingly, Ism1 does not induce glucose uptake in differentiated 3T3-L1 adipocytes, while insulin induces an almost 40-fold induction in this cell line, suggesting cell type-specific receptors or glucose transport for Ism1 (Fig S1O). In conclusion, the cellular studies using four different cell types show that Ism1 induces glucose uptake by 1.25-fold up to 6-fold. The effects of Ism1 are < 50 % of that of insulin in primary mouse adipocytes (Fig 1K), 50-100 % in SGBS cells (Fig 1I and Fig 4H), and 70 % in human skeletal muscle cells (Fig 1L). These results suggest that the effects on Ism1-induced glucose transport are cell-type dependent and that Ism1 might act on a low-abundant cell surface receptor.
Figure 4. Ism1 signaling is independent of the Insulin-and IGF receptors.

(A) Representative western blot (n = 2 in total) of pAKTS473 signaling induced by Ism1 (100nM) or insulin (100 nM) in 3T3-F442A cells pre-treated with PI3K inhibitors wortmannin, LY294002, orPIK-75, mTORC1 inhibitor rapamycin, mTORC1/2 dual inhibitor torin, or the PI3K-mTOR inhibitor Omipalisib.
(B) 2-deoxy-H3-glucose uptake in mouse primary adipocytes treated with recombinant mouse Ism1 protein in the absence or presence of 1 μM wortmannin (n = 3 biological replicates).
(C) Representative western blot (n = 2 in total) of pAKTS473 signaling induced by Ism1 (100nM) or insulin (100 nM) in 3T3-F442A cells pre-treated for 30 min with the selective mTOR inhibitor INK-128.
(D) Representative western blot (n = 2 in total) of pAKTS473 signaling induced by Ism1 (100nM) or insulin (100 nM) in 3T3-F442A cells pre-treated for 30 min with S6K inhibitor DG2.
(E) Representative western blot (n = 2 in total) of pAKTS473, AKT, and β-actin in 3T3-F442A cells treated with insulin in the presence of 0 nM, 25 nM or 50 nM Ism1.
(F) Representative western blot (n = 2 in total) phosphorylated insulin-and IGF receptors in 3T3-F442A cells treated with 100 nM Ism1 or 100 nM insulin for 2 min.
(G) Representative western blot (n = 2 in total) of signaling induced by Ism1 (100nM) or insulin (100 nM) in 3T3-F442A cells pre-treated for 30 min with the IR-IGF1R inhibitor OSI-906.
(H) 2-deoxy-H3-glucose uptake in human SGBS adipocytes treated with Ism1 (100nM) in the absence or presence of 50 nM OSI-906 (n=3 biological replicates).
(I) Schematic illustration of the signaling pathway activated by Ism1.
For western blots, all protein treatment are 5 mins unless indicated otherwise. Data are presented as mean ± S.E.M of biologically independent samples. *P < 0.05 and ***P< 0.001 (b, h) by two-tailed Student’s t-test (b, h).
GLUT4 is the predominant insulin-sensitive transporter in adipose tissue and is, in unstimulated conditions, compartmentalized in intracellular vesicles. Upon insulin stimulation in insulin-sensitive tissues, GLUT4 is translocated to the cell surface to increase glucose import (Furtado et al., 2002). To determine if Ism1 promotes translocation of GLUT4 to the plasma membrane, we treated cells with 100 nM insulin or Ism1, followed by Glut4 immunostaining and analysis using confocal microscopy. Both Ism1 and insulin treatment induce higher levels of Glut4 at cell surface compared with control cells, which demonstrated almost exclusively intracellular compartmentalized Glut4 (Fig 1M). Biochemical fractionation to separate the plasma membrane from cytosolic fractions confirms the translocation of Glut4 to the plasma membrane after stimulation with both Ism1 and insulin, but not with control treatment (Fig 1N). Expectedly, the membrane-bound receptor Pdgfr-α used as a loading control is enriched in the plasma membrane fraction and does not change with either of the treatments (Fig 1N). These results show that Ism1 increases adipocyte glucose uptake at least in part by translocating GLUT4 to the cell surface.
Intrigued by the exogenous action of Ism1 in regulating glucose transport, we next wanted to determine if endogenous Ism1 is sufficient to control glucose uptake. To this end, we generated two shRNAs in adenoviral vectors against mouse Ism1 to reduce its expression; we then assessed the effects of acute Ism1 knockdown on glucose uptake. The Ism1 shRNAs generates a 50% and 70% knockdown efficiency without affecting differentiation as determined by no change in adiponectin gene expression (Fig 1O). Interestingly, Ism1 knockdown prevents glucose uptake in adipocytes, demonstrating that the endogenous levels of Ism1 contribute to basal glucose uptake in adipocytes (Fig 1P).
Because glucose uptake involves activation of the regulatory subunit of type 1A phosphatidylinositol 3-kinase (PI3K) and phosphorylation of AKT at S473 (Luo et al., 2003; Tsuchiya et al., 2014), we next evaluated the levels of pAKTS473 in Ism1 knockdown cells. We observe a 20-50% reduction in pAKT signaling in Ism1 -shRNA adipocytes compared with LacZ-shRNA, strongly indicating that endogenous Ism1 is necessary to maintain the AKT basal signaling tone (Fig 1Q–R). Interestingly, Ism1 is also important for insulin-dependent glucose uptake; cells with reduced Ism1 levels completely fail to respond to insulin-induced glucose uptake even at maximal insulin concentrations (Fig 1S) and have reduced pAKT signaling compared with control cells (Fig 1T–U). Taken together, our data identify Ism1 as a secreted factor that exogenously and endogenously controls glucose uptake in vitro.
ISM1 expression is correlated with obesity in mice and humans
Many metabolic hormonal factors are elevated in individuals with metabolic dysfunction, including insulin, FGF21, FGF1, and GDF15 (Vila et al., 2011; Wang et al., 2018; Zhang et al., 2008). Therefore, we asked whether Ism1 levels are changed by nutritional and obesity status. To investigate this, mice were fed a high-fat diet (HFD) for 16 weeks. As predicted, leptin levels are increased almost 20-fold in iWAT (Fig S2A) and 5-fold in BAT (Fig S2B), compared with lean mice. Interestingly, Ism1 gene expression is on average increased 30-fold higher in iWAT but not different in BAT (Fig S2A–B). To examine whether ISM1 expression was regulated in adipose tissue in humans with obesity, we collected human subcutaneous mature adipocytes and performed RNA sequencing from 43 individuals with known clinical metabolic parameters. In this dataset, ISM1 expression is positively and significantly correlated with body mass index (BMI) (Fig S2C). When stratifying individuals based on parameters for weight, insulin, or glucose levels, ISM1 expression was higher in individuals with a BMI > 28 (Fig S2D). On the contrary, ISM1 transcript levels do not significantly correlate with glucose, insulin, HOMA-IR or free fatty acid levels in these individuals (Fig S2E–J). Importantly, by generating a monoclonal ISM1 antibody, we observe that circulating plasma levels of human ISM1 is detected at an average of 50 pg/ml, and trend to positively correlate with BMI (Fig S2K) but not with glucose (Fig S2L) in female individuals. These results suggest that ISM1 is a bona fide hormone and that circulating levels are physiologically regulated by nutritional and metabolic changes in mice and humans.
Ablation of Ism1 causes glucose intolerance and impaired insulin-stimulated adipocyte glucose uptake
Based on the findings that Ism1 exogenously and endogenously controls glucose uptake in vitro, we next sought to investigate the endogenous function of Ism1in physiology by analyzing mice with a targeted deletion of the Ism1 gene. First, we generated the Ism1 floxed allele spanning exons 2-4 by using CRISPR-mediated gene editing. Second, the Ism1 floxed allele was crossed with female mice expressing the Ella-Cre transgene for embryonic deletion (Fig S3A–B). The genomic exon deletion was confirmed by PCR, by amplifying the exon junction, as well as by Sanger sequencing (Fig S3B–C). The Ism1flox heterozygote mice were mated to generate germline deletion of Ism1, which was confirmed via PCR-mediated genotyping of the wildtype (WT), heterozygotes (Het) and knockout (Ism1-KO) mice (Fig S3D). The loss of Ism1 mRNA expression in iWAT, eWAT and BAT tissue in Ism1-KO mice compared with WT mice is also confirmed by qPCR (Fig 2A). We find that Ism1 circulates at 2-4 pg/ml in mouse serum, and expectedly, is not detected in the Ism1-KO mice (Fig 2B). Notably, body temperature (Fig 2C), food intake (Fig 2D), insulin levels (Fig 2E), and body weights (Fig 2F) are indistinguishable between WT and Ism1-KO littermates under chow diet, but there is a trend towards higher insulin resistance in the Ism1-KO mice (Fig 2G) and significantly worsened glucose tolerance (Fig 2H). These results suggest that Ism1 regulates peripheral glucose uptake. To directly test the hypothesis that Ism1 ablation results in reduced tissue glucose uptake, we performed radiolabeled tracing using [3H]-2-deoxy-glucose in WT or Ism1-KO mice under three dietary conditions: chow, HFD, or non-alcoholic fatty liver disease (NAFLD) for four weeks prior to the measurements. Interestingly, we observe reduced BAT glucose uptake in the Ism1-KO mice under all three diets, but the difference is only significant under chow conditions. Skeletal muscle from Ism1-KO mice also had a reduced glucose uptake under NAFLD-fed conditions, while iWAT and liver show no differences between the genotypes (Fig 2I). Furthermore, analysis of basal and insulin-induced tissue-specific glucose uptake showed that BAT has the largest defect in glucose uptake under both basal and insulin-stimulated conditions in the Ism1-KO mice compared with WT mice (Fig 2J and Fig S3E). Based on these data, we conclude that the reduced glucose tolerance in the Ism1-KO mice is likely due to a combination of an impaired basal glucose uptake in BAT and skeletal muscle and reduced insulin sensitivity in BAT. Importantly, injection of recombinant Ism1 protein into Ism1-KO mice can increase glucose uptake in BAT and skeletal muscle (Fig 2K), indicating that the glucose uptake phenotype is directly caused by the Ism1 deficiency rather than a secondary consequence of Ism1 loss. Ism1 protein treatment results in a trending increase in iWAT, but no hepatic glucose uptake induction is seen after Ism1 treatment. In conclusion, these data support the notion that BAT and skeletal muscle are the major tissues responsible for Ism1-mediated glucose uptake.
Figure 2. Ablation of Ism1 results in glucose intolerance and impaired adipocyte glucose uptake.

(A)Ism1 gene expression in different tissues from WT and Ism1-KO mice (n = 5-8 biological replicates).
(B) ISM1 serum levels in male WT and Ism1-KO mice using an ISM1 ELISA (n = 5-8 biological replicates).
(C) Body temperature in male WT and Ism1-KO mice (n = 5-8 biological replicates).
(D) Food intake in male WT and Ism1-KO mice (n = 5-8 biological replicates).
(E) Insulin levels in male WT and Ism1-KO mice (n = 5-8 biological replicates).
(F) Body weights in male WT and male WT and Ism1-KO mice (n = 5-6 biological replicates).
(G) Insulin tolerance test in male WT and Ism1-KO mice (n = 10-14 biological replicates).
(H) Glucose tolerance test in male WT and Ism1-KO mice (n = 10-14 biological replicates).
(I) In vivo 2-deoxy- H3-glucose uptake in brown adipose tissue (BAT), white inguinal adipose tissue (iWAT), quadriceps skeletal muscle (Quad), and liver from three cohorts of mice on chow, HFD or NAFLD diet (n = 5-8 biological replicates).
(J) In vivo 2-deoxy- H3-glucose uptake in brown adipose tissue (BAT) in male WT and Ism1-KO mice under basal and insulin-stimulated conditions (n = 5 biological replicates).
(K) In vivo 2-deoxy- H3-glucose uptake in brown adipose tissue (BAT), white inguinal adipose tissue (iWAT), quadriceps skeletal muscle (Quad), and liver in male Ism1-KO mice treated with 5 mg/kg Ism1 protein for two days (n = 6-7 biological replicates).
(L)Ism1 and Adipoq gene expression in differentiated adipocytes isolated from WT and Ism1-KO (n = 4 biological replicates, 1 technical replicate per sample).
(M) Oil red O staining of differentiated adipocytes isolated from WT and Ism1-KO mice (n = 3 biological replicates).
(N) Representative western blot (n = 2 in total) of pAKTS473, total AKT, and β-actin in mouse adipocytes isolated from WT and Ism1-KO mice.
(O) Quantification of protein expression pAKTS473/total AKT quantified from two independent experiments (n = 2 in total per experiment).
(P) Representative western blot (n = 2 in total) of pAKTS473, total AKT, and β-actin in mouse adipocytes isolated from WT and Ism1-KO mice treated with indicated concentrations of insulin.
(Q) 2-deoxy-H3-glucose uptake in differentiated adipocytes isolated from WT and Ism1-KO mice treated with indicated concentrations of insulin (n = 4 biological replicates).
Data are presented as mean ± S.E.M of biologically independent samples. *P < 0.05, **P < 0.01, ***P < 0.001 by one-or two-tailed Student’s t-test (a, c, d, e, f, I, j, k, 1, o, q), Mann Whitney test (b), or two-way Anova (g, h).
To directly determine the requirement for Ism1 on adipocyte glucose uptake, we isolated primary mouse inguinal cells from WT and Ism1-KO mice for in vitro differentiation into fat cells. There is no significant difference in differentiation capacity between WT and Ism1-KO cells, as determined by adiponectin expression levels (Fig 2L) and Oil Red O staining (Fig 2M). As expected, endogenous Ism1 is abundant in primary adipocytes, with a CT value of ~ 21, while Ism1 is absent in Ism1-KO cells with a CT value of ~31 (Fig 2L). We observed considerably lower pAKT levels in Ism1-KO adipocytes compared with WT cells, further supporting that endogenous levels of adipocyte-secreted Ism1 contribute to the basal signaling tone (Fig 2N–O). Lastly, ablation of Ism1 results in reduced insulin-induced signaling (Fig 2P and Fig S3F) and reduced insulin-induced glucose uptake (Fig 2Q). Based on these orthogonal results from assessing short-term and long-term effects, we conclude that Ism1 is both necessary and sufficient for a fraction of the peripheral glucose regulation in adipocytes and whole-body glucose uptake in mice.
Ism1 activates the PI3K-AKT pathway
Since many hormones and growth factors are high-affinity ligands for signaling cell surface receptors (Lemmon and Schlessinger, 2010; Zhao et al., 2020), we next aimed to identify the intracellular signaling pathways involved in Ism1 function. Gene family tree analysis suggests that Ism1 is a distant relative to other proteins containing a Thrombospondin Type 1 (TSP1) domain or an Adhesion-associated domain (AMOP) (Fig S4A). However, neither of the domains are known to possess any direct signaling activity. We first performed a phosphokinase array that detects phosphorylated levels of 43 distinct proteins simultaneously in a single sample. 3T3-F442A cells were treated for 5 min with either vehicle or Ism1 protein followed by phosphoprotein analysis. Interestingly, the top hit from this screen in response to Ism1 treatment is phosphorylated protein kinase B (PKB)/AKT at S473 (Fig 3A). To confirm the specificity of the protein array results, and that the AKT signaling response is specific to Ism1 (and not dependent on the C-terminal tag of the protein), we performed the same experiment using a phospho-specific antibody for AKTS473 with Ism1 containing either a C-terminal flag tag or a C-terminal his tag. As a further control, another protein containing thrombospondin domains, a his-tagged mouse Thrombospondin-1 was used (Fig 3B). Insulin, as well as both Ism1 proteins, show similar bioactivities on pAKTS473, while Thrombospondin-1 shows no bioactivity in this assay (Fig 3B). In addition to 3T3-F442A, Ism1 also induced pAKTS473 in differentiated primary mouse brown adipocytes (Fig 3C), white adipocytes (Fig 3D–E), human SGBS adipocytes (Fig 3F), C2C12 skeletal muscle cells (Fig S4B) and human primary skeletal muscle cells (HSMC) (Fig S4C), consistent with the function of Ism1 in inducing glucose uptake in adipocytes and in skeletal muscle cells. The Ism1 protein has comparable bioactivities to commercially available Ism1 protein purchased from R&D systems (Fig S4D). To determine the minimal dose required to induce pAKTS473 signaling, we treated 3T3-F442A cells with increasing Ism1 protein or insulin doses. This demonstrates a dose-dependent increase in phosphorylation starting at 50 nM for Ism1 and 10 nM for insulin (Fig 3G). We could confirm the Ism1 bioactivity using the more quantitative AlphaLisa assay for pAKTS473, showing that 100 nM Ism1 induces a similar response as 10 nM insulin (Fig 3H).
Figure 3. Ism1 activates the PI3K-AKT pathway.

(A) Phosphokinase array quantification of 3T3-F442A cells treated with vehicle (control) or 100 nM Ism1 (1 technical replicate of 3 combined biological replicates per group).
(B) Representative western blot (n = 1 biological replicates in total) of pAKTS473 and AKT in 3T3-F442A cells treated with vehicle (ctl) Ism1-flag, Ism1-his, Thrombospondin-his (TSP-his) or insulin at 100 nM.
(C) Representative western blot (n = 2 in total) of pAKTS473, AKT, and β-actin in mouse BAT adipocytes treated with indicated concentrations of Ism1 or insulin.
(D) Representative western blot (n = 2 in total) of pAKTS473, AKT, and β-actin in mouse adipocytes treated with indicated concentrations of Ism1 or insulin.
(E) Representative western blot (n = 2 in total) of pAKTS473 and AKT in mouse adipocytes treated with 100 nM recombinant Ism1 or 10 nM insulin at different time points.
(F) Representative western blot (n = 2 in total) of pAKTS473, AKT, and β-actin in human SGBS adipocytes treated with indicated concentrations of Ism1 or insulin.
(G) Representative western blot (n = 2 in total) of pAKTS473 and AKT in 3T3-F442A cells treated with Ism1 or insulin with indicated concentrations.
(H) AlphaLISA SureFire Ultra AKT 1/2/3 (pS473) measurements in 3T3-F442A cells treated with recombinant Ism1 or insulin (n = 3 biological replicates).
(I) Representative western blot (n = 2 in total) of 3T3-F442A cells treated with 100 nM ISM1, 100 nM insulin, or 20 ng/ml Pdgf-ββ showing the intracellular signaling pathways over time.
Data are presented as mean ± S.E.M of biologically independent samples. For all western blots, all protein treatments are 5 mins unless indicated otherwise.
Both mouse and human studies show that activation of PI3K and AKT in response to growth factors plays a central role in controlling metabolism (Saltiel and Kahn, 2001). Insulin induces phosphorylation of pAKTS473 and pAKTT308, both of which have been mechanistically linked to glucose uptake in various tissues (Tsuchiya et al., 2014). To evaluate the temporal signaling in response to Ism1, we performed a time-course experiment of Ism1, insulin or platelet-derived growth factor-ββ (Pdgf-ββ). In addition to the phosphorylation of pAKTS473, we also observed phosphorylation at pAKTT308 at all time points in cells treated with 100 nM Ism1 or insulin (Fig 3I). Additionally, there was also a time-dependent activation of S6S235/S236 and the AKT substrate PRAS40Thr246, known targets of insulin. Notably, at 100 nM, Ism1 does not evoke as robust ERK1/2 phosphorylation as the known mitogen Pdgf-ββ. However, at 200 nM, Ism1 shows prolonged and more potent phosphorylation of ERK1/2 than insulin, which suggest that Ism1 and insulin induce distinct and divergent signaling responses and downstream pathways (Fig S4E). Moreover, Ism1 does not display any activity or displays only weak activity on other pathways such as protein kinase A (PKA), PDK1 or GSK3β even at 200 nM doses (Fig S4E). To our knowledge, this is the first robust and direct signaling action identified for Ism1.
To further interrogate the requirements for the Ism1 signaling pathway in detail, we treated cells with four inhibitors targeting the PI3K pathway: Wortmannin, LY294002, PIK or the dual PI3K-mTOR inhibitor Omipalisib. All four inhibitors completely block pAKTS473 phosphorylation induced by Ism1 and insulin (Fig 4A). This effect also holds true in adipocytes, as LY294002 and Wortmannin inhibit the Ism1-induced pAKTS473 activity in primary adipocytes (Fig S4F). We further show that PI3K is required for glucose regulation in adipocytes, as demonstrated by the complete blockade of Ism1-induced glucose uptake in the presence of Wortmannin (Fig 4B). Insulin signaling components such as insulin receptor substrate (IRS-1) and IGF1R/IR are tightly controlled by the multiprotein complexes of mammalian target of rapamycin (mTOR) mTORC1 and mTORC2, and both mTOR complexes are activated by insulin (Tzatsos, 2009; Wang et al., 2006). To investigate whether any of the mTORC1 complexes are involved in Ism1 signaling, cells were treated with the mTORC1 inhibitor rapamycin or the mTORC2 inhibitor torin, prior to Ism1 or insulin stimulation. Neither ligand activity is inhibited by rapamycin, while torin fully ablates the Ism1-induced AKT signaling (Fig 4A). Similar effects are seen with the potent and selective dual mTORC1 and mTORC2 competitive inhibitor INK-128 (Fig 4C). This suggests that mTORC1 is downstream of AKT or not involved in Ism1 or insulin signaling, while mTORC2 is upstream of AKT and is required for induction of the signaling cascade both by Ism1 and insulin. Notably, in the presence of all four mTOR inhibitors, S6S235/S236 phosphorylation by Ism1 is completely inhibited, suggesting that the activation of S6 is downstream of the mTOR complexes (Fig 4A, Fig 4C). This is also confirmed by using the S6K1 kinase inhibitor DG2, which dose-dependently inhibited S6S235/S236, while pAKT remained intact. These results are supporting the finding that Ism1-induced S6S235/S236 activation is downstream of AKT (Fig 4D). Taken together, these data strongly suggest that Ism1 signaling shares common downstream signaling targets with insulin and requires mTORC2 involvement to induce the PI3K-AKT pathway and glucose uptake.
Ism1 signaling is independent of the Insulin- and IGF Receptors
Because the Ism1-induced signaling pathway resembled that of insulin, we next asked whether Ism1 directly engages the insulin or insulin-like growth factor 1 receptors (IR and IGF-1R, respectively), or acutely sensitizes cells to insulin. To test this hypothesis, we treated 3T3-F442A cells with insulin using doses from 1 nM up to 100 nM in the presence or absence of 25nM or 50 nM Ism1. We observed an additional effect of Ism1 over insulin alone on AKT activity, but no evidence of potentiation was seen, suggesting that Ism1 does not modulate the insulin-insulin receptor interaction (Fig 4E). To assess whether Ism1 could induce IR phosphorylation, we next tested the response to Ism1 in activating IGF-I-Receptor β phosphorylation at Tyr1135/1136 or IR at Tyr1150/1151 - two well-described phosphorylation sites induced by insulin. 3T3-F442A cells were treated with either vehicle, 100 nM Ism1 or 100 nM insulin for 2 minutes followed by western blot analysis. As expected, insulin induced IGF-1R/IR phosphorylation; however, no phosphorylation was seen in the Ism1-treated cells (Fig 4F). To address whether the presence of intact insulin receptors is required for Ism1-induced pAKT signaling, we made use of the dual receptor tyrosine kinase inhibitor OSI-906 to specifically target IR and IGF-1R. Insulin signaling is completely abolished in the presence of 1000 nM OSI-906, as expected. However, Ism1 signaling is intact in the presence of the IGF-1R/IR inhibitor, even at 1000 nM OSI-906 (Fig 4G). Similarly, insulin-induced glucose uptake is significantly reduced with OSI-906, while Ism1-induced glucose uptake is not affected (Fig 4H). Intriguingly, we find that a 2-minute Ism1 treatment induces phosphorylation of tyrosine residues on proteins > 100 kDa in size, while insulin induces phosphorylation of its receptors at larger molecular weights (Fig S4G). Moreover, we find that the Ism1-induced pAKT signaling in 3T3-F442A cells can be inhibited by an RTK inhibitor, LDC1267, which targets multiple receptor tyrosine kinases. Notably, neither the signaling induced by PDGFββ or insulin are inhibited by LDC1267 at any of the doses tested, suggesting a distinct receptor for Ism1 (Fig S4H). In conclusion, these results strongly suggest that Ism1 signaling does not need or involve insulin receptors, but rather activates the PI3K-AKT pathway via a distinct receptor that shares a common downstream signaling signature with insulin (Fig 4I).
Ism1 overexpression prevents insulin resistance and hepatic steatosis in a diet-induced obesity mouse model
To study the effect of chronically elevated circulating Ism1 in vivo, we transduced mice with viral expression vectors to robustly increase circulating Ism1 levels, followed by high fat diet-feeding (Fig 5A). 6-8-week-old mice were I.V. injected with 1010 virus particles of AAV8 adeno-associated viruses serotype 8 (AAV8) either expressing GFP or mouse Ism1 with a C-terminal flag tag. As predicted, the AAV8 uptake and target gene expression are highest in the liver, as confirmed by gene expression analysis of liver, BAT, skeletal muscle, iWAT tissues in these mice (Fig S5A–D). No elevated expression of Ism1 is seen in brain (Fig S5E). Under the same conditions, Ism1 protein levels are increased in circulation in Ism1-AAV8 mice compared with GFP-AAV8 mice, as determined by the detection of Ism1 using an antibody against the C-terminal flag tag (Fig 5B). When these mice are fed a HFD, the Ism1-AAV8 mice have a blunted weight gain that is significantly different after 10 weeks of HFD feeding (Fig 5C). Body composition analyses showed that the weight difference is entirely due to loss of fat mass and not lean mass (Fig S5F). The weight difference could not be explained by a difference in food intake, as the accumulated food intake in the Ism1-AAV8 mice was not significantly different from the GFP mice (Fig S5G). Whole-body energy expenditure measurements reveal no significant changes in oxygen consumption, although trending higher (Fig S5H). These studies also indicate that Ism1-AAV8 mice have improved glucose tolerance (Fig 5D), and dramatically increased insulin sensitivity at 10 weeks (Fig 5E). While non-fasting glucose levels are not changed (Fig S5I), plasma levels of insulin are lower in the Ism1-AAV8 mice, consistent with improved peripheral insulin sensitivity (Fig 5F). To directly assess whole-body insulin sensitivity in the Ism1-AAV8 mice, we next performed hyperinsulinemic-euglycemic clamp studies. These studies were performed at 3 weeks of HFD feeding - a time point where the weight difference was not significantly different between the groups. During the clamp analysis, plasma glucose levels are adjusted between the groups to reach approximately 110 mg/ml (Fig 5G). Ism1-AAV8 mice have an increased glucose infusion rate suggestive of increased insulin sensitivity (Fig 5H). Interestingly, endogenous hepatic glucose production under basal and clamped conditions demonstrates a significant suppression under clamped conditions in the Ism1-AAV8 mice compared with GFP-AAV8 mice (Fig 5I–J). Glucose levels are normally regulated by glucagon to increase the concentration of glucose and fatty acids in the bloodstream (Hilder et al., 2005); however, neither fed glucose levels nor glucagon are changed in Ism1-AAV8 mice (Fig S5I–J). Histological analyses showed decreased lipid droplet size in BAT and iWAT from Ism1-AAV8 mice compared with GFP-AAV8 mice after 10 weeks of high fat diet feeding, consistent with a leaner phenotype (Fig S5K). More importantly, we also observed a robust reduction in liver fat by histological analyses and Oil red O staining demonstrating reduced lipid droplet formation in Ism1-AAV8 mice (Fig 5K). The hepatic steatosis reduction is accompanied by a strong suppression of Srebp1c, and an overall trend towards suppression of Usf1, Fas and Acc expression in Ism1-AAV8 livers, suggesting that hepatocytes could be direct targets of Ism1 (Fig 5L). These data are further corroborated by reduced triglycerides in Ism1-AAV8 livers (Fig 5M); however, no changes in plasma cholesterol were seen under the same conditions (Fig S5L). In conclusion, chronic elevations of circulating Ism1 improves insulin sensitivity and hepatic steatosis in mice.
Figure 5. Ism1-AAV overexpression prevents insulin resistance and hepatic steatosis in DIO mice.

(A) Overview of prophylactic Ism1 overexpression in diet-induced obese (DIO) mice fed a HFD at the start of the experiment.
(B) Representative western blot of plasma from AAV8-GFP and AAV8-Ism1-flag using an anti-FLAG antibody detecting the C-terminal flag tag of Ism1 (n = 3 mice per group).
(C) Body weights in AAV8-GFP and AAV8-Ism1 mice measured during 10 weeks of HFD (n = 10 mice per group).
(D-F) Glucose tolerance test (D), Insulin sensitivity test (E), plasma insulin levels (F) in mice expressing AAV8-GFP and AAV8-Ism1 after 10 weeks of HFD (n = 10 mice per group).
(G) Plasma glucose levels during hyperinsulinemic-euglycemic clamp in AAV8-GFP and AAV8-Ism1 mice at 3 weeks of HFD (n = 5-8 mice per group).
(H) Glucose infusion rate (GIR) during hyperinsulinemic-euglycemic clamp in AAV8-GFP and AAV8-Ism1 mice at 3 weeks of HFD (n = 5-8 mice per group).
(I) Basal endogenous glucose production in AAV8-GFP and AAV8-Ism1 mice at 3 weeks HFD (n = 5-8 mice per group).
(J) Endogenous glucose production under clamped conditions in AAV8-GFP and AAV8-Ism1 mice at 3 weeks of HFD (n = 5-8 mice per group).
(K) Representative (n = 5 images in total from 5 mice) H&E and Oil red O staining in livers from AAV8-GFP and AAV8-Ism1 mice.
(L) Gene expression levels of hepatic lipogenesis genes in AAV8-GFP and AAV8-Ism1 mice (n = 10 mice per group, 1 technical replicate per sample).
(M) Liver triglycerides quantification in AAV-GFP and AAV8-Ism1 mice after 10 weeks on HFD (n = 10 mice per group, 1 technical replicate per sample).
Data are presented as mean ± S.E.M of biologically independent samples. *P < 0.05, **P < 0.01, ***P < 0.001 by two-tailed Student’s t-test (f, I, j, l, m) or two-way Anova (c, d, e, g, h).
Ism1 suppresses de novo lipogenesis and increases protein synthesis in hepatocytes
As Ism1-AAV8 overexpression largely prevents the development of hepatic steatosis, we next set out to determine whether Ism1 has a direct or indirect effect on liver lipid synthesis. To do so, we performed experiments in primary mouse hepatocytes and the mouse hepatocyte cell line AML12. Forced expression of Ism1 in primary mouse hepatocytes using adenoviral vectors results in a strong suppression Srebp1c transcription after 24 h, suggesting that Ism1 can directly regulate lipogenic gene expression (Fig 6A). Insulin is well known to drive de novo lipogenesis by regulating the activity and transcription of sterol regulatory element binding protein-1c (SREBP-1c) (Foretz et al., 1999; Kim et al., 1998a, 1998b; Saltiel and Kahn, 2001). To directly test whether Ism1’s suppressive effect on Srebp1c and its target genes is sufficient to attenuate hepatocyte de novo lipogenesis induced by insulin, we next performed experiments measuring H3-acetate incorporation into fatty acids and cholesterol followed by lipid extraction in the hepatocyte cell line AML12. As expected, 50 nM insulin induces a significant induction of lipogenesis, and importantly, the addition of 50 and 100 nM Ism1 could reverse the insulin-induced lipogenesis dose-dependently (Fig 6B). Moreover, 50 nM Ism1 is sufficient to reduce lipogenesis in the presence of 200 nM supraphysiological insulin doses, demonstrating the potency of Ism1’s suppressive effect (Fig S6A). The process of de novo lipogenesis is strongly driven by insulin via the PI3K-AKT pathway leading to mTORC1 activation, which facilitates the cleavage of Srebp1c via a mechanism that still remains to be established (Kersten, 2001). Therefore, we next investigated the cleavage of Srebp1c in the presence or absence of Ism1 and insulin. As expected, hepatocytes treated with 50 nM insulin show increased expression of pre-Srebp1c as well as the cleaved Srebp1, and increased protein expression of Fas and Acc (Fig 6C). Intriguingly, we show that Ism1 counteracts the insulin-induced increase in Srebp1c cleavage to the mature form, as well as counteracts the increased target proteins Fas and Acc (Fig 6C), suggesting a suppression of lipogenic gene and protein expression. Therefore, we directly assessed the hepatocyte gene expression of Srebp1c target genes and show that Fas, Acc and Scd1, known Srebp1c target genes, are all significantly reduced by Ism1 in a dose-dependent manner in the presence of insulin (Fig 6D–G). Similarly, in primary adipocytes, only insulin induces srebp1c expression, while we see no induction with Ism1 under basal conditions (Fig S6B). Moreover, under insulin-stimulated conditions, Ism1 potently reduces the cleaved Srebp-1c protein levels (Fig S6C) as well as suppressing Srebp1c and the lipogenesis target genes Acc, Fas, and ChREBPβ (Fig S6D–G) in adipocytes, consistent with lipogenesis suppression as a general mechanism downstream of Ism1. We cannot exclude involvement of other pathways known to control lipogenesis, such as ChREBPβ and Pgc1β, as these genes are also reduced upon Ism1 treatment (Fig S6H–I).
Figure 6. Ism1 suppresses de novo lipogenesis and promotes protein synthesis in hepatocytes.

(A) Gene expression levels of Ism1 and Srebp1c in primary hepatocytes overexpressing lacZ or Ism1 (n = 3 biological replicates).
(B) H3-acetate incorporation into lipids (de novo lipogenesis) in AML12 hepatocytes treated with Ism1 for 24h in the presence or absence of insulin (n = 3 biological replicates).
(C) Representative western blot (n = 2 in total) of Srebp1c, Fas, Acc and β-actin in AML12 hepatocytes treated with Ism1 for 24h in the presence or absence of insulin.
(D-G) Gene expression of lipogenic genes in AML12 hepatocytes after 6h treatment with Ism1 in the presence or absence of insulin (n = 3 biological replicates).
(H) Representative western blot (n = 2 in total) of S6s235/236, AKTS473, ART and β-actin in AML12 hepatocytes treated with Ism1 for 24h in the presence or absence of insulin.
(I) Quantification of S6s235/236 relative β-actin in control, 50 nM Ism1 and 100 nM Ism1 from combined treatments in H (n = 6 biological replicates in total).
(J) H3-leucine incorporation into proteins (protein synthesis) in AML12 hepatocytes treated with Ism1 for 24h in the presence or absence of 50 nM (n = 3 biological replicates).
(K) Fold change of substrate incorporation as a measure of lipogenesis or protein synthesis in AML12 hepatocytes treated with 50 nM insulin alone or 100 nM Ism1 and 50 nM insulin combined for 24h (n = 3 biological replicates).
Data are presented as mean ± S.E.M of biologically independent samples. *P < 0.05, **P < 0.01, ***P < 0.001 by two-tailed Student’s t-test (a, b, d, e, f, g, k) or Tukey’s multiple comparisons test (i, j).
To determine the mechanism by which Ism1 suppresses lipogenesis, we next performed acute and long-term signaling experiments in hepatocytes. Acute treatments with insulin using doses from 1 nM up to 100 nM in the presence or absence of 25 nM or 50 nM Ism1 do not result in any additional signaling changes at 5 min (Fig S6J), but the 24 h treatment showed that Ism1 induces hyperactivation of pS6S235/S236, a kinase well known to activate protein synthesis (Fig 6H–I). This raised the question whether chronic exposure to Ism1 can switch the substrate utilization used for anabolic cellular processes, including lipid and protein synthesis. Indeed, the combined chronic Ism1 and insulin treatment that results in the sustained pS6S235/S236 levels leads to a 2.9-fold induction of protein synthesis as measured by H3-leucine incorporation into proteins, which is significantly higher than either of the treatments alone (Fig 6J). Furthermore, a direct side-by-side comparison of Ism1’s action in hepatocytes in the presence of insulin demonstrates that Ism1 suppresses lipid synthesis in favor of protein synthesis, strongly suggesting that Ism1 is switching the cellular anabolic state to protein synthesis (Fig 6K). Taken together, these results demonstrate that Ism1 acts directly on hepatocytes in the presence of insulin to upregulate anabolic protein signaling pathways and protein synthesis, while suppressing srebp1c target genes and lipid synthesis.
Therapeutic administration of recombinant Ism1 improves diabetes and hepatic steatosis
The above studies showing a robust signaling action of Ism1, increased adipose tissue glucose uptake, suppressed lipogenesis, and increased protein synthesis, raised the possibility of pharmacological administration of Ism1 as a therapy for diabetes and hepatic steatosis. To explore its therapeutic potential, we next determined whether therapeutic dosing of recombinant Ism1 could reverse any aspect of established metabolic disease in mice by performing a series of Ism1 administration studies benchmarked to known drugs in two different disease models in C57BL/6 mice: DIO and NAFLD. First, the Ism1 protein was evaluated for its pharmacokinetic properties. 10 mg/kg Ism1 protein was intravenous (I.V.) injected into mice and the serum levels of Ism1 were determined by an ELISA assay detecting the C-terminal his tag. This demonstrated a half-life in the blood of approximately 70 minutes (Fig 7A) with no observed protein degradation or cleavage (Fig S7A). To assess whether Ism1 induces AKT signaling in vivo, mice were I.V. injected with vehicle, Ism1 (10 mg/kg) or insulin (1U/kg), and tissues were harvested at the indicated times for signaling assays. Ism1 activates pAKTS473 signaling at 30 and 60 min in iWAT and skeletal muscle, and transient inductions in BAT and liver at the 10 min time point (Fig 7B). To determine the optimal in vivo dosing, a dose-response experiment using Ism1 doses ranging from 0.1 mg/kg to 10 mg/kg revealed that 5 mg/kg Ism1 dose induces the highest pAKTS473 response (Fig S7B). To complement the prophylactic Ism1 overexpression experiments, we performed pilot therapeutic studies in 16-week HFD-fed (i.e., DIO) mice injected with vehicle or 5 mg/kg Ism1 for five days (Fig S7C) which demonstrates no difference in body weight (Fig S7D), ad lib glucose levels (Fig S7E), but a modest improvement in glucose clearance (Fig S7F) and insulin tolerance (Fig S7G), suggestive of a therapeutic function after five days.
Figure 7. Therapeutic administration of recombinant Ism1 improves glucose tolerance and hepatic steatosis.
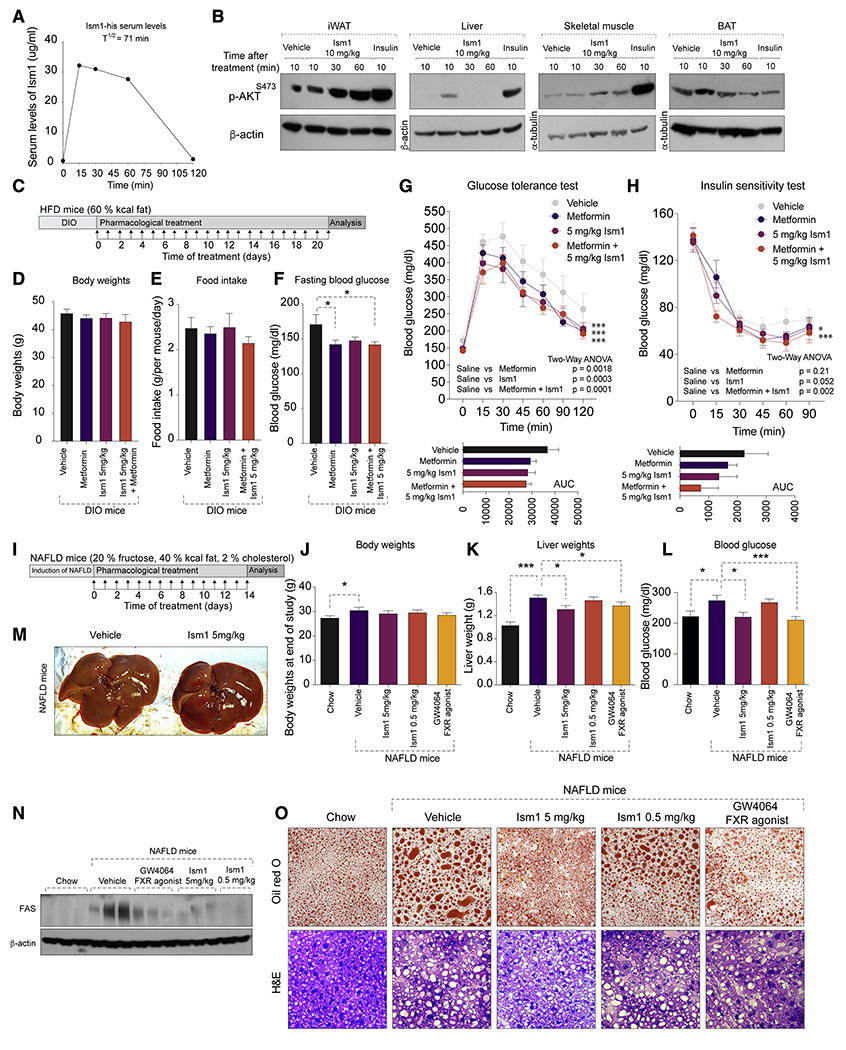
(A) Representative pharmacokinetic levels of serum Ism1-his using an anti-his-ELISA after I.V. injection of 10 mg/kg Ism1 in C5BL/6J mice (n = 2 in total).
(B) Representative western blot (n = 2 in total) of pAKTS473, total ART, β-actin or tubulin in metabolic tissues after a single I.V. injection of 10 mg/kg recombinant Ism1 or 1U/kg insulin in 16 weeks DIO C5BL/6J male mice.
(C) Overview of therapeutic administration of Ism1 protein by daily I.P. injections of 5 mg/kg Ism1, or oral administration of 100 mg/kg metformin, or a combination of both into 12 weeks DIO mice for 21 days.
(D-H) Body weights (D), Food intake (E), fasting blood glucose (F), GTT (G), and ITT (H) after 21 days of daily administration of either vehicle, 5 mg/kg Ism1, 100 mg/kg metformin, or a combination of 5 mg/kg Ism1 and 100mg/kg metformin. (n = 6-12 mice per group).
(I) Overview of therapeutic administration with vehicle, 5 mg/kg Ism1, 0.5 mg/kg Ism1, or 30 mg/kg GW4064 for 14 days in NAFLD-induced mice.
(J-L) Body weights (J), liver weights (K), fed blood glucose (L) of chow (control) mice, or mice with NAFLD treated with either vehicle, 5 mg/kg Ism1, 0.5 mg/kg Ism1, or 30 mg/kg GW4064 for 14 days (n = 5 mice per group).
(M) Representative macroscopic liver photographs from mice (n = 5 in total) treated with vehicle or 5mg/kg Ism1 for 14 days.
(N) Representative western blots (n = 5 in total) of Fas protein levels in livers from chow (control) mice, or mice with NAFLD treated with vehicle, 5 mg/kg Ism1, 0.5 mg/kg Ism1, or 30 mg/kg GW4064 for 14 days (n = 5 mice per group).
(O) Representative H&E and Oil red O (lipid) staining (10 images per 5 biological replicates in total) in livers from chow (control) mice, or mice with NAFLD treated with vehicle, 5 mg/kg Ism1, 0.5 mg/kg Ism1, or 30 mg/kg GW4064 for 14 days (n = 5 mice per group).
Data are presented as mean ± S.E.M of biologically independent samples. *P < 0.05, **P < 0.01, ***P < 0.001 by two-tailed Student’s t-test (d, e, f, j, k, l) and Two-Way Anova (g, h).
To evaluate the long-term therapeutic action of Ism1 to the benchmark metformin, and also determine whether the combined treatment has an additional improvement over any of the treatments alone, 16-week DIO mice were dosed with vehicle, 5 mg/kg Ism1, 100 mg/kg metformin, or the combined 5 mg/kg Ism1 and 100 mg/kg metformin daily for 21 days (Fig 7C). At the end of the experiment, there was no difference in body weights (Fig 7D) or food intake (Fig 7E), but fasting blood glucose was lower in all treatment groups compared with vehicle (Fig 7F). Importantly, both Ism1, metformin and the combined treatments have comparable effects on improving glucose tolerance compared with vehicle treated mice (Fig 7G). Interestingly, the combined treatment performed better in the insulin sensitivity test compared with either treatment alone (Fig 7H). These results show that therapeutic administration of recombinant Ism1 into mice improves established diabetes.
Given Ism1’s suppressive effects on lipid production, we next wanted to determine whether Ism1 could reverse established NAFLD in mice. NAFLD was induced by feeding mice a 40% fat, 2% cholesterol diet for three weeks prior to treatment (Fig 7I). Consistent with previously reported diets of similar composition, mice develop hepatic steatosis after 1-4 weeks of feeding (Duparc et al., 2019; Jung et al., 2020). Mice with established NAFLD were dosed with vehicle, 0.5 mg/kg Ism1, 5 mg/kg Ism1 daily for 14 days. As a benchmark control, daily injections of the FXR agonist GW4064 at 30 mg/kg is used, which has previously been shown to significantly reduce hepatic steatosis after 14 days (Jin et al., 2015). Expectedly, vehicle-treated mice on NAFLD diet have higher liver weights, blood glucose and histological signs of steatosis compared with chow fed mice (Fig 7J–N). Intriguingly, no differences are seen in body weight between the treatment groups (Fig 7J), but mice treated with 5 mg/kg Ism1, but not 0.5 mg/kg Ism1, have reduced liver weights (Fig 7K) and fed blood glucose compared with vehicle-treated NAFLD mice (Fig 7L). Importantly, the effect of 5 mg/kg Ism1 was as potent as the FXR agonist GW4064 treatment in reducing liver weights, blood glucose, and histological signs of steatosis. 5 mg/kg Ism1 also shows obvious gross morphological changes in liver size and color compared with vehicle treated NAFLD mice (Fig 7M). Furthermore, comparative analyses demonstrates that 5 mg/kg Ism1 performs equal to the FXR agonist GW4064 in reversing hepatic steatosis, as determined by reduced hepatic FAS protein levels (Fig 7N), as well as reduced Oil red O staining (Fig 7O). In conclusion, these data show that pharmacological administration of Ism1 improves glucose tolerance and reverses established hepatic steatosis in mice.
DISCUSSION
A range of drugs are currently available for type 2 diabetes, but there is still an unmet need for drugs simultaneously targeting diabetes and NAFLD. Here, we demonstrate that Ism1 is a secreted polypeptide hormone that regulates adipose tissue glucose uptake while reducing steatosis in the liver. Thus, pharmacologically targeting the ISM1 pathway could be explored in addition to other diabetes drugs to increase glucose uptake without causing the often-accompanied side effects of hepatic steatosis and weight gain seen with insulin or insulin-sensitizing therapies. The mechanism of Ism1 action is unusual and intriguing. Surprisingly, while pAKTS473 activation by insulin activates lipogenesis to promote fat storage in adipose or liver tissues, Ism1 reduces de novo lipogenesis and increases protein synthesis, thus dissociating the canonical pathways induced by insulin. The increased protein synthesis suggests that Ism1, in the presence of insulin compared with insulin alone, enables a cellular metabolic switch mediated by pS6S235/S236. Importantly, this slight divergence in intracellular signaling pathways apparently has major functional consequences. The increase in hepatocyte protein synthesis by Ism1 is reminiscent of the hepatic actions of FGF19, which stimulates protein synthesis and glycogen synthesis while inhibiting lipid synthesis in the liver (Bhatnagar et al., 2009; Kir et al., 2011). The requirement for AKT in the liver for steatosis and hypertriglyceridemia is still unclear, as studies of the interaction between AKT, mTORC1 and Srebp1c in insulin-sensitive and insulin-resistant states are still ongoing (Laplante and Sabatini, 2009). Future studies on AKT and mTORC1 activity will be necessary to fully understand the requirement for AKT and mTOR for the functions of ISM1.
As ISM1 is a circulating ligand, identification of the ISM1 receptor will be essential to establish the tissue-specific contributions downstream of ISM1. While the Ism1 knockout and knockdown studies show that the endogenous levels of Ism1 contribute to basal and insulin-stimulated glucose uptake in adipocytes and animals, tissue-specific Ism1-KO mice are needed to determine the relative contribution of all the tissues where Ism1 is expressed, including Ism1’s possible effects of modulating fatty acid metabolism in brown and white adipose tissue. Considering Ism1’s acute signaling properties, we expect the presence of a distinct receptor with signaling capacities. Previous work has suggested that ISM1 can bind αVβ5, but no signaling properties was demonstrated in that study (Zhang et al., 2011). Other studies have proposed that ISM1 regulates aspects of NODAL signaling (Osório et al., 2019), suggesting the possibility that ISM1 binds a receptor/co-receptor in the TGFβ-family. Future studies to identify the ISM1 receptor responsible for the AKT signaling actions will be essential to understand Ism1’s role in physiology.
Lastly, some insulin-independent glucoregulatory processes (Ebeling et al., 1998) can cause unwanted hypoglycemia, while others, such as FGF1, do not appear to lead to hypoglycemia (Suh et al., 2014). In our studies with overexpression or pharmacological administration of mouse recombinant Ism1, we do not observe hypoglycemia, suggesting that counterregulatory mechanisms exist and these could be further studied. Likewise, it will be important to investigate the regulation of Ism1 in response to various physiological stimuli, including hypoglycemia, obesity, insulin resistance, fasting and feeding. The increased levels of tissue-resident and circulating Ism1 are not likely to represent an Isthmin-resistance, as administration of Ism1 into mice with established disease ameliorates glucose and lipid dysfunction. In conclusion, the uncovered Ism1 action represents an unexpected ligand-induced signaling pathway with metabolic effects on multiple organ systems. Given Ism1’s dual beneficial effects on glucose homeostasis and lipid-lowering properties, recombinant Ism1 and its derivatives may be explored for therapeutic purposes, and may offer certain advantages over current monotherapies.
Limitations of Study
There are limitations of this work. While Ism1 treatment showed comparable efficacy to metformin in improving glucose tolerance in our mouse studies, future studies should benchmark the efficacy of Ism1 to other diabetes drugs with high efficacy in mice, including thiazolidinediones. In this work, the number of plasma samples from human individuals were relatively small. Future studies will be required to further address the correlation between plasma levels and other important metabolic parameters besides BMI. Additionally, the mechanism by which Ism1 increases insulin sensitivity is still not entirely understood, but it may also involve suppression of hepatic glucose production, which was not directly tested in this work. And finally, as noted above, the receptor(s) for Ism1 still needs to be identified.
STAR METHODS
RESOURCE AVAILABILITY
Lead Contact
Further information and requests for resources and reagents should be directed to and will be fulfilled by the Lead Contact, Dr. Katrin J. Svensson ( katrinjs@stanford.edu ).
Materials availability
All newly generated reagents will be shared upon request, including Ism1 expression plasmids, Ism1 recombinant proteins, anti-ism1 antibodies, and Ism1-KO mice.
Data and code availability
The mass spectrometry proteomics source data have been deposited at ProteomeXchange Consortium via the JPost partner repository and are publicly available under the accession number PXD026921(Okuda et al., 2017).
This paper does not generate original code.
Any additional information required to reanalyze the data reported in this paper is available from the lead contact upon request.
EXPERIMENTAL MODEL AND SUBJECT DETAILS
Mouse models
Animal experiments were performed per procedures approved by the Institutional Animal Care and Use Committee of the Stanford Animal Care and Use Committee (APLAC) protocol number #32982. Experiments were performed according to procedures approved by the Institutional Animal Care and Use Committee of the Beth Israel Deaconess Medical Center and Yale University School of Medicine IACUC. C57BL/6J male mice were purchased from the Jackson Laboratory (#000664) and were used after 1 week of acclimatization after import into the facility. Unless otherwise stated, all mice were in good health and housed in a temperature-controlled (20-22°C) room on a 12-hour light/dark cycle with ad lib access to food and water. All experiments were performed with age-matched 4–14-week male mice housed in groups of five unless stated otherwise. All metabolic studies were performed in male mice. Both male and female mice were used for isolation of primary adipocytes and hepatocytes. This study generated a new Ism1-KO mouse model. All Ism1-WT and Ism1-KO mice were the result of in-house matings, and littermate controls were used for all experiments. The Ism1-floxed allele targeting intron 1 and intron 4 of the Ism1 gene to delete exon 2-4 was generated using CRISPR-mediated gene editing (Applied Stem Cell). The Ism1-flox mice were crossed with female mice expressing the Ella-Cre transgene for embryonic deletion. The deletion of the exons was confirmed with PCR for the exon junction, Sanger sequencing, and q-PCR. The following genotyping primers were used: Ism1-KO: 5 ′ - CTATGCTATGCCCAGTGTCTCTCTCTG -3 ′ ; 5 ′ -CAAACTGACCAGAGTCCCTCCTTCAA-3 ′ , Ism1-WT: 5 ′ - GAACACTGAGGAAGTTGCTGTCA-3′; 5′-ATGGCCCTGACTCCGAAGCAGAA-3’. Total RNA was extracted from adult mice and reverse-transcription was performed as described above. qPCR was performed using the following primers: Ism1-F: 5′-FAGAGCAGCCAGAGTATGATTCC-3′ and Ism1-R: 5′-RGCCGCTGTCCTGAAAGTATCT-3’.
Human samples
For transcriptional analyses on human adipose samples, subcutaneous adipose tissue was collected under IRB 2011P000079 (approved by the Beth Israel Deaconess Medical Center Committee on Clinical Investigations) from individuals recruited from the plastic-surgeon operating-room schedule at Beth Israel Deaconess Medical Center in a consecutive fashion, as scheduling permitted, to process the sample. The inclusion criteria were healthy male and female individuals, ages 18–64 receiving abdominal surgery. The exclusion criteria were diagnosis of diabetes, any individuals taking insulin-sensitizing medications such as thiazolidinediones or metformin, chromatin-modifying enzymes such as valproic acid, and drugs known to induce insulin resistance such as mTOR inhibitors (for example, sirolimus or tacrolimus) or systemic steroid medications. Fasting serum was collected and tested for insulin, glucose, free fatty acids, and a lipid-panel was performed in a Clinical Laboratory Improvement Amendments approved laboratory. BMI measures were derived from electronic medical records and confirmed by self-reporting, and measures of insulin resistance, the homeostasis model assessment-estimated insulin resistance index (HOMA-IR) and revised quantitative insulin sensitivity check index (QUICKI) were calculated. Female individuals in the first and fourth quartiles for either HOMA-IR or QUICKI and matched for age and BMI were processed for RNA-seq. Human participants who donated adipose tissue provided informed consent. Human plasma was obtained from 11 female individuals from the single-site, randomized crossover SWAP-MEAT Trial (NCT03718988) (Crimarco et al., 2020). Glucose levels were only available for 8 out of 11 samples. The inclusion criteria were healthy individuals over 18 years of age. Exclusion criteria were weighing <110 lbs, BMI > 40, LDL cholesterol > 190 mg/dl, systolic blood pressure > 160 mm Hg or diastolic blood pressure > 90 mm Hg, as well as other clinically significant diseases. All samples were blinded and analyzed by ISM1 ELISA.
Cell lines and reagents
AML12 mouse hepatocytes were purchased from ATCC (#CRL-2254) and cultured with DMEM/F12 medium (Gibco) supplemented with 10% FBS, 10 μg/ml insulin, 5.5 μg/ml transferrin, 5 ng/ml selenium, 40 ng/ml dexamethasone, and 15 mM HEPES. 3T3-F332A cells (Sigma, Cat#00070654), 3T3-L1 cells (ATCC, Cat#CL-173), primary human skeletal muscle cells (Cook Myocytes, Cat#SK-1111), Expi293F cells (ThermoFisher #Cat#A14527) were cultured according to manufacturer’s instructions. SGBS cells were obtained from Wabitsch laboratory and cultured as previously described (Fischer-Posovszky et al., 2008; Wabitsch et al., 2001). All cells were cultured in a humidified atmosphere containing 5% CO2 at 37°C.
Mouse and human pre-adipocytes culture and differentiation
Inguinal fat pads from 4-8 week old C57BL/6J male and female mice were dissected and mechanically digested for 10 min using spring scissors. Digested tissues were incubated in WAT isolation buffer (10 ml PBS, 2.4 U/ml dispase II (#04942078001, Roche), 10 mg/ml collagenase D (#11088858001, Roche) at 37 °C for 45 min. 20 mL growth media was added and the tissue suspension was filtered through a 100-μm cell strainer and centrifuged at 600 xg for 5 min. The cell pellets were resuspended in 20 mL growth media, filtered through a 40-μm cell strainer, centrifuged at 600 xg for 5 min, resuspended in 10 mL growth media, and plated in 10-cm collagen-coated dishes. The cells were cultured in growth media (DMEM/F-12 Glutamax, Thermo Fisher Scientific #10565018) supplemented with 10% fetal bovine serum. Two days post-confluency, differentiation was induced with growth media containing 1 μM rosiglitazone, 0.5 mM isobutylmethylxanthine, 1 μM dexamethasone, 5 μg/mL insulin. After two days, cells were re-fed with growth media containing 1 μM rosiglitazone and 5 μg/mL insulin. Cells were fully differentiated after 6-8 days. For Ism1 knockdown or overexpression in primary adipocytes using adenovirus, 500 μL crude virus was mixed with 500 μL fresh growth media containing 1 μM rosiglitazone and 5 μg/mL insulin was added to each well at day 2 of differentiation. At day 4, virus-containing media was removed and 500 μL fresh growth media without stimulators was added to each well. SGBS cells were differentiated as described previously (Fischer-Posovszky et al., 2008; Wabitsch et al., 2001). Briefly, cells were cultured in growth media DMEM/F-12 Glutamax, supplemented with 10% fetal bovine serum, 33 μ biotin, and 17 μ pantothenate. Two days post confluency, differentiation was induced with serum-free DMEM/F12 media containing 33 uM biotin, 17 μ pantothenate, 0.01 mg/ml transferrin, 20 nM insulin, 100 nM cortisol, 0.2 nM triiodothyronine, 25 nM dexamethasone, 0.25 mM isobutyl methylxanthine, and 2 μM rosiglitazone. After four days, cells were re-fed with growth media containing 0.01 mg/ml transferrin 20 nM insulin, 100 nM cortisol, 0.2 nM triiodothyronine. Cells were fully differentiated after day 8-10.
Primary mouse hepatocyte isolation and culture
Primary hepatocyte isolation was performed as previously described (Jung et al., 2020). Briefly, 4-8 week old C57BL/6J mice were sacrificed, and livers were perfused in HBSS buffer (#14175-095, Gibco) supplemented with 0.4 g/L KC1, 1 g/L glucose, 2.1 g/L sodium bicarbonate, and 0.2 g/L EDTA for 3 minutes, followed by Collagenase (#C5138, Sigma) digestion at 37 °C. Cells were dissociated from the digested livers and hepatocytes were suspended in Williams Medium E (#112-033-101, Quality Biological) supplemented with 10% FBS, 2 mM sodium pyruvate, 1 μM dexamethasone, and 100 nM insulin (plating medium). The cell suspension was filtered through a 70 μm strainer and centrifuged at 50 xg for 3 minutes. Cell pellets were resuspended in plating medium and mixed with 90 % Percoll (#P1644, Sigma) followed by centrifugation at 100 xg for 10 minutes. Cell pellets were washed and resuspended in plating medium. 4 hours after seeding on collagen-coated plates, hepatocytes were washed with PBS, followed by the addition of Williams E supplemented with 0.2% BSA, 2 mM sodium pyruvate, 0.1 μM dexamethasone (maintenance medium).
METHOD DETAILS
Ism1 overexpression in vivo using AAV8
Adeno-associated virus serotype 8 expressing mouse Ism1 with a C-terminal flag tag (AAV8-Ism1-flag) was made by Vector Biolabs and the AAV8-GFP (#7061) control was purchased at the same time. 8-week-old mice were subjected to I.V. injection of 1010 virus particles/mouse of AAV8-Ism1-flag or AAV8-GFP diluted in saline in a total volume of 100 μL. After injection, mice were fed a HFD (60 % fat, Research Diets). Body weights were measured and recorded every week. After 10 weeks of HFD feeding, mice were subjected to glucose tolerance tests and insulin tolerance tests. Tissues were collected for gene expression and histological studies at the weeks indicated. Plasma was collected for detecting plasma levels of Ism1-flag, glucagon, and insulin.
Pharmacokinetic measurements of Ism1 blood levels following Ism1 administration
An anti-his tag ELISA was performed to measure Ism1-his concentrations in blood. Recombinant Ism1 protein was administered at 10 mg/kg I.V. in a total volume of 100 ul. Blood was collected and centrifuged at 6000 xg for 10 minutes at room temperature to collect serum. Blood levels were measured using the HisProbe-HRP Conjugate according to the manufacturer’s instructions (Thermo #15165). Briefly, samples were prepared by diluting serum in coating buffer at 1:100 ratio and added to wells for overnight incubation at 4 °C. Nonspecific binding was blocked by adding blocking buffer and incubating for 30 min at 37 °C. The plate was washed three times with wash buffer. HisProbe-HRP (Thermo, #15165) working solution was added to each well. After 15 min incubation at room temperature, the plate was washed four times with wash buffer, followed by adding substrate (Thermo, #34022). After 10 min, 1N sulfuric acid was added to stop the reaction. Absorbance was measured at 450 nm.
Therapeutic Ism1 recombinant protein administration in vivo
All pharmacologic studies using recombinant Ism1 protein were performed in mice with established diet-induced obesity or non-alcoholic fatty liver disease (NAFLD). For all experiments, male C57BL/6J mice purchased from Jax were fed either a high-fat diet (# D12492, Research Diets) or a NAFLD diet (#D09100310, Research Diets) prior to Ism1 protein injections. In all experiments, mice were mock injected with saline for three days prior to protein or drug injections to prevent stress-induced weight loss. Mice were I.P. injected with vehicle (saline) or indicated doses of Ism1 protein diluted in saline. For the 14-day experiments in NAFLD mice, 7-weeks old mice were fed with NAFLD diet for 3 weeks and then mock injected with saline for 3 days prior to protein injections. The induction of lipid accumulation with NAFLD diet was verified by the significant increase in hepatic lipid levels compared with mice on chow diet at the same time point. NAFLD mice were then daily I.P. injected with either vehicle (saline containing 5 % DMSO and 10 % Kolliphor) or indicated doses of Ism1 protein (500μg/kg or 5 mg/kg) or with FXR agonist (30 mg/kg, GW4064, Sigma-Aldrich, #G5172) diluted in vehicle (saline containing 5 % DMSO and 10 % Kolliphor). For the 21-day experiments in HFD mice, mice were mock injected with saline for three days prior to protein injections. Mice were then daily I.P. injected with either vehicle (saline) or 5 mg/kg of Ism1 protein diluted in saline. metformin (100 mg/kg, Sigma, # 317240) was diluted in saline and daily administered by oral gavage. All groups received control injections by I.P. and oral gavage. At the end of the experiments, mice and tissue weights were recorded. Tissues and plasma were collected and frozen for further analyses.
In vivo glucose uptake
Mice were fasted for 1h and injected I.P. with 3H-2-deoxyglucose (3H-2-DOG) at 100 uCi/kg with or without 0.75 U/kg insulin in a total volume of 120 ul per mouse. After 30 min, mice were euthanized. Blood was collected by cardiac puncture and subsequently centrifuged to collect serum. Wet tissue weights were recorded then homogenized in 1% SDS for liquid scintillation counting. Data are expressed as CPM/mg wet weight (fold change over control).
Glucose tolerance and insulin tolerance tests
For glucose tolerance tests, mice were fasted overnight and I.P. injected with glucose at 2 g/kg body weight. Blood glucose levels were measured at 0, 15, 30, 45, 60, 90 and 120 mins. For insulin tolerance tests, mice were fasted for 2h, and I.P. injected with 0.75U/kg insulin. Blood glucose levels were measured at 0, 15, 30, 45, 60, 90 and 120 mins.
Body temperature measurements
Adult mice were implanted with a subcutaneous temperature probe (IPTT Temperature Transponder, Bio Medic Data Systems, Inc.). Mice were group-housed at room temperature for the entire duration of the experiments. Temperature probes were allowed to stabilize for 3 days until the first temperature was measured. During measurements, the body temperature was recorded using an IPTT scanner in conscious mice in their home cages.
Food intake, energy expenditure and body composition measurements
Measurements of accumulated food intake and VO2 were performed using a Comprehensive Lab Animal Monitoring System at room temperature (20-22°C) (Oxymax, Columbus Instruments) as previously described (Cohen et al., 2014; Long et al., 2016; Svensson et al., 2016). Singly housed mice were acclimated in metabolic chambers for at least 24 h before the start of experiments to minimize stress. Fat mass, lean mass, and water mass were measured by Echo MRI.
Construction of shRNA-pENTR/U6 Entry Vector of Ism1
To generate small hairpin RNA (shRNA)- expressing pENTR/U6 entry constructs, single-stranded DNA Oligo sequences encoding the shRNA of mouse Ism1 were designed following the guidelines of the BLOCK-it U6 RNAi Entry Vector kit (# K494500, Thermo Fisher Scientific). Two sets of complementary oligonucleotide strands were designed based on the following sequences: top strand: 5’-CACCGGTCACCATAGAGGTGGTTGACGAATCAACCACCTCTATGGTGACC-3’, bottom strand: 5’-AAAAGGTCACCATAGAGGTGGTTGATTCGTCAACCACCTCTATGGTGACC-3’, and top strand: 5’-CACCGCGGGAAGTGAGGAGTTTAATCGAAATTAAACTCCTCACTTCCCGC-3’, bottom strand: 5’-AAAAGCGGGAAGTGAGGAGTTTAATTTCGATTAAACTCCTCACTTCCCGC-3’. Non-targeting lacZ control dsDNA oligos were included in the kit. The single-stranded DNA oligos were annealed and cloned into pENTR/U6 vectors included in the kit following the manufacturer’s instructions. Briefly, 1 nmol of each complementary oligonucleotide strand and 2 μL of 10X denaturation buffer solution was mixed and sterilized deionized H2O was added to a final volume of 20 μL. The reaction mixture was denatured at 95 °C for 4 min, then annealed at room temperature for 10 min. Ds-oligos were diluted with 1X oligo annealing buffer at a final concentration of 5 nM. T4 DNA ligase was used to clone the ds-oligos into the pENTR/U6 vector. 2 μL of ligation reaction was transformed into One Shot® TOP10 chemically competent E. coli cells. Selected clones were sequenced by using primers provided with the kit.
Generation of shRNA-expressing Adenoviral Destination Clones
The BLOCK-iT Adenoviral RNAi Expression System (#K494100, Thermo Fisher Scientific) was used to generate adenoviral shRNA destination clones according to the manufacturer’s instructions. Briefly, pENTR/U6 entry clones were transferred into adenoviral pAd/BLOCK-iT™-DEST destination vectors by performing LR recombination reactions with Gateway LR Clonase II followed by transformation into One Shot® TOP10 chemically competent E. coli cells. The constructs for recombinant shRNA-expressing adenoviral destination clones were purified using the Qiagen Plasmid Midi kit (catalog number 12143, Qiagen). Selected clones were sequenced by using the following primers: F: 5′-GACTTTGACCGTTTACGTGGAGAC-3′ and R: 5′-CCTTAAGCCACGCCCACACATTTC-3′.
Adenovirus Production
To produce crude shRNA-adenoviral stocks, 15 μg of plasmid was digested with PacI-restriction enzyme and purified with QIAquick PCR purification kit (# 28104, Qiagen). HEK 293A cells were seeded at 5 × 10⁵ cells/well in a 6-well plate the day before transfection. Cells were transfected with 3μg of PacI-digested shRNA adenovirus plasmids and LipoD293 transfection reagent (SignaGen Laboratories). The media was replaced ~16 hours post-transfection. 48 hours post-transfection, cells were trypsinized and transferred into a 10 cm dish. Adenovirus-containing cells and medium were harvested and transferred into a 15 ml Falcon tube after 7-9 days post-transfection when cytopathic effects were observed in more than 80 % of the cells. The crude adenovirus stocks were prepared by three freeze-thaws, followed by centrifugation to remove cell debris. Crude adenoviral stocks were stored at −80 °C in 1 ml aliquots. The crude virus stocks were further amplified by infection of HEK 293A cells grown in three 15-cm dishes (300 μL of crude virus/15 cm dish). Three days later, adenovirus-containing cells and medium were harvested and centrifuged as described for crude virus. Amplified viral stocks were stored in aliquots at −80 °C.
Expression, purification, and characterization of recombinant Ism1 protein
The proteins used in this study were generated by transient transfection of a mouse Ism1-flag or Ism1-myc-his DNA plasmid in mammalian Expi93F cells. The protein was purified using a Ni column and buffer exchanged to PBS. Protein purity and integrity were assessed with SDS page, Superdex200 size exclusion column, endotoxin assays, western blot, and mass spectrometry. Every protein batch was tested for bioactivity using pAKTS473 as the readout. Following purification, the protein was aliquoted and stored at −80 °C and not used for more than three freeze-thaws. For protein deglycosylation, the reaction was performed according to the manufacturer’s protocol using deglycosylation Mix II from New England BioLabs (#P6044). Briefly, 25 μg of Ism1 protein or control protein fetuin was dissolved in 40 μL water. 5 μL Deglycosylation Mix Buffer 2 was added to the protein solution, and the protein solution was incubated at 75 °C for 10 minutes. 5 μL Protein Deglycosylation Mix II was added to the protein solution followed by a 30-minute incubation at room temperature and 1 h at 37 °C. The deglycosylated proteins were analyzed by silver stain and western blot.
Measurements of Ism1 protein stability using transmittance
Briefly, Ism1 or insulin was plated at 150 μL per well (n = 3/group) in a clear 96-well plate and sealed with optically clear and thermally stable seal (VWR). The plate was immediately placed into a plate reader and incubated with continuous shaking at 37 °C. Absorbance readings were taken every 10 minutes at 540 nm for 100 h (BioTek SynergyH1 microplate reader). Values are expressed as total transmittance.
SureFire Ultra AKT1/2/3 (pS473) AlphaLISA
AKT 1/2/3 (pS473) AlplaLISA kit was purchased from PerkinElmer (#ALSU-PAKT-B-HV) and serine 473 phosphorylation of AKT was measured according to the instructions in the protocol provided by the manufacturer. Briefly, confluent F442A cells were starved overnight in serum-free DMEM/F12 media. On the following day, insulin or Ism1 were added to cells. After a 5 min incubation, cells were washed with cold PBS once and lysed using lysis buffer supplied in the kit. 30 μL of cell lysate was transferred, followed by incubation with 15 μL of Acceptor Mix for 1 hr at room temperature. 15 μL of Donor Mix was added to each well and the plate was incubated at room temperature for 1hr in the dark. The Alpha signals were measured on Tecan Infinite M1000 Pro plate reader using standard AlphaLISA settings.
Gene expression analysis
Total RNA from cultured cells or tissues was isolated using TRIzol (Thermo Fischer Scientific) and Rneasy mini kits (QIAGEN). RNA was reverse transcribed using the ABI high capacity cDNA synthesis kit. For qRT-PCR analysis, cDNA, primers and SYBR-green fluorescent dye (ABI) were used. Relative mRNA expression was determined by normalization with Cyclophilin levels using the ΔΔCt method. Primer sequences used are described in Table S4.
Western blots and molecular analyses
For western blotting, homogenized tissues or whole-cell lysates, samples were lysed in RIPA buffer containing protease inhibitor cocktail (Roche) and phosphatase inhibitor cocktail (Roche). Cell lysates were centrifuged at 14,000 x g for 15 min and supernatants were prepared in 4X LDS Sample Buffer (Invitrogen) and separated by SDS-PAGE and transferred to Immobilon 0.45μm membranes (Millipore). For Western blotting of plasma samples, 1 μl of plasma was prepared in 2X sample buffer (Invitrogen) with reducing agent, boiled, and analyzed using Western blot against indicated protein. All primary antibody incubations were performed overnight at 4 °C and secondary antibody incubations were performed at room temperature for 2h. All primary antibodies were diluted at 1:1000 in TTBS supplemented with 3 % BSA, except the ISM1 antibodies that were diluted to 1:100. Secondary antibody incubations were performed at 1:10,000 dilution in 1:1000 in TTBS supplemented with 5 % milk. Protein kinase array (R&D systems ARY003B) was performed according to the manufacturers’ description. All antibodies used in this paper are described in STAR methods.
Biochemical analyses
Plasma insulin levels were measured using the Ultra-Sensitive Mouse Insulin ELISA kit (Crystal Chem Inc #90080). Plasma triglycerides were measured with Infinity triglyceride measurement kit (Thermo #TR22421) and tissue triglycerides were measured with a Triglyceride Colorimetric Assay Kit (Cayman #10010303). Lipolysis was measured in day 5 differentiated adipocytes after 4 hours of protein treatment using a glycerol release assay according to the protocol provided by the manufacturer (Abcam #abl33130). Plasma membrane protein extractions were performed according to the manufacturer’s protocol (Abcam #ab65400).
Immunocytochemistry
Primary mouse preadipocytes were seeded onto collagen-coated 22 mm x 22mm coverslips and differentiated using the method above. On day 8, differentiated adipocytes were washed with PBS and starved in 0.5 % BSA in KRH buffer (50 mM HEPES, 136 mM NaCl, 1.25 mM MgSO4, 1.25 mM CaCl2, 4.7 mM KCl, pH 7.4) for 3.5 h. Cells were treated with insulin or Ism1 for 30 min, followed by three washes with cold PBS. Cells were fixed with 4% PFA in PBS for 15 min at room temperature. After blocking with 2 % BSA, 5 % goat serum, 0.2 % Triton-X in PBS (blocking buffer) for 1 hr, cells were incubated with anti-Glut4 primary antibody diluted at 1:1000 in blocking buffer at 4 °C overnight. The next day, cells were washed and incubated with secondary antibody diluted at 1:1000 in blocking buffer on ice for 1 hr. Cells were imaged using confocal microscope (Leica TCS SP8). Hoechst (#33342, thermo fisher) was used as counterstain.
Immunohistochemistry
For H&E staining, livers were formalin-fixed, paraffin-embedded, and sectioned at 6 μm. For hematoxylin and eosin (H&E) staining, sections were deparaffinized and dehydrated with xylenes and ethanol. Briefly, slides were stained with hematoxylin, washed with water and 95% ethanol, and stained with eosin for 30 min. Sections were then incubated with ethanol and xylene, and mounted with mounting medium. For Oil red O stainings, frozen liver tissue slides were fixed with 3 % formalin in PBS, washed twice with water, incubated with 60 % isopropanol for 5 min and then incubated with Oil Red O solution (3:2 ratio of Oil Red O: H2O) for 20 min. Immunohistochemical stainings were observed with a Nikon 80i upright light microscope using a 40 x objective lens. Digital images were captured with a Nikon Digital Sight DS-Fil color camera and NIS-Elements acquisition software.
Glucose uptake
Glucose uptake was performed as previously described (You et al., 2017). Briefly, 2-Deoxy-d-[2,6-3H]-glucose was purchased from PerkinElmer NEN radiochemicals. Fully differentiated adipocytes were washed with KRH buffer and starved in 0.5% BSA in KRH buffer for 4 h. Indicated concentrations of insulin or Ism1 were added at indicated time points. Cells were treated with a mixture of 500μM 2-deoxy-D-glucose and 1.71μCimL−1 2-Deoxy-D-[1,2-3H (N)]-glucose for another 10 min followed by three washes using ice cold KRH buffer containing 200 mM glucose. The passive glucose uptake in the presence of 50 μM CytoB was less than 12 % of the total glucose uptake. Cells were solubilized in 1% SDS and radioactivity was measured by liquid scintillation counting.
Lipogenesis Assay
Primary hepatocytes or AML12 hepatocytes were washed twice with warm PBS and starved in serum-free DMEM overnight. Indicated concentrations of insulin with or without Ism1 were added at the same time. After 24 h, a mixture of 10 μM cold acetate and 2 μCi [3H]-Acetate (#NET003H005MC, PerkinElmer) was added to each well and cells were incubated for another 4 hr. Cells were washed with PBS twice and lysed using 0.1 N hydrogen chloride. Lipids were extracted by 2:1 chloroform-methanol (v/v). After centrifugation at 3000 xg for 10 min, the lower phase was transferred to scintillation vials and radioactivity was measured by liquid scintillation counting.
Protein synthesis Assay
AML12 hepatocytes were washed twice with warm PBS and starved in serum-free media overnight. Indicated concentrations of insulin with or without Ism1 and 0.25 uCi of [3H]-Leucine (#NET460250UC, PerkinElmer) were added at the same time. After a 24 h incubation, cells were washed three times with ice cold PBS and lysed in RIPA buffer containing protease inhibitor cocktail (Roche). After 15 min centrifugation at 14000 xg, supernatants were transferred to new tubes. Trichloroacetic acid was added to the protein extracts at a final concentration of 10 % and incubated on ice for 1h. After a 15 min centrifugation at 14000 xg, pellets were washed with cold acetone, diluted in 10M NaOH and transferred to scintillation vials. The radioactivity was measured by liquid scintillation counting.
Cellular respiration assay
Cells were seeded in seahorse cell culture microplates (Agilent, #100777-004) using growth media. XFe24 extracellular flux assay kit cartridge (Agilent, #102340-100) was hydrated with XF calibrant (Agilent, #100840-000) and PBS and incubated overnight in CO2-free incubator. The next day, cells were washed with seahorse assay buffer (0.3M NaCl, 1mM pyruvate and 20mM glucose, DMEM (Sigma, D5030-10L), pen-strep, pH 7.4) and incubated in seahorse assay buffer for 1 hr in CO2-free incubator. PBS or Ism1 proteins were injected into the port as indicated in the figure. The seahorse program was run with 3 cycles with a 4 min mix, 0 min wait, and a 2 min measure between injections of compounds.
LC-MS/MS
Samples were run on a 4-12% SDS-PAGE gel and resolved by Coomassie staining. Gel bands were excised and placed in 1.5 ml Eppendorf tubes and then cut in 1x1 mm squares. The excised gel pieces were then reduced with 5 mM DTT, 50 mM ammonium bicarbonate at 55°C for 30 min. Residual solvent was removed and alkylation was performed using 10 mM acrylamide in 50 mM ammonium bicarbonate for 30 min at room temperature. The gel pieces were rinsed 2 times with 50% acetonitrile, 50 mM ammonium bicarbonate and placed in a speed vac for 5 min. Digestion was performed with Trypsin/LysC (Promega) in the presence of 0.02% protease max (Promega) in both a standard overnight digest at 37°C. Samples were centrifuged and the solvent including peptides was collected and further peptide extraction was performed by the addition of 60% acetonitrile, 39.9% water, 0.1% formic acid and incubation for 10-15 min. The peptide pools were dried in a speed vac. Samples were reconstituted in 12μl reconstitution buffer (2% acetonitrile with 0.1% Formic acid) and 3μl (100ng) of it was injected on the instrument.
Mass spectrometry experiments were performed using a Q Exactive HF-X Hybrid Quadrupole - Orbitrap mass spectrometer (Thermo Scientific, San Jose, CA) with liquid chromatography using a Nanoacquity UPLC (Waters Corporation, Milford, MA). For a typical LCMS experiment, a flow rate of 600 nL/min was used, where mobile phase A was 0.2% formic acid in water and mobile phase B was 0.2% formic acid in acetonitrile. Analytical columns were prepared in-house with an I.D. of 100 microns packed with Magic 1.8 micron 120Å UChrom C18 stationary phase (nanoLCMS Solutions) to a length of ~25 cm. Peptides were directly injected onto the analytical column using a gradient (2-45% B, followed by a high-B wash) of 80min. The mass spectrometer was operated in a data dependent fashion using HCD fragmentation for MS/MS spectra generation. For data analysis, the .RAW data files were processed using Byonic v3.2.0 (Protein Metrics, San Carlos, CA) to identify peptides and infer proteins using Mus musculus database from Uniprot. Proteolysis was assumed to be semi-specific allowing for N-ragged cleavage with up to two missed cleavage sites. Precursor and fragment mass accuracies were held within 12 ppm. Proteins were held to a false discovery rate of 1%, using standard approaches.
Human adipose tissue transcriptomics analyses
For purification of mature human adipocytes for RNA sequencing, whole-tissue subcutaneous adipose specimens were freshly collected from the operating room. Skin was removed, and adipose tissue was cut into 1- to 2-inch pieces and rinsed thoroughly with 37 °C PBS to remove blood. Cleaned adipose tissue pieces were quickly minced with an electric grinder with 3/16-inch hole plate, and 400 ml of sample was placed in a 2-1 wide-mouthed Erlenmeyer culture flask with 100 ml of freshly prepared blendzyme (Roche Liberase TM, research grade, cat. no. 05401127001, in PBS, at a ratio of 6.25 mg per 50 ml) and shaken in a 37 °C shaking incubator at 120 r.p.m. for 15–20 min to digest until the sample appeared uniform. Digestion was stopped with 100 ml of freshly made KRB (5.5 mM glucose, 137 mM NaCl, 15 mM HEPES, 5 mM KCl, 1.25 mM CaC12, 0.44 mM KH2PO4, 0.34 mM Na2HPO4 and 0.8 mM MgSO4), supplemented with 2% BSA. Digested tissue was filtered through a 300 μM sieve and washed with KRB/albumin and flow through until only connective tissue remained. Samples were centrifuged at 233g for 5 min at room temperature, clear lipid was later removed, and floated adipocyte supernatant was collected, divided into aliquots and flash-frozen in liquid nitrogen. RNA isolation from mature human adipocytes. Total RNA from ~400 μl of thawed floated adipocytes was isolated in TRIzol reagent (Invitrogen) according to the manufacturer’s instructions. For RNA-seq library construction, mRNA was purified from 100 ng of total RNA by using a Ribo-Zero rRNA removal kit (Epicentre) to deplete ribosomal RNA and convert into double-stranded complementary DNA by using an NEBNext mRNA Second Strand Synthesis Module (E6111L). cDNA was subsequently tagmented and amplified for 12 cycles by using a Nextera XT DNA Library Preparation Kit (Illumina FC-131). Sequencing libraries were analysed with Qubit and Agilent Bioanalyzer, pooled at a final loading concentration of 1.8 pM and sequenced on a NextSeq500. Sequencing reads were demultiplexed by using bcl2fastq and aligned to the mm10 mouse genome by using HISAT2. PCR duplicates and low-quality reads were removed by Picard. Filtered reads were assigned to the annotated transcriptome and quantified by using featureCounts.
Ism1 sandwich ELISA
Ism1 sandwich ELISA was performed using mouse serum from Ism1-KO and WT mice and on ISM1 from human plasma from female individuals from the single-site, randomized crossover SWAP-MEAT Trial (NCT03718988) (Crimarco et al., 2020). Anti-Ism1 antibodies were custom generated by Genscript using the recombinant mouse Ism1 protein as antigen. Antibody production was carried out for five clones separately. The antibodies were purified by mouse Ism1 A/G affinity column chromatography and dialyzed into PBS for storage. Biotin conjugation was performed on purified antibodies from each clone. For Ism1 ELISA on human or mouse plasma samples, the anti-Ism1 capture antibody was diluted (1:500) in PBS and the ELISA plate was coated with 100 μl of the antibody dilution at 4 °C for 48 h. After one wash with 260 μl PBS-T, 150 ul of blocking buffer (1% BSA in PBS) was added to each coated well and the plate was incubated at 37 °C for 2 h, dried, and incubated again at 37 °C overnight. After four washes, 200 μl of antigen diluted in sample buffer was added to each well and the plate was incubated at 4 °C overnight. After four washes, 100 μl of the diluted (1:1000) anti-Ism1 biotinylated detection antibody was added to each well and the plate was incubated at 37 °C for 2h and then at 4 °C overnight. After four washes, Streptavidin- HRP was diluted with sample buffer to 0.2 μl/mL and 100ul was added to the plate. The plate was incubated at 37 °C for 10 min. After five washes, 100 μl TMB reagent was added to each well and the plate was incubated at room temperature for 25-30 min. The absorbance at 450 nm was measured using a microplate reader. The Ism1 concentration in pg/ml was calculated from the standard curve.
QUANTIFICATION AND STATISTICAL ANALYSIS
Data Representation and Statistical analysis
Replicates are described in the figure legends. All values in graphs are presented as mean +/− S.E.M. Values for n represent biological replicates for cell experiments or individual animals for in vivo experiments. For animal experiments, n corresponds to the number of animals per condition. Specific details for n values are noted in each figure legend. Each cellular experiment using primary cells was repeated using at least two cohorts of mice. Mice were randomly assigned to treatment groups for in vivo studies. Each animal experiment was repeated using at least two cohorts of mice. Student’s t-test was used for single comparisons. Significant differences between two groups (*P < 0.05, **P < 0.01, ***P < 0.001) were evaluated using a two-tailed, unpaired Student’s t-test as the sample groups displayed a normal distribution and comparable variance. Two-way ANOVA with repeated measures was used for the body weights, hyperinsulinemic-euglycemic clamps, GTT and ITT. Human expression data was analyzed using Mann-Whitney test. No power calculations were performed, and the sample sizes were not predetermined. All human samples were analyzed in a blinded fashion and no samples were excluded from the analyses. Clinical inclusion and exclusion criteria for human individuals are described in STAR methods.
Supplementary Material
Supplemental Figures 1-7.
Table S1, related to Figure 1. RNA expression of mature adipocytes.
Table S2, related to Figure 1. Glycan analysis of recombinant Ism1-his protein.
Table S3, related to Figure 1. LC-MS analysis of recombinant Ism1-his protein.
KEY RESOURCES TABLE
| REAGENT or RESOURCE | SOURCE | IDENTIFIER |
|---|---|---|
| Antibodies | ||
| Rabbit polyclonal anti-Ism1 | Abcam | Cat#AB103338; RRID:AB_10710279 |
| Rabbit monoclonal anti-p-AKT (Ser473) | Cell Signaling Technology | Cat#4060; RRID:AB_2315049 |
| Rabbit monoclonal anti-p-AKT (Thr308) | Cell Signaling Technology | Cat#13038; RRID:AB_2629447 |
| Rabbit monoclonal anti-Akt (pan) (C67E7) | Cell Signaling Technology | Cat#4691; RRID:AB_915783 |
| Rabbit polyclonal anti-p-ERK1/2 (Thr202/Tyr204) | Cell Signaling Technology | Cat#9101; RRID:AB_331646 |
| Rabbit polyclonal anti-ERK1/2 | Cell Signaling Technology | Cat#9102; RRID:AB_330744 |
| Rabbit polyclonal anti-p-S6 Ribosomal Protein (Ser235/236) | Cell Signaling Technology | Cat#2211; RRID:AB_331679 |
| Rabbit monoclonal anti-p-PRAS40 (Thr246) (C77D7) | Cell Signaling Technology | Cat#2997; RRID:AB_2258110 |
| Rabbit polyclonal anti-p-IGF-I Receptor β (Tyr1131)/Insulin Receptor β (Tyr1146) | Cell Signaling Technology | Cat#3021; RRID:AB_331578 |
| Rabbit polyclonal anti-p-IGF-I Receptor β (Tyr1135/1136)/Insulin Receptor β (Tyr1150/1151) (19H7) | Cell Signaling Technology | Cat#3024; RRID:AB_331253 |
| Rabbit monoclonal anti-IGF-I Receptor β (D23H3) | Cell Signaling Technology | Cat#9750; RRID:AB_10950969 |
| Phospho-Tyrosine (P-Tyr-1000) MultiMab Rabbit mAb mix | Cell Signaling Technology | Cat#8954 RRID:AB_2687925 |
| Biotin conjugated antibody anti-Ism1 6E1B6 | This paper | N/A |
| Biotin conjugated antibody anti-Ism1 7BF11 | This paper | N/A |
| Rabbit polyclonal anti-p-FoxO1 (Ser256) | Cell Signaling Technology | Cat#9461; RRID:AB_329831 |
| Rabbit monoclonal anti-FoxO1 (C29H4) | Cell Signaling Technology | Cat#2880; RRID:AB_2106495 |
| Rabbit polyclonal anti-p-GSK-3α/β (Ser21/9) | Cell Signaling Technology | Cat#9331; RRID:AB_329830 |
| Rabbit monoclonal anti- p-GSK-3β (Ser9) (D85E12) | Cell Signaling Technology | Cat#5558; RRID:AB_10013750 |
| Rabbit polyclonal anti-p-PDK1 (Ser241) | Cell Signaling Technology | Cat#3061; RRID:AB_2161919 |
| Rabbit monoclonal anti-PDGFRα (D1E1E) | Cell Signaling Technology | Cat# 3174, RRID:AB_2162345 |
| Rabbit monoclonal anti-p-mTOR (Ser2448) (D9C2) | Cell Signaling Technology | Cat#5536; RRID:AB_10691552 |
| Rabbit monoclonal anti-mTOR (7C10) | Cell Signaling Technology | Cat#2983; RRID:AB_2105622 |
| Rabbit monoclonal anti-p-PKA Substrate (RRXS*/T*) (100G7E) | Cell Signaling Technology | Cat#9624; RRID:AB_331817 |
| Rabbit monoclonal anti-PI3 Kinase Class III (D4E2) | Cell Signaling Technology | Cat#3358; RRID:AB_2299768 |
| Rabbit monoclonal anti-DYKDDDDK(FLAG) Tag (D6W5B) | Cell Signaling Technology | Cat#14793; RRID:AB_2572291 |
| Rabbit polyclonal anti-Acetyl-CoA Carboxylase | Cell Signaling Technology | Cat#3662; RRID:AB_2219400 |
| Rabbit monoclonal anti-Fatty Acid Synthase (C20G5) | Cell Signaling Technology | Cat#3180; RRID:AB_2100796 |
| Mouse monoclonal anti-SREBP1(2A4) | Thermo Fisher Scientific | Cat#MA5-16124; RRID:AB_11152118 |
| Mouse monoclonal anti- beta Actin [AC-15] (HRP) | Abcam | Cat#AB49900; RRID:AB_867494 |
| Mouse monoclonal anti-Glucose Transporter GLUT4 (1F8) | Cell Signaling Technology | Cat# 2213, RRID:AB_823508 |
| Rabbit polyclonal anti-Glucose Transporter GLUT4 | Abcam | Cat#AB654; RRID:AB_305554 |
| Sheep anti-mouse IgG (HRP) | Cytiva (GE) | CAT#NA931; RRID:AB_772210 |
| Donkey anti-rabbit IgG (HRP) | Cytiva (GE) | CAT#NA934; RRID:AB_772206 |
| Bacterial and Virus Strains | ||
| One Shot™ TOP10 Chemically Competent E. coli | Thermo Fisher Scientific | Cat#C404010 |
| AAV8-Ism1-FLAG | Vector Biolabs | N/A |
| AAV8-GFP | Vector Biolabs | Cat#7061 |
| Biological Samples | ||
| Adult subcutaneous adipose tissues | Beth Israel Deaconess Medical Center | IRB 2011P000079 |
| Human plasma samples | (Crimarco et al., 2020) | NCT03718988 |
| Chemicals, Peptides, and Recombinant Proteins | ||
| Mouse recombinant Ism1-his protein | This paper | N/A |
| Human recombinant insulin | Millipore Sigma | Cat#91077C |
| Human recombinant PDGF-BB | R&D Systems | Cat#220-BB |
| Bovine Serum Albumin | Millipore Sigma | Cat#A7906 CAS:9048-46-8 |
| Deoxy-D-glucose, 2-[1,2-3H (N)]-, Aqueous Sol, Specific Activity: 5-10 Ci (185-370 GBq)/mmol | Perkin-Elmer | Cat#NET328A001MC |
| Acetic acid, sodium salt, [3 H]- 5 mCi (185 MBq) | Vitrax | Cat#VT211 |
| L-[3,4,5-3H(N)]-Leucine, Specific Activity: 100 to 150 Ci/mmol (3.7 to 5.56 TBq/mmol), 250μCi (9.25MBq) | Perkin-Elmer | Cat#NET460250UC |
| Rapamycin | Cell Signaling Technology | Cat#9904 |
| LY294002 | Cell Signaling Technology | Cat#9901 |
| Wortmannin | Cell Signaling Technology | Cat#9951 |
| Torin1 | Selleckchem | Cat#S2827 |
| PIK-75 HCl | Selleckchem | Cat#S1205 |
| Omipalisib | Selleckchem | Cat#S2658 |
| Sapanisertib (INK-128) | Selleckchem | Cat#S2811 |
| Linsitinib (OSI-906) | Selleckchem | Cat#S1091 |
| LDC1267 | Selleckchem | Cat#S7638 |
| S6K1 Inhibitor II, DG2 | Millipore Sigma | Cat#559274 |
| Hoechst 33342 | Thermo Fisher Scientific | Cat#H3570 |
| Oil Red O solution | Millipore Sigma | Cat#O1391 |
| 2x SYBR Green qPCR master mix | Bimake | Cat# B21203 |
| Trizol | ThermoFisher | Cat# 15-596-026 |
| High-capacity cDNA Reverse Transcription kit | Biosystems | Cat# 4368814 |
| DMEM/F12 (1:1) | ThermoFisher | Cat# 11320082 |
| DMEM/F12 + Glutamax | ThermoFisher | Cat# 10565-042 |
| Expi293 Expression medium | ThermoFisher | Cat# A1435101 |
| Opti-MEM reduced serum media | ThermoFisher | Cat# 31985062 |
| HBSS buffer | Gibco | Cat# 14175-095 |
| Potassium chloride | Quality Biological | Cat# 112-033-101 |
| Sodium bicarbonate | Sigma | Cat# S6297 |
| UltraPure™ 0.5M EDTA, pH8.0 | Invitrogen | Cat# 15575-038 |
| Williams E media | Quality Biological | Cat# 112-033-101 |
| Corning™ Regular Fetal Bovine Serum | Corning | Cat# 35-010-CV |
| DMEM high glucose | Sigma | Cat# D6429 |
| HEPES buffered saline | Sigma-Aldrich | Cat# 51558 |
| Sodium pyruvate | ThermoFisher | Cat# 11360070 |
| Dexamethasone | Sigma | Cat# D1756 |
| Biotin | Sigma | Cat# B-4639 |
| D-Pantothenic acid | Sigma | Cat# P5155 |
| Human transferrin | Sigma | Cat# T-2252 |
| Cortisol | Sigma | Cat# H-0888 |
| Triiodothyronine | Sigma | Cat# T-6397 |
| IBMX | Sigma | Cat# I-5879 |
| Rosiglitazone | Cayman | Cat# 71740 |
| Calcium chloride | Sigma | Cat#100-43-52-4 |
| Dispase II | Roche | Cat# 04942078001 |
| D-(+)-Glucose | Sigma | Cat# 50-99-7 |
| Primocin | FisherScientific | Cat# NC9141851 |
| Trypsin/EDTA 0.25% | Gibco | Cat# 25200-056 |
| Penicillin/Streptomycin | Gibco | Cat# 15140-122 |
| Collagenase IV | Sigma | Cat# C5138 |
| Collagenase D | Roche | Cat# 11088882001 |
| PBS | Gibco | Cat# 10010-023 |
| 10x PBS | Gibco | Cat# 70011044 |
| Percoll | Sigma | Cat# P1644 |
| Ethanol | FisherScientific | Cat# 22-032-601 |
| Glutamax | ThermoFisher | Cat# 35050061 |
| Trypan Blue Stain (0.4%) | Invitrogen | Cat# T10282 |
| Isopropanol | FisherChemical | Cat# BP2632-4 |
| Formalin | SIP Brand | Cat# C4320 |
| Rat tail Collagen I | Corning | Cat# 354236 |
| Metformin | Sigma | Cat# 317240 |
| GW4064 | Sigma | Cat# G5172 |
| Imidazole | Sigma | Cat# I5513 |
| Hematoxylin Solution, Mayer’s | Millipore Sigma | Cat#MHS1 |
| Immobilon Crescendo Western HRP substrate | Millipore Sigma | Cat t# WBLUR0500 |
| SuperSignal West Femto HRP substrate | ThermoScientific | Cat# 34095 |
| SeeBlue Plus2 prestained standard | Invitrogen | Cat# LC5925 |
| RIPA buffer (10x) | Cell Signaling | Cat# 9806S |
| NuPAGE LDS sample buffer (4x) | Invitrogen | Cat# NP0007 |
| 2-mercaptoethanol | FisherChemical | Cat# O3446I |
| PhosSTOP | Roche | Cat# 04906837001 |
| cOmplete Tablets | Roche | Cat# 04693124001 |
| Critical Commercial Assays | ||
| Proteome Profiler Human Phospho-Kinase Array Kit | R&D Systems | Cat#ARY003C |
| AlphaLISA SureFire Ultra AKT 1/2/3 (pS473) Assay Kit - High Volume | Perkin-Elmer | Cat#ALSU-PAKT-B-HV |
| Ultra-Sensitive Mouse Insulin ELISA kit | Crystal Chem Inc | Cat#90080; RRID:AB_2783626 |
| Infinity triglyceride measurement kit | Thermo Fisher Scientific | Cat#TR22421 |
| Triglyceride colorimetric assay kit | Cayman | Cat#10010303 |
| Deglycosylation Mix II | New England BioLabs | Cat#P6044 |
| Pierce BCA Protein Assay Kit | Thermo Fisher Scientific | Cat#23225 |
| Glycerol release assay | Abcam | Cat#ab133130 |
| Plasma Membrane Protein Extraction Kit | Abcam | Cat#ab65400 |
| Deposited Data | ||
| Raw and processed proteomics data | ProteomeXchange Consortium via Proteomics Identification (PRIDE) | PXD026921 JPost: JPST001229 |
| Experimental Models: Cell Lines | ||
| 3T3-F442A cells | Millipore Sigma | Cat#00070654; RRID:CVCL_0122 |
| AML12 cells | ATCC | Cat#CRL-2254; RRID:CVCL_0140 |
| SGBS cells | (Wabitsch et al., 2001) | RRID:CVCL_GS28 |
| Primary human skeletal muscle cells | Cook Myocytes | Cat#SK-1111 |
| 3T3-L1 cells | ATCC | Cat#CL-173; RRID:CVCL_0123 |
| Expi293F Cells | Thermo Fisher Scientific | Cat# A14527 |
| Primary mouse white and brown adipocytes | This paper | N/A |
| Experimental Models: Organisms/Strains | ||
| Mouse: C57BL/6J | Jackson Laboratory | Cat#000664; RRID:IMSR_JAX:000664 |
| Mouse: Ism1 whole-body knockout | This paper | N/A |
| Oligonucleotides | ||
| shRNA target sequencing against Ism1 (shRNA1 Ism1): 5’-CACCGGTCACCATAGAGGTGGTTGACGAATCAACCACCTCTATGGTGACC-3’ | This paper | N/A |
| shRNA target sequencing against Ism1 (shRNA2 Ism1): 5’-CACCGCGGGAAGTGAGGAGTTTAATCGAAATTAAACTCCTCACTTCCCGC-3’ | This paper | N/A |
| Genotyping primers: Ism1 KO: 5′ -CTATGCTATGCCCAGTGTCTCTCTCTG- 3′; 5′- CAAACTGACCAGAGTCCCTCCTTCAA- 3′, Ism1 WT: 5′- GAACACTGAGGAAGTTGCTGTCA -3′; 5′- ATGGCCCTGACTCCGAAGCAGAA -3. | This paper | N/A |
| Primers for q-RT-PCR, see Table S4 | This paper | N/A |
| Recombinant DNA | ||
| Ism1-his expression plasmid | This paper | N/A |
| BLOCK-iT™ U6 RNAi Entry Vector | Thermo Fisher Scientific | Cat#K494500 |
| pAd/BLOCK-iT™-DEST RNAi Gateway® Vector | Thermo Fisher Scientific | Cat#K494100 |
| Software and Algorithms | ||
| ImageJ | Schneider et al., 2012 | https://imagej.nih.gov/ij/; RRID:SCR_003070 |
| GraphPad Prism version 8.0 | GraphPad Software, San Diego, California USA | http://www.graphpad.com/; RRID:SCR_002798 |
| Adobe Illustrator | Adobe systems | RRID: SCR_010279 |
| Other | ||
| NAFLD diet | ResearchDiet | Cat#D09100310 |
| HFD diet (60%) | ResearchDiet | Cat# D12492 |
| ExpiFectamine 293 Transfection Kit | Thermo Fisher Scientific | Cat#A14524 |
| Corning® 125 mL Polycarbonate Erlenmeyer Flask with Vent Cap | Corning | Cat# 431143 |
| His GraviTrap Talon columns | Millipore Sigma | Cat#GE29-0005-94 |
| HisProbe-HRP | Thermo Scientific | Cat#15165 |
| Slide-A-Lyzer Dialysis Cassette 3.5 MWCO | Thermo Fisher Scientific | Cat#66330 |
| Countess II FL Automated Cell Counter | Life Technologiy | Cat# AMQAF1000 |
| Blood Glucose meter | OneTouch UltraMini meter | N/A |
| Blood Glucose Strips | GenUltimate | Cat# 100-50 |
| 70um cell strainer | BD Falcon | Cat# 352350 |
| 25G x 7/8 Needle | BD | Cat# 305124 |
| Petri dish Fisherbrand™ | FisherScientific | Cat# FB0875713 |
| Fisherbrand™ Variable-Flow Peristaltic Pump | FisherScientific | Cat# 13-876-2 |
| Perfusion tubing connectors 3/32” Polypropylene Coupler | United States plastic Corp | Cat# 65600 |
| Perfusion tubing 1/32” ID x 3/32” OD Silicone | United States plastic Corp | Cat# 57286 |
| Immobilon-P PVDF Membrane | Merck | Cat# IPVH00010 |
| NuPAGE 4-12% Bis Tris gels | Invitrogen | Cat# WG1403BX10 |
Highlights.
The secreted protein Isthmin-1 (ISM1) increases adipocyte glucose uptake
ISM1 ablation impairs basal and insulin-induced glucose uptake by adipocytes
ISM1 suppresses hepatocyte lipid synthesis while increasing protein synthesis
Therapeutic administration of recombinant ISM1 improves diabetes and hepatic steatosis
ACKNOWLEDGEMENTS
K.J.S. was supported by NIH grants DK125260, DK111916, P30DK116074, and the Jacob Churg Foundation and the McCormick and Gabilan Award. B.M.S was supported by DK031405, DK061562 and the JPB Foundation. E.A.A. was supported by DK119254. J.W.K. was supported by DK116750, DK120565, P30DK116074, AHA 19TPA34900000. E.D.R. was supported by DK102173. G.I.S. was supported by DK045735. M.A. was supported by the Sigrid Juselius Foundation and Orion Research Foundation. J.P.C. was supported by the Sao Paulo Research Foundation 18/04956-5 (FAPESP). This work was supported by the Stanford Diabetes Research Center (NIH grant P30DK116074). We thank the Gardner lab and the Stanford Diabetes Research Center Biorepository (NIH P30DK116074) for the blood samples. This work was supported in part by NIH P30CA124435 utilizing the Stanford Cancer Institute Proteomics Shared Resource. The project described was supported by Award Number S10RR027426 from the National Center for Research Resources. The content is solely the responsibility of the authors and does not necessarily represent the official views of the national Center for Research Resources or the National Institutes of Health. We thank the Stanford University Pathology Histology core facility, the Pathology Department for microscopy equipment and Rodent Histopathology Core at Harvard Medical School for the histology processing. We thank Daniel Fernandez and the Stanford Macromolecular Structure Knowledge Center at Stanford ChemH for the support with protein production and analysis. The graphical abstract was created with Biorender.com under paid subscription.
Footnotes
Publisher's Disclaimer: This is a PDF file of an unedited manuscript that has been accepted for publication. As a service to our customers we are providing this early version of the manuscript. The manuscript will undergo copyediting, typesetting, and review of the resulting proof before it is published in its final form. Please note that during the production process errors may be discovered which could affect the content, and all legal disclaimers that apply to the journal pertain.
Declaration of Interests
The authors declare no competing interests.
REFERENCES
- Bhatnagar S, Dammron HA, Hillgartner FB, 2009. Fibroblast growth factor-19, a novel factor that inhibits hepatic fatty acid synthesis. J. Biol. Chem 284, 10023–10033. [DOI] [PMC free article] [PubMed] [Google Scholar]
- Chen Y, Zeng X, Huang X, Serag S, Woolf CJ, Spiegelman BM, 2017. Crosstalk between KCNK3-Mediated Ion Current and Adrenergic Signaling Regulates Adipose Thermogenesis and Obesity. Cell 171, 836–848.e13. [DOI] [PMC free article] [PubMed] [Google Scholar]
- Chondronikola M, Volpi E, Børsheim E, Porter C, Annamalai P, Enerbäck S, Lidell ME, Saraf MK, Labbe SM, Hurren NM, Yfanti C, Chao T, Andersen CR, Cesani F, Hawkins H, Sidossis LS, 2014. Brown adipose tissue improves whole-body glucose homeostasis and insulin sensitivity in humans. Diabetes 63, 4089–4099. [DOI] [PMC free article] [PubMed] [Google Scholar]
- Cohen P, Levy JD, Zhang Y, Frontini A, Kolodin DP, Svensson KJ, Lo JC, Zeng X, Ye L, Khandekar MJ, Wu J, Gunawardana SC, Banks AS, Camporez JPG, Jurczak MJ, Kajimura S, Piston DW, Mathis D, Cinti S, Shulman GI, Seale P, Spiegelman BM, 2014. Ablation of PRDM16 and beige adipose causes metabolic dysfunction and a subcutaneous to visceral fat switch. Cell 156, 304–316. [DOI] [PMC free article] [PubMed] [Google Scholar]
- Crimarco A, Springfield S, Petlura C, Streaty T, Cunanan K, Lee J, Fielding-Singh P, Carter MM, Topf MA, Wastyk HC, Sonnenburg ED, Sonnenburg JL, Gardner CD, 2020. A randomized crossover trial on the effect of plant-based compared with animal-based meat on trimethylamine-N-oxide and cardiovascular disease risk factors in generally healthy adults: Study With Appetizing Plantfood-Meat Eating Alternative Trial (SWAP-M. Am. J. Clin. Nutr 112, 1188–1199. [DOI] [PMC free article] [PubMed] [Google Scholar]
- Cypess AM, Lehman S, Williams G, Tal I, Rodman D, Goldfine AB, Kuo FC, Palmer EL, Tseng Y-H, Doria A, Kolodny GM, Kahn CR, 2009. Identification and Importance of Brown Adipose Tissue in Adult Humans. N. Engl. J. Med 360, 1509–1517. [DOI] [PMC free article] [PubMed] [Google Scholar]
- Dallner OS, Chernogubova E, Brolinson KA, Bengtsson T, 2006. B3-Adrenergic Receptors Stimulate Glucose Uptake in Brown Adipocytes By Two Mechanisms Independently of Glucose Transporter 4 Translocation. Endocrinology 147, 5730–5739. [DOI] [PubMed] [Google Scholar]
- Duparc T, Briand F, Trenteseaux C, Merian J, Combes G, Najib S, Sulpice T, Martinez LO, 2019. Liraglutide improves hepatic steatosis and metabolic dysfunctions in a 3-week dietary mouse model of nonalcoholic steatohepatitis. Am. J. Physiol. Gastrointest. Liver Physiol 317, G508–G517. [DOI] [PubMed] [Google Scholar]
- Ebeling P, Koistinen HA, Koivisto VA, 1998. Insulin-independent glucose transport regulates insulin sensitivity. FEBS Lett. 436, 301–303. [DOI] [PubMed] [Google Scholar]
- Fischer-Posovszky P, Newell FS, Wabitsch M, Tornqvist HE, 2008. Human SGBS cells - A unique tool for studies of human fat cell biology. Obes. Facts 1, 184–189. [DOI] [PMC free article] [PubMed] [Google Scholar]
- Fisher FF, Kleiner S, Douris N, Fox EC, Mepani RJ, Verdeguer F, Wu J, Kharitonenkov A, Flier JS, Maratos-Flier E, Spiegelman BM, 2012. FGF21 regulates PGC-1α and browning of white adipose tissues in adaptive thermogenesis. Genes Dev. 26, 271–281. [DOI] [PMC free article] [PubMed] [Google Scholar]
- Foretz M, Pacot C, Dugail I, Lemarchand P, Guichard C, le Lièpvre X, Berthelier-Lubrano C, Spiegelman B, Kim JB, Ferré P, Foufelle F, 1999. ADD1/SREBP-1c Is Required in the Activation of Hepatic Lipogenic Gene Expression by Glucose. Mol. Cell. Biol 19, 3760–3768. [DOI] [PMC free article] [PubMed] [Google Scholar]
- Furtado LM, Somwar R, Sweeney G, Niu W, Klip A, 2002. Activation of the glucose transporter GLUT4 by insulin. Biochem. Cell Biol 80, 569–578. [DOI] [PubMed] [Google Scholar]
- Hilder TL, Baer LA, Fuller PM, Fuller CA, Grindeland RE, Wade CE, Graves LM, 2005. Insulin-independent pathways mediating glucose uptake in hindlimb-suspended skeletal muscle. J. Appl. Physiol 99, 2181–2188. [DOI] [PubMed] [Google Scholar]
- Himms-Hagen J, 1989. Role of thermogenesis in the regulation of energy balance in relation to obesity. Can. J. Physiol. Pharmacol 67, 394–401. [DOI] [PubMed] [Google Scholar]
- Ikeda K, Kang Q, Yoneshiro T, Camporez JP, Maki H, Homma M, Shinoda K, Chen Y, Lu X, Maretich P, Tajima K, Ajuwon KM, Soga T, Kajimura S, 2017. UCP1-independent signaling involving SERCA2bmediated calcium cycling regulates beige fat thermogenesis and systemic glucose homeostasis. Nat. Med 23, 1454–1465. [DOI] [PMC free article] [PubMed] [Google Scholar]
- Jin L, Wang R, Zhu Y, Zheng W, Han Y, Guo F, Ye F. Bin, Li Y, 2015. Selective targeting of nuclear receptor FXR by avermectin analogues with therapeutic effects on nonalcoholic fatty liver disease. Sci. Rep 5, 17288. [DOI] [PMC free article] [PubMed] [Google Scholar]
- Jung Y, Zhao M, Svensson KJ, 2020. Isolation, culture, and functional analysis of hepatocytes from mice with fatty liver disease. STAR Protoc. 1, 100222. [DOI] [PMC free article] [PubMed] [Google Scholar]
- Kahn BB, 1996. Lilly lecture 1995. Glucose transport: pivotal step in insulin action. Diabetes 45, 1644–1654. [DOI] [PubMed] [Google Scholar]
- Kajimura S, Seale P, Kubota K, Lunsford E, Frangioni JV, Gygi SP, Spiegelman BM, 2009. Initiation of myoblast to brown fat switch by a PRDM16-C/EBP-β transcriptional complex. Nature 460, 1154–1158. [DOI] [PMC free article] [PubMed] [Google Scholar]
- Kajimura S, Spiegelman BM, Seale P, 2015. Brown and beige fat: Physiological roles beyond heat generation. Cell Metab. 22, 546–559. [DOI] [PMC free article] [PubMed] [Google Scholar]
- Kazak L, Chouchani ET, Lu GZ, Jedrychowski MP, Bare CJ, Mina AI, Kumari M, Zhang S, Vuckovic I, Laznik-Bogoslavski D, Dzeja P, Banks AS, Rosen ED, Spiegelman BM, 2017. Erratum: Genetic Depletion of Adipocyte Creatine Metabolism Inhibits Diet-Induced Thermogenesis and Drives Obesity (Cell Metabolism (2017) 26(4) (660–671.e3) (S1550413117304941)(10.1016/j.cmet.2017.08.009)). Cell Metab. 26, 693. [DOI] [PMC free article] [PubMed] [Google Scholar]
- Kazak L, Rahbani JF, Samborska B, Lu GZ, Jedrychowski MP, Lajoie M, Zhang S, Ramsay LA, Dou FY, Tenen D, Chouchani ET, Dzeja P, Watson IR, Tsai L, Rosen ED, Spiegelman BM, 2019. Ablation of adipocyte creatine transport impairs thermogenesis and causes diet-induced obesity. Nat. Metab 1, 360–370. [DOI] [PMC free article] [PubMed] [Google Scholar]
- Kersten S, 2001. Mechanisms of nutritional and hormonal regulation of lipogenesis. EMBO Rep. 2, 282–286. [DOI] [PMC free article] [PubMed] [Google Scholar]
- Kim JB, Sarraf P, Wright M, Yao KM, Mueller E, Solanes G, Lowell BB, Spiegelman BM, 1998a. Nutritional and insulin regulation of fatty acid synthetase and leptin gene expression through ADD1/SREBP1. J. Clin. Invest 101, 1–9. [DOI] [PMC free article] [PubMed] [Google Scholar]
- Kim JB, Wright HM, Wright M, Spiegelman BM, 1998b. ADD1/SREBP1 activates PPARγ through the production of endogenous ligand. Proc. Natl. Acad. Sci. U. S. A 95, 4333–4337. [DOI] [PMC free article] [PubMed] [Google Scholar]
- Kir S, Beddow SA, Samuel VT, Miller P, Previs SF, Suino-Powell K, Xu HE, Shulman GI, Kliewer SA, Mangelsdorf DJ, 2011. FGF19 as a postprandial, insulin-independent activator of hepatic protein and glycogen synthesis. Science (80-.). 331, 1621–1624. [DOI] [PMC free article] [PubMed] [Google Scholar]
- Laplante M, Sabatini DM, 2009. An Emerging Role of mTOR in Lipid Biosynthesis. Curr. Biol 19, R1046–52. [DOI] [PMC free article] [PubMed] [Google Scholar]
- Lemmon MA, Schlessinger J, 2010. Cell signaling by receptor tyrosine kinases. Cell 141, 1117–1134. [DOI] [PMC free article] [PubMed] [Google Scholar]
- Long JZ, Svensson KJ, Bateman LA, Lin H, Kamenecka T, Lokurkar IA, Lou J, Rao RR, Chang MRR, Jedrychowski MP, Paulo JA, Gygi SP, Griffin PR, Nomura DK, Spiegelman BM, 2016. The Secreted Enzyme PM20D1 Regulates Lipidated Amino Acid Uncouplers of Mitochondria. Cell 166, 424–435. [DOI] [PMC free article] [PubMed] [Google Scholar]
- Long JZ, Svensson KJ, Tsai L, Zeng X, Roh HC, Kong X, Rao RR, Lou J, Lokurkar I, Baur W, Castellot JJ, Rosen ED, Spiegelman BM, 2014. A smooth muscle-like origin for beige adipocytes. Cell Metab. 19, 810–820. [DOI] [PMC free article] [PubMed] [Google Scholar]
- Luo J, Manning BD, Cantley LC, 2003. Targeting the PI3K-Akt pathway in human cancer: Rationale and promise. Cancer Cell 4, 257–262. [DOI] [PubMed] [Google Scholar]
- Okuda S, Watanabe Y, Moriya Y, Kawano S, Yamamoto T, Matsumoto M, Takami T, Kobayashi D, Araki N, Yoshizawa AC, Tabata T, Sugiyama N, Goto S, Ishihama Y, 2017. jPOSTrepo: an international standard data repository for proteomes. Nucleic Acids Res. 45, D1107–D1111. [DOI] [PMC free article] [PubMed] [Google Scholar]
- Osório L, Wu X, Wang L, Jiang Z, Neideck C, Sheng G, Zhou Z, 2019. ISM1 regulates NODAL signaling and asymmetric organ morphogenesis during development. J. Cell Biol 218,2388–2402. [DOI] [PMC free article] [PubMed] [Google Scholar]
- Osŕrio L, Wu X, Zhou Z, 2014. Distinct spatiotemporal expression of ISM1 during mouse and chick development. Cell Cycle 13, 1571–1582. [DOI] [PMC free article] [PubMed] [Google Scholar]
- Petersen MC, Shulman GI, 2018. Mechanisms of Insulin Action and Insulin Resistance. Physiol. Rev 98, 2133–2223. [DOI] [PMC free article] [PubMed] [Google Scholar]
- Petersen MC, Vatner DF, Shulman GI, 2017. Regulation of hepatic glucose metabolism in health and disease. Nat. Rev. Endocrinol 13, 572–587. [DOI] [PMC free article] [PubMed] [Google Scholar]
- Saito M, Okamatsu-Ogura Y, Matsushita M, Watanabe K, Yoneshiro T, Nio-Kobayashi J, Iwanaga T, Miyagawa M, Kameya T, Nakada K, Kawai Y, Tsujisaki M, 2009. High incidence of metabolically active brown adipose tissue in healthy adult humans: Effects of cold exposure and adiposity. Diabetes 58, 1526–1531. [DOI] [PMC free article] [PubMed] [Google Scholar]
- Saltiel AR, Kahn CR, 2001. Insulin signalling and the regulation of glucose and lipid metabolism. Nature 414, 799–806. [DOI] [PubMed] [Google Scholar]
- Samuel VT, Shulman GI, 2016. The pathogenesis of insulin resistance: Integrating signaling pathways and substrate flux. J. Clin. Invest 126, 12–22. [DOI] [PMC free article] [PubMed] [Google Scholar]
- Sanyal AJ, Campbell-Sargent C, Mirshahi F, Rizzo WB, Contos MJ, Sterling RK, Luketic VA, Shiffman ML, Clore JN, 2001. Nonalcoholic steatohepatitis: association of insulin resistance and mitochondrial abnormalities. Gastroenterology 120, 1183–1192. [DOI] [PubMed] [Google Scholar]
- Stanford KI, Middelbeek RJW, Townsend KL, An D, Nygaard EB, Hitchcox KM, Markan KR, Nakano K, Hirshman MF, Tseng YH, Goodyear LJ, 2013. Brown adipose tissue regulates glucose homeostasis and insulin sensitivity. J. Clin. Invest 123, 215–223. [DOI] [PMC free article] [PubMed] [Google Scholar]
- Suh JM, Jonker JW, Ahmadian M, Goetz R, Lackey D, Osborn O, Huang Z, Liu W, Yoshihara E, Van Dijk TH, Havinga R, Fan W, Yin YQ, Yu RT, Liddle C, Atkins AR, Olefsky JM, Mohammadi M, Downes M, Evans RM, 2014. Endocrinization of FGF1 produces a neomorphic and potent insulin sensitizer. Nature 513, 436–439. [DOI] [PMC free article] [PubMed] [Google Scholar]
- Svensson KJ, Long JZ, Jedrychowski MP, Cohen P, Lo JC, Serag S, Kir S, Shinoda K, Tartaglia JA, Rao RR, Chédotal A, Kajimura S, Gygi SP, Spiegelman BM, 2016. A secreted slit2 fragment regulates adipose tissue thermogenesis and metabolic function. Cell Metab. 23, 454–466. [DOI] [PMC free article] [PubMed] [Google Scholar]
- Tsuchiya A, Kanno T, Nishizaki T, 2014. PI3 kinase directly phosphorylates Akt1/2 at Ser473/474 in the insulin signal transduction pathway. J. Endocrinol 220, 49–59. [DOI] [PMC free article] [PubMed] [Google Scholar]
- Tzatsos A, 2009. Raptor binds the SAIN (She and IRS-1 NPXY binding) domain of insulin receptor substrate-1 (IRS-1) and regulates thephosphorylation of IRS-1 at Ser-636/639 by mTOR. J. Biol. Chem 284, 22525–22534. [DOI] [PMC free article] [PubMed] [Google Scholar]
- Valle-Rios R, Maravillas-Montero JL, Burkhardt AM, Martinez C, Buhren BA, Homey B, Gerber PA, Robinson O, Hevezi P, Zlotnik A, 2014. Isthmin 1 is a secreted protein expressed in skin, mucosal tissues, and NK, NKT, and Th17 cells. J. Interf. Cytokine Res 34, 795–801. [DOI] [PMC free article] [PubMed] [Google Scholar]
- van Marken Lichtenbelt WD, Vanhommerig JW, Smulders NM, Drossaerts JMAFL, Kemerink GJ, Bouvy ND, Schrauwen P, Teule GJJ, 2009. Cold-Activated Brown Adipose Tissue in Healthy Men. N. Engl. J. Med 360, 1500–1508. [DOI] [PubMed] [Google Scholar]
- Venugopal S, Chen M, Liao W, Er SY, Wong WSF, Ge R, 2015. Isthmin is a novel vascular permeability inducer that functions through cell-surface GRP78-mediated Src activation. Cardiovasc. Res 107, 131–142. [DOI] [PubMed] [Google Scholar]
- Vila G, Riedl M, Anderwald C, Resl M, Handisurya A, Clodi M, Prager G, Ludvik B, Krebs M, Luger A, 2011. The relationship between insulin resistance and the cardiovascular biomarker growth differentiation factor-15 in obese patients. Clin. Chem 57, 309–316. [DOI] [PubMed] [Google Scholar]
- Virtanen KA, Lidell ME, Orava J, Heglind M, Westergren R, Niemi T, Taittonen M, Laine J, Savisto N-J, Enerbäck S, Nuutila P, 2009. Functional Brown Adipose Tissue in Healthy Adults. N. Engl. J. Med 360, 1518–1525. [DOI] [PubMed] [Google Scholar]
- Wabitsch M, Brenner RE, Melzner I, Braun M, Möller P, Heinze E, Debatin KM, Hauner H, 2001. Characterization of a human preadipocyte cell strain with high capacity for adipose differentiation. Int. J. Obes 25, 8–15. [DOI] [PubMed] [Google Scholar]
- Wang A, Yan X, Zhang C, Du C, Long W, Zhan D, Luo X, 2018. Characterization of fibroblast growth factor 1 in obese children and adolescents. Endocr. Connect 7, 932–940. [DOI] [PMC free article] [PubMed] [Google Scholar]
- Wang GX, Zhao XY, Meng ZX, Kern M, Dietrich A, Chen Z, Cozacov Z, Zhou D, Okunade AL, Su X, Li S, Blüher M, Lin JD, 2014. The brown fat-enriched secreted factor Nrg4 preserves metabolic homeostasis through attenuation of hepatic lipogenesis. Nat. Med 20, 1436–1443. [DOI] [PMC free article] [PubMed] [Google Scholar]
- Wang L, Rhodes CJ, Lawrence JC, 2006. Activation of mammalian target of rapamycin (mTOR) by insulin is associated with stimulation of 4EBP1 binding to dimeric mTOR complex 1. J. Biol. Chem 281, 24293–24303. [DOI] [PubMed] [Google Scholar]
- You D, Nilsson E, Tenen DE, Lyubetskaya A, Lo JC, Jiang R, Deng J, Dawes BA, Vaag A, Ling C, Rosen ED, Kang S, 2017. Dnmt3a is an epigenetic mediator of adipose insulin resistance. Elife 6. [DOI] [PMC free article] [PubMed] [Google Scholar]
- Zhang X, Yeung DCY, Karpisek M, Stejskal D, Zhou Z-G, Liu F, Wong RLC, Chow W-S, Tso AWK, Lam KSL, Xu A, 2008. Serum FGF21 Levels Are Increased in Obesity and Are Independently Associated With the Metabolic Syndrome in Humans. Diabetes 57, 1246–1253. [DOI] [PubMed] [Google Scholar]
- Zhang Y, Chen M, Venugopa SL, Zhou Y, Xiang W, Li YH, Lin Q, Kini RM, Chong YS, Ge R, 2011. Isthmin exerts pro-survival and death-promoting effect on endothelial cells through alphavbeta5 integrin depending on its physical state. Cell Death Dis. 2, e153. [DOI] [PMC free article] [PubMed] [Google Scholar]
- Zhao M, Jung Y, Jiang Z, Svensson KJ, 2020. Regulation of Energy Metabolism by Receptor Tyrosine Kinase Ligands. Front. Physiol [DOI] [PMC free article] [PubMed] [Google Scholar]
Associated Data
This section collects any data citations, data availability statements, or supplementary materials included in this article.
Supplementary Materials
Supplemental Figures 1-7.
Table S1, related to Figure 1. RNA expression of mature adipocytes.
Table S2, related to Figure 1. Glycan analysis of recombinant Ism1-his protein.
Table S3, related to Figure 1. LC-MS analysis of recombinant Ism1-his protein.
Data Availability Statement
The mass spectrometry proteomics source data have been deposited at ProteomeXchange Consortium via the JPost partner repository and are publicly available under the accession number PXD026921(Okuda et al., 2017).
This paper does not generate original code.
Any additional information required to reanalyze the data reported in this paper is available from the lead contact upon request.