

Abstract
Background:
Socioeconomic data may improve predictions of clinical events. However, due to structural racism, algorithms may not perform equitably across racial subgroups. Therefore, we sought to compare the predictive performance overall, and by racial subgroup, of commonly used predictor variables for heart failure readmission with and without the Area Deprivation Index (ADI), a neighborhood-level socioeconomic measure.
Methods:
We conducted a retrospective cohort study of 1,316 Philadelphia residents discharged with a primary diagnosis of congestive heart failure from the University of Pennsylvania Health System between April 1, 2015 and March 31, 2017. We trained a regression model to predict the probability of a 30-day readmission using clinical and demographic variables. A second model also included the ADI as a predictor variable. We measured predictive performance with the Brier Score (BS) in a held-out test set.
Results:
The baseline model had moderate performance overall (BS 0.13, 95% CI 0.13 to 0.14), and among white (BS 0.12, 95% CI 0.12 to 0.13) and non-white (BS 0.13, 95% CI 0.13 to 0.14) patients. Neither performance nor algorithmic equity were significantly changed with the addition of the ADI.
Conclusions:
The inclusion of neighborhood-level data may not reliably improve performance or algorithmic equity.
Keywords: Algorithmic equity, congestive heart failure, hospital readmission
Introduction
Social determinants of health (SDoH) are a major contributor to health care processes and outcomes.1 This is especially true for patients with congestive heart failure (CHF), whose clinical course is determined by a complex interplay between physiologic and social parameters.2–5 Recognizing this interdependence, the American Heart Association has recently recommended a more thorough approach to assessment and management of SDoH.6 This directive may represent an opportunity to improve the development of risk prediction models that account for SDoH to guide clinical care.7 Although detailed patient-level data on SDoH might provide the most information, such data as education, employment, income, and other factors may not be readily available to health systems. But neighborhood-level data based solely on an individual’s address such as the Area Deprivation Index (ADI), for example, a composite measure of social, economic, and educational indicators derived from the American Community Survey, has been associated with increased 30-day readmissions across a range of clinical and geographic contexts.8–10
However, prediction models have been shown to exhibit disparate performance across demographic groups. For example, commonly used scores to predict the future risk of cardiovascular disease have varying performance by patient race.11–13 These performance differences are likely explained by inadequate capture of indicators of both interpersonal and structural racism in the data generation and collection processes. Measuring only the population average performance may mask a scenario in which a model may perform well for one group but not for another. This consideration of inequalities in prediction model performance is known as algorithmic equity or algorithmic fairness, and reflects the goal of equal predictive performance across patient subgroups.14,15 In Philadelphia, a city with a long history of segregation, institutionalized racism, and notable health disparities in a large Black population, it is unknown how the addition of the ADI would affect the predictive performance or algorithmic equity of a clinical prediction model.
Therefore, we sought to determine how the addition of ADI to a heart failure readmission prediction model might affect predictive performance within an urban academic medical center in Philadelphia. Secondarily, we sought to measure algorithmic equity – the difference in performance across racial groups – and to understand how that difference was affected by the inclusion of the ADI. We hypothesized that the inclusion of the ADI, by capturing SDoH not typically available in the EHR, would improve both predictive performance and algorithmic equity.
Methods
We conducted a retrospective cohort study of patients hospitalized with CHF. We trained and tested several clinical prediction models to evaluate their performance overall and by race. These comparisons were made using a model trained on commonly available data in the EHR and another that also included neighborhood-level socioeconomic data in the ADI (Figure 1).
Figure 1:
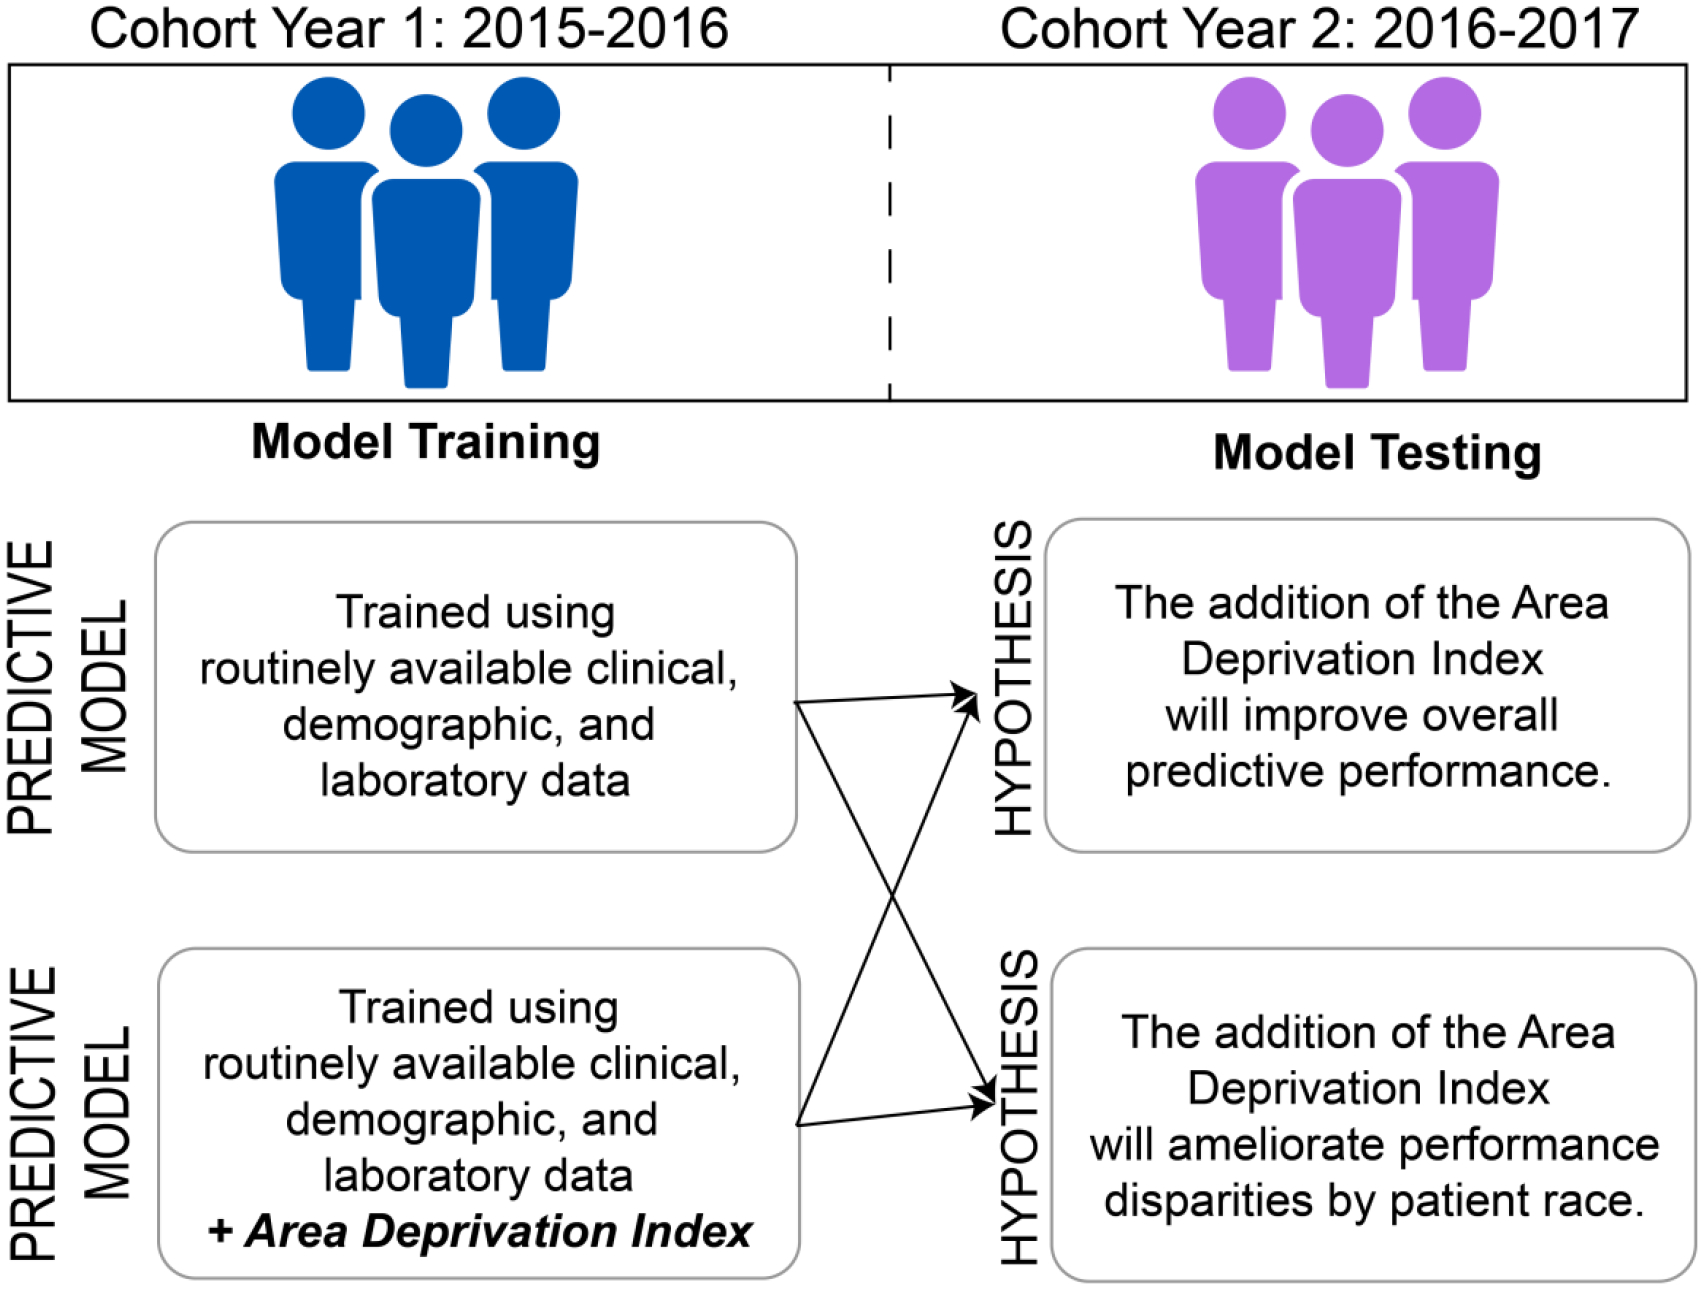
Overview of the study design and methods.
Population
We identified all hospital discharges with a primary diagnosis of CHF among Philadelphia residents at least 18 years old from hospitals in the University of Pennsylvania Health System between April 1, 2015 and March 31, 2017. Diagnostic codes used to determine inclusion in the study have been used in prior studies identifying cohorts of patients with CHF and are found in Supplemental Table 1.16
Baseline predictor variables
We included clinical variables available from the first 24 hours of the first hospitalization for each patient during the study period to emulate a scenario in which a hospital might use a prediction model to make referrals for additional clinical or social support resources. This approach to modeling heart failure readmissions parallels that of Tabak et al.17 Input variables included the worst value of serum creatinine, serum albumin, troponin, international normalized ratio (INR), total bilirubin, creatine phosphokinase (CPK), serum sodium, serum blood urea nitrogen (BUN), arterial partial pressure of carbon dioxide (PaCO2), white blood cell count, serum glucose, pro-brain natrurietic peptide, temperature, and systolic blood pressure. We excluded the diastolic blood pressure and pH from the prediction models because they were nearly perfectly collinear with the systolic blood pressure and PaCO2, respectively.
Following reported improvements to predictive performance with the inclusion of additional utilization and laboratory studies proposed by Amarasingham et al.16, we also included the number of hospitalizations, visits to the emergency room, outpatient clinic visits, any positive drug screens for THC or cocaine, and any encounters that included a diagnostic code for depression (Supplemental Table 2) in the preceding six months.18,19 We also included an indicator variable for the presence of any Medicaid plan associated with the patient’s record during the hospitalization.
We also included each patient’s age, gender, self-reported race, and self-reported ethnicity. This approach is consonant with previously published prediction models that seek to improve risk prediction through capture of risk differences associated with race regardless of the underlying causal relationships.16,20 Because the vast majority of patients self-identified as either Black or white, and the experience of racism most preferentially advantages those who identify as white, we modeled race as a binary variable (white or not white) in the primary analysis.
Neighborhood-level data
The ADI has been strongly associated with 30-day readmission risk8 and improved risk adjustment for penalties in the Hospital Readmissions Reduction Program (HRRP)21 in a nationally representative Medicare population. The ADI is also associated with 30-day all-cause9 and sepsis-specific10 readmission risk in some urban medical centers. However, statistically significant associations in an inferential model are not equivalent to performance improvements in a predictive model.22,23
Therefore, we hypothesized that the addition of the ADI to the above baseline variables would improve predictive performance in a 30-day hospital readmission model. Because the ADI captures many social, economic, and educational indicators not found in typical clinical and administrative databases, we also hypothesized that its inclusion would improve algorithmic equity between white and non-white patients. Specifically, the ADI includes data on the census-block level age distribution, employment, income, housing, poverty, and vehicle ownership, among other factors.8 Therefore, a second model was built that also included the census-block level state ranking of the ADI based on each patient’s home address. The ADI state rank ranges from 1 to 10, representing the lowest and highest levels of disadvantage, respectively.
Outcome
The primary outcome for all models was a binary variable indicating readmission to any hospital within the University of Pennsylvania Health System within 30 days of discharge from the index hospitalization.
Missing data
Missing predictor variables were imputed using the missForest package using 500 trees.24,25 We chose this approach because of its ability to handle both continuous and categorical predictors that may have non-linear or complex interactions and are recorded on different scales. Imputation was performed separately in the training and testing sets.
Model training, selection, and assessment
All models were trained using hospital discharges that occurred during the first year of the cohort, between April 1, 2015 and March 31, 2016. First, using the baseline predictor variables, we fit a logistic regression model with L1 and L2 penalties (elastic net; EN) and determined parameters for mixing and regularization using 5-times repeated, 10-fold cross-validation and a tuning-grid search (Supplemental Table 3).26 Then we fit an additional EN model that used the same baseline predictors and also included the ADI. All predictor variables were included as linear terms. Tuning parameters that provided the lowest Brier Score (BS) were selected for the final models which were refit on all of the training data.27 The BS is equivalent to the mean-squared error between a model’s predicted probability and the observed binary outcome of zero or one.28 Using a temporal external validation approach to assess the generalizability of the models using data from the same sites,29 all model performance characteristics were reported using a held-out test set comprised of hospital discharges that occurred during the second year of the cohort, between April 1, 2016 and March 31, 2017. No patients appeared in both training and testing cohorts. We assessed the BS as a composite measure of discrimination and calibration for the primary outcome and the C-statistic and positive predictive value as secondary outcomes.
Performance comparisons
We calculated 95% confidence intervals around model performance metrics by bootstrapping the training data and entire model training process, including a grid search with 5-times-repeated 10-fold cross-validation, using 100 bootstrap replicates. We compared performance between models by estimating the bootstrap p-value and confidence interval around the performance difference between replicates.30,31
Algorithmic equity
Algorithmic equity, sometimes described as algorithmic fairness, reflects how well a predictive model performs across different groups of interest. For example, if a model had perfect algorithmic equity, it would perform just as well for both Black and white patients, and exhibit the same error pattern across both groups. Clinical prediction models that do not exhibit algorithmic equity may lead to racial differences in referral patterns and/or prognosis, potentially exacerbating existing healthcare inequities.32,33
We chose to focus on three measures of algorithmic equity that are both easily measurable and have clear policy remedies.34–36 We examined error due to statistical bias, error due to variance, and classification parity. Detailed descriptions of these measures are found in the Supplemental Methods.
Sensitivity analysis
We conducted several sensitivity analyses to better understand the implications of our analytic approach. First, we fit a gradient boosting machine (GBM) model using the same approach as the EN model to understand how model specification might affect performance and algorithmic equity (Supplemental Table 4).37 Second, given prior evidence that suboptimal representation in data collection can lead to suboptimal model performance,38 we repeated the original EN model but reweighted each observation to reflect the actual local population demographics by race at the census block level. Third, we completely removed race as a predictor variable, a strategy known as anti-classification, and then refit the EN and GBM models while still including the ADI.
Feature importance
We used model-specific approaches to identify feature importance. Using the built-in variable importance method in the caret package for the R statistical programming language, importance was measured in the EN model using the absolute value of the coefficients for each variable using normalized values. For the GBM model, we calculated the reduction in loss at each split in each tree attributable to each variable. This is then summed over each boosting iteration. Additionally, we measured correlations across input variables using Pearson’s to determine their relative independence.
Results
We analyzed data from 786 patients in the training set and 531 patients in the testing set, of whom 134 (17%) and 84 (16%) were readmitted within 30 days of discharge, respectively (Table 1). In total, 340 (26%) of the patients identified as white and 977 (74%) as non-white, of whom 923 (94%) identified as Black or African-American. Both the EN (BS 0.13, 95% CI 0.13 to 0.14) and GBM (BS 0.13, 95% CI 0.11 to 0.16) models had only moderate overall performance. Neither the EN nor the GBM model exhibited any difference in overall performance with the addition of the ADI (Figure 2). The performance of the EN (BS difference <0.001, bootstrap P = 0.79) and GBM (BS difference <0.001, bootstrap P = 0.72) models were unchanged with the addition of the ADI (Supplemental Table 5). A similar pattern was observed when model performance was measured with the C-statistic (Supplemental Table 6).
Table 1:
Characteristics of the study cohort in aggregate, and separately in the training and testing samples.
| Variable (n, %) | Total | Train (Year 1) | Test (Year 2) |
|---|---|---|---|
| Patients | 1317 | 786 | 531 |
| White | 340 (26) | 189 (24) | 151 (28) |
| Age, median years (IQR) | 68.7 (58 to 79.8) | 68.4 (58.1 to 79.7) | 69.2 (57.7 to 80.1) |
| Female | 709 (54) | 419 (53) | 290 (55) |
| Hispanic | 30 (2.3) | 15 (1.9) | 15 (2.8) |
| Depression | 111 (8.4) | 73 (9.3) | 38 (7.2) |
| THC | 13 (0.1) | 11 (1.4) | 2 (0.4) |
| Cocaine | 14 (1.1) | 11 (1.4) | 3 (0.6) |
| Medicaid | 249 (19) | 147 (19) | 102 (19) |
| Outpatient Visits, median (IQR) | 3 (0 to 10) | 3 (0 to 10.75) | 3 (0 to 10) |
| Emergency Department Visits, median (IQR) | 0 (0 to 1) | 0 (0 to 1) | 0 (0 to 1) |
| Hospitalizations, median (IQR) | 0 (0 to 1) | 0 (0 to 1) | 0 (0 to 1) |
| Systolic blood pressure (mmHg) | 117 (104 to 129) | 117 (103 to 130) | 117 (105 to 127) |
| Temperature (F) | 98.4 (98.1 to 98.7) | 98.4 (98.1 to 98.7) | 98.4569 (98.2 to 98.7) |
| Pro-BNP, median (IQR) | 4971 (2320 to 9416) | 5216 (2328 to 9317) | 4819 (2306 to 9814) |
| Glucose (mg/dL) | 98 (87 to 120) | 98 (86 to 120) | 99 (88 to 119.5) |
| White blood cell count (x103/μL) | 7.9 (6.0 to 10.0) | 7.7 (6.0 to 9.8) | 8.0 (6.3 to 10.0) |
| pCO2 (mmHg) | 47.8 (44.4 to 52.9) | 45.4 (43.1 to 48.3) | 52.8 (49.0 to 55.0) |
| Blood urea nitrogen (mg/dL; BUN), median (IQR) | 23 (17 to 35) | 23 (17 to 34) | 24 (17 to 35) |
| Sodium (mEq/L) | 138 (135 to 140) | 137 (135 to 139) | 138 (135 to 140) |
| Creatine phosphokinase (units/L; CPK), median (IQR) | 224 (155 to 380) | 217 (152 to 327) | 234 (160 to 464) |
| Total bilirubin (mg/dL) | 0.9 (0.7 to 1.1) | 0.8 (0.6 to 1.0) | 0.9 (0.7 to 1.2) |
| International normalized ratio (INR) | 1.4 (1.2 to 1.7) | 1.3 (1.2 to 1.7) | 1.4 (1.2 to 1.9) |
| Troponin (ng/mL) | 0.03 (0.01 to 0.08) | 0.03 (0.01 to 0.09) | 0.03 (0.01 to 0.07) |
| Albumin (g/dL) | 3.5 (3.4 to 3.7) | 3.5 (3.4 to 3.7) | 3.6 (3.3 to 3.7) |
| Creatinine (mg/dL) | 1.29 (1 to 1.8) | 1.31 (1.01 to 1.8375) | 1.24 (1 to 1.77) |
| ADI State Rank | 8 (5 to 10) | 9 (5 to 10) | 8 (5 to 10) |
| 30-day hospital readmissions | 218 (17) | 134 (17) | 84 (16) |
Abbreviations: IQR = Interquartile range.
Figure 2:
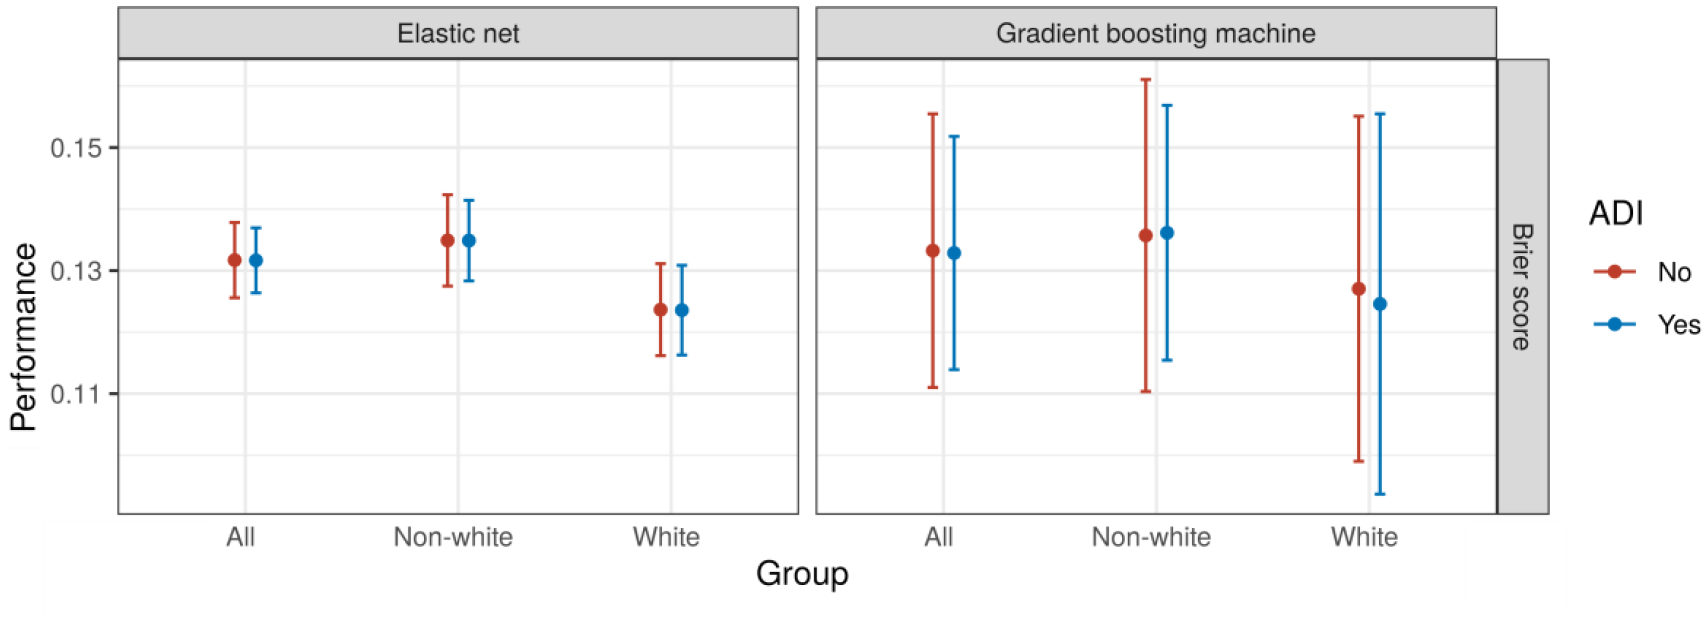
Model performance in aggregate and by race for each model type. Abbreviations: BS = Brier score.
Rates of missingness of predictors varied widely (Supplemental Table 7). Additionally, testing rates varied by race for some variables. For example, a total of 198 patients in the entire dataset received a drug test during the study period, representing testing rates of 9% (31/340) and 17% (167/977) among white and non-white patients, respectively.
Algorithmic equity
Performance among white patients was better than among non-white patients (BS difference −0.011, 95% CI −0.021 to −0.002) using the EN model, and equivalent (BS difference −0.009, 95% CI −0.039 to 0.022) using the GBM model. The performance difference between white and non-white patients was unchanged with the addition of the ADI (Figure 2).
Among modeling approaches and performance measures, only the EN model performance showed very small improvements with increases in the number of predictor variables (Figure 3). When increasing the size of the training data, small improvements in performance were observed up until a sample size of 300 with relatively stable performance beyond that (Figure 4).
Figure 3:
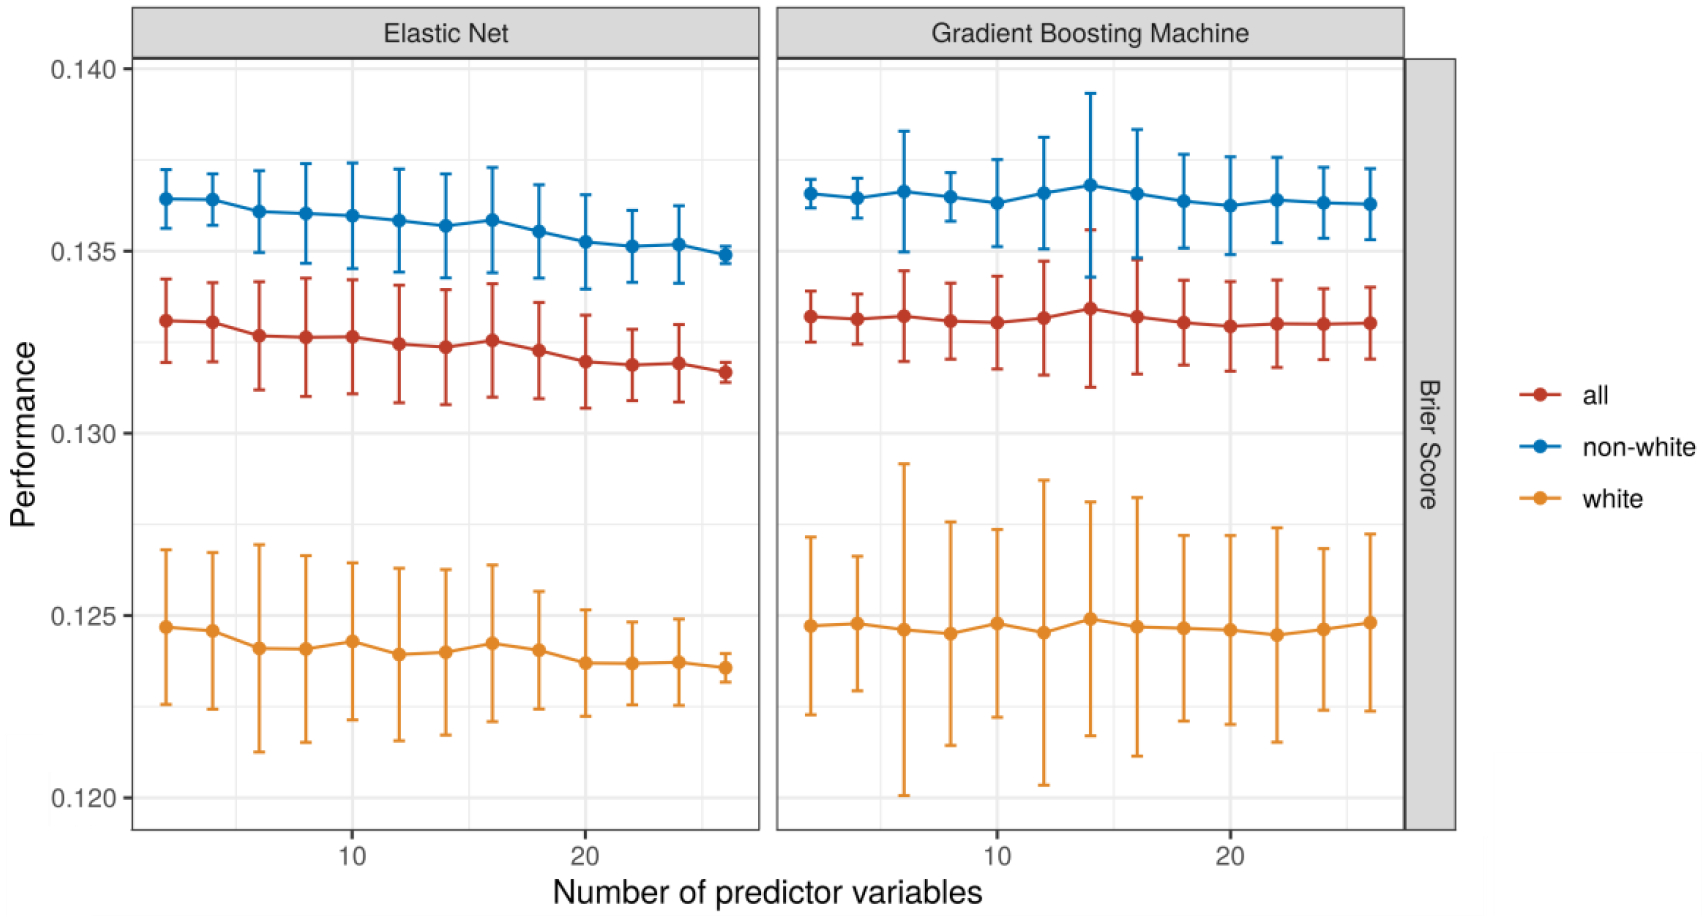
Model performance with an increasing number of input variables. Each model was trained 50 times with each number of variables. A different set of variables was randomly drawn for each iteration within the same number of variables.
Figure 4:
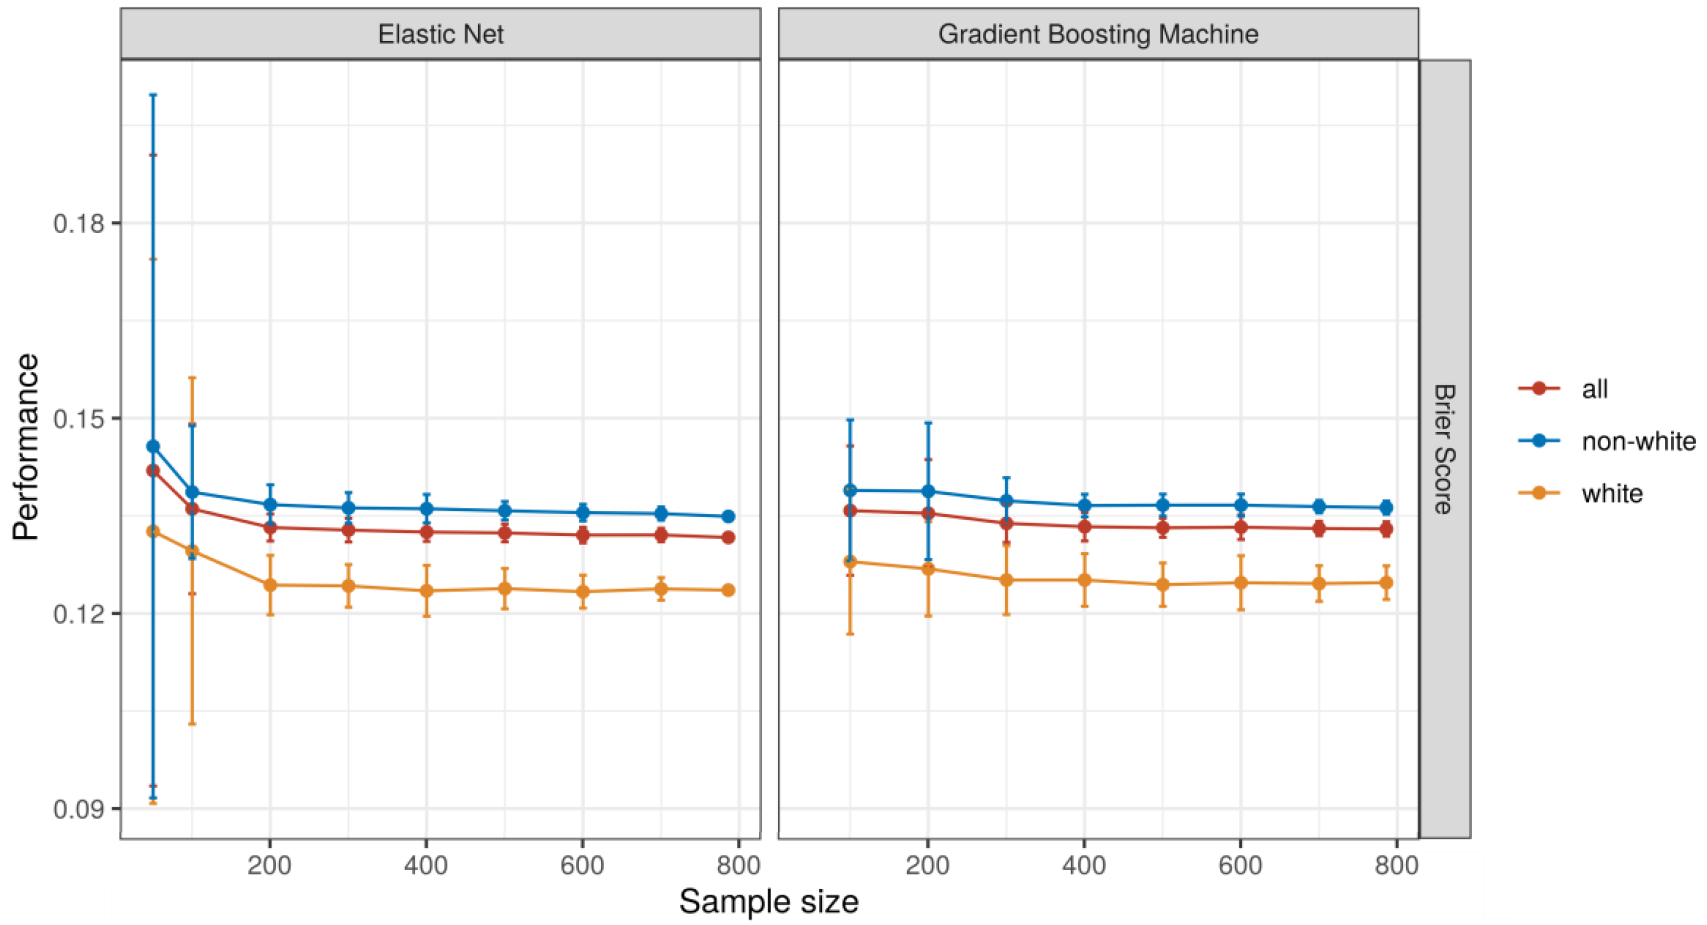
Model performance with an increasing the number of observations. Each model was trained 50 times with each number of observations.
At low classification thresholds we observed large and divergent classification parity by race using predictions from the EN model (Figure 5). Differences in classification parity for the GBM were present and comparatively smaller.
Figure 5:
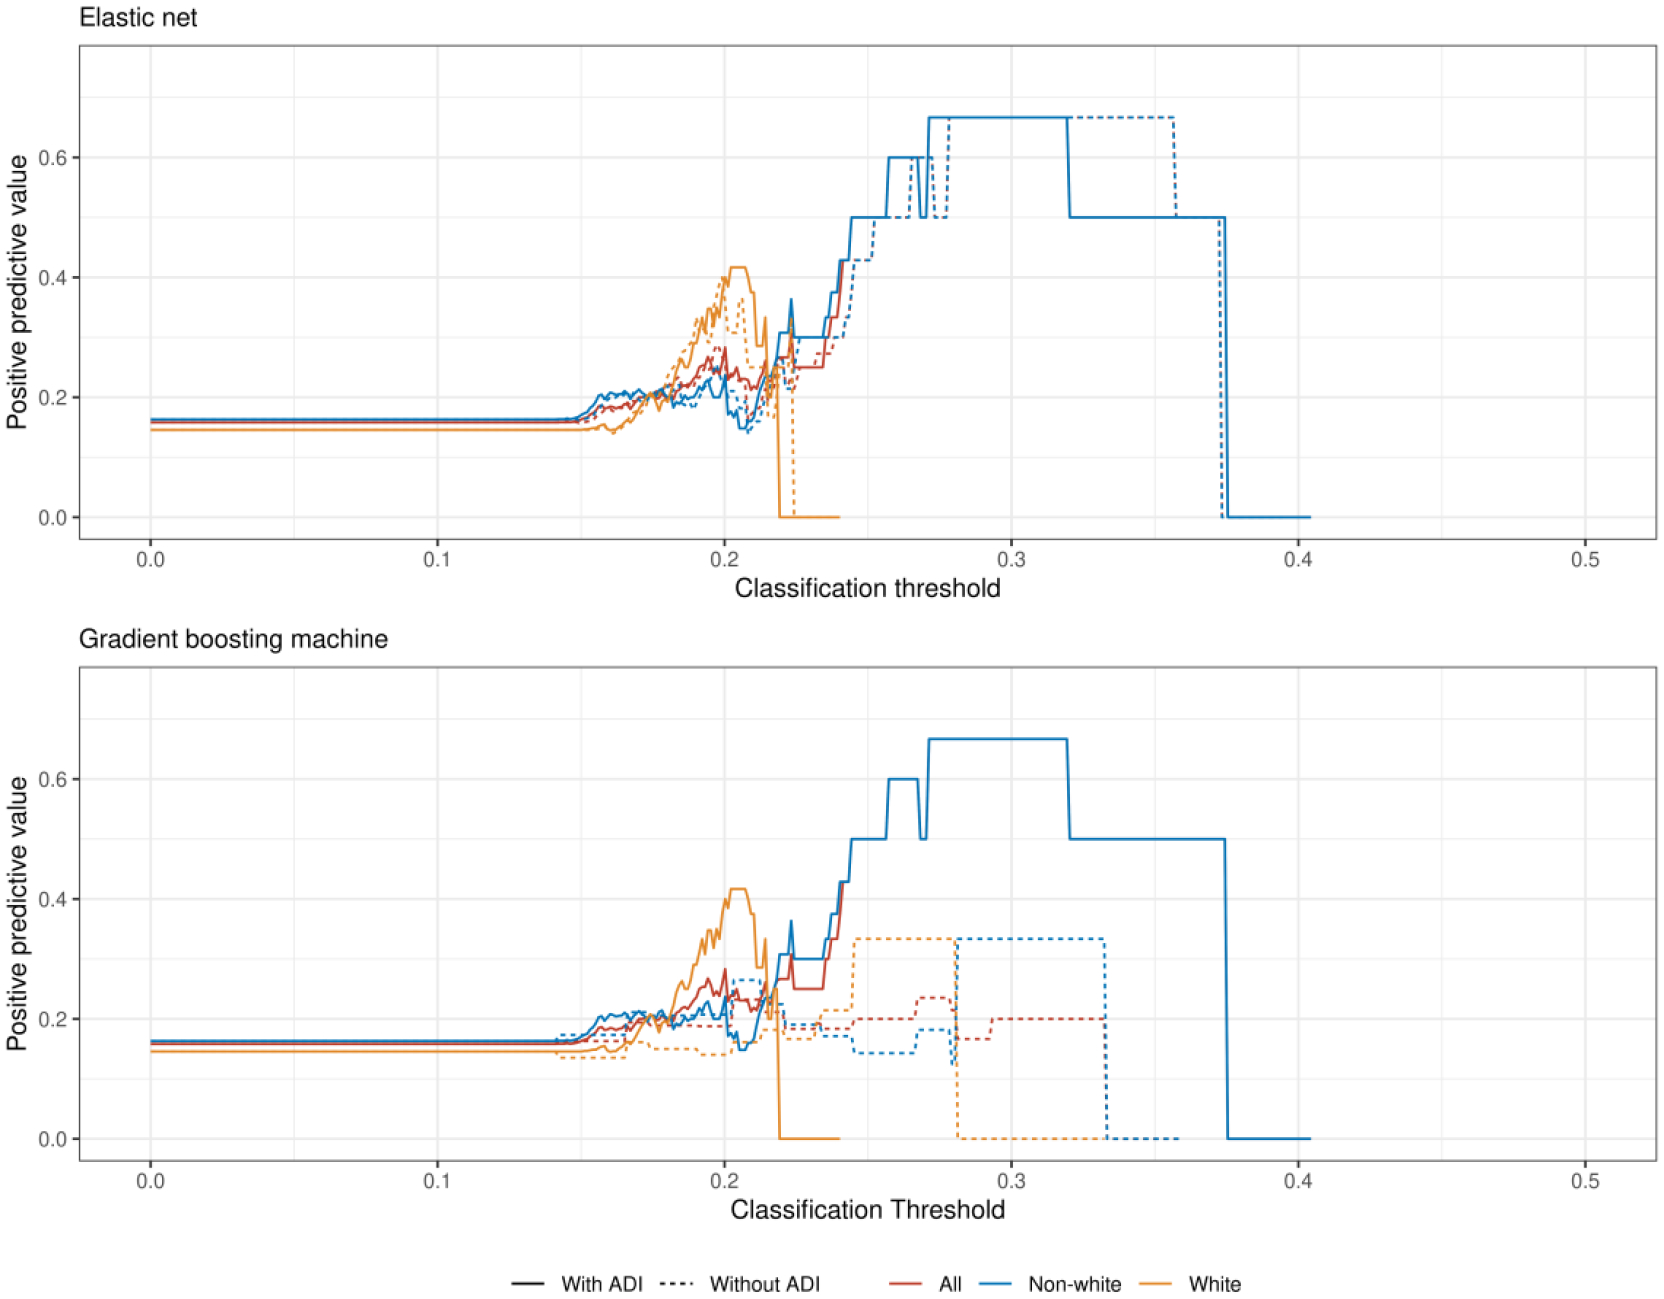
The positive predictive value for the elastic net (top) and gradient boosting machine (bottom) models varies by race across different predictive thresholds. The absence of an estimate at a particular threshold indicates there were no predictions for that group above that threshold and thus the positive predictive value could not be calculated. Abbreviations: ADI = Area Deprivation Index.
Sensitivity analyses
After reweighting the EN model to account for the demographic distribution of race according to US Census data, the model performance did not change (Supplemental Figure 6). When removing race entirely from model training, neither performance nor algorithmic equity were meaningfully changed (Supplemental Table 8).
Feature importance
A urine drug screen positive for cocaine use was the most predictive feature in the EN models while neither race nor ADI were among the ten most predictive variables for any model (Supplemental Figure 7). Across all available data, white race was strongly correlated with a better ADI (r = 0.49, 95% CI 0.45 to 0.53; Supplemental Figure 8).
Discussion
We found that using commonly available EHR data to predict 30-day readmissions for patients with heart failure at an urban, academic medical center did not exhibit improved performance with the addition of neighborhood-level data using the ADI. At the same time, predictive performance was equivalent in models using the ADI instead of race. Further, no improvements were observed by any measure in algorithmic equity by race after adding ADI to the models. Predictive performance for patients who identified as non-white was slightly worse than for those who identified as white, even though there were fewer observations of white patients in the dataset. These findings have several potential interpretations with implications for researchers, data scientists, and policymakers.39
First, the paradoxically worse performance, albeit by a small margin, for non-white patients despite more observations is likely explained by structural properties of the data generating process. For example, our sample was limited to hospitalizations and readmissions that occurred within UPHS. Based on CMS claims data, UPHS maintains a publicly reported 30-day CHF readmission rate around 22%, which is consistent with the national average, though much higher than the rate captured in this study using EHR data alone and that includes patients with all insurance types.40 Additionally, different-hospital readmissions following discharge for CHF are common.41 And Black and other racial minority patients are more likely to experience fragmented care, and so it is possible that our input variables and labels were biased in undercounting readmissions and identifying other relevant risk factors among non-white patients receiving care in other health systems. This limitation in the data is consonant with prior research identifying recapitulation of bias through biased training labels.33 Neither of these types of missingness, in the predictor or outcome variables, could be known without data from outside of the health system. Additionally, the types of data sources available in the EHR and in the US Census data are not accidental, and reflect historical political, operational, and technical choices made by mostly white decision makers. For example, the importance of the positive urine drug screen variable in this analysis may also reflect biased choices by clinicians to preferentially test Black patients42 and thus may be correlated with biased patterns of care. Such biased practices would both reinforce racial disparities and introduce noise into prediction models.
Second, the lack of improvement in model performance or performance inequity associated with the addition of the ADI to prediction models may be explained by the high correlation between ADI and race in a city like Philadelphia. Alternatively, neither variable may carry much predictive information relative to the others in this scenario. Although the ADI has improved performance in other statistical models in both national and regional datasets, local segregation in Philadelphia,43 a consequence of historically racist housing policies, may differ from patterns in other regions. In urban areas, for example, individual- and neighborhood-level measures of socioeconomic status are more correlated compared to more rural regions.44 Thus, new data sources that better capture experiences relevant to readmission risk among Black and other non-white patients — experiences likely associated with both individual and structural influences of racism45 — are needed to achieve algorithmic equity. This point is further underscored by the fact that the GBM model, better able to capture potential complex interactions between input variables, consistently performed worse than the EN model. Thus, better data sources and not more complex models that are more likely to overfit are needed.
Third, interrogations of algorithmic equity must include assessments over a full range of classification thresholds when using performance metrics like the positive predictive value. While thresholds are typically chosen based on operational concerns such as tolerability of a given alert burden,46,47 these findings suggest that algorithmic equity also varies across thresholds. For the models presented here, for example, choosing a threshold that yields lower sensitivity and higher specificity — which would be appropriate for a costly care management intervention that was intended to be deployed to patients only with high probability of 30-day readmission — would produce a relatively high false positive error rate among non-white patients, potentially leading to misallocation of resources.
Finally, to detect algorithmic inequity and take action to correct it, every hospital should audit its own algorithms prior to deployment. This audit step would provide an opportunity to adjust or collect different data if disparities in performance are identified. These considerations should even precede any steps routinely considered a part of development of clinical prediction models as the result of an audit may lead to the conclusion that a model should not be developed or deployed in the first place if equity cannot be ensured. This audit step is critical because history, policy, and structural racism influence the data generating process in ways that may reinforce existing disparities. Although the ADI may capture some of these features on average, local differences may emerge, especially in severely segregated populations where race and geography are so highly correlated. In situations where an anti-classification approach has been taken, including ADI may allow for a “back door” in highly segregated populations where race is a primary driver of geographic variation in the components of ADI. Thus, soley removing race from prediction models is not a guarantee of algorithmic equity. This is corroborated by existing research that demonstrates how such approaches can fail to improve predictive performance equity. This is especially important to consider when prediction models are used for risk-adjustment purposes to guide the deployment of scarce resources,48 further highlighting the need for robust algorithmic audits and early stakeholder involvement to ensure analytic approaches align with local values for fairness and transparency. Therefore, researchers, data scientists, and hospital operations experts who build clinical prediction models to serve racially diverse populations need to consider these historical and structural factors that might influence data generation, model development, and ultimately clinical care.
These findings should be interpreted in light of several limitations. First, our sample size was relatively small compared to the number of predictor variables in the prediction models and it is possible that our models were underfit. However, these sample sizes are typical of a large, urban academic medical center and reflect the reality of hospital systems that seek to train their own hospital readmission models. Additionally, we noticed negligible increases in performance when bootstrapping larger sample sizes beyond 200 to 300 observations, suggesting the sample size was probably sufficient for the specified models. Second, we did not explore other approaches to account for performance equality such as those that reflect social welfare or the causal impact of an algorithm’s predictions.49 While there is not yet a strong consensus on the optimal metrics for this assessment, other strategies may be preferred in different clinical and operational contexts. Third, this analysis explored only the in silico performance of a predictive algorithm and was not able to account for how human decision makers may interact with predictive information, another important step in the use of predictive algorithms that may reinforce inequities in clinical care.50 Fourth, racial categories in the EHR are subject to inaccuracies51 and our approach did not account for potential interactions with designations of patient ethnicity. Fifth, we did not distinguish between heart failure with or without preserved ejection fraction,52 or consider other data sources such as the text of clinical notes, prescribed medications, presence of implantable devices, or echocardiography.53,54 Sixth, our dataset may reflect selection bias in which patients in Philadelphia come to UPHS for their care, and thus may not generalize to safety-net hospitals that often see a larger proportion of non-white and uninsured patients. Finally, our study findings may not generalize to communities without histories of segregation in which race and ADI may not be correlated.
In summary, data generating processes used to train clinical prediction models are influenced by historically oppressive and racist systems. Therefore, models that are fit on such data and deployed in practice may inadvertently recapitulate and reinforce historically unjust care practices. A first step to avoid replicating such harm is to interrogate all clinical prediction models to ensure algorithmic equity. A second, and perhaps more important step, is to engage local stakeholders in the framing of the research or operational question. This would improve understanding of the data generating and collection processes before model training even begins to ensure models are not introducing various forms of selection or ascertainment bias founded in historically oppressive institutions. In some cases, new data collection procedures and even new data sources may be needed to adequately account for patient risk due to the experiences of structural racism and other forms of oppression. This process is unlikely to occur without necessary input from Black and other non-white patients, community members, researchers, and hospital operations leaders. Research teams, data scientists, and hospital operations groups should routinely interrogate their own models for performance equality and ensure adequate representation for and accountability to groups that may be disparately represented and impacted.
Supplementary Material
Highlights.
Neighborhood-level data did not improve performance of heart failure readmission predictions.
Neighborhood-level data did not change performance differences by patient race.
Predictive performance varied by patient races across difference classification thresholds.
Hospitals should audit clinical predictions for performance and equity prior to deployment.
Footnotes
Publisher's Disclaimer: This is a PDF file of an unedited manuscript that has been accepted for publication. As a service to our customers we are providing this early version of the manuscript. The manuscript will undergo copyediting, typesetting, and review of the resulting proof before it is published in its final form. Please note that during the production process errors may be discovered which could affect the content, and all legal disclaimers that apply to the journal pertain.
References
- 1.Link BG, Phelan J. Social Conditions As Fundamental Causes of Disease. Journal of Health and Social Behavior. 1995;35:80. [PubMed] [Google Scholar]
- 2.Meddings J, Reichert H, Smith SN, Iwashyna TJ, Langa KM, Hofer TP, et al. The Impact of Disability and Social Determinants of Health on Condition-Specific Readmissions beyond Medicare Risk Adjustments: A Cohort Study. Journal of general internal medicine. 2016November; [DOI] [PMC free article] [PubMed] [Google Scholar]
- 3.Sokoreli I, Cleland JG, Pauws SC, Steyerberg EW, de Vries JJG, Riistama JM, et al. Added value of frailty and social support in predicting risk of 30-day unplanned re-admission or death for patients with heart failure: An analysis from OPERA-HF. International Journal of Cardiology. 2019March;278:167–72. [DOI] [PubMed] [Google Scholar]
- 4.Sterling Madeline R, Ringel Joanna Bryan, Pinheiro Laura C., Safford Monika M., Levitan Emily B., Phillips Erica, et al. Social Determinants of Health and 90-Day Mortality After Hospitalization for Heart Failure in the REGARDS Study. Journal of the American Heart Association. 2020May;9(9):e014836. [DOI] [PMC free article] [PubMed] [Google Scholar]
- 5.Mehta K, Scott SL, Moody AE, Soenen SL, Malik AS. Impact of Social Determents on Heart Failure Readmission At York Hospital. Journal of Cardiac Failure. 2020October;26(10):S129–30. [Google Scholar]
- 6.Connie White-Williams, Rossi Laura P., Bittner Vera A., Driscoll Andrea, Durant Raegan W., Granger Bradi B., et al. Addressing Social Determinants of Health in the Care of Patients With Heart Failure: A Scientific Statement From the American Heart Association. Circulation. 0(0):CIR.0000000000000767. [DOI] [PubMed] [Google Scholar]
- 7.Hammond G, Maddox KEJ. A Theoretical Framework for Clinical Implementation of Social Determinants of Health. JAMA Cardiol. 2019October; [DOI] [PMC free article] [PubMed] [Google Scholar]
- 8.Kind AJH, Jencks S, Brock J, Yu M, Bartels C, Ehlenbach W, et al. Neighborhood Socioeconomic Disadvantage and 30-Day Rehospitalization: A Retrospective Cohort Study. Annals of Internal Medicine. 2014December;161(11):765. [DOI] [PMC free article] [PubMed] [Google Scholar]
- 9.Hu J, Kind AJH, Nerenz D. Area Deprivation Index Predicts Readmission Risk at an Urban Teaching Hospital. Am J Med Qual. 2018September;33(5):493–501. [DOI] [PMC free article] [PubMed] [Google Scholar]
- 10.Galiatsatos P, Follin A, Alghanim F, Sherry M, Sylvester C, Daniel Y, et al. The Association Between Neighborhood Socioeconomic Disadvantage and Readmissions for Patients Hospitalized With Sepsis: Critical Care Medicine. 2020April;1. [DOI] [PMC free article] [PubMed] [Google Scholar]
- 11.Hurley LP, Dickinson LM, Estacio RO, Steiner JF, Havranek EP. Prediction of cardiovascular death in racial/ethnic minorities using Framingham risk factors. Circ Cardiovasc Qual Outcomes. 2010March;3(2):181–7. [DOI] [PMC free article] [PubMed] [Google Scholar]
- 12.Tillin T, Hughes AD, Whincup P, Mayet J, Sattar N, McKeigue PM, et al. Ethnicity and prediction of cardiovascular disease: Performance of QRISK2 and Framingham scores in a UK tri-ethnic prospective cohort study (SABRE). Heart. 2014January;100(1):60–7. [DOI] [PMC free article] [PubMed] [Google Scholar]
- 13.McClure Leslie A, Kleindorfer Dawn O, Kissela Brett M, Cushman Mary, Soliman Elsayed Z., Howard George. Assessing the Performance of the Framingham Stroke Risk Score in the Reasons for Geographic and Racial Differences in Stroke Cohort. Stroke. 2014June;45(6):1716–20. [DOI] [PMC free article] [PubMed] [Google Scholar]
- 14.Rajkomar A, Hardt M, Howell MD, Corrado G, Chin MH. Ensuring Fairness in Machine Learning to Advance Health Equity. Ann Intern Med. 2018December;169(12):866–72. [DOI] [PMC free article] [PubMed] [Google Scholar]
- 15.McCradden MD, Joshi S, Mazwi M, Anderson JA. Ethical limitations of algorithmic fairness solutions in health care machine learning. The Lancet Digital Health. 2020May;2(5):e221–3. [DOI] [PubMed] [Google Scholar]
- 16.Amarasingham R, Moore BJ, Tabak YP, Drazner MH, Clark CA, Zhang S, et al. An automated model to identify heart failure patients at risk for 30-day readmission or death using electronic medical record data. Medical care. 2010November;48(11):981–8. [DOI] [PubMed] [Google Scholar]
- 17.Tabak YP, Johannes RS, Silber JH. Using Automated Clinical Data for Risk Adjustment: Development and Validation of Six Disease-Specific Mortality Predictive Models for Pay-for-Performance. Medical Care. 2007August;45(8):789–805. [DOI] [PubMed] [Google Scholar]
- 18.Fiest KM, Jette N, Quan H, Germaine-Smith C, Metcalfe A, Patten SB, et al. Systematic review and assessment of validated case definitions for depression in administrative data. BMC Psychiatry. 2014;14(1):289. [DOI] [PMC free article] [PubMed] [Google Scholar]
- 19.Freedland KE, Skala JA, Steinmeyer BC, Carney RM, Rich MW. Effects of Depression on Heart Failure Self-Care. Journal of Cardiac Failure. 2020December;0(0). [DOI] [PubMed] [Google Scholar]
- 20.Lloyd-Jones DM, Wilson PW, Larson MG, Beiser A, Leip EP, D’Agostino RB, et al. Framingham risk score and prediction of lifetime risk for coronary heart disease. The American journal of cardiology. 2004;94(1):20–4. [DOI] [PubMed] [Google Scholar]
- 21.Joynt Maddox KE, Reidhead M, Hu J, Kind AJH, Zaslavsky AM, Nagasako EM, et al. Adjusting for social risk factors impacts performance and penalties in the hospital readmissions reduction program. Health Services Research. 2019April;54(2):327–36. [DOI] [PMC free article] [PubMed] [Google Scholar]
- 22.Shmueli G To Explain or to Predict? Statistical Science. 2010August;25(3):289–310. [Google Scholar]
- 23.Bzdok D, Altman N, Krzywinski M. Points of Significance: Statistics versus machine learning. Nature Methods. 2018April;15(4):233–4. [DOI] [PMC free article] [PubMed] [Google Scholar]
- 24.Stekhoven DJ, Buehlmann P. MissForest - non-parametric missing value imputation for mixed-type data. Bioinformatics. 2012;28(1):112–8. [DOI] [PubMed] [Google Scholar]
- 25.Stekhoven DJ. missForest: Nonparametric missing value imputation using random forest. 2013. [Google Scholar]
- 26.Friedman JH, Hastie T, Tibshirani R. Regularization Paths for Generalized Linear Models via Coordinate Descent. Journal of Statistical Software. 2010February;33(1):1–22. [PMC free article] [PubMed] [Google Scholar]
- 27.Kuhn M Building Predictive Models in R Using the Caret Package. Journal of Statistical Software. 2008;28(5). [Google Scholar]
- 28.Steyerberg EW, Vickers AJ, Cook NR, Gerds T, Gonen M, Obuchowski N, et al. Assessing the performance of prediction models: A framework for traditional and novel measures. Epidemiology (Cambridge, Mass). 2010January;21(1):128–38. [DOI] [PMC free article] [PubMed] [Google Scholar]
- 29.Steyerberg EW, Harrell FE. Prediction models need appropriate internal, internal-external, and external validation. J Clin Epidemiol. 2016January;69:245–7. [DOI] [PMC free article] [PubMed] [Google Scholar]
- 30.Davison AC, Hinkley DV. Bootstrap methods and their applications. Cambridge: Cambridge University Press; 1997. [Google Scholar]
- 31.Canty A, Ripley BD. Boot: Bootstrap R (s-plus) functions. 2017.
- 32.Eneanya ND, Yang W, Reese PP. Reconsidering the Consequences of Using Race to Estimate Kidney Function. JAMA. 2019June; [DOI] [PubMed] [Google Scholar]
- 33.Obermeyer Z, Powers B, Vogeli C, Mullainathan S. Dissecting racial bias in an algorithm used to manage the health of populations. Science. 2019October;366(6464):447–53. [DOI] [PubMed] [Google Scholar]
- 34.Chen IY, Szolovits P, Ghassemi M. Can AI Help Reduce Disparities in General Medical and Mental Health Care? AMA Journal of Ethics. 2019February;21(2):167–79. [DOI] [PubMed] [Google Scholar]
- 35.Chen I, Johansson FD, Sontag D. Why Is My Classifier Discriminatory? arXiv:180512002 [cs, stat] [Internet]. 2018. May; Available from: https://arxiv.org/abs/1805.12002 [Google Scholar]
- 36.Corbett-Davies S, Goel S. The Measure and Mismeasure of Fairness: A Critical Review of Fair Machine Learning. arXiv:180800023 [cs] [Internet]. 2018. July; Available from: https://arxiv.org/abs/1808.00023 [Google Scholar]
- 37.Friedman JH. Greedy function approximation: A gradient boosting machine. Ann Statist. 2001October;29(5):1189–232. [Google Scholar]
- 38.Larrazabal AJ, Nieto N, Peterson V, Milone DH, Ferrante E. Gender imbalance in medical imaging datasets produces biased classifiers for computer-aided diagnosis. PNAS. 2020May; [DOI] [PMC free article] [PubMed] [Google Scholar]
- 39.Benjamin R Assessing risk, automating racism. Science. 2019October;366(6464):421–2. [DOI] [PubMed] [Google Scholar]
- 40.Center for Medicare & Medicaid Innovation. Hospital Readmissions Reduction Program | Provider Data Catalog. Data Summary: Hospital Readmissions Reduction Program. https://data.cms.gov/provider-data/dataset/9n3s-kdb3; 2021 [Google Scholar]
- 41.Lahewala S, Arora S, Tripathi B, Panaich S, Kumar V, Patel N, et al. Heart failure: Same-hospital vs. Different-hospital readmission outcomes. Int J Cardiol. 2019March;278:186–91. [DOI] [PubMed] [Google Scholar]
- 42.KUNINS HV, BELLIN E, CHAZOTTE C, DU E, ARNSTEN JH. The Effect of Race on Provider Decisions to Test for Illicit Drug Use in the Peripartum Setting. J Womens Health (Larchmt). 2007March;16(2):245–55. [DOI] [PMC free article] [PubMed] [Google Scholar]
- 43.Frey WH. Black-white segregation edges downward since 2000, census shows. Brookings. 2018. [Google Scholar]
- 44.Xie S, Hubbard RA, Himes BE. Neighborhood-level measures of socioeconomic status are more correlated with individual-level measures in urban areas compared with less urban areas. Ann Epidemiol. 2020March;43:37–43. e4. [DOI] [PMC free article] [PubMed] [Google Scholar]
- 45.Eneanya ND, Crews DC. “Place, Not Race”: A Focus on Neighborhood as a Risk Factor for Hospitalizations in ESKD. American Journal of Kidney Diseases. 2020; [DOI] [PubMed] [Google Scholar]
- 46.Romero-Brufau S, Huddleston JM, Escobar GJ, Liebow M. Why the C-statistic is not informative to evaluate early warning scores and what metrics to use. Critical Care. 2015December;19(1). [DOI] [PMC free article] [PubMed] [Google Scholar]
- 47.Kipnis P, Turk BJ, Wulf DA, LaGuardia JC, Liu V, Churpek MM, et al. Development and validation of an electronic medical record-based alert score for detection of inpatient deterioration outside the ICU. Journal of Biomedical Informatics. 2016December;64:10–9. [DOI] [PMC free article] [PubMed] [Google Scholar]
- 48.Schmidt H Vaccine Rationing and the Urgency of Social Justice in the Covid-19 Response. Hastings Center Report. 2020;50(3):46–9. [DOI] [PMC free article] [PubMed] [Google Scholar]
- 49.Kasy M, Abebe R. Fairness, Equality, and Power in Algorithmic Decision-Making. 2020;14. [Google Scholar]
- 50.Stevenson M, Doleac JL. Algorithmic Risk Assessment in the Hands of Humans. SSRN Electronic Journal. 2019; [Google Scholar]
- 51.Klinger EV, Carlini SV, Gonzalez I, Hubert SSt, Linder JA, Rigotti NA, et al. Accuracy of Race, Ethnicity, and Language Preference in an Electronic Health Record. J Gen Intern Med. 2015June;30(6):719–23. [DOI] [PMC free article] [PubMed] [Google Scholar]
- 52.Verbrugge FH, Reddy YNV, Borlaug BA. Cause-Specific Mortality and Heart Failure Readmissions According To the HFA-PEFF Algorithm In Patients Hospitalized For Heart Failure with Preserved Ejection Fraction and Volume Overload. Journal of Cardiac Failure. 2020October;26(10):S123–4. [Google Scholar]
- 53.Gabel DF, Watts AM, Beavers JC, Russell SD, Rich WD. Development of A Practical Heart Failure Readmission Risk Assessment Tool. Journal of Cardiac Failure. 2020October;26(10):S133. [Google Scholar]
- 54.Kang Y, Hurdle J. Predictive Model for Risk of 30-Day Rehospitalization Using a Natural Language Processing/Machine Learning Approach Among Medicare Patients with Heart Failure. Journal of Cardiac Failure. 2020October;26(10):S5. [Google Scholar]
Associated Data
This section collects any data citations, data availability statements, or supplementary materials included in this article.