Abstract
How our internal state is merged with our visual perception of an impending threat to drive an adaptive behavioural response is not known. Mice respond to visual threats by either freezing or seeking shelter. Here we show that nuclei of the ventral midline thalamus (vMT), the xiphoid nucleus (Xi) and nucleus reuniens (Re), represent crucial hubs in the network controlling behavioural responses to visual threats. The Xi projects to the basolateral amygdala to promote saliency-reducing responses to threats, such as freezing, whereas the Re projects to the medial prefrontal cortex (Re→mPFC) to promote saliency-enhancing, even confrontational responses to threats, such as tail rattling. Activation of the Re→mPFC pathway also increases autonomic arousal in a manner that is rewarding. The vMT is therefore important for biasing how internal states are translated into opposing categories of behavioural responses to perceived threats. These findings may have implications for understanding disorders of arousal and adaptive decision-making, such as phobias, post-traumatic stress and addictions.
Vision is a rich source of information about the presence of impending threats, such as predators or heights. To ensure survival, visual threats must be perceived and integrated with the neural circuits that control internal states (for example, arousal level) in order to engage the appropriate behavioural responses. However, where in the brain this integration occurs is unknown. Adaptive behavioural responses to visual threats fall into two general categories: those that reduce saliency to predators (to avoid detection), such as freezing or hiding1, and those that enhance saliency (to avoid capture), such as fleeing or retaliatory aggression2–4.
Visual threat activates midline thalamic nuclei
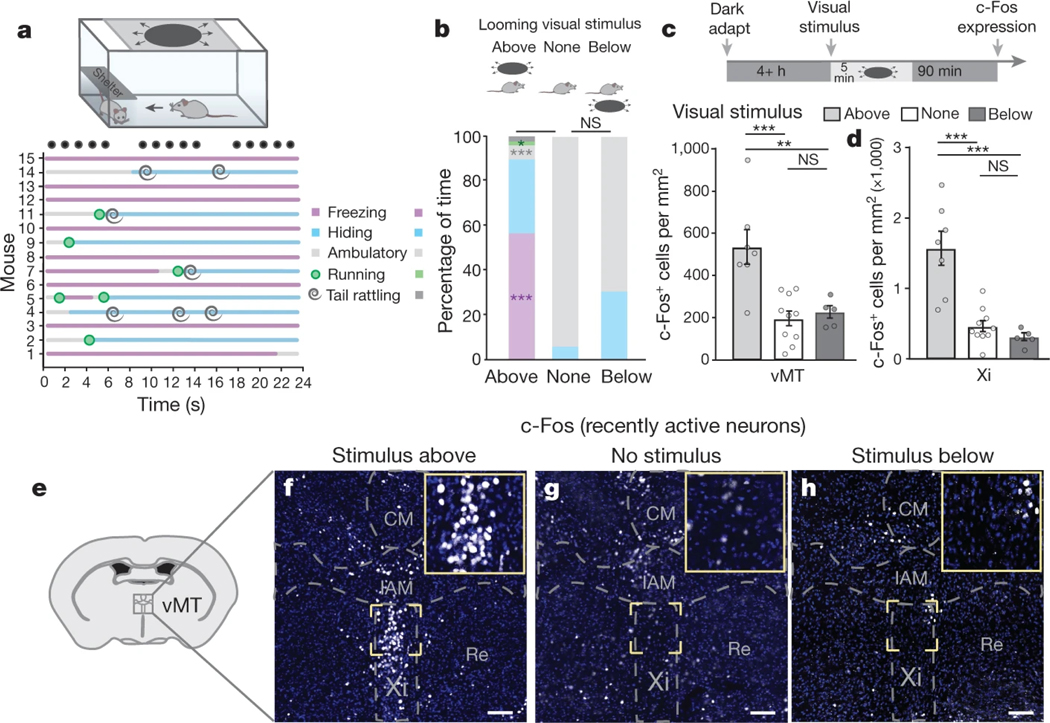
Fear, which manifests as a sudden shift towards freezing or hiding, can be evoked in mice by exposing them to a dark, rapidly expanding, overhead ‘looming’ stimulus that resembles an approaching predator1 (Fig. 1a, Supplementary Videos 1 and 2). Fear does not occur in the absence of looming, or if looms are presented in the lower visual field1,5 (Fig. 1b). In response to overhead looming, mice (n = 15, controls) spent 91.9% of the loom presentation time either freezing, or hiding in the provided shelter. For the remaining fraction of time (8.1%), mice were either ambulatory (walking; 6.4%) or running (1.7%), the vast majority of which was in the direction of the shelter in order to hide. Control mice spent a very small portion (2%) of the total overhead loom presentation time ‘tail rattling’, a behaviour typically associated with aggression6–8. Notably, all of the tail rattling occurred when the mice were hiding under the shelter, not in the open, unsheltered portion of the arena (Fig. 1a).
Fig. 1 |. Visual threat activates the ventral midline thalamus.
a, Ethogram of responses to a looming threat. Black circles represent the looming stimulus (15 expansions in 24 s). b, Behaviours in response to looming from above, no loom and looming from below. c, d, Looming from above, but not below, induces vMT c-Fos activation (c) and Xi activation (d) relative to no loom. e, Location of the ventral midline thalamus within the mouse brain. f–h, c-Fos+ (white) neurons in the vMT after overhead looming (f), no looming stimulus (g) or looming from below (h). Scale bars, 100 μm. CM, central medial nucleus; IAM, intrantereomedial nucleus; Re, nucleus of reuniens; Xi, xiphoid nucleus. Data are mean ± s.e.m. *P < 0.05, **P < 0.01, ***P < 0.001; NS, not significant. See Supplementary Table 1 for further details of the statistical analyses.
To parse the neural circuits that determine behavioural responses to threatening visual stimuli, we examined c-Fos, a marker of recently active neurons, in the brains of mice recently exposed to overhead looming. Neurons in the vMT were highly activated by looms presented overhead, but not by looms presented below (Fig. 1c–h), with the greatest activation occurring in the Xi (Fig. 1d–h). Because the vMT resides outside the primary visual pathway, it may represent an important station for modulating and/or promoting behavioural responses to visual threats.
vMT neurons modulate threat responses
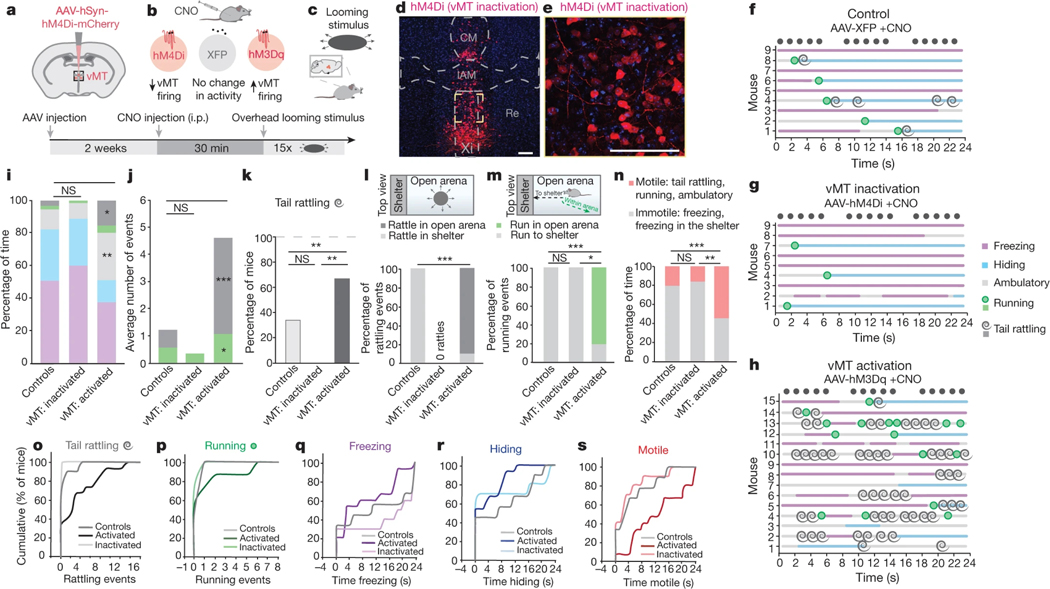
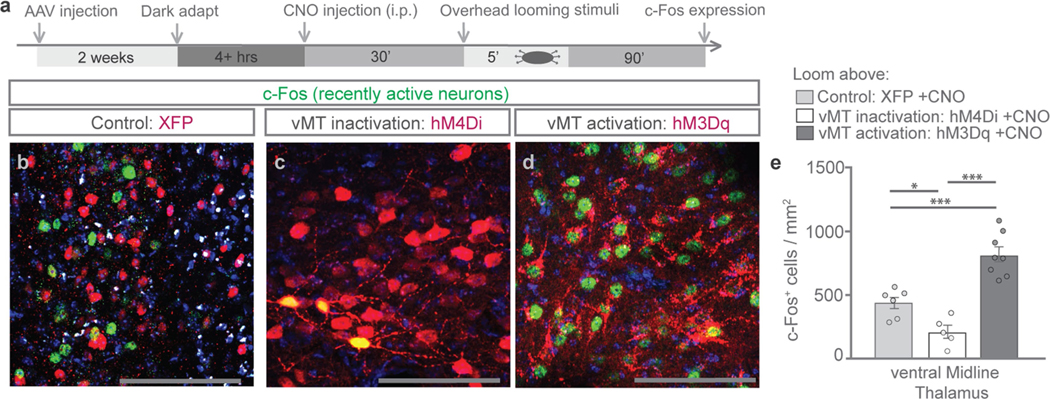
To further assess the functional role of the vMT, mice were stereotaxically injected with an adeno-associated virus (AAV) expressing hM4Di (Gi/o-coupled human muscarinic M4 designer receptor exclusively activated by a designer drug (DREADD)) tagged with mCherry (AAV-hSyn-hM4Di-mCherry) (n = 9 mice; Fig. 2a–e). Control mice (n = 9) received injections of a virus lacking DREADD (for example, AAV-hSyn-mCherry). Other mice (n = 15) received injections of AAV-hSyn-hM3Dq-mCherry (Gq-coupled human muscarinic M3 DREADD) into the vMT. hM4Di and hM3Dq receptors bind clozapine N-oxide (CNO) and cause robust decreases or increases, respectively, in the firing of central-nervous-system neurons9,10 (Fig. 2b). vMT neurons expressing hM4Di and exposed to CNO showed a significant decrease in c-Fos activation, whereas a significant increase in c-Fos activation occurred in vMT neurons expressing hM3Dq (Extended Data Fig. 1).
Fig. 2 |. vMT neurons modulate visual threat responses.
a–c, Diagrams depicting different stages of the experimental protocol. i.p., intraperitoneal. d, hM4Di–mCherry+ cells (red) in the vMT. e, A zoomed-in view of the region outlined by a yellow square in d. Scale bars (d, e), 100 μm. f–h, Ethograms of responses to overhead looming in control mice treated with CNO (f), mice with vMT inactivation (g) and mice with vMT activation (h). i–m, Effects of vMT activation or inactivation on the behavioural responses of mice. vMT inactivation eliminated tail rattling (i–l); vMT activation increased tail rattling (i, duration; j, incidence; k, percentage of mice) and running (i, duration; j, incidence) in the open arena (l, m). vMT activation increased ambulatory time in the open (i) and total motile behaviours (n) relative to control mice. o–s, Cumulative frequency distribution plots of behavioural responses. Data are mean ± s.e.m. *P < 0.05, **P < 0.01, ***P < 0.001; NS, not significant. See Supplementary Table 1 for further details of the statistical analyses.
Marked differences in responses to looming were observed between the three groups of mice. Control mice displayed normal ratios of behaviours, with freezing and hiding accounting for the vast majority of the loom-stimulus presentation time (Fig. 2f, i, o–r, Extended Data Fig. 2). Mice in which hM4Di–mCherry was expressed in the vMT and CNO had been administered (that is, mice in which the vMT was inactivated), showed normal responses to overhead looming stimuli by freezing or running to hide (Fig. 2g, i, p–r); however, the overall number of mice exhibiting tail rattling was reduced from 3 out of 9 control mice to 0 out of 9 vMT-inactivated mice (Fig. 2f, k, Supplementary Video 3).
Considerable shifts in the behavioural responses to overhead looms were observed in mice that expressed hM3Dq and were treated with CNO (that is, mice in which the vMT was activated). Although the mice hid at normal frequency (Fig. 2h, i, r), they exhibited significant increases in the number (Fig. 2h, j, o) and duration (Fig. 2i) of tail-rattling episodes, most of which occurred outside the confines of the shelter (Fig. 2h, l, Supplementary Video 4). The overall percentage of mice exhibiting tail rattling was also significantly increased (Fig. 2k). Tail rattling is associated with aggression in male mice before fighting7,11 and in female mice eliciting maternal territorial behaviour12, although it can reflect non-aggressive states as well11,13. We observed significant increases in tail rattling in both male and female mice, with no sex differences (Extended Data Fig. 2). Although the emotional state associated with tail rattling is unclear, it unequivocally increases the visual and auditory saliency of the mouse to predators (Supplementary Video 4). Mice treated with both hM3Dq and CNO also displayed significantly more walking (duration) and running (incidence), with the vast majority of this locomotion occurring within the open arena (Fig. 2 i, j, m, p). Overall, we observed a significant shift towards more motile behaviours in mice treated with both hM3Dq and CNO compared to control mice (Fig. 2n, s), and a shift away from immotile, saliency-reducing behaviours (for example, freezing and hiding). No increase in the amount of motile behaviour occurred in the absence of visual threats (Extended Data Fig. 6). Therefore, vMT influences action selection in response to threats, but does not influence locomotor behaviour in itself.
Distinct threat responses by vMT outputs
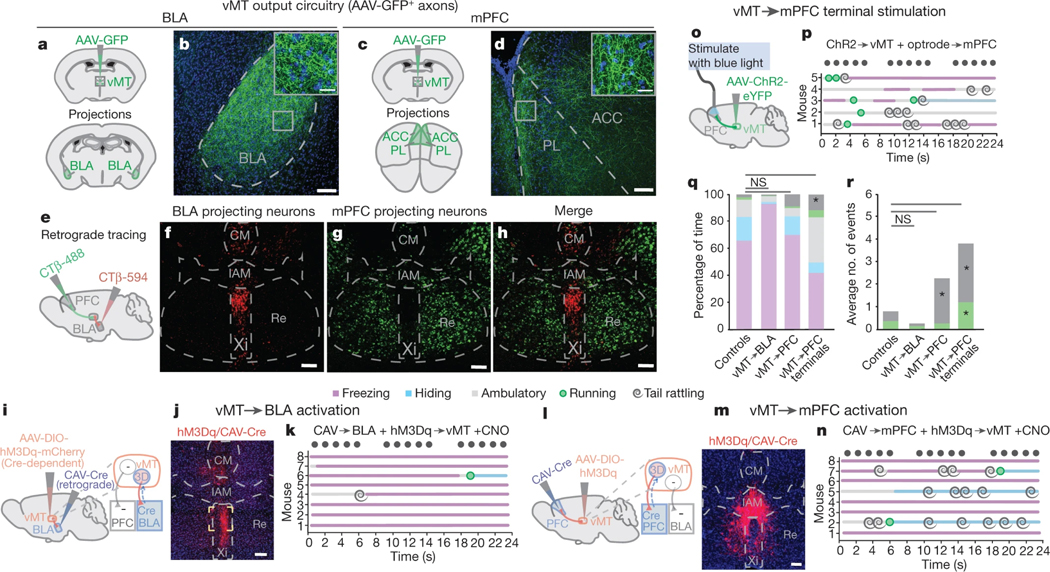
Next we explored the structure and function of vMT output circuitry. We injected AAV-XFP into the vMT (n = 12 mice; Fig. 3a, c, Extended Data Fig. 3a, b) and two weeks later, collected and analysed the brains (Fig. 3a–d). The two major outputs of the vMT were the basolateral amygdala (BLA) (Fig. 3a, b) and the medial prefrontal cortex (mPFC) (Fig. 3c, d). Two-colour retrograde tracing (Fig. 3e) from these targets revealed that they originate from non-overlapping, spatially compartmentalized sets of vMT neurons. The vMT→BLA pathway originated from neurons in the Xi nucleus (Fig. 3f, h), whereas the vMT→mPFC pathway originated from the Re nucleus (Fig. 3g, h).
Fig. 3 |. Divergent vMT outputs influence threat responses.
a–d, Mice were injected with AAV-GFP in the vMT (a, c; n = 17 mice) and axons (green) were observed in the BLA (b) and mPFC (d). e, Locations in the brain at which retrograde tracing was performed. f–h, Retrograde labelled vMT→BLA (red, f), vMT→mPFC projection neurons (green, g), and the merged image (h); n = 5 mice. i, j, Injections (i) and representative image of hM3Dq/Cre+ neurons (red) in the vMT, projecting to the BLA (j). k, Ethogram of the responses to looming in mice when the vMT→BLA neurons are activated. l, m, Injections (l) and representative image of hM3D/Cre+ neurons (red) in the vMT that project to the mPFC (m). n, Ethogram of the responses to looming in mice with vMT→mPFC neurons activated. o, p, Schematic of injections (o) and ethogram of responses to looming in mice with vMT axon terminals activated in the mPFC (p). q, r. Activating the vMT→mPFC pathway, but not the vMT→BLA pathway, increases tail rattling (q, duration; r, incidence) relative to controls. BLA, basolateral amygdala; mPFC, medial prefrontal cortex; PL, prelimbic cortex; ACC, anterior cingulate cortex. Scale bars, 100 μm. Data are mean ± s.e.m. *P < 0.05, **P < 0.01; NS, not significant. See Supplementary Table 1 for further details of the statistical analyses.
The rodent BLA and mPFC have been shown to be involved in a range of functions including the control of fear14,15 and anxiety-related behaviours16–18. Given the divergent outputs of different vMT neurons to each of these targets (Fig. 3e–h), we investigated how each pathway affects the responses to looming stimuli. To study the vMT→BLA pathway, we injected the BLA with a canine adenovirus-2 expressing Cre-recombinase (CAV-Cre), which infects synaptic terminals and thus ‘retrogradely’ infects neurons with Cre19. We then injected AAV-hSyn-DIO-hM3Dq-mCherry (Fig. 3i) into the vMT of the same mice, thereby inducing expression of hM3Dq–mCherry selectively in Cre-expressing vMT→BLA neurons (n = 8 mice; Fig. 3j); we then treated the mice with CNO to activate vMT→BLA circuitry. This caused a marked increase in the duration of freezing in response to looms, and a reduction in the amount of time that the mice spent hiding (Fig. 3k, q). No increases in tail rattling were observed after activation of vMT→BLA neurons (Fig. 3k, q, r).
In other mice (n = 8) we injected the mPFC, with CAV-Cre, followed by an injection of AAV-hSyn-DIO-hM3Dq-mCherry into the vMT (Fig. 3l); this resulted in specific infection of the hM3Dq-mCherry/Cre+ neurons that project to mPFC (vMT→mPFC; Fig. 3m, Extended Data Fig. 4). We then injected these mice with CNO to selectively activate vMT→mPFC circuitry. This caused a significant increase in tail-rattling events compared to controls, but did not change freezing or hiding behaviours (Fig. 3n, q, r).
In both the vMT→mPFC-activated and the vMT→mBLA-activated mice, we observed mCherry+ axons in the nucleus accumbens (NAc), suggesting that axonal projections from the vMT bifurcate to innervate the NAc. Anterograde tracing from the vMT with AAV-GFP confirmed this (Extended Data Fig. 3a–d). We tested whether the vMT→NAc pathway altered behavioural responses to looming (Extended Data Fig. 3e, f), but found that it did not (Extended Data Fig. 3g). Therefore, the vMT→mPFC and the vMT→BLA circuits determine the behavioural responses to visually threatening stimuli.
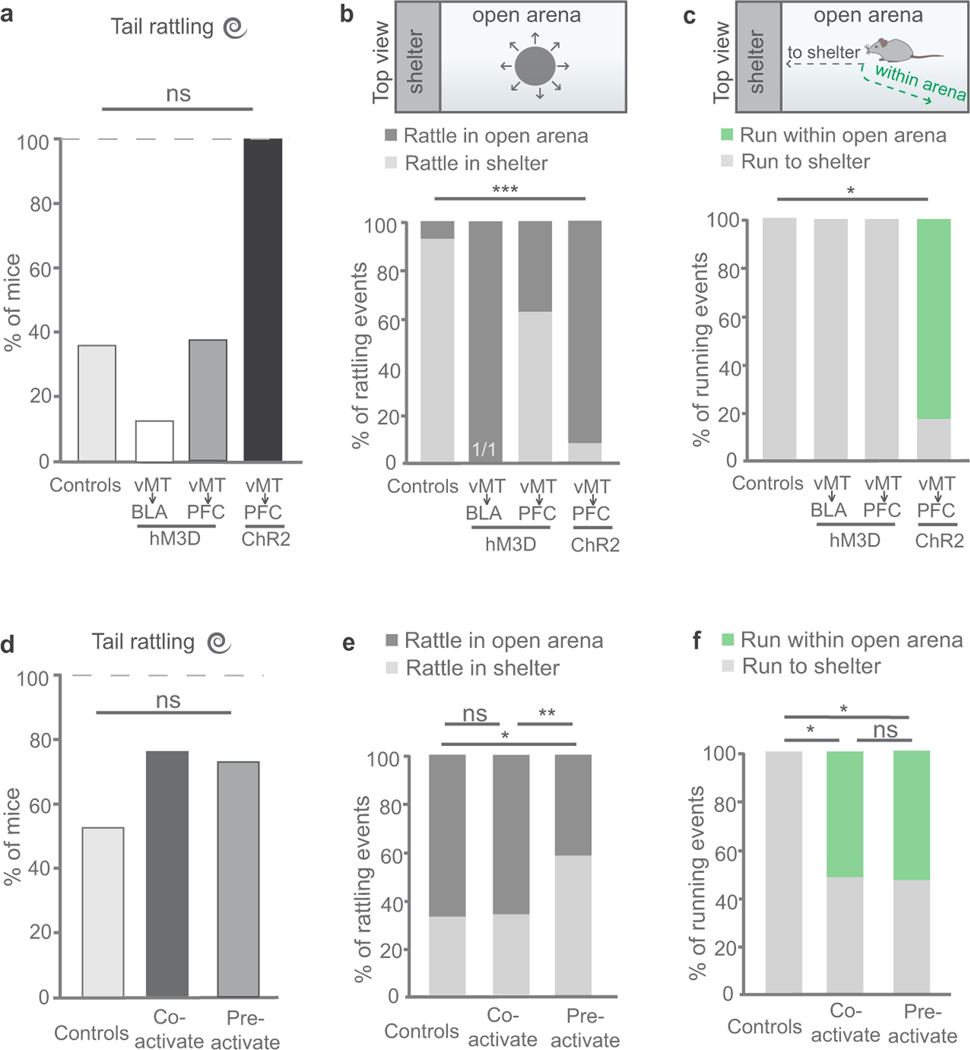
To specifically activate the vMT→mPFC pathway and not the bifurcated NAc axons, we injected AAV-ChR2-eYFP (ChR2, channelrhodopsin-2; eYFP, enhanced yellow fluorescent protein)20 into the vMT and implanted a fibre-optic cannula above the mPFC (Fig. 3o). Upon optogenetic stimulation of the vMT→mPFC pathway, 100% of mice exhibited tail rattling (Fig. 3p, Extended Data Fig. 5). The stimulation of vMT→mPFC terminals significantly increased tail rattling (duration and incidence) and running (incidence) (Fig. 3p–r). Collectively, these data reveal that each of the two divergent outputs of the vMT determines a unique set of responses to visually threatening stimuli: the vMT→mPFC circuit increases tail rattling and motile behaviours, and the vMT→BLA circuit suppresses these behaviours and encourages freezing instead, effects that do not simply reflect differences in the number of infected neurons in each condition (Extended Data Fig. 4a–d).
Impact of vMT activation prior to loom exposure
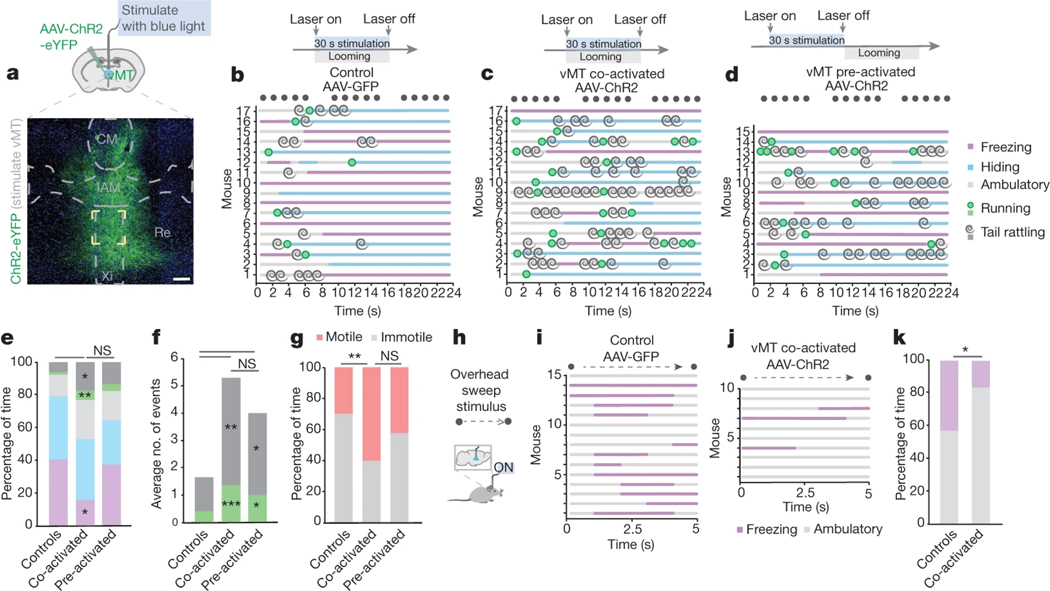
To understand further how the vMT affects behavioural response selection to visual threats, we again used virally-expressed ChR2 (n = 32 mice; Fig. 4a) and varied the timing of vMT activation relative to loom presentations. In the first condition, the vMT was stimulated at the same time as the presentation of the loom stimulus (Supplementary Video 5). Control mice with AAV-GFP expressed in the vMT, but no ChR2, showed normal loom responses (n = 17 mice; Fig. 4b, Extended Data Fig. 2). By contrast, mice with ChR2 expressed and blue light stimulation presented in concert with the looming stimulus exhibited significant increases in both the duration and incidence of tail rattling and running (Fig. 4c, e, f). Overall, vMT stimulation together with looming significantly increased saliency-enhancing behaviours, and decreased saliency-reducing behaviours such as freezing (Fig. 4e, g).
Fig. 4 |. Saliency-enhancing behaviours to threat persist after vMT stimulation.
a, Representative image of ChR2–eYFP+ cells in the vMT. Scale bars, 100 μm. b–d, Ethograms of responses to looming in control mice (b), mice with vMT activated in concert with the loom (c, co-activated) and mice with vMT activated before the loom (d, pre-activated). e–g, Co-activating and pre-activating the vMT increased tail rattling and running (e, duration; f, incidence). Co-activating the vMT decreased freezing (e) and increased total motile behaviours (g). h, Schematic of the overhead-sweep-stimulus experiment. i–j, Ethograms of responses to the overhead sweep stimulus in control mice (i) and mice in which the vMT is activated during the sweep (j). k, Co-activating the vMT decreased freezing in response to the sweep. Data are mean ± s.e.m. *P < 0.05, **P < 0.01, ***P < 0.001. See Supplementary Table 1 for further details of the statistical analyses.
Next we asked whether vMT stimulation before looming also induces shifts in the behavioural responses of mice. We stimulated the vMT for 30 s before any exposure to looming stimuli (Fig. 4d) (n = 15). This induced a remarkably similar pattern of effects to vMT stimulation in concert with looms; in both cases, the mice displayed significantly increased saliency-enhancing behaviours, such as tail rattling and running, compared to controls (Fig. 4e–g). This suggests that vMT stimulation causes a shift in the internal state of the mouse and does not somehow alter visual perception in itself.
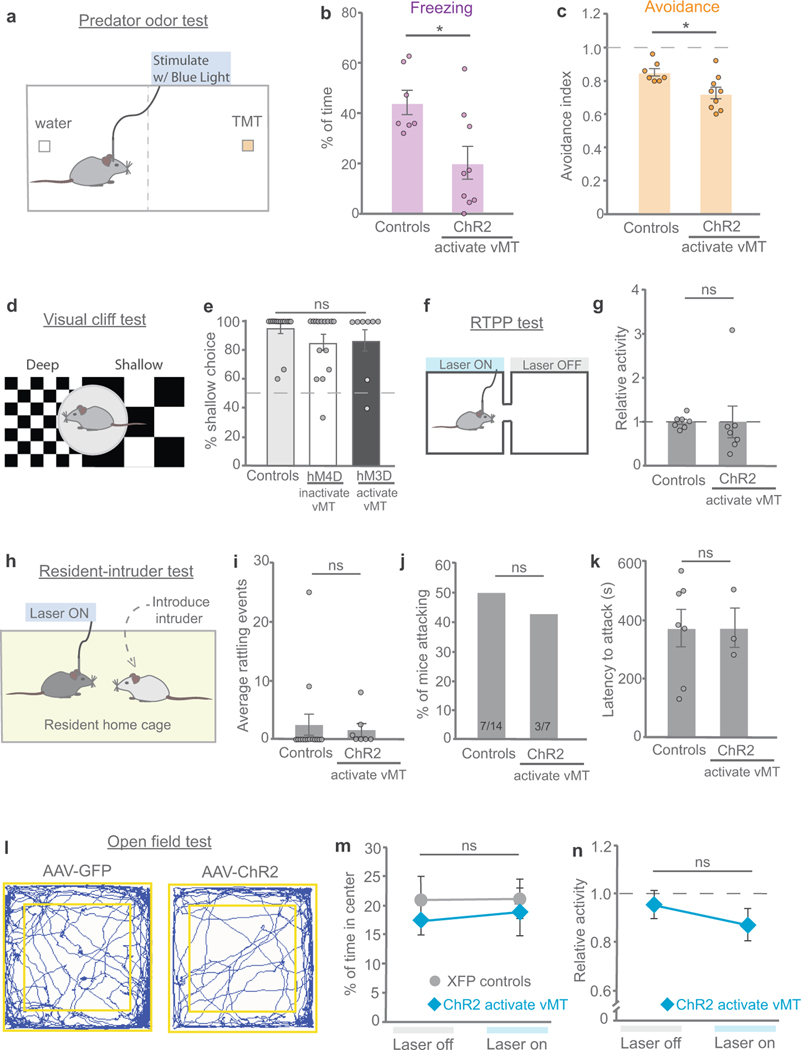
To further test the idea that vMT activation shifts mice towards states that favour saliency-enhancing responses to threat, we exposed a subset of mice to a visual ‘sweep’ stimulus, which reliably induces freezing but not escape and/or hiding behaviours21 (Fig. 4h, i, k). Activating the vMT with ChR2 and blue light during the presentation of visual sweeps significantly reduced the amount of sweep-induced freezing and promoted saliency-enhancing behaviours (Fig. 4j, k). ChR2-induced activation of the vMT also significantly reduced freezing and avoidance of olfactory threats22,23, and increased saliency-enhancing ambulatory and approach behaviours (Extended Data Fig. 6a–c).
vMT activation increases arousal level
The fact that vMT activation causes robust shifts in the responses to fear-inducing stimuli even when it is induced before the stimuli are delivered suggests that vMT activation modulates arousal state. To explore this, we examined the size of the pupil in response to illumination at constant light levels24, which is a fast read-out of arousal25,26.
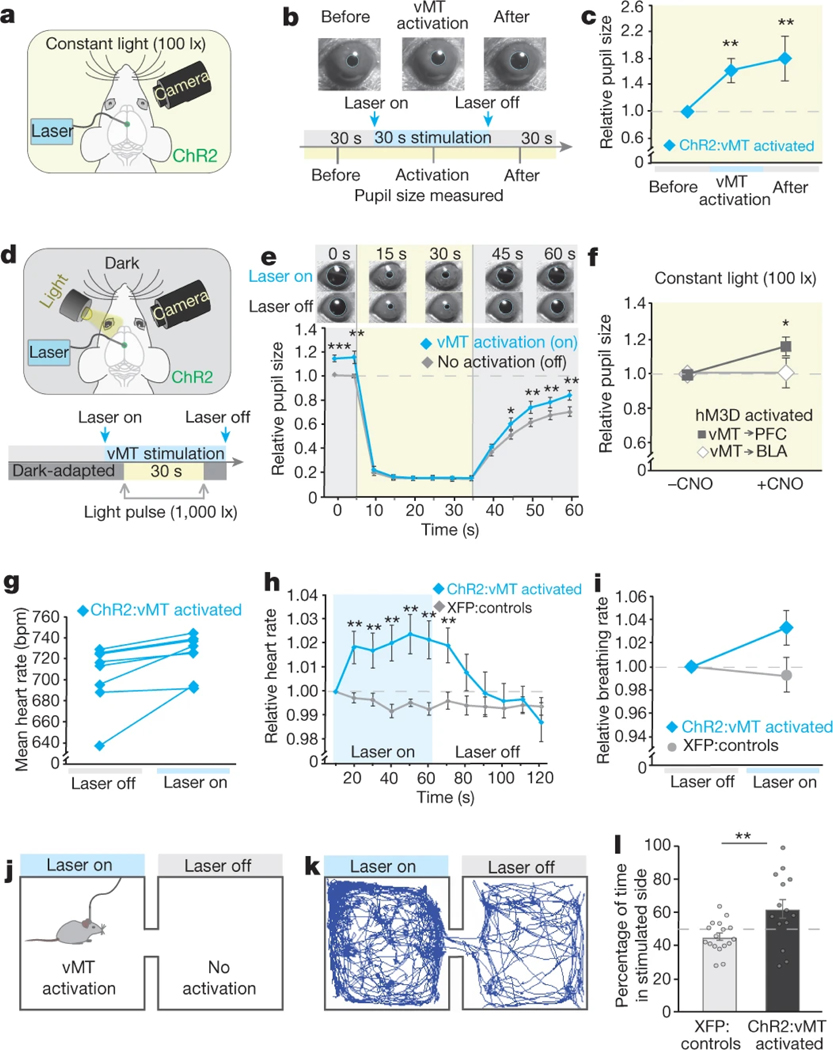
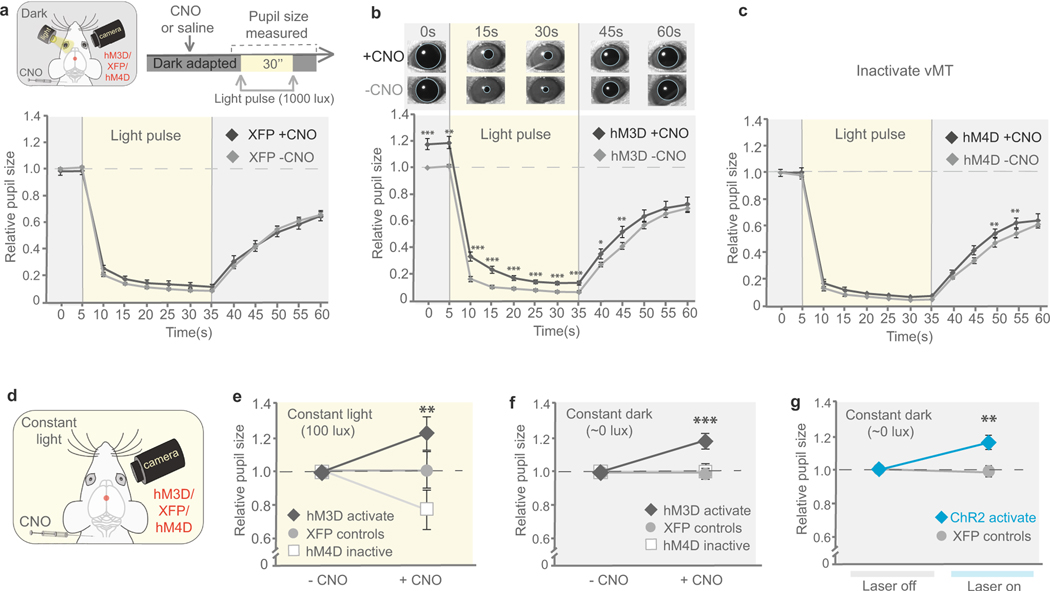
Heightened arousal increases pupil diameter26. We explored how vMT stimulation affects pupil size at constant 100-lx ambient light. vMT stimulation resulted in a significant increase in pupil size (60% change) compared with that of control mice (Fig. 5a–c). Even after vMT stimulation was ceased, the pupil remained significantly dilated (80%; Fig. 5c). To separate the arousal-driven from the light-driven component of the pupil reflex, we tested the consensual27 reflex of the pupil in one eye, in response to light pulses delivered to the opposite eye in otherwise dark-adapted mice. Mice in which vMT activity was enhanced showed normal pupil constriction in response to light, but in the dark showed significantly increased pupil dilation compared to controls (Fig. 5d, e). Increased dilation was also observed in mice in which the vMT→mPFC pathway was stimulated, but not in mice in which the vMT→BLA pathway was stimulated (Fig. 5f). Sham stimulation and CNO alone did not affect pupil size (Extended Data Fig. 7). vMT activation also caused a significant increase in heart rate (Fig. 5g, h) and a trend towards increased breathing rate (Fig. 5i). Thus, pan-vMT and vMT→mPFC activation does not affect light-driven pupil responses; rather, it increases arousal.
Fig. 5 |. vMT activation increases arousal.
a, Schematic of experimental set-up to analyse arousal-driven pupillary responses to vMT stimulation. b, c, Pupil size in constant light (100 lx) conditions before, during and after vMT stimulation (n = 12 mice) relative to controls (n = 8 mice, dashed line in c). d, Schematic of experimental set-up to analyse light-driven pupillary responses in dark-adapted mice. e, Relative pupil size before, during and after a 30-s light pulse (1000 lx) in mice with and without vMT stimulation (n = 11 mice). f, Under constant light conditions, activating the vMT→mPFC pathway, but not the vMT→BLA pathway increased relative pupil size. g–i, Heart rate (g, h) and breathing rate (i) in mice with and without vMT stimulation (n = 8 mice). j, Illustration of the RTPP test. k, Representative tracing of a mouse with vMT stimulation in the RTPP test. l, Mice with vMT activation (n = 14) spent more time in the stimulated side as compared to control mice (n = 17). Data are mean ± s.e.m. *P < 0.05, **P < 0.01, ***P < 0.001. See Supplementary Table 1 for further details of the statistical analyses.
Changes in arousal can be associated with positive or negative states. We questioned whether vMT stimulation is rewarding, aversive or neutral. ChR2-expressing mice (n = 14) were placed in a two-chamber arena and the vMT was stimulated using a fibre-optic cannula every time the mouse entered one particular side of the chamber (Fig. 5j). The stimulation was ceased when the mice explored the opposite side. This real-time place preference (RTPP) test revealed a strong preference for the vMT-stimulated side (Fig. 5k, l). This did not reflect an alteration in locomotor activity (Extended Data Fig. 6). vMT activation also did not disrupt the perception of danger cues in a visual cliff test, aggression or tail rattling in response to a male intruder, or overall levels of anxiety in an open-field test (Extended Data Fig. 6). Therefore, increases in arousal induced by vMT stimulation are rewarding; that is, they have positive valence.
vMT firing scales with perceived threat
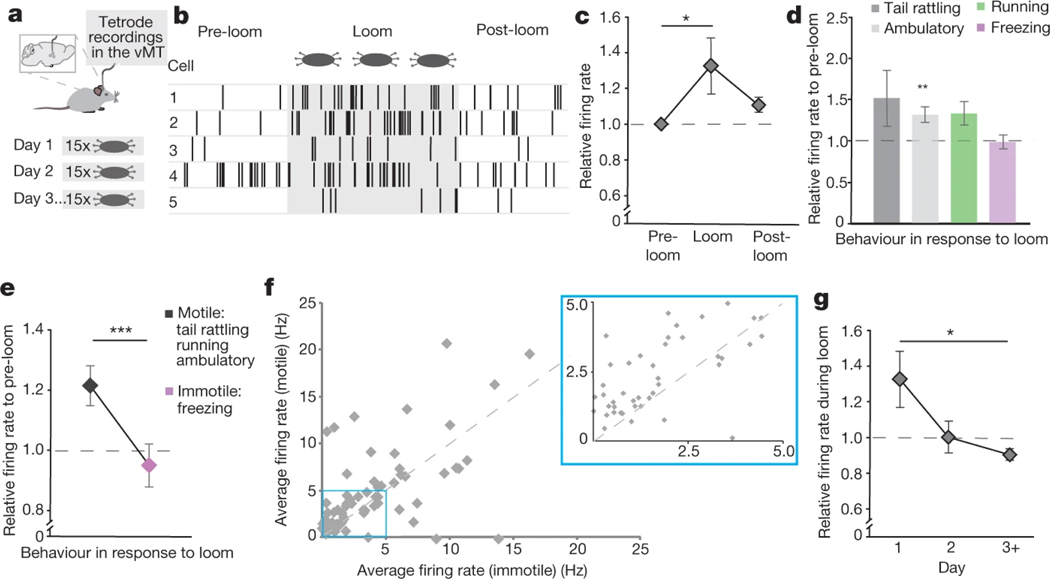
Next we carried out single-unit tetrode recordings from freely behaving mice before, during and after exposure to looming stimuli (Fig. 6a; see Methods). Example spiking activity from five different vMT cells in response to the first round of looming stimuli is shown in Fig. 6b. Four out of five cells showed increased firing to looms relative to the pre-loom condition. Overall, the firing rates of vMT neurons increased by approximately 30% in response to looms on the first day of loom exposure (Fig. 6c), which is when the most robust behavioural responses to loom occur.
Fig. 6 |. vMT neurons are activated during saliency-enhancing behaviours.
a, Tetrode recordings in the vMT were performed during presentation of the looming stimulus. b, Sample raster plots of five isolated units before, during and after the looming stimulus. c–e, Mean relative firing rates on the first day of loom presentation (c, 23 cells from 4 mice), during different behaviour epochs (d, 87 total cells from 4 mice) and during motile and immotile behaviours (e, 67 cells from 4 mice), relative to pre-loom (dashed line). f, Mean firing rates of all the recorded units during motile behaviour as compared to immotile behaviour in response to looms. Most of the points are above the y = x line. g, Mean relative firing rate across several days of looming presentation (87 total cells across 4 mice). Data are mean ± s.e.m. *P < 0.05, ***P < 0.001. See Supplementary Table 1 for further details of the statistical analyses.
Aligning vMT-spiking activity with the behaviours exhibited during looming showed that vMT spiking scaled with the degree to which the mice exhibited different behavioural responses. The firing rates of vMT neurons markedly increased when the mouse tail-rattled, walked or ran, but not when the mouse froze (Fig. 6d). Overall, there was a significant increase in vMT firing when the mouse exhibited saliency-enhancing behaviours as opposed to saliency-reducing behaviours to looming (Fig. 6d–f).
It is well established that mice habituate their responses when looming is repeatedly presented over several days1,5. We explored whether vMT firing adjusts to those changes, and found that the relative pre-loom versus loom firing rate of vMT neurons attenuated in parallel with the behavioural attenuation (Fig. 6g), an effect also seen with c-Fos (Extended Data Fig. 8). These data indicate that the firing of vMT neurons scales according to the novelty of a threat stimulus, and in a way predicts the changes in behavioural responses to visual threats over time.
Discussion
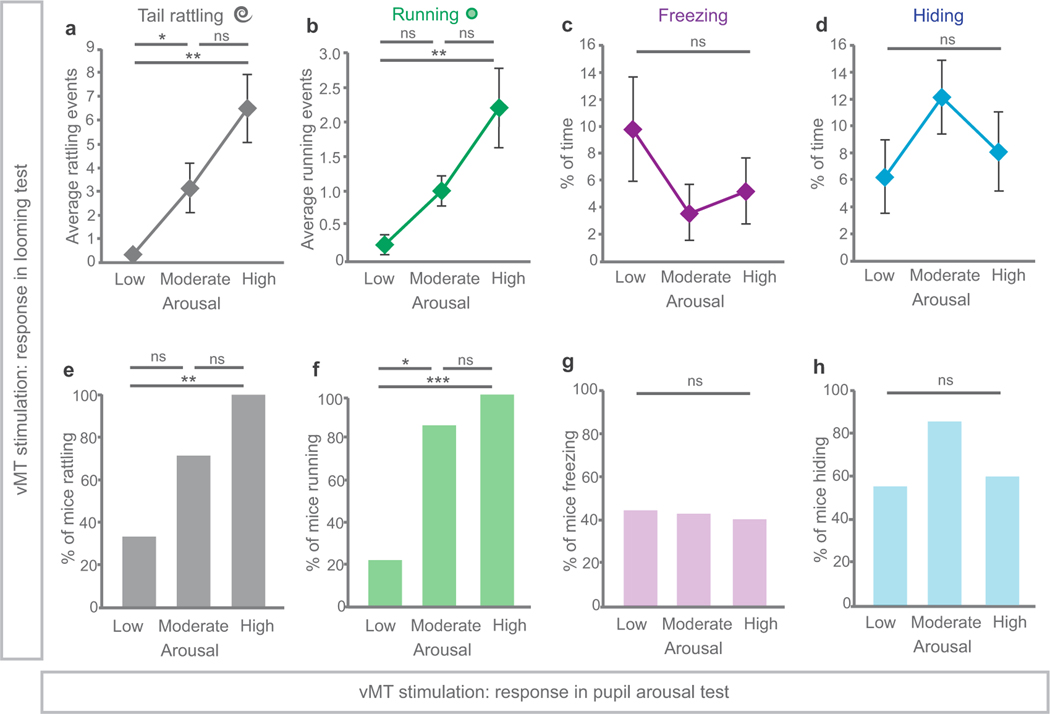
We show that when vMT neurons are activated before, or during, simulated predator looms or olfactory threat, mice shift from saliency-reducing to saliency-enhancing reactions to those threats. Whereas looms typically induce freezing, activation of the vMT or the vMT→mPFC pathway induced tail rattling—a behaviour associated with aggression11–13. Although the range of emotional states represented by behaviours such as tail rattling is likely to be broad, saliency-enhancing behaviours in general can be thought of as ‘courageous’ because they increase the visibility of the mouse in the direct presence of a perceived threat. Indeed, from the perspective of predator–prey interactions, avoiding predation reflects a trade-off between avoiding detection (for example, freezing, hiding or camouflage) and avoiding capture (for example, running or fighting); which category of behaviour is adaptive requires ongoing risk assessment. Our data indicate that arousal level appears to bias which category of behavioural response mice will exhibit in response to threats (Extended Data Fig. 9). Activation of the vMT consistently increased arousal and saliency-enhancing ‘courageous’ behaviours to threats. This is unlikely to indicate increased stress because our real-time place preference test showed that the internal state caused by vMT activation is rewarding (that is, it has positive valence). In light of this, it is notable that at least two previous studies found that self-stimulation of the human brain area that is homologous28 to the rodent vMT is strongly reinforcing, even more so than activation of areas associated with sexual arousal29,30.
The vMT structures described here reside well outside the primary visual pathway and receive diverse sources of input from sensory structures, including the superior colliculus31, as well as from hindbrain areas associated with arousal and emotion, such as the raphe and the periaqueductal grey32,33 (Extended Data Fig. 10). Thus, the vMT may act as a hub for integrating several types of sensory inputs with internal states in order to select specific categories of behavioural outputs. In contrast to the vast inputs to the vMT, the outputs of the vMT are fairly restricted: they include the basolateral amygdala, the medial prefrontal cortex (Fig. 3) and the nucleus accumbens (Extended Data Fig. 3), structures all shown previously to be associated with fear and/or reinforcement14,16,34.
Our data point to the powerful influence that activation of thalamic midline structures can have on arousal and behavioural responses to threatening stimuli. Other midline-residing structures—such as the ventromedial hypothalamus and the periaqueductal grey—have been shown by others to control aggression and arousal35,36, which raises ideas about whether midline nuclei of the hind-, mid- and forebrain may represent a larger circuit devoted to sensory-autonomic modulation. In the future, experiments that adjust the activity of several brain areas such as the periaqueductal grey, the ventromedial hypothalamus and the vMT could shed light on this idea. The strong convergence of circuitries involved in arousal, reward and action selection to perceived threats in structures such as the vMT also raises the possibility that dysregulation of midline thalamic function may underlie disorders of these processes such as addiction, phobias and post-traumatic stress disorder.
Online content
Any Methods, including any statements of data availability and Nature Research reporting summaries, along with any additional references and Source Data files, are available in the online version of the paper at https://doi.org/10.1038/s41586-018-0078-2.
METHODS
Mice.
All experimental protocols were conducted in accordance with the National Institutes of Health (NIH) guidelines for animal research and were approved by the Stanford University and University of California, San Diego Animal Care and Use Committee (IACUC). Mice were housed under a 12-h light:dark cycle with food and water ad libitum. Male and female C57BL/6 mice were 8–12 weeks old at the time of viral injection. All subjects were randomly assigned to different experimental conditions used in this study. Group sample sizes were chosen on the basis of previous studies.
Viruses.
AAV-hSyn-hM3D(Gq)-mCherry, AAV-hSyn-hM4D(Gi)-mCherry, AAV-hSyn-DIO-hM3D(Gq)-mCherry, AAV-hSyn-DIO-mCherry, and AAV-hSyn-eGFP vectors were packaged by the Vector Core at the University of North Carolina at Chapel Hill (UNC Vector Core). AAV-Ef1α-DIO-hChR2(H134R)-eYFP was provided by B. K. Lim (UCSD) and K. Deisseroth (Stanford) and was combined with AAV-iCre (Vector BioLabs) to induce opsin expression. ΔG-rabies-mCherry and ΔG-rabies-GFP were produced by the Salk Institute Gene Transfer, Targeting and Therapeutics Core (GT3). CAV2-Cre virus was obtained from The Institute of Molecular Genetics of Montpellier vector core (France). All viral vectors were stored in aliquots at −80 °C until use.
Stereotaxic surgery and drive implantation.
Mice were anaesthetized with 1.5–3.0% isoflurane and given the analgesic buprenorphine (subcutaneously, 0.3 mg kg−1). A midline scalp incision was performed to expose the skull. After performing a craniotomy, 0.5 μl of viral vectors (titer, 1012 particles per ml) were injected into the vMT (bregma: −1.0 mm, midline: 0.0 mm, dorsal surface: −4.0 mm) using a Nanoject II (Drummond) injector. The virus was slowly infused, and 10 min after infusion the glass pipette (with a resistance of approximately 0.5 MΩ) was retracted. Half of the mice in each cage were randomly assigned to either control or treatment groups. All control mice were treated with the same experimental procedures, but AAV-XFP was injected instead.
To determine the inputs to the vMT, 0.1–0.4 μl of ΔG-rabies-mCherry was injected into the vMT. Mice were then housed in a biosafety room for 4–6 days to allow the rabies virus to infect and express mCherry in presynaptic cells. To determine the outputs, AAV-GFP was injected into the vMT. The entire brain was sectioned and imaged on a Zeiss slide scanner.
For activating vMT output neurons, CAV-Cre was injected bilaterally into the BLA (bregma: −1.3 mm, midline: 3.0 mm, dorsal surface: 4.75 mm), the mPFC (bregma: +2.5 mm; midline: 0.25 mm; dorsal surface 1.5 mm) or the NAc (bregma: +1.3 mm; midline: 1.0 mm; dorsal surface 4.5 mm). In the same mice, AAV-DIO-hM3D(Gq) was injected into the vMT. Mice were tested after at least three weeks of recovery.
To determine whether the vMT projection neurons to BLA and mPFC represent distinct populations, CTβ–488 (green) was injected into the mPFC and CTβ–594 (red) was injected into the BLA of the same mouse. The vMT was examined for cells with both CTβ–488 and CTβ–594. To further determine whether vMT projection neurons bifurcate to the mPFC and the BLA, mice injected with CAV-Cre to either target and a Cre-dependent AAV to the vMT were examined for axons expressing mCherry in the mPFC and the BLA.
For optogenetic experiments, AAV-ChR2 or AAV-GFP was injected into the vMT. Then, a fibre optic cannula (200 μm diameter, 0.22 NA; Doric Lenses) was implanted above the vMT or the mPFC and was affixed to the skull with dental cement. Mice were given four weeks to recover for stimulating in the vMT and six weeks to recover for stimulating in the mPFC.
For tetrode recording from the vMT, mice were implanted with a microdrive with two or four tetrodes (bregma: −1.0 mm, midline: 0.0 mm, dorsal surface: −3.5 mm). Tetrodes composed from 17-μm polyimide-coated platinum–iridium 90–10% wire (California Fine Wire Company) were attached to the microdrive. The electrode tips were cut flat and plated with platinum to reduce impedances to 100–300 kΩ at 1 kHz. The microdrive was secured to the skull with dental cement and jeweller’s screws with one screw connected to the microdrive ground. Mice were given three days to recover from surgery before habituation to the headstage and multi-wire tether.
Recording procedures and spike sorting.
After surgery, the tetrodes were turned into the vMT in small increments to reach the appropriate depth at the end of each day. Mice were placed in the looming chamber to record pre-, during- and post-loom activity. Because the headstage partially blocked visual perception directly overhead, looming stimuli were presented at an angle. To ensure the same cell was not counted twice, unit activity was collected from sessions with at least 45 μm separation from previous loom sessions. The microdrive was connected to the recording equipment through an AC coupled unity-gain operation amplifier. Spike amplitudes above 40 μV (around two times the level of noise) were collected.
Spikes were sorted manually with offline cluster-cutting software (TINT software, Axona) based on clustering and waveforms. Autocorrelation and cross-correlation functions were used to separate cells. Only cells with a peak firing rate greater than 1 Hz pre-, during- or post-looms were analysed.
Light delivery.
Mice with fibre optic implants were connected to an optical fibre (200 μm diameter, 0.22 NA; Doric Lenses) that delivers blue light from a 473 nm laser. Blue light was delivered in 5-ms pulses at 20 Hz for 30 s before or during the entire duration of the looming stimuli. The light power at the fibre tip was about 10–20 mW, ensuring a light intensity of approximately 1 mW mm−2 over the entire vMT.
Clozapine N-oxide delivery.
For chemicogenetics, mice were administered clozapine N-oxide (CNO, Toric Bioscience; 1.5 mg kg−1 for mice with hM3Dq, 5.0 mg kg−1 for mice with hM4Di) by an intraperitoneal injection 30 min before behavioural analyses.
Behavioural analyses.
Mice were handled every day for three days before behaviour testing. No significant differences in behaviour responses were observed between males or females tested during night and day. All behaviour was performed during consistent hours in the afternoon or evening. When mice were tested in several behaviour assays, they were given at least 48 h rest between tests. All behaviours were performed and scored blind to treatment group.
Looming behaviour.
Mice were placed in a 50 cm × 25 cm × 40 cm glass chamber with a 24-inch LCD monitor stationed on top facing downwards to display the stimulus. The floor and three walls of the chamber were covered with a matte coating (Krylon) to prevent reflections of the looming stimulus. At one end of the box, there was a 12-cm-high black shelving board to provide a shelter under which mice could hide. A top video camera (Yi Action Camera) and a side video camera (Panasonic HC-W850 camcorder in nightshot mode, 30 fps) recorded the mouse’s movements during the session. Mice were given 10 min to habituate to the arena. Then, the looming stimulus (black disc on a white background, 15 expansions over 24 s) was initiated when the mouse was in the centre of the arena. All mice were tested only once owing to the fact that they can habituate to the looming stimulus even after one trial of looming presentation. The locomotor behaviours of the mice were recorded and analysed automatically with a video tracking system (Biobserve software).
The behaviour of the mice was characterized on the basis of the following criteria. Freezing was defined as episodes of three or more seconds in which the mouse was completely immobile except for movements from respiration. Running was defined as events in which the speed of the mouse was greater than two times the average speed before stimulus onset. Hiding was defined as episodes in which the mouse’s body was completely under the shelter provided. Tail rattling was defined as events in which the mouse rapidly moved its tail back and forth (1 bout of rattling = 1 s of rattling). Ambulation was defined as all other motile behaviours performed in the open arena.
Pupillary light reflex.
To test the arousal-driven aspect of the pupillary reflex, mice were adapted to constant, ambient room light (100 lx) for 1 h. All mice were kept unanaesthetized and manually restrained during the experiment. The pupil was recorded under constant light conditions for 30 s before stimulation (baseline), 30 s during stimulation, and 30 s after stimulation. Control mice were treated exactly the same except for ‘sham’ stimulation.
To test light-driven pupillary reflexes, mice were dark-adapted in their home cages for 1 h before the experiment. A single blue LED (470 nm, 1000 lx) was placed in front on the left eye. The right eye (consensual pupil reflex) was recorded before (baseline), during (constriction) and after (dilation) the 30 s blue light stimulus. Mice were again dark-adapted for 1 h after the first trial. Then, the same mice were tested for pupillary reflex with optogenetic stimulation, chemicogenetic stimulation or sham stimulation. The pupil size was later measured in ImageJ by an experimenter blind to treatment.
Real-time place preference.
Mice were placed into a two-chamber acrylic box (40 cm × 20 cm × 25 cm, each chamber 20 cm × 20 cm). Each chamber has different contextual cues on the wall. Mice were monitored for 20 min. When all four paws were in the stimulation chamber, the stimulation was turned on and remained on until the mouse left the chamber. The mice were tracked with automated tracking software (Biobserve) and the time spent in each chamber was recorded.
Home cage vMT activation.
Mice were monitored in their home cages before and during vMT activation by chemicogenetic or optogenetic methods. For optogenetic stimulation, a range of laser intensities (2 mW, 5 mW, 10 mW and 20 mW) and a range of stimulation frequencies (5 Hz, 10 Hz and 20 Hz) were tested to determine an optimal stimulation protocol and monitor behaviour. Behaviour was scored and locomotion behaviour was analysed using automated tracking software (Biobserve). No changes in typical behaviours were observed during stimulation in the home cage (data not shown).
Predator odour avoidance.
Mice were individually housed and dark-adapted before testing. All behaviour testing was performed under dim red light at night. Medical gauze with trimethylthiazoline (50% TMT, 5 μl), or no odour (clean gauze) was placed in the cage. Behaviour was monitored for 10 min during odour exposure.
Heart rate and breathing rate measurements.
Heart rate and breathing rate were recorded at 1 Hz in freely moving mice using a pulse oximeter (MouseOx Plus; Starr Life Sciences). Mice were shaved around the neck to enable the red light to pass through to the detector. Recordings were obtained for 10 min in the home cage with intermittent 1-min periods of blue light stimulation. Data were collected using the MouseOx Plus Conscious Applications Software.
Resident–intruder test.
Behaviour assays were performed under dim red light in the dark cycle. Male mice were housed with a female for >7 days. The female was removed 1 h before testing. Solitary mice were tested twice for aggression with WT 129/Sv socially housed stimulus mice of similar body weight for 10 min. Aggressive behaviours (attack, tail-rattle) and non-aggressive behaviours (sniffing, grooming intruder) were scored.
Open-field test.
Mice were placed in the outer zone of the open-field chamber (50 cm × 50 cm) for 18 min. The 473 nm laser was intermittently turned on and off with 3-min periods. Total time and distance in the centre (36 cm × 36 cm) was analysed using automated tracking software (Biobserve).
Visual cliff.
The visual cliff behaviour was analysed in an open-top Plexiglass chamber. Half of the box was protruded from the counter to provide a 3-foot depth. The same checkerboard pattern was displayed on the countertop and the floor below. A 5-cm high platform was stationed in the middle of the box equally intersecting both the shallow side and the deep side. The mouse was placed on the platform and was allowed to choose between the two sides to step down on. If the mouse stepped down on the shallow side with all four paws, the behaviour choice was designated as shallow. All other behaviour choices (0–3 paws on the shallow side) were designated as deep. Each mouse performed the task five times per day to give a total score of percentage choosing the shallow side.
Sweep behaviour.
Mice were placed in the same chamber as that used for the looming behaviour with a 24-inch LCD monitor stationed on top facing downward to display the sweep stimulus. Mice were given 10 min to habituate to the arena. Then, the sweep stimulus (2.5-cm diameter black disc on a white background, sweeps across the screen in 4 s) was initiated when the mouse was in the centre of the arena. All mice were tested only once owing to the fact that they can habituate to the sweep stimulus even after one trial. The locomotor behaviours of the mice were recorded and analysed automatically with a video tracking system (Biobserve software).
Immunohistochemistry.
After transcardinal perfusion with saline and then 4% paraformaldehyde, brains were collected and postfixed for 24 h. The brains were then transferred to 30% sucrose for cryoprotection and sectioned coronally at 45 μm. If needed, brains were kept at 4 °C overnight with the following anti bodies: rabbit-anti-c-Fos to label active neurons or rabbit-anti-DsRed to enhance the mCherry signal. For secondary detection, Alexa Fluor 488 donkey anti-rabbit or Alexa Fluor 594 donkey anti-rabbit were used. Immunostained tissues were imaged with a Zeiss LSM 880 Airyscan confocal microscope or a Zeiss AxioScan microscope (Zeiss, Germany).
c-Fos induction.
After behaviour assays, the brains were collected for a standard c-Fos induction protocol. For visual threat experiments, mice were exposed to a visual stimulus for 5 min: looming above, below or no looming stimulus.
To analyse the efficiency of viral infection and cell activation or inactivation, a similar c-Fos induction protocol was used. For optogenetic experiments, a train of 5-ms light pulses at 20 Hz over 3 min was delivered. For chemicogenetics, mice were given CNO to induce the appropriate change in neural activity.
Quantification of cell number.
For mice with CAV-Cre injected to the BLA or mPFC and AAV-DIO-hM3D-mCherry into the vMT, we compared the number of mCherry+ cells in the vMT. For c-Fos screens, we compared the number of c-Fos+ cells in the vMT and Xi in control mice and mice that experienced visual threats. After we immunostained the brains with identical protocols, the brains were imaged on an automated slide scanner (Zeiss). A brain map was overlain on the digital image to identify the appropriate regions using landmark structures, white matter tracts, ventricles and optic tract as reference guides. An experimenter blind to condition analysed the images using the automated ImageJ cell counter.
Statistics and reproducibility.
All statistical analyses were performed in R v.3.3.2. (R Development Core Team 2017, https://www.r-project.org/) or GraphPad Prism. The sample sizes were chosen based on common practice in animal behaviour experiments. Data were first tested for normality. If the null hypothesis that the data come from a normal distribution cannot be rejected, parametric tests were used (for example, Student’s t-test, one-way ANOVA with Tukey’s post-hoc test). Otherwise, non-parametric tests were used. Paired tests were used to compare within-group repeated-measures data. Owing to the strong non-normality of the looming behaviour data, generalized linear models (GLMs) with non-normal distributions or non-parametric tests were used for the looming behaviour analysis. All run count data were analysed using a GLM with a Poisson distribution. All tail-rattle count data were analysed using a GLM with a quasi-Poisson distribution because the data were over-dispersed. Freeze, hide and ambulation data did not fit well to regression models, so non-parametric Kruskal–Wallis tests with Dunn’s correction were performed. Percentages of mice and binary data were analysed with a Fisher’s exact test. All statistical tests were two-tailed. Significance levels are indicated as follows: *P < 0.05; **P < 0.01; ***P < 0.001. For representative images, similar results were obtained in at least three independent trials.
Reporting summary.
Further information on experimental design is available in the Nature Research Reporting Summary linked to this paper.
Data availability.
The data that support the finding of this study are available from the corresponding authors upon reasonable request.
Extended Data
Extended Data Fig. 1 |. hM3Dq activates vMT, whereas hM4Di inactivates vMT.
Refers to Figs. 1 and 2. a, Timeline of the c-Fos induction protocol. b–d, Recently active c-Fos+ neurons (green) in the vMT of mice that were exposed to the looming stimulus, with XFP (b), hM4Di (c), or hM3Dq (d) injections (red) into the vMT and CNO delivered intraperitoneally. e, After CNO delivery, hM3Dq increased whereas hM4Di decreased the number of c-Fos+ cells in the vMT relative to XFP controls. Scale bars, 100 μm. Data are mean ± s.e.m. *P < 0.05, ***P < 0.001. See Supplementary Table 1 for statistical analysis and sample sizes.
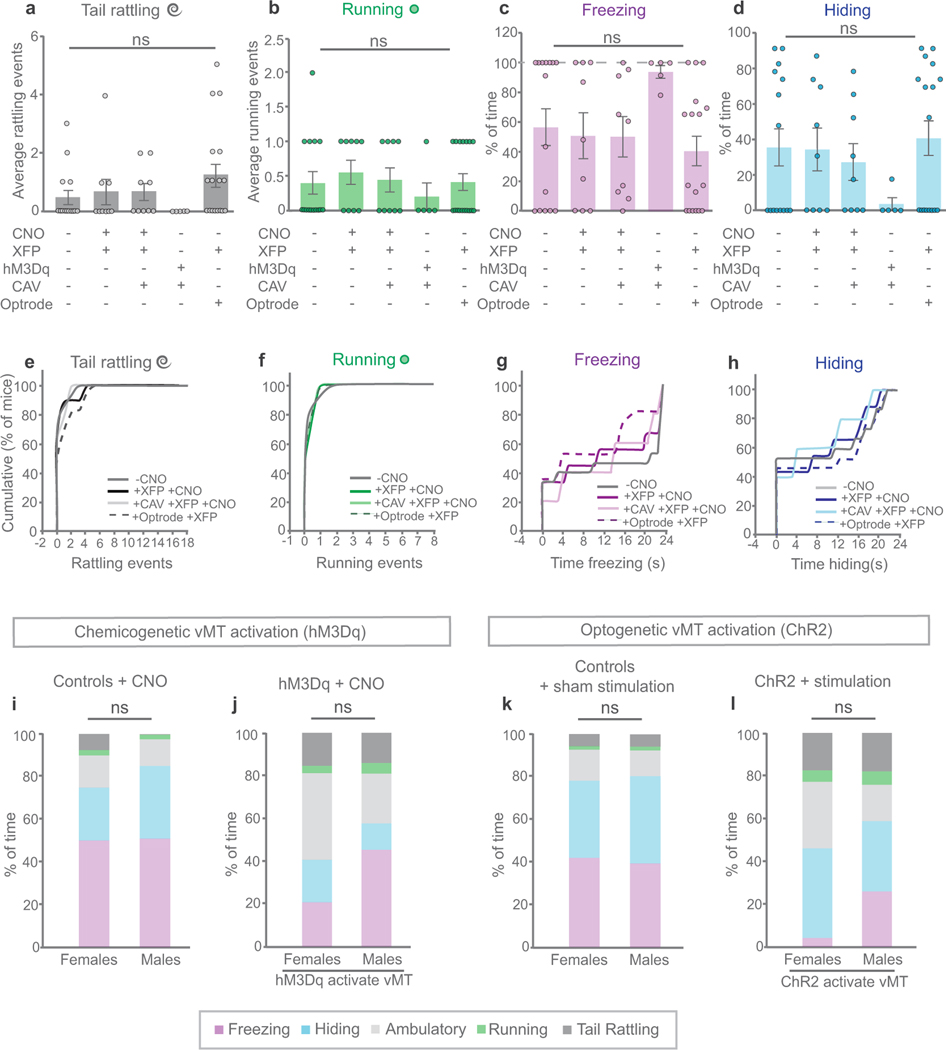
Extended Data Fig. 2 |. Control groups do not differ in their defensive responses to looming threat.
Refers to Figs. 2–4. a–h, Comparison of different control mice reveals no significant differences across any of the behaviours performed in response to the looming threat: tail rattling (a, e), running (b, f), freezing (c, g), or hiding (d, h). Controls include: mice with no treatments; mice with AAV-XFP and CNO; mice with CAV-Cre, AAV-DIO-XFP and CNO; mice with CAV-Cre and AAV-DIO-hM3Dq but without CNO; and mice with AAV-XFP, optrode implant and sham stimulation. i–l, Comparison of male and female control mice (i, k) and mice with vMT activation (j, l) reveals no significant sex differences across any of the behaviours performed in response to the looming threat. Notably, both male and female mice tail-rattle in response to the looming threat. Data are mean ± s.e.m.; NS, not significant. See Supplementary Table 1 for statistical analysis and sample sizes.
Extended Data Fig. 3 |. Activating vMT→NAc does not increase tail rattling or saliency-enhancing behaviours.
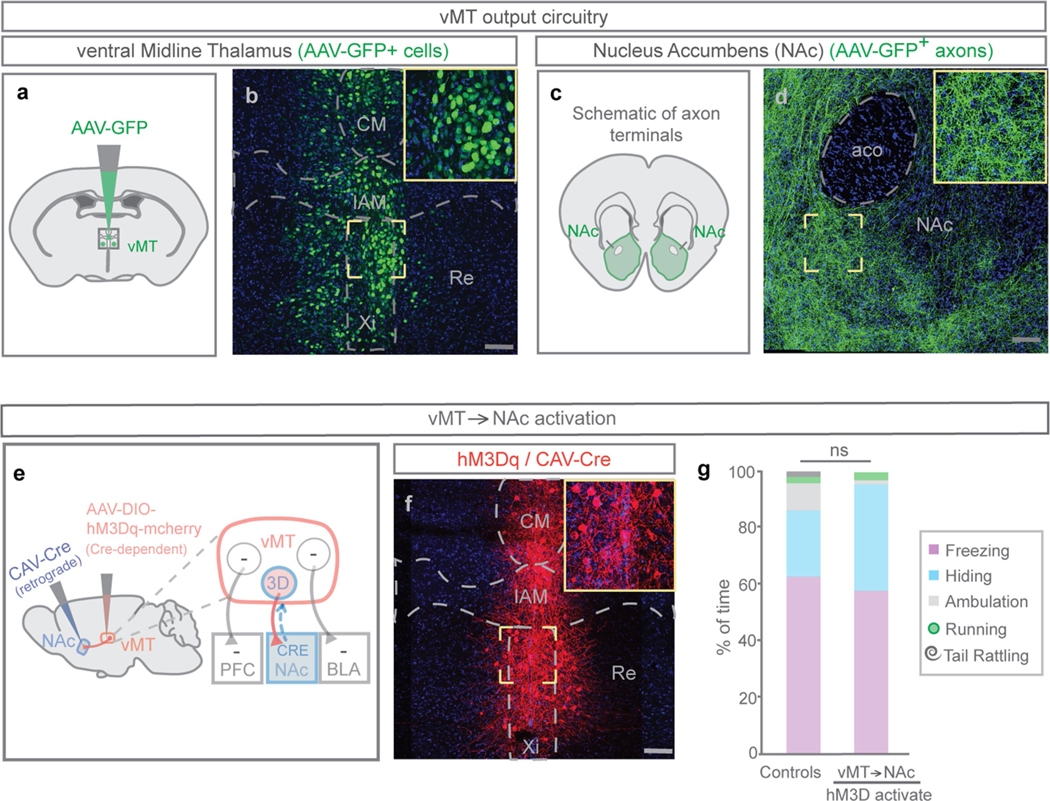
Refers to Fig. 3. a–d, Mice were injected with AAV-GFP in the vMT (n = 17 mice; a, b) and axons were observed in the NAc (c, d). Representative image of GFP+ neurons in the VMT (b) and GFP+ axons in the NAc (d). e, To activate vMT neurons that project to the NAc, CAV-Cre was injected into the NAc and Cre-dependent hM3Dq was injected into the vMT. f, Representative image of hM3Dq+ neurons in the vMT that project to the NAc. g, Activating the vMT→NAc pathway did not significantly change the behavioural responses to looming as compared to controls. Scale bars, 100 μm. Data are mean ± s.e.m.; NS, not significant. See Supplementary Table 1 for statistical analysis and sample sizes.
Extended Data Fig. 4 |. Viral targeting and number of cells infected in the vMT.
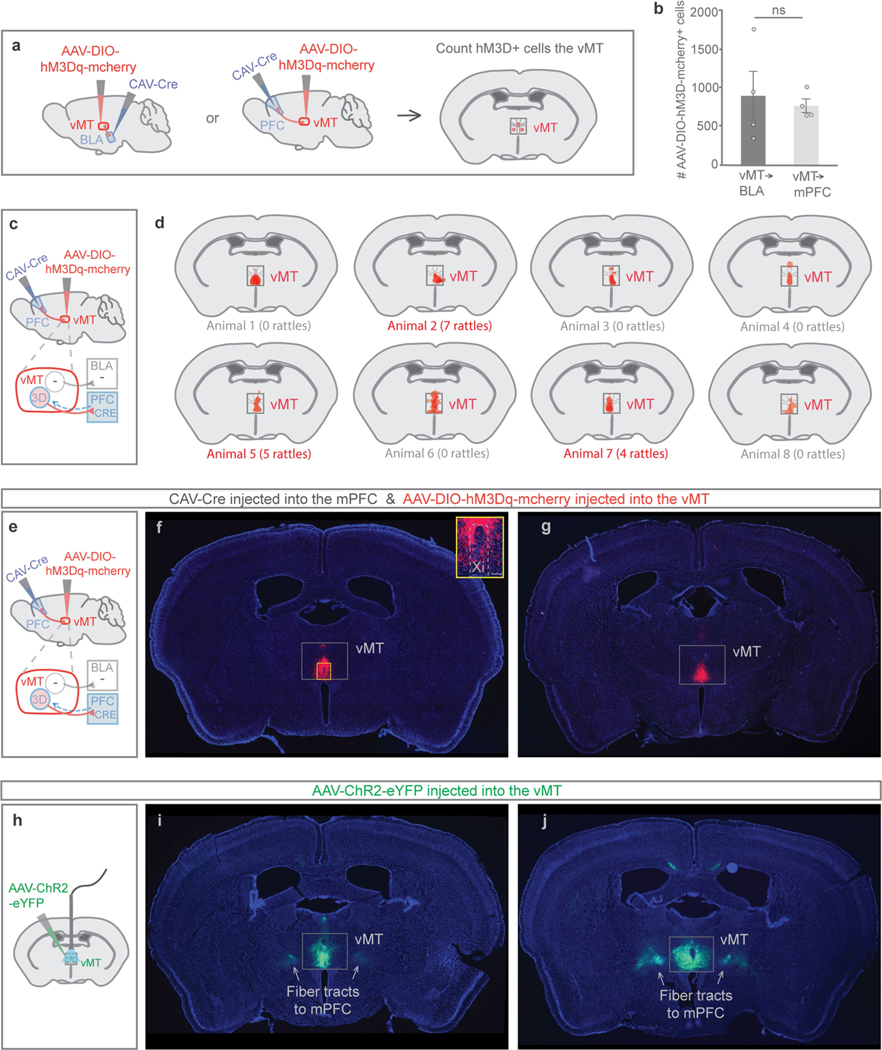
Refers to Figs. 3 and 4. a, To activate vMT neurons that project to the mPFC or the BLA, CAV-Cre was injected into the mPFC or the BLA and Cre-dependent hM3D was injected into the vMT. b, The average number of infected hM3d–mCherry+ vMT cells did not differ between the vMT→BLA and the vMT→mPFC pathway activation groups. c, e, Locations of injections to activate the vMT→mPFC pathway. d, Relative expression of hM3D in vMT→mPFC cells does not scale with tail-rattling behaviour. f, g, Representative images of hM3dq– mCherry/Cre+ neurons (red) in the vMT that project to the mPFC. h, Mice were injected with AAV-ChR2 in the vMT to activate the vMT. i, j, Representative images of ChR2–eYFP+ neurons (green) in the vMT and the fibre tracts composed of vMT axons that project to the mPFC. Data are mean ± s.e.m.; NS, not significant. See Supplementary Table 1 for statistical analysis and sample sizes.
Extended Data Fig. 5 |. vMT activation results in saliency-enhancing behaviours performed in the open arena.
Refers to Figs. 3 and 4. a, Percentage of mice tail-rattling in response to looming after vMT→PFC or vMT→BLA activation. All of the mice with vMT→mPFC optogenetic stimulation displayed tail-rattling behaviour. b, c, Percentage of tail-rattling (b) or running (c) events performed in the open arena as opposed to in the shelter. Mice with vMT→ mPFC optogenetic stimulation perform most tail-rattling and running events in the open. d, Optogenetic activation of the vMT results in most mice tail-rattling. e, Mice with vMT optogenetic stimulation perform most tail-rattling events in the open arena as opposed to in the shelter. f, Mice with vMT optogenetic stimulation perform most running events within the open arena as opposed to towards the shelter. Data are mean ± s.e.m. *P < 0.05, **P < 0.01, ***P < 0.001; NS, not significant. See Supplementary Table 1 for statistical analysis and sample sizes.
Extended Data Fig. 6 |. vMT activation does not change locomotion, aggression or anxiety, but does result in less freezing in response to a predator odour.
Refers to Figs. 4 and 5. a, Mice were injected with AAV-ChR2 in the vMT in order to activate the vMT during presentation of the predator-odour threat. b, Activating the vMT (n = 9 mice) decreased freezing as compared to controls with sham stimulation (n = 7 mice). c, Activating the vMT decreased avoidance as compared to controls with sham stimulation (avoidance index = (P − 50)/50, where P is the percentage of time the mouse spent on the side of the arena away from the odour). d, The visual cliff test. e, Activating the vMT (hM3D + CNO, n = 15 mice) or inactivating the vMT (hM4D + CNO, n = 9) during the visual cliff test did not change the number of times in which the mouse chose the shallow side as compared to control mice (n = 9 mice, P < 0.05). f, The RTPP test. g, Activating the vMT (ChR2, n = 7 mice) did not change the relative activity (distance covered) in the RTPP test as compared to control mice (n = 6 mice). h, Mice were tested on the resident-intruder test for aggressive behaviours. i, Activating the vMT (ChR2, n = 7 mice) did not change the average number of tail-rattling events in the resident-intruder test as compared to control mice (n = 14 mice). j, k, Activating the vMT (ChR2, n = 7 mice) did not change the percentage of mice attacking (j) or the latency to attack (k) in the resident-intruder test as compared to control mice (n = 14 mice). l, Mice were subjected to an open field test to analyse anxiety-related behaviour; representative tracing of a control mouse (AAV-GFP, left) and a mouse with vMT activation (AAV-ChR2, right) in the open field test. m, Activating the vMT (ChR2, n = 10 mice) did not change the percentage of time in the centre of the open field as compared to control mice (n = 10 mice). n, Activating the vMT (ChR2, n = 10 mice) did not change the relative activity (distance covered) in the open field test as compared to control mice (n = 10 mice). Data are mean ± s.e.m. *P < 0.05; NS, not significant. See Supplementary Table 1 for statistical analysis and sample sizes.
Extended Data Fig. 7 |. vMT activation results in increased arousal.
Refers to Fig. 5. a, Schematic of the experimental set-up to analyse light-driven pupillary responses in mice. Treating control mice with CNO did not change pupil size across all light levels. b, Chronic vMT activation by chemicogenetic methods (+CNO) significantly increases pupil size across all light levels as compared to the same mice without activation (−CNO). c, Chronic vMT inactivation (+CNO) did not the change pupil size across all light levels as compared to the same mice without activation (−CNO). d, Schematic of experimental set-up to analyse arousal-driven pupillary responses in mice with vMT activation, mice with vMT inactivation and control mice. The pupil was measured in constant light (100 lx) conditions in mice with and without CNO. e, After CNO delivery, mice with hM3Dq had a significant increase in relative pupil size. Mice with XFP and hM4Di did not have a significant change in pupil size after administration of CNO. f, In constant dark conditions, vMT activation significantly increased pupil size, whereas vMT inactivation did not change pupil size as compared to control mice with CNO. g, In constant dark conditions, optogentic activation of the vMT significantly increased pupil size (n = 11 mice) compared to control mice (n = 12 mice). Data are mean ± s.e.m. *P < 0.05; **P < 0.01; ***P < 0.001; NS, not significant. See Supplementary Table 1 for statistical analysis and sample sizes.
Extended Data Fig. 8 |. Looming stimuli induce vMT activation in naive, but not experienced mice habituated to looms.
Refers to Fig. 6. a, Schematic of the experimental protocol. b, c, Quantification of c-Fos+ cells in the vMT of naive or pre-exposed mice that experienced looming from above revealed a significant decrease in c-Fos+ cells in the vMT (b) and Xi (c) after looming from above in pre-exposed mice that are habituated to the looms (n = 6 mice) as compared to naive mice (n = 7 mice). Data are mean ± s.e.m. **P < 0.01; ***P < 0.001. Supplementary Table 1 for statistical analysis and sample sizes.
Extended Data Fig. 9 |. Tail rattling and running scales with arousal.
Refers to Figs. 4 and 5. a, b, Mice in which ChR2 had been injected into the vMT were divided into three groups based on the extent to which vMT activation increased arousal responses: low, moderate or high (n = 7, n = 9 and n = 10 mice, respectively). Mice with high arousal had significantly more tail-rattling (a) and running (b) events in response to looming, as compared to mice with low arousal (P < 0.001 and P < 0.001). c, d, Mice with high arousal spent similar amounts of time freezing (c) and hiding (d) in response to looming, as compared to mice with low arousal. e, f, 100% of mice with high arousal tail-rattled (e) and ran (f) in response to looming, whereas only 33% and 20% of mice with low arousal tail-rattled and ran, respectively. g, h, Similar numbers of mice with high arousal froze (g) and hid (h) in response to looming as compared to mice with low arousal. Data are mean ± s.e.m. *P < 0.05; **P < 0.01; ***P < 0.001; NS, not significant. See Supplementary Table 1 for statistical analysis and sample sizes.
Extended Data Fig. 10 |. Hindbrain inputs to the vMT.
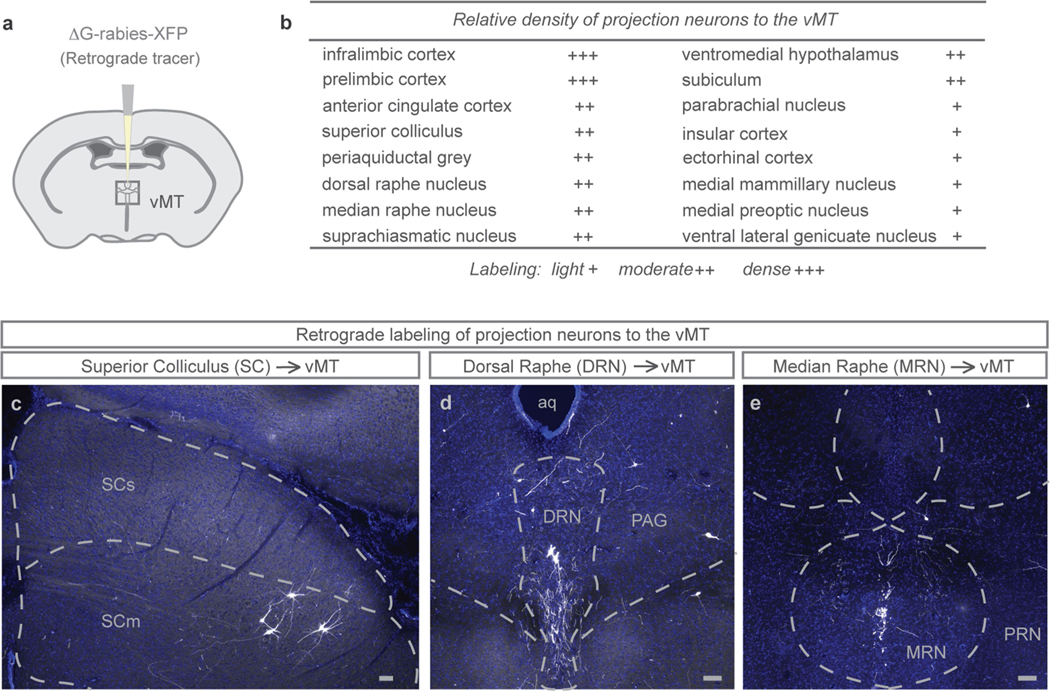
a, Schematic illustration of ΔG-rabies-XFP injection into the vMT to map vMT inputs. b, Quantification of the relative density of projection neurons to the vMT (n = 12 mice). c–e, Representative images showing the expression of ΔG-rabies-XFP in transynaptically labelled cells in the superior colliculus (c), dorsal raphe (d), periaqueductal grey (d), and median raphe (e). DRN, dorsal raphe; MRN, median raphe; PAG, periaqueductal grey; PRN, pontine reticular nucleus; SCm, superior colliculus, motor; SCs, superior colliculus, sensory. Scale bars, 100 μm.
Supplementary Material
Acknowledgements
This work was supported by the National Institutes of Health (NIH) National Eye Institute grant R01 EY022157 (A.D.H.), by NIH U01 NS090562 (A.D.H.) and by a National Science Foundation Graduate Research Fellowship (L.D.S.). We thank L. Giacomo and C. Mallory for advice and assistance with electrophysiology.
Reviewer informationNature thanks D. Lin, H. Shin and the other anonymous reviewer(s) for their contribution to the peer review of this work.
Footnotes
Competing interests The authors declare no competing interests.
Additional information
Extended data is available for this paper at https://doi.org/10.1038/s41586-018-0078-2.
Supplementary information is available for this paper at https://doi.org/10.1038/s41586-018-0078-2.
References
- 1.Yilmaz M. & Meister M. Rapid innate defensive responses of mice to looming visual stimuli. Curr. Biol 23, 2011–2015 (2013). [DOI] [PMC free article] [PubMed] [Google Scholar]
- 2.Fanselow M. & Lester L. in Evolution and Learning (eds Bolles RC & Beecher MD) 185–212 (Lawrence Erlbaum Associates, Hillsdale, 1988). [Google Scholar]
- 3.Eilam D. Die hard: a blend of freezing and fleeing as a dynamic defense—implications for the control of defensive behavior. Neurosci. Biobehav. Rev 29, 1181–1191 (2005). [DOI] [PubMed] [Google Scholar]
- 4.Crawford M. & Masterson FA Species-specific defense reactions and avoidance learning. An evaluative review. Pavlov. J. Biol. Sci 17, 204–214 (1982). [DOI] [PubMed] [Google Scholar]
- 5.Wei P. et al. Processing of visually evoked innate fear by a non-canonical thalamic pathway. Nat. Commun 6, 6756 (2015). [DOI] [PMC free article] [PubMed] [Google Scholar]
- 6.Scott JP Agonistic behavior of mice and rats: a review. Am. Zool 6, 683–701 (1966). [DOI] [PubMed] [Google Scholar]
- 7.Miczek KA, Maxson SC, Fish EW & Faccidomo S. Aggressive behavioral phenotypes in mice. Behav. Brain Res 125, 167–181 (2001). [DOI] [PubMed] [Google Scholar]
- 8.Unger EK et al. Medial amygdalar aromatase neurons regulate aggression in both sexes. Cell Rep. 10, 453–462 (2015). [DOI] [PMC free article] [PubMed] [Google Scholar]
- 9.Lim J-HA et al. Neural activity promotes long-distance, target-specific regeneration of adult retinal axons. Nat. Neurosci 19, 1073–1084 (2016). [DOI] [PMC free article] [PubMed] [Google Scholar]
- 10.Urban DJ & Roth BL DREADDs (designer receptors exclusively activated by designer drugs): chemogenetic tools with therapeutic utility. Annu. Rev. Pharmacol. Toxicol 55, 399–417 (2015). [DOI] [PubMed] [Google Scholar]
- 11.St John RD Genetic analysis of tail rattling in the mouse. Nature 241, 549–551 (1973). [DOI] [PubMed] [Google Scholar]
- 12.Curley JP, Davidson S, Bateson P. & Champagne FA Social enrichment during postnatal development induces transgenerational effects on emotional and reproductive behavior in mice. Front. Behav. Neurosci 3, 25 (2009). [DOI] [PMC free article] [PubMed] [Google Scholar]
- 13.Beilharz RG & Beilharz VC Observations on fighting behaviour of male mice (Mus musculus L.). Z. Tierpsychol. 39, 126–140 (1975). [DOI] [PubMed] [Google Scholar]
- 14.Corcoran KA & Quirk GJ Activity in prelimbic cortex is necessary for the expression of learned, but not innate, fears. J. Neurosci 27, 840–844 (2007). [DOI] [PMC free article] [PubMed] [Google Scholar]
- 15.Adhikari A. et al. Basomedial amygdala mediates top-down control of anxiety and fear. Nature 527, 179–185 (2015). [DOI] [PMC free article] [PubMed] [Google Scholar]
- 16.Martinez RC, Carvalho-Netto EF, Ribeiro-Barbosa ER, Baldo MV & Canteras NS Amygdalar roles during exposure to a live predator and to a predator-associated context. Neuroscience 172, 314–328 (2011). [DOI] [PubMed] [Google Scholar]
- 17.Tye KM et al. Amygdala circuitry mediating reversible and bidirectional control of anxiety. Nature 471, 358–362 (2011). [DOI] [PMC free article] [PubMed] [Google Scholar]
- 18.Weible AP, Piscopo DM, Rothbart MK, Posner MI & Niell CM Rhythmic brain stimulation reduces anxiety-related behavior in a mouse model based on meditation training. Proc. Natl Acad. Sci. USA 114, 2532–2537 (2017). [DOI] [PMC free article] [PubMed] [Google Scholar]
- 19.Junyent F. & Kremer EJ CAV-2—why a canine virus is a neurobiologist’s best friend. Curr. Opin. Pharmacol 24, 86–93 (2015). [DOI] [PubMed] [Google Scholar]
- 20.Boyden ES, Zhang F, Bamberg E, Nagel G. & Deisseroth K. Millisecond-timescale, genetically targeted optical control of neural activity. Nat. Neurosci 8, 1263–1268 (2005). [DOI] [PubMed] [Google Scholar]
- 21.De Franceschi G, Vivattanasarn T, Saleem AB & Solomon SG Vision guides selection of freeze or flight defense strategies in mice. Curr. Biol 26, 2150–2154 (2016). [DOI] [PubMed] [Google Scholar]
- 22.Papes F, Logan DW & Stowers L. The vomeronasal organ mediates interspecies defensive behaviors through detection of protein pheromone homologs. Cell 141, 692–703 (2010). [DOI] [PMC free article] [PubMed] [Google Scholar]
- 23.Root CM, Denny CA, Hen R. & Axel R. The participation of cortical amygdala in innate, odour-driven behaviour. Nature 515, 269–273 (2014). [DOI] [PMC free article] [PubMed] [Google Scholar]
- 24.Lucas RJ, Douglas RH & Foster RG Characterization of an ocular photopigment capable of driving pupillary constriction in mice. Nat. Neurosci 4, 621–626 (2001). [DOI] [PubMed] [Google Scholar]
- 25.McGinley MJ, David SV & McCormick DA Cortical membrane potential signature of optimal states for sensory signal detection. Neuron 87, 179–192 (2015). [DOI] [PMC free article] [PubMed] [Google Scholar]
- 26.Vinck M, Batista-Brito R, Knoblich U. & Cardin JA Arousal and locomotion make distinct contributions to cortical activity patterns and visual encoding. Neuron 86, 740–754 (2015). [DOI] [PMC free article] [PubMed] [Google Scholar]
- 27.Young MJ & Lund RD The anatomical substrates subserving the pupillary light reflex in rats: origin of the consensual pupillary response. Neuroscience 62, 481–496 (1994). [DOI] [PubMed] [Google Scholar]
- 28.Morel A, Magnin M. & Jeanmonod D. Multiarchitectonic and stereotactic atlas of the human thalamus. J. Comp. Neurol 387, 588–630 (1997). [DOI] [PubMed] [Google Scholar]
- 29.Heath RG Electrical self-stimulation of the brain in man. Am. J. Psychiatry 120, 571–577 (1963). [DOI] [PubMed] [Google Scholar]
- 30.Bishop MP, Elder ST & Heath RG Intracranial self-stimulation in man. Science 140, 394–396 (1963). [DOI] [PubMed] [Google Scholar]
- 31.Krout KE, Loewy AD, Westby GW & Redgrave P. Superior colliculus projections to midline and intralaminar thalamic nuclei of the rat. J. Comp. Neurol 431, 198–216 (2001). [DOI] [PubMed] [Google Scholar]
- 32.Vertes RP & Martin GF Autoradiographic analysis of ascending projections from the pontine and mesencephalic reticular formation and the median raphe nucleus in the rat. J. Comp. Neurol 275, 511–541 (1988). [DOI] [PubMed] [Google Scholar]
- 33.Van der Werf YD, Witter MP & Groenewegen HJ The intralaminar and midline nuclei of the thalamus. Anatomical and functional evidence for participation in processes of arousal and awareness. Brain Res. Rev 39, 107–140 (2002). [DOI] [PubMed] [Google Scholar]
- 34.Stuber GD et al. Excitatory transmission from the amygdala to nucleus accumbens facilitates reward seeking. Nature 475, 377–380 (2011). [DOI] [PMC free article] [PubMed] [Google Scholar]
- 35.Gross CT & Canteras NS The many paths to fear. Nat. Rev. Neurosci 13, 651–658 (2012). [DOI] [PubMed] [Google Scholar]
- 36.Lin D. et al. Functional identification of an aggression locus in the mouse hypothalamus. Nature 470, 221–226 (2011). [DOI] [PMC free article] [PubMed] [Google Scholar]
Associated Data
This section collects any data citations, data availability statements, or supplementary materials included in this article.
Supplementary Materials
Data Availability Statement
The data that support the finding of this study are available from the corresponding authors upon reasonable request.


