Abstract
Resting-state functional MRI (rsfMRI) provides important information for studying and mapping the activities and functions of the brain. Conventionally, rsfMRIs are often registered to structural images in the Euclidean space without considering cortical surface geometry. Meanwhile, a surface-based representation offers a relaxed coordinate chart, but this still requires surface registration for group-wise data analysis. In this work, we investigate the performance of two existing surface registration methods in a surface-based rsfMRI analysis framework: FreeSurfer and Hierarchical Spherical Deformation (HSD). To minimize registration bias, we establish shape correspondence using both methods in a group-wise manner that estimates the unbiased average of a given cohort. To evaluate their performance, we focus on neuroanatomical alignment as well as the amount of distortion that can potentially bias surface tessellation for secondary level rsfMRI data analyses. In the pilot analysis, we examine a single timepoint of imaging data from 100 subjects out of an aging cohort. Overall, HSD establishes improved shape correspondence with reduced mean curvature deviation (10.94% less on average per subject, paired t-test: p <10−10) and reduced registration distortion (FreeSurfer: average 41.91% distortion per subject, HSD: 18.63%, paired t-test: p <10−10). Furthermore, HSD introduces less distortion than FreeSurfer in the areas identified in the individual components that were extracted by surface-based independent component analysis (ICA) after spatial smoothing and time series normalization. Consequently, we show that FreeSurfer capture individual components with globally similar but locally different patterns in ICA in visual inspection.
Keywords: group-wise registration, distortion, fMRI, rsfMRI, group ICA
1. INTRODUCTION
Resting-state fMRI (rsfMRI) provides a non-invasive method for studying the brain in a task-negative state. It has been extensively used to investigate mapping of functional organizations and connectivity in neurodevelopment or aging and disease-related research (e.g., Alzheimer’s disease, autism spectrum disorder, etc.)1–4. Given its overall effectiveness and successes, one of the potential challenges faced by this volumetric approach is the highly convoluted folds of the cortex. Thus, their representation in Euclidean space cannot fully encode geodesics along cortical geometry. For example, volumetric spatial smoothing, a standard preprocessing for rsfMRI analyses, could mix up time series signals between two gyri (or sulci) that might be functionally distinct5–7. With advances in cortical surface reconstruction, pioneering studies proposed surface-based rsfMRI analysis frameworks5,8,9 that circumvent volumetric representations. Such frameworks generally involve surface registrations for spatial alignment. Considering the potential influence of analytical variability and flexibility on the conclusions of fMRI analyses10, the performance of surface registration has not been fully investigated with respect to how the choices in surface-based registration affect rsfMRI data analysis.
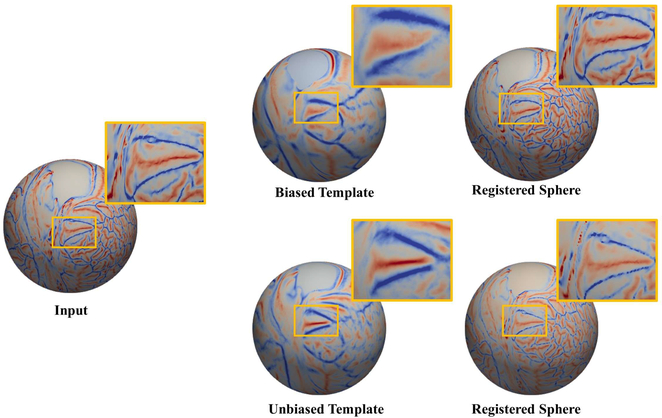
Surface registration optimally aligns one or multiple cortical surfaces to a target surface. Of many different registration approaches, spherical registration11–19 is widely used due to its simple parametrization without violation of the spherical topology of the cortex. In many cortical surface-based shape analyses20–23, surface registration generally optimizes shape correspondence to a specific template. Despite its popularity, such a pair-wise approach often introduces a bias in the template choice. More specifically, such dependence on a single reference could introduce large registration distortion due to neuroanatomical variability specifically computed in the chosen template. This distortion can consequently influence surface area changes that yield distorted surface tessellation for the secondary level data analysis; sampling of the surface data is biased with respect to the surface area distortion as shown in Figure 1. Therefore, group-wise (or template-free) spherical registration11,24–26 can offer a more plausible solution for an rsfMRI data analysis to minimize the influence of the template choice.
Figure 1:
Importance of reduced bias in the template choice. In the zoomed-in region, a biased template (e.g., a template that does not represent the subject well) can be more likely to expand (distort) the original area than a well-picked (or study specific) template. The sulcus in the zoomed-in region becomes wider with the biased template because the cohort used in this template has different gyral patterns from those of the input, which results in the expansion of the sulcal region of the input. Depending on the template choice, the secondary level data analysis can be affected by distorted surface areas.
In this paper, we evaluate the performance of two group-wise registration methods in a surface-based rsfMRI framework: FreeSurfer and Hierarchical Spherical Deformation (HSD). We focus on those methods since FreeSurfer registration is widely used in many surface-based analyses and HSD minimizes registration distortion while optimizing global rigid alignment and local non-rigid deformation simultaneously. Motivated by our recent validation of surface registration methods19, we evaluate performance in terms of neuroanatomical feature alignment (deviation from mean curvature) and registration distortion (triangle area change) achieved by these two methods. Unlike our recent work on an adult cohort with FreeSurfer surface reconstruction, we focus on an elderly cohort with MaCRUISE surface reconstruction27. To evaluate the impact of these methods on functional interpretation, we conduct spatial independent component analysis (ICA) on rsfMRI data via the established correspondence using the two methods. We show that individual components (networks) extracted by ICA based on the two registration methods, despite a general similarity in terms of overall patterns, show visible local differences quantitatively and qualitatively in the areas identified in the components captured by ICA.
2. METHODS
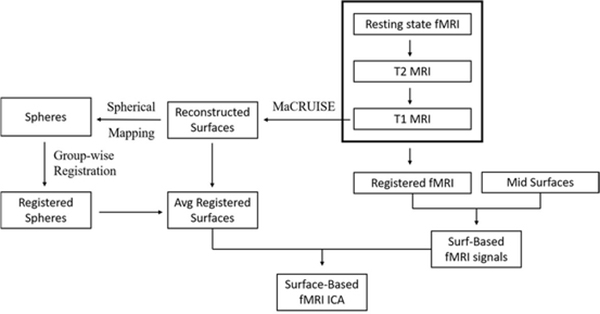
Herein, we present a general description of our surface-based rsfMRI analysis pipelines with group-wise registration (see Figure 2) and evaluation criteria for both registration methods.
Figure 2:
A schematic overview of our pipelines. The full pipelines are divided into two parts: group-wise registrations to obtain a group template for surfaces and mapping of fMRI signals onto surfaces.
2.1. Preprocessing
Cortical surfaces were reconstructed from T1-weighted magnetic resonance (MR) images using MaCRUISE27 and each hemisphere was mapped onto a sphere2. We visually inspected the original scans and their reconstructed surfaces. To map the volumetric data of rsfMRI onto cortical surfaces, we first computed the temporal average of raw rsfMRI volumes of each subject and aligned it to its T2-weighted MR image. We then computed the affine transformations from the temporal average to T2-weighted images and from T2-weighted to T1-weighted images. Once the two transformation matrices were obtained, we determined the direct transformation from rsfMRI to its T1-weighted image. Since the cortical surfaces were generated using native T1-weighted images, we computed the closest voxels that contain vertices of the cortical surfaces. However, the reconstructed cortical surfaces do not necessarily guarantee unique voxel-to-vertex matching (normally, more than one vertex belongs to a single voxel) even if they perfectly trace the white- and gray-matter boundary. This potentially degenerates vertex-to-voxel mapping without a voxel-wise resampling scheme. Therefore, the probability of a given vertex was obtained by tri-linear resampling of the associated voxel for sub-voxel accuracy.
2.2. Surface Registration Methods
Group-wise registration allows a correspondence across more than two images while avoiding the need for a fixed reference image or template16,24,29. As discussed, we focus on group-wise surface registration to reduce the potential bias of rsfMRI data processing caused by selecting a specific surface template. In this work, we use the following methods: FreeSurfer28 and Hierarchical Spherical Deformation (HSD)19. For fair comparisons, we use the same set of cortical features as registration metrics in a coarse-to-fine resolution (this is also known as optimal features in the two pipelines): mean curvature of the inflated surfaces, sulcal depth (or average convexity) of the cortical surfaces, and mean curvature of the cortical surfaces11,16,19. These features support global agreements with mean curvature of the inflated surfaces and local agreement with finer features. This approach also helps to prevent the registration from being trapped in local optima 11,16,19.
Although FreeSurfer’s registration is generally designed for pair-wise registration to its specific template, the software supports a group-wise pipeline*. In brief, the first round of the registration process starts by selecting a reference subject as the initial template (group representative), to which all subjects are rigidly registered for global alignments of the whole data. All registered subjects are then used as the input to produce a second template by aligning the cortical features. The registration process is iterative and gradually refines the template until the process converges. Since an arbitrary reference must be chosen as the starting point, the orientation of the resultant template will be dependent on that first choice, but in theory, the representative shape remains the same regardless of that choice. In our experiments, three iterations of this process were sufficient for convergence.
In HSD, we use a multi-resolution approach to optimize the aforementioned four different geometric features as suggested in the original paper19. Briefly, we resample cortical features via icosahedral subdivision to different levels of resolution ranging from 2,562 vertices to 163,842 vertices from the original cortical surface mesh that normally consists of around 160k vertices. At each level, the method optimizes rigid to non-rigid deformation, which gradually refines the group representative while keeping distortion as low as possible. As both rigid and non-rigid deformation are updated simultaneously, the method does not require an iterative registration process (see Lyu et al.19 2019 for details). Hence, we establish a shape correspondence in a single pass. Note that the parameters of HSD were not tunned specifically for the dataset used in this paper. We did, however, follow suggested FreeSurfer’s and HSD’s parameters for healthy controls19,28.
2.3. Surface-Based Group fMRI ICA
Surface-based fMRI signals were represented as vertex-based scalar maps. Spatial smoothing was performed on the cortical surfaces with a standard Gaussian kernel (full width at half maximum=6 mm), and time-series standard normalization was conducted separately for each subject. Then, the rsfMRI data on the surfaces were resampled using registered spheres from FreeSurfer’s and HSD’s registration results with respect to a tessellation of spherical mesh via icosahedral subdivision (10,242 vertices). We performed temporal concatenation of the surface data, followed by independent component analysis (ICA) after temporal dimension reduction using principal component analysis (PCA)30 to 30. We chose known patterns that are commonly observed in both left and right hemispheres and then threshold identified patterns to exclude weak (noisy) signals.
2.4. Evaluation Criteria
In our evaluation of the performance of FreeSurfer and HSD, we considered two metrics: vertex-wise deviation from mean curvature and triangle area distortion. For neuroanatomical alignment, we standardized the mean curvature map of each subject individually via z-score normalization as mean curvature depends on the scale of the surfaces. We then re-tessellated the mean curvature maps to the respective registered spheres. An average mean curvature map was computed from all re-tessellated maps. Finally, we computed the squared distance between the resampled individual map and the average, which captures the deviation from the group representative. Formally, the vertex-wise deviation can be written as:
| (1) |
where N is the total number of subjects, h is the normalized mean curvature, and h is the average mean curvature across N subjects. To measure registration distortion, we measure area distortion as the exponential absolute log ratio between triangle area before and after registration given by:
| (2) |
where Δh and Δg are the triangle area before and after registration, respectively. This metric captures the portion of area distortion starting from 0 (no distortion). We excluded vertices in the artificial separation between the left and right hemispheres.
3. RESULTS
3.1. Data Acquisition
A subset of the Baltimore Longitudinal Study of Aging (BLSA) dataset31,32 was used for our experiments. MRI imaging was acquired on a 3T scanner (Philips, Achieva), using an 8-channel head coil. Structural MRI images were acquired using a three-dimensional T1-weighted MPRAGE (magnetization prepared rapid gradient-echo imaging) sequence with 170 slices (TR/TE/TI= 6.8/3.2/845.7msec, FA=8°, FOV=192×256×256mm3, resolution=1.2×1×1mm3). A dual-echo sequence was used to collect a T2-weighted image that was coplanar to the functional scans and consisted of approximately 50 slices (voxel size, 0.94×0.94×3.00mm3; in-plane matrix size, 240×210; TR=3s; TE=8ms; FA=90°). The parameters of the echoplanar imaging (EPI) resting-state fMRI were: TR/TE=2000/30msec, flip angle=75°, FOV=240×240mm2, spatial resolution=3×3×4mm3, 37 slices covering the whole cerebrum; 180 volumes were acquired over 6 minutes. Participants were instructed to remain still with eyes open and focused on a fixation point. The resting state scan was the first functional sequence in the scanning session. Quality assurance (QA) was performed after surface reconstruction and spherical mapping in order to exclude subjects whose surface reconstruction failed. As a preliminary study, 100 scan sessions were chosen from 100 random unique subjects (one session per subject). These 100 subjects were then used as input data for our pipelines.
3.2. Registration Evaluation
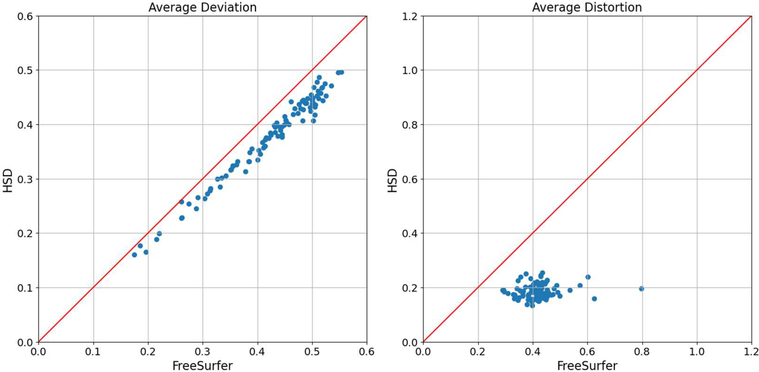
The feature alignment can be reduced by registration methods as small as possible, which often increases area distortion simultaneously. To demonstrate the potential influence of distortion and the trade-off between feature alignment and area distortion, we computed the mean curvature alignment after FreeSurfer and HSD as shown in Figure 3. Overall HSD provides a template with slightly sharper mean, establishes better feature alignment in terms of curvature deviation, and maintains a lower level of registration distortion. Figure 4 illustrates the global deviation per subject achieved by the two registration methods with significant distortion improvement of HSD over FreeSurfer. The average vertex-wise deviation displays a generally linear trend with a strong linear correlation between the two methods (r=0.988). This implies that the two registration methods estimate similar average cortical folding patterns, in which the cortical feature alignment introduces similar matching errors. The slope is slightly lower than one, indicating that HSD reduced more errors (deviation) in feature alignment than FreeSurfer. We also observe greater spread for FreeSurfer in average distortion, suggesting that HSD achieves a notably lower and more stable level of registration distortion. Indeed, after performing paired t-test of both metrics (p<10−10), we see significantly lower deviation and registration distortion when using HSD versus FreeSurfer.
Figure 3:
Visualization of features after registration mapped on to average registered inflated white matter surfaces (left hemisphere). Generally, mean curvature alignment and its deviation in both methods show similar global patterns, but locally, HSD has more concentrated and pronounced mean curvature alignment, narrower deviation patterns, and overall maintains lower registration distortion as displayed (zoomed-in boxes) in the central sulcus (left) and the cingulate sulcus (right).
Figure 4:
Scatter plots for average vertex-wise deviation per subject (left) and average triangular distortion (exponential absolute log ratio) per subject (right). Each dot represents an individual subject from the 100 subjects selected for our processing. Vertex-wise deviation shows a strong linear correlation with overall improved performance, whereas wider distribution of the area distortion in FreeSurfer is observed. This indicates that FreeSurfer and HSD achieves comparable performance in feature alignment, while HSD maintains a significantly lower level of registration distortion than FreeSurfer.
3.3. Surface-based rsfMRI ICA
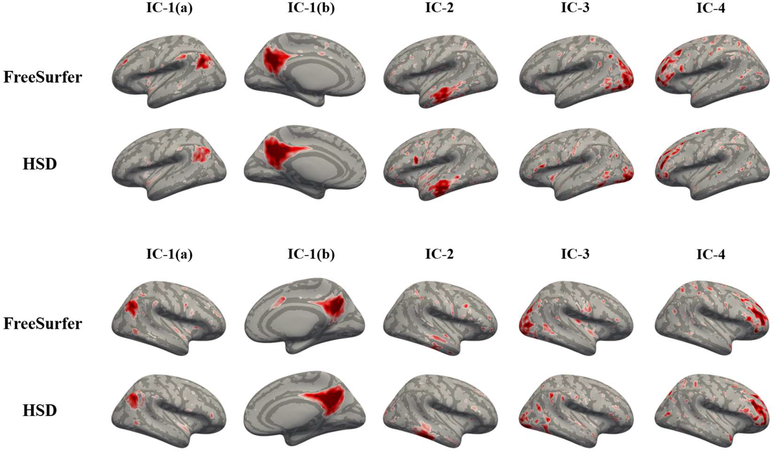
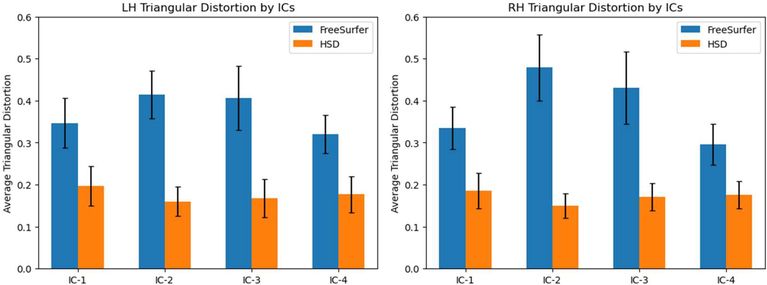
To explore the effects of registration distortion on secondary level analysis, we inspected the individual components extracted by two separate ICA based on the same surface-based rsfMRI signals. We chose the four components that have apparent spatial patterns and appear in both hemispheres. In qualitative evaluation, we found both methods capture similar global patterns. However, owing to registration distortion, there are discernible local dissimilarities (Figure 5). For example, in the first component (IC-1), using HSD resulted in greater spread over the parietal lobe when compared to the first component when using FreeSurfer. These differences are likely due to differing amounts of registration distortion introduced by the two methods. For quantitative investigation, we projected the detected components back to the individual surfaces, and measured the average area distortion per component. As expected, the statistics show significantly large distortion of each component (p<10−10) after paired t-test of each component with multi-comparison correction by false discovery rate33 (q=0.05) as displayed in Figure 6.
Figure 5:
Visual assessment of top 4 independent components identified in rsfMRI by surface-based ICA. Top: left hemisphere, bottom: right hemisphere. The components generally appear similar but their local patterns are different. IC-1(b) captured by HSD is more dispersed over the parietal lobe than that by FreeSurfer; IC-4 captured by HSD is more concentrated along frontal sulcus than that by FreeSurfer. This discrepancy is possibly due to registration distortion, by which surface tessellation shrinks/expands cortical area.
Figure 6:
Average distortion in activated regions in each individual component. The black error bars are standard deviations across 100 subjects. Paired sample t-tests were conducted for each component from both hemispheres with multi-comparison correction by FDR (q=0.05). HSD achieves a lower level of registration distortion across all individual components in both hemispheres than FreeSurfer (p<10−10). This suggests the locally different patterns as shown in Figure 5.
4. CONCLUSIONS
In this work, we compared the performance of FreeSurfer’s group-wise registration and Hierarchical Spherical Deformation (HSD) for a surface-based rsfMRI analysis framework. We showed that HSD establishes a better shape correspondence in terms of neuroanatomical feature alignment, maintains lower registration distortion overall, and results in lower curvature deviation. We showed that the global deviation per subject achieved by the two methods has a strong correlation with improved feature alignment in HSD, while global distortion tends to vary more widely in FreeSurfer. Moreover, due to the different levels of registration distortion achieved by the two methods, the components (networks) extracted by surface-based rsfMRI ICA yielded globally similar patterns but with local differences in the brain areas comprising the components. Quantitative investigation showed the HSD method resulted in significantly lower amounts of distortion within the areas of each component. These results suggest that when using surface-based registration, differences in the amount of registration-based distortion may influence second-level rsfMRI data analyses.
ACKNOWLEDGMENTS
This research was conducted with support from the Intramural Research Program, National Institute on Aging, National Institutes of Health (NIH). This work was supported in part by NIH under Grants R01EB017230 and MH102246 and by the National Science Foundation under Grant CAREER IIS 1452485. This study was in part using the resources of the Advanced Computing Center for Research and Education (ACCRE) at Vanderbilt University, Nashville, TN. This project was supported in part by the National Center for Research Resources, Grant UL1 RR024975-01, and is now at the National Center for Advancing Translational Sciences, Grant 2 UL1 TR000445-06.
Footnotes
REFERENCES
- [1].Rudie JD, Brown JA, Beck-Pancer D, Hernandez LM, Dennis EL, Thompson PM, Bookheimer SY and Dapretto M, “Altered functional and structural brain network organization in autism,” NeuroImage Clin. 2, 79–94 (2013). [DOI] [PMC free article] [PubMed] [Google Scholar]
- [2].Handwerker DA, Roopchansingh V, Gonzalez-Castillo J and Bandettini PA, “Periodic changes in fMRI connectivity,” Neuroimage 63(3), 1712–1719 (2012). [DOI] [PMC free article] [PubMed] [Google Scholar]
- [3].Ferreira LK and Busatto GF, “Resting-state functional connectivity in normal brain aging,” Neurosci. Biobehav. Rev. 37(3), 384–400 (2013). [DOI] [PubMed] [Google Scholar]
- [4].Dennis EL and Thompson PM, “Functional brain connectivity using fMRI in aging and Alzheimer’s disease,” Neuropsychol. Rev. (2014). [DOI] [PMC free article] [PubMed] [Google Scholar]
- [5].Brodoehl S, Gaser C, Dahnke R, Witte OW and Klingner CM, “Surface-based analysis increases the specificity of cortical activation patterns and connectivity results,” Sci. Rep. 10(1) (2020). [DOI] [PMC free article] [PubMed] [Google Scholar]
- [6].Power JD, Cohen AL, Nelson SM, Wig GS, Barnes KA, Church JA, Vogel AC, Laumann TO, Miezin FM, Schlaggar BL and Petersen SE, “Functional Network Organization of the Human Brain,” Neuron (2011). [DOI] [PMC free article] [PubMed] [Google Scholar]
- [7].Wig GS, Laumann TO and Petersen SE, “An approach for parcellating human cortical areas using resting-state correlations.,” Neuroimage 93 Pt 2, 276–291 (2014). [DOI] [PMC free article] [PubMed] [Google Scholar]
- [8].Anticevic A, Dierker DL, Gillespie SK, Repovs G, Csernansky JG, Van Essen DC and Barch DM, “Comparing surface-based and volume-based analyses of functional neuroimaging data in patients with schizophrenia,” Neuroimage 41(3), 835–848 (2008). [DOI] [PMC free article] [PubMed] [Google Scholar]
- [9].Jo HJ, Lee JM, Chee YJ, Kim IY and Kim SI, “Volume- and surface-based fMRI analysis; Geometric influence of smoothing kernel,” Proc. 3rd Int. IEEE EMBS Conf. Neural Eng., 261–264 (2007). [Google Scholar]
- [10].Botvinik-Nezer R, Holzmeister F, Camerer CF, Dreber A, Huber J, Johannesson M, Kirchler M, Iwanir R, Mumford JA, Adcock RA, Avesani P, Baczkowski BM, Bajracharya A, Bakst L, Ball S, Barilari M, Bault N, Beaton D, Beitner J, et al. , “Variability in the analysis of a single neuroimaging dataset by many teams,” Nature 582(7810), 84–88 (2020). [DOI] [PMC free article] [PubMed] [Google Scholar]
- [11].Fischl B, Sereno MI, Tootell RBH and Dale AM, “High-resolution intersubject averaging and a coordinate system for the cortical surface,” Hum. Brain Mapp. (1999). [DOI] [PMC free article] [PubMed] [Google Scholar]
- [12].Tao X, Prince JL and Davatzikos C, “Using a statistical shape model to extract sulcal curves on the outer cortex of the human brain.,” IEEE Trans. Med. Imaging 21(5), 513–524 (2002). [DOI] [PubMed] [Google Scholar]
- [13].Glaunès J, Vaillant M and Miller MI, “Landmark Matching via Large Deformation Diffeomorphisms on the Sphere,” J. Math. Imaging Vis. 20(1), 179–200 (2004). [Google Scholar]
- [14].Robbins S, Evans AC, Collins DL and Whitesides S, “Tuning and comparing spatial normalization methods,” Med. Image Anal. 8(3), 311–323 (2004). [DOI] [PubMed] [Google Scholar]
- [15].Van Essen DC, “A Population-Average, Landmark- and Surface-based (PALS) atlas of human cerebral cortex,” Neuroimage 28(3), 635–662 (2005). [DOI] [PubMed] [Google Scholar]
- [16].Yeo BTT, Sabuncu MR, Vercauteren T, Ayache N, Fischl B and Golland P, “Spherical demons: Fast diffeomorphic landmark-free surface registration,” IEEE Trans. Med. Imaging (2010). [DOI] [PMC free article] [PubMed] [Google Scholar]
- [17].Choi PT, Lam KC and Lui LM, “FLASH: Fast landmark aligned spherical harmonic parameterization for genus-0 closed brain surfaces,” SIAM J. Imaging Sci. (2015). [Google Scholar]
- [18].Robinson EC, Garcia K, Glasser MF, Chen Z, Coalson TS, Makropoulos A, Bozek J, Wright R, Schuh A, Webster M, Hutter J, Price A, Cordero Grande L, Hughes E, Tusor N, Bayly PV, Van Essen DC, Smith SM, Edwards AD, et al. , “Multimodal surface matching with higher-order smoothness constraints,” Neuroimage 167, 453–465 (2018). [DOI] [PMC free article] [PubMed] [Google Scholar]
- [19].Lyu I, Kang H, Woodward ND, Styner MA and Landman BA, “Hierarchical spherical deformation for cortical surface registration,” Med. Image Anal. 57, 72–88 (2019). [DOI] [PMC free article] [PubMed] [Google Scholar]
- [20].Kim SH, Lyu I, Fonov VS, Vachet C, Hazlett HC, Smith RG, Piven J, Dager SR, Mckinstry RC, Pruett JR, Evans AC, Collins DL, Botteron KN, Schultz RT, Gerig G and Styner MA, “Development of cortical shape in the human brain from 6 to 24months of age via a novel measure of shape complexity,” Neuroimage 135, 163–176 (2016). [DOI] [PMC free article] [PubMed] [Google Scholar]
- [21].Luders E, Narr KL, Thompson PM, Rex DE, Jancke L, Steinmetz H and Toga AW, “Gender differences in cortical complexity,” Nat. Neurosci. 7(8), 799–800 (2004). [DOI] [PubMed] [Google Scholar]
- [22].Gaser C, Luders E, Thompson PM, Lee AD, Dutton RA, Geaga JA, Hayashi KM, Bellugi U, Galaburda AM, Korenberg JR, Mills DL, Toga AW and Reiss AL, “Increased local gyrification mapped in Williams syndrome,” Neuroimage (2006). [DOI] [PubMed] [Google Scholar]
- [23].Lyu I, Kim SH, Girault JB, Gilmore JH and Styner MA, “A cortical shape-adaptive approach to local gyrification index,” Med. Image Anal. (2018). [DOI] [PMC free article] [PubMed] [Google Scholar]
- [24].Lyttelton O, Boucher M, Robbins S and Evans A, “An unbiased iterative group registration template for cortical surface analysis,” Neuroimage (2007). [DOI] [PubMed] [Google Scholar]
- [25].Lyu I, Kim SH, Seong JK, Yoo SW, Evans A, Shi Y, Sanchez M, Niethammer M and Styner MA, “Robust estimation of group-wise cortical correspondence with an application to macaque and human neuroimaging studies,” Front. Neurosci. (2015). [DOI] [PMC free article] [PubMed] [Google Scholar]
- [26].Lyu I, Kim SH, Seong J-K, Yoo SW, Evans AC, Shi Y, Sanchez M, Niethammer M and Styner MA, “Group-wise cortical correspondence via sulcal curve-constrained entropy minimization.,” Inf. Process. Med. Imaging 23, 364–375 (2013). [DOI] [PMC free article] [PubMed] [Google Scholar]
- [27].Huo Y, Plassard AJ, Carass A, Resnick SM, Pham DL, Prince JL and Landman BA, “Consistent cortical reconstruction and multi-atlas brain segmentation,” Neuroimage (2016). [DOI] [PMC free article] [PubMed] [Google Scholar]
- [28].Dale AM, Fischl B and Sereno MI, “Cortical surface-based analysis: I. Segmentation and surface reconstruction,” Neuroimage (1999). [DOI] [PubMed] [Google Scholar]
- [29].Guyader JM, Huizinga W, Poot DHJ, van Kranenburg M, Uitterdijk A, Niessen WJ and Klein S, “Groupwise image registration based on a total correlation dissimilarity measure for quantitative MRI and dynamic imaging data,” Sci. Rep. (2018). [DOI] [PMC free article] [PubMed] [Google Scholar]
- [30].Smith SM, Hyvärinen A, Varoquaux G, Miller KL and Beckmann CF, “Group-PCA for very large fMRI datasets,” Neuroimage 101, 738–749 (2014). [DOI] [PMC free article] [PubMed] [Google Scholar]
- [31].Armstrong NM, An Y, Beason-Held L, Doshi J, Erus G, Ferrucci L, Davatzikos C and Resnick SM, “Predictors of neurodegeneration differ between cognitively normal and subsequently impaired older adults,” Neurobiol. Aging (2019). [DOI] [PMC free article] [PubMed] [Google Scholar]
- [32].Resnick SM, Pham DL, Kraut MA, Zonderman AB and Davatzikos C, “Longitudinal magnetic resonance imaging studies of older adults: A shrinking brain,” J. Neurosci. (2003). [DOI] [PMC free article] [PubMed] [Google Scholar]
- [33].Benjamini Y and Hochberg Y, “Controlling the False Discovery Rate: A Practical and Powerful Approach to Multiple Testing,” J. R. Stat. Soc. Ser. B (1995). [Google Scholar]


