

Abstract
OBJECTIVE:
Early antibiotic administration is a central component of sepsis guidelines and delays may increase mortality. However, prior studies have examined the delay to first antibiotic administration as a single time period even though it contains two distinct processes: antibiotic ordering and antibiotic delivery, which can each be targeted for improvement through different interventions. The objective of this study was to characterize and compare patients who experienced order or delivery delays, investigate the association of each delay type with mortality, and identify novel patient subphenotypes with elevated risk of harm from delays.
DESIGN:
Retrospective analysis of multicenter inpatient data
SETTING:
Two tertiary care medical centers (2008–2018, 2006–2017) and four community-based hospitals (2008–2017)
PATIENTS:
All patients admitted through the emergency department who met clinical criteria for infection
INTERVENTIONS:
None
MEASUREMENTS AND MAIN RESULTS:
Patient demographics, vitals, laboratory values, medication order and administration times, and in-hospital survival data were obtained from the electronic health record. Order and delivery delays were calculated for each admission. Adjusted logistic regression models were used to examine the relationship between each delay and in-hospital mortality. Causal forests, a machine learning method, was used to identify a high-risk subgroup. A total of 60,817 admissions were included, and delays occurred in 58% of patients. Each additional hour of order delay (OR 1.04; 95% CI 1.03–1.05) and delivery delay (OR 1.05; 95% CI 1.02–1.08) was associated with increased mortality. A patient subgroup identified by causal forests with higher co-morbidity burden, greater organ dysfunction, and abnormal initial lactate measurements had a higher risk of death associated with delays (OR 1.07; 95% CI 1.06–1.09 vs OR 1.02; 95% CI 1.01–1.03).
CONCLUSIONS:
Delays in antibiotic ordering and drug delivery are both associated with a similar increase in mortality. A distinct subgroup of high-risk patients exist who could be targeted for more timely therapy.
Keywords: Sepsis, Septic Shock, Infection, Delivery of Health Care
INTRODUCTION
Sepsis is a leading cause of in-hospital mortality in the United States1,2. Effective novel therapies continue to be elusive, while incidence may be increasing, affecting approximately 1.7 million adults each year3. Early antibiotic therapy is a critical aspect of sepsis management, with administration within 1–3 hours of patient presentation recommended by the Surviving Sepsis Campaign guidelines, Centers for Medicare & Medicaid Services Severe Sepsis and Septic Shock Management Bundle (SEP-1) measure, and several state protocols4–7. Furthermore, a study of the New York protocol indicated that antibiotic administration within three hours of arrival was associated with lower mortality8.
Although prior work has suggested that delays in antibiotic therapy are associated with increased mortality, these studies have been limited by multiple factors, and the evidence supporting SEP-1 is of poor quality9–18. Most selected patients using administrative claims, which demonstrate temporal variability, inconsistency, and low sensitivity19–21. The focus has primarily been on critically ill patients with severe sepsis and shock, reflecting only a subset of the infected population. Furthermore, analyses have been stratified by sepsis definitions to identify heterogeneity of treatment effect, which may not necessarily identify all patients who benefit from earlier treatment22–24.
Time to antibiotic therapy has traditionally been analyzed as a single period from patient presentation to first antibiotic administration. However, this period involves two fundamentally distinct processes: antibiotic order followed by drug delivery. Disease recognition is the critical event that precedes antibiotic ordering and is affected by patient presentation, clinician suspicion, and diagnostic testing. In contrast, drug delivery is impacted by different factors, such as pharmacy operations, intravenous access, and prioritization in patient care workflows. Determining the relative contributions of these processes to mortality would be useful for designing targeted interventions aimed at improving outcomes. Furthermore, finding similar associations between antibiotic delay and mortality in these two separate periods would strengthen the likelihood that this association is a true, causal relationship.
In this study, we used the time of first antibiotic order to separate these two types of delays to determine the association between each type and in-hospital mortality. We deployed objective clinical criteria to select a cohort of patients spanning the spectrum from infection to septic shock to better capture the diverse population of infected patients. We analyzed patients who experienced excessive delays and identified patient risk factors for delayed treatment. Lastly, we used machine learning to identify the subgroup of patients at highest risk of death associated with a delay in antibiotic therapy, as this may help target resources and focus clinical attention on those whose death may be prevented by earlier administration of antibiotics.
MATERIALS AND METHODS
Study Population and Data Collection
Adult patients admitted through the Emergency Department (ED) at six Illinois hospitals were eligible for inclusion in this retrospective study: two tertiary centers (University of Chicago (UC) from 2008–2018, Loyola University Medical Center from 2006–2017), and four community-based hospitals (NorthShore University Health System from 2008–2017). Patients who met clinical criteria for infection (see below) within 24 hours of admission were included. Vital signs, laboratory values, medication orders, ICD-9 and ICD-10 codes, demographics, and outcomes data were accessed through each institution’s data warehouse. The primary study outcome was in-hospital mortality. On the basis of general impracticability and minimal harm, waivers of consent were granted by the study sites’ Institutional Review Boards.
Identifying Infected and Septic Patients
Published clinical criteria were used to identify patients with likely infection: blood culture orders, four consecutive days of antibiotics (or until time of discharge, if less than four days) with IV antibiotics within the first 24 hours, and initiation of antibiotics within 48 hours of blood culture order3. Appropriate IV antibiotics for sepsis were identified using SEP-1 guidelines (Table E1)4. Sepsis and septic shock were defined by Sepsis-3 criteria (Table E2)24.
Defining Delays
Three delay periods were calculated: Order Delay (OD; time from presentation to first antibiotic order), Delivery Delay (DD; time from first antibiotic order to first antibiotic administration), and Cumulative Delay (CD; time from presentation to first antibiotic administration). The time of first vital sign in the ED defined the time of patient presentation (time zero). Excessive delays were defined a priori based on published guidelines and prior work, using cutoffs of >3 hours for OD and CD, and >1 hour for DD.
Clinical Characterization
Mean vital signs, Sequential Organ Failure Assessment (SOFA) score and electronic Cardiac Arrest Risk Triage score, a statistically derived early warning score, were calculated 1 hour after patient presentation and within 1 hour of first antibiotic order25,26. For missing laboratory values used in score calculation and vital signs, median imputation was performed using data limited to 6 hours after presentation or within 6 hours of first antibiotic order. Intravenous fluids administered prior to antibiotics were quantified. Interventions (high flow nasal cannula oxygen, non-invasive positive pressure ventilation, mechanical ventilation, vasoactives) within 6 hours of presentation were captured. These limited time windows were chosen to characterize patients early in their course and avoid confounding from data that could be affected by antibiotic administration, and are similar to prior work10.
Subphenotype Identification
Causal_forest in the grf R package was used to determine if certain types of patients were more at risk of harm from delays27. This is a random forest approach that estimates individual treatment effects while adjusting for confounding variables28. The treatment was delay length, and partitioning variables included demographics, infection site, pre-existing Elixhauser comorbidities, and early clinical variables (e.g., vitals within the first hour) with details described in Table E3. Subgroups of patients who were particularly harmed by antibiotic delays were identified using latent class analysis on the predicted individual treatment effects29.
Statistical Analyses
Patient characteristics were compared using t-tests, Wilcoxon rank-sum tests, and χ2 tests as appropriate. The association between each delay type and in-hospital mortality was calculated using logistic regression models. Each delay was studied as a continuous variable (hours), categorical variable (hourly or half-hourly increments), and excessive or non-excessive delays as defined above. All models were adjusted for hospital site, patient demographics, encounter occurrence pre-vs-post-SEP-1 implementation, pre-existing Elixhauser comorbidities, infection site, initial lactate value, and the clinical variables and interventions described above. Details are described in Table E4. Statistical analyses were performed using STATA 16 (StataCorp). All tests of significance used a two-sided P<0.05.
RESULTS
Study Population and Characteristics
The final cohort consisted of 60,817 adult admissions that met clinical criteria for infection. At 6 hours after presentation, 2% (n=1,166) fulfilled the Sepsis-3 definition for septic shock while 41% (n=24,952) met criteria for sepsis. The remaining 57% (n=34,699) were classified as infected (Table 1). Accounting for the entire hospitalization, 67% (n=40,659) ultimately met criteria for sepsis and 6% (n=3,359) for septic shock.
Table 1.
Demographics and clinical characteristics of patients who experienced no delays, patients who experienced excessive OD (>3 hours), patients who experienced excessive DD (>1 hour), and patients who experienced both excessive delays.
| No delays (n=25592) | OD only (n=14560) | DD only (n=8913) | OD and DD (n=11752) | |
|---|---|---|---|---|
| Age, mean (SD) | 64 (18) | 60 (19) | 63 (18) | 60 (18) |
| Gender, n (%) | ||||
| Male | 12808 (50) | 6641 (46) | 4247 (48) | 5431 (46) |
| Female | 12784 (50) | 7919 (54) | 4666 (52) | 6321 (54) |
| Race, n (%) | ||||
| Black | 8584 (34) | 6446 (44) | 3141 (35) | 5449 (46) |
| White | 13871 (54) | 6431 (44) | 4782 (54) | 5052 (43) |
| Other | 3137 (12) | 1683 (12) | 990 (11) | 1251 (11) |
| Number of co-morbidities (median, IQR) | 4 (1–7) | 3 (1–6) | 4 (1–7) | 4 (1–7) |
| Elixhauser co-morbidities, n (%) | ||||
| Congestive heart failure | 5435 (21) | 2714 (19) | 2014 (23) | 2618 (22) |
| Hypertension | 14850 (58) | 7788 (53) | 5183 (58) | 6640 (57) |
| Chronic pulmonary disease | 5348 (21) | 2707 (19) | 1812 (20) | 2323 (20) |
| Diabetes mellitus | 7419 (29) | 4072 (28) | 2762 (31) | 3615 (31) |
| Renal failure | 4833 (19) | 2871 (20) | 1903 (21) | 2720 (23) |
| Liver disease | 2056 (8) | 1430 (10) | 795 (9) | 1308 (11) |
| Malignancy | 5758 (23) | 2937 (20) | 2179 (25) | 2561 (22) |
| Infection site, n (%) | ||||
| Pulmonary | 9819 (38) | 3732 (26) | 3172 (36) | 2870 (24) |
| Gastrointestinal | 2457 (10) | 2146 (15) | 914 (10) | 1598 (14) |
| Genitourinary | 7041 (28) | 4093 (28) | 2119 (24) | 3065 (26) |
| Skin | 5324 (21) | 2918 (20) | 2261 (25) | 2590 (22) |
| Mean values in first hour, mean (SD) | ||||
| Pulse | 100 (22) | 97 (20) | 99 (22) | 96 (20) |
| Respiratory rate | 21 (5) | 19 (4) | 21 (5) | 20 (4) |
| Systolic blood pressure, mmHg | 128 (26) | 129 (24) | 127 (26) | 128 (25) |
| Diastolic blood pressure, mmHg | 70 (16) | 72 (15) | 70 (16) | 72 (16) |
| eCART at 1 hour, median (IQR) | 17 (8–45) | 11 (6–23) | 16 (8–43) | 12 (7–27) |
| SOFA at 1 hour, median (IQR) | 1 (0–3) | 1 (0–2) | 2 (0–3) | 1 (0–3) |
| Disease category at 6 hours, n (%) | ||||
| Infection | 13688 (53) | 9296 (64) | 4777 (54) | 6958 (59) |
| Sepsis | 11916 (47) | 5261 (36) | 4135 (46) | 4794 (41) |
| Septic Shock | 682 (3) | 97 (0.7) | 277 (3) | 110 (1) |
OD = Order Delay; DD = delivery delay; SD = standard deviation; IQR = interquartile range; eCART = electronic Cardiac Arrest Risk Triage; SOFA = Sequential Organ Failure Assessment.
Delays were common, with 58% (n=35,225) of patients experiencing excessive delays, defined as OD >3 hours and/or DD >1 hour. Patients who experienced any type of delay were more frequently female (OD, 54%; DD, 52%; OD and DD, 54%; no delays, 50%; P<0.001 for all comparisons) and African American (OD, 44%; DD, 35%; OD and DD, 46%; no delays, 34%; P<0.001 for all comparisons). The OD only group had lower rates of multiple pre-existing conditions compared to the DD only group, including congestive heart failure (CHF) (19% vs 23%; P<0.001), hypertension (53% vs 58%; P<0.001), and malignancy (20% vs 25%; P<0.001). Patients experiencing OD had less pulmonary infections (OD, 26%; OD and DD, 24%; DD, 36%; no delays, 38%; P<0.001 for all comparisons), while the DD only group had more skin infections (DD, 25%; OD, 20%; no delays, 21%; P<0.001 for all comparisons).
Initial lactate values were similar across all groups, though the OD only group had the longest time to first lactate measurement (median [IQR], hours: OD, 2.3 [1.2–3.8]; DD, 1.4 [0.8–2.2]; OD and DD, 1.9 [1.1–3.4]; no delays, 1.2 [0.7–1.9]; P<0.001 for all comparisons) (Table 2). Patients who experienced OD alone were the least likely to receive any type of critical care intervention within the first 6 hours. They also had the lowest rates of ICU admission (OD, 13%; OD and DD, 16%; DD, 22%; no delays, 20%; P<0.001 for all comparisons) and development of septic shock at any point during the hospitalization (OD, 4%; OD and DD, 5%; DD, 7%; no delays, 6%; P<0.001 for all comparisons). Mortality in the DD only group was higher than in the OD only group (7% vs 4%; P<0.001), with overall mortality in the study population of 5%.
Table 2.
Comparison of clinical interventions, processes, and outcomes between patients who experienced no delays, patients who experienced excessive OD (>3 hours), patients who experienced excessive DD (>1 hour), and patients who experienced both excessive delays.
| No delays (n=25592) | OD only (n=14560) | DD only (n=8913) | OD and DD (n=11752) | |
|---|---|---|---|---|
| Critical care interventions by 6 hours, n (%) | ||||
| High flow nasal cannula | 98 (0.4) | 15 (0.1) | 30 (0.3) | 16 (0.1) |
| Non-invasive positive pressure ventilation | 833 (3) | 153 (1) | 243 (3) | 190 (2) |
| Mechanical ventilation | 1284 (5) | 354 (2) | 598 (7) | 498 (4) |
| Vasoactives | 913 (4) | 167 (1) | 373 (4) | 223 (2) |
| Initial lactate value, median (IQR) | 1.8 (1.2–2.8) | 1.6 (1.1–2.3) | 1.7 (1.2–2.7) | 1.6 (1.1–2.3) |
| Time to first lactate in hours, median (IQR) | 1.2 (0.7–1.9) | 2.3 (1.2–3.8) | 1.4 (0.8–2.2) | 1.9 (1.1–3.4) |
| Admitted to ICU from ED, n (%) | 5020 (20) | 1854 (13) | 1919 (22) | 1828 (16) |
| Ever developed septic shock, n (%) | 1616 (6) | 596 (4) | 618 (7) | 529 (5) |
| Delay periods in hours, median (IQR) | ||||
| OD | 1.4 (0.8–2.1) | 5.0 (3.8–7.4) | 1.5 (0.8–2.2) | 6.3 (4.4–10.0) |
| DD | 0.4 (0.2–0.7) | 0.5 (0.3–0.7) | 1.5 (1.2–2.1) | 1.8 (1.3–2.8) |
| CD | 1.9 (1.3–2.6) | 5.5 (4.3–8.0) | 3.1 (2.4–4.0) | 8.9 (6.5–13.2) |
| LOS in days (median, IQR) | 4.0 (2.2–7.1) | 4.0 (2.3–7.0) | 4.3 (2.6–7.8) | 4.5 (2.7–7.8) |
| Mortality, n (%) | 1448 (6) | 577 (4) | 639 (7) | 581 (5) |
OD = Order Delay; DD = delivery delay; CD = cumulative delay; IQR = interquartile range; ICU = intensive care unit; ED = emergency department; LOS = length of stay.
Delays and Mortality
Median OD was 2.6 hours (IQR 1.3–5.0) and 43% (n=26,312) of patients experienced an excessive delay, which was associated with a 23% increase in adjusted odds of death (OR 1.23; 95% CI 1.12–1.35; P<0.001). Analysis of OD as a continuous hourly variable found that each hour of delay was associated with a 4% increase in the adjusted odds of death (OR 1.04; 95% CI 1.03–1.05; P<0.001) (Table E5). Examination of hourly increments revealed that delays of 5–6 hours or >6 hours were associated with the greatest harm, with adjusted ORs of 1.48 (95% CI 1.20–1.83; P<0.001) and 1.59 (95% CI 1.39–1.83; P<0.001), respectively (Figure 1A). Results stratified by sepsis definitions are shown in Table E6.
Figure 1. Association between different delay types and in-hospital mortality.
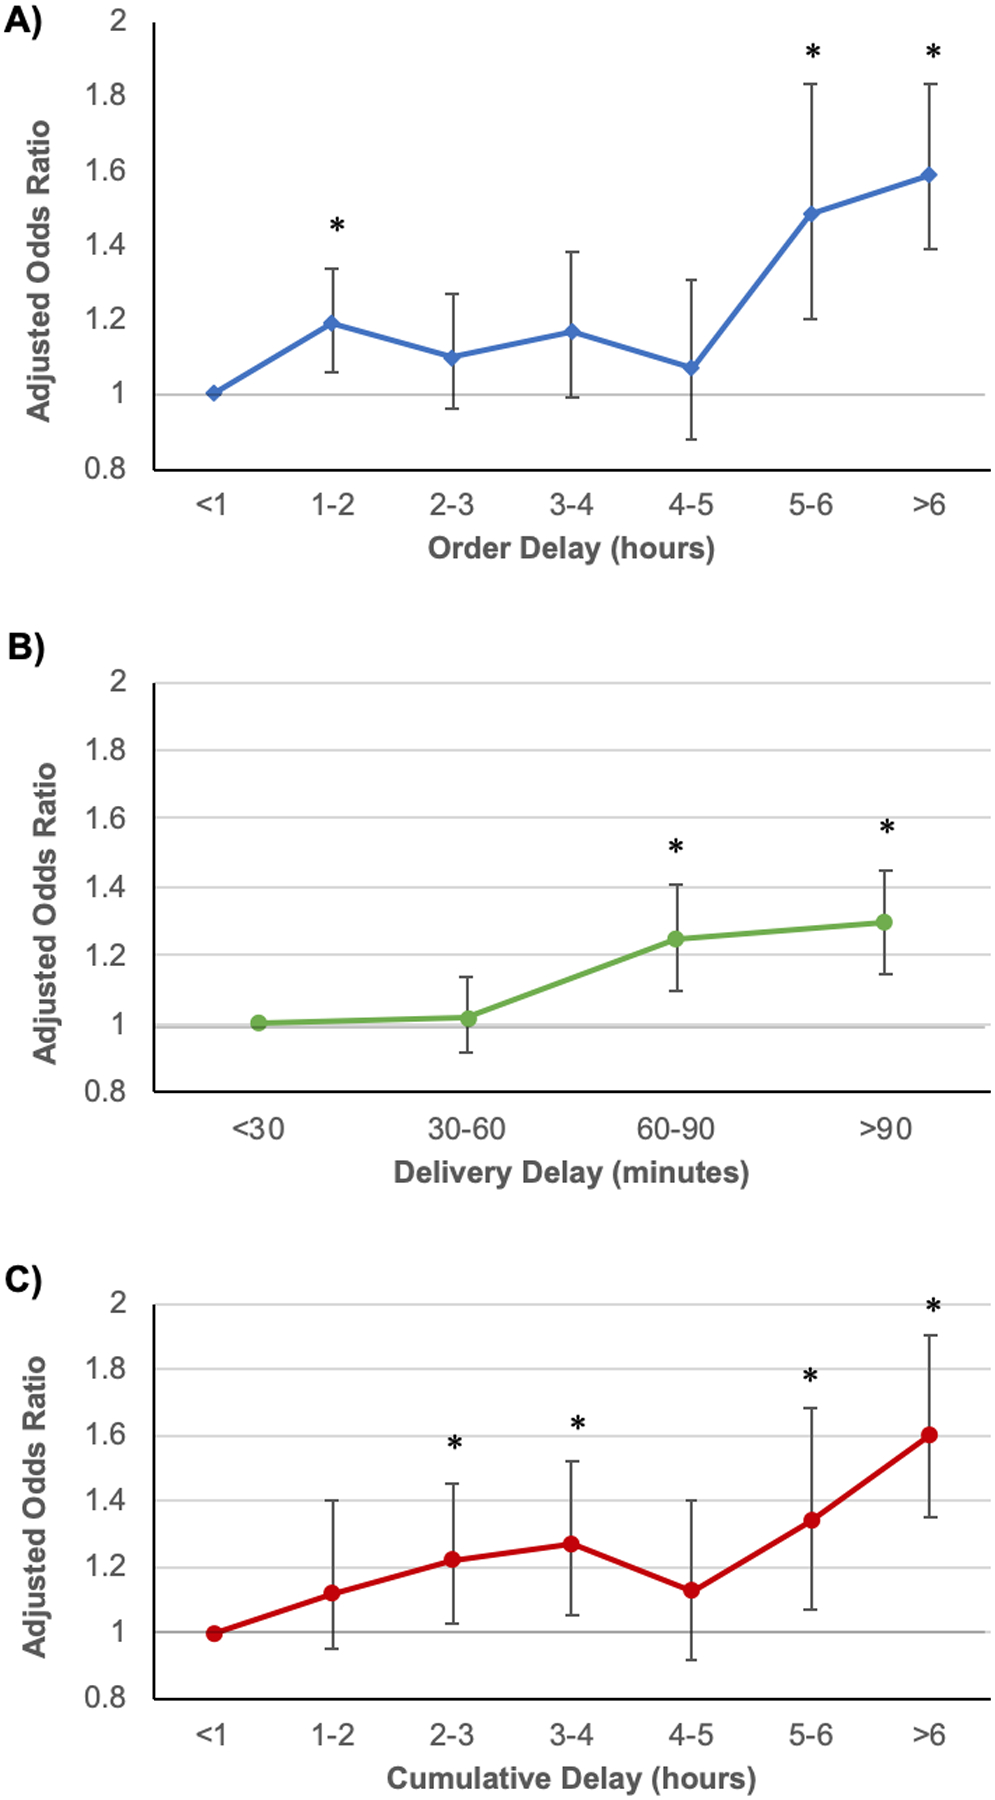
Associations are represented by adjusted odds ratios for A) Order Delay by hour, B) Delivery Delay by 30-minute increments, and C) Cumulative Delay by hour. P<0.05 is indicated by *.
Delivery delays were shorter, with a median delay of 0.7 hours (IQR 0.3–1.3) and variability in duration between different antibiotics (Table E1). Excessive delays affected 34% (n=20,665) of patients and were associated with a 26% increase in the adjusted odds of death (OR 1.26; 95% CI 1.16–1.38; P <0.001). Each additional hour of DD was associated with a 5% increase in adjusted odds of death when studied as a continuous variable (OR 1.05; 95% CI 1.02–1.08; P<0.001) (Table E5). Study of DD in 30-minute increments demonstrated that significant association with increased mortality began at 60–90 minutes (OR 1.25; 95% CI 1.10–1.41; P<0.001) and remained similar at >90 minutes (OR 1.30; 95% CI 1.16–1.45; P<0.001) (Figure 1B).
Finally, the median CD to antibiotic therapy was 3.4 hours (IQR 2.0–6.3), with 56% (n=33,909) of patients experiencing an excessive delay. CD was also associated with increased mortality, with excessive delays associated with a 19% increase in adjusted odds of death (OR 1.22; 95% CI 1.11–1.33; P<0.001). Examination as a continuous hourly variable showed that each additional hour of delay was associated with a 4% increase in adjusted odds of death (OR 1.04; 95% CI 1.03–1.05; P<0.001). Similar to the OD findings, analysis of CD by hourly increments showed that delays of 5–6 hours (OR 1.34; 95% CI 1.07–1.68; P=0.01) or >6 hours (OR 1.60; 95% CI 1.35–1.90; P<0.001) were particularly harmful (Figure 1C).
Causal Forests Analysis to Identify a High-risk Group
Causal forests identified a subgroup of patients in which hourly increases in CD were associated with greater mortality. This cluster of patients (cluster 2) represented 9% (n=6,750) of the study population. The other cluster (cluster 1) represented the remaining 91% (n=54,067). Cluster 2 patients demonstrated a 7% increase in adjusted odds of death with each additional hour of CD (OR 1.07; 95% CI 1.06–1.09; P<0.001), a larger effect than their cluster 1 counterparts (OR 1.02; 95% CI 1.01–1.03; P<0.001) (Figure 2A). Similar findings in cluster 2 were also observed with respect to OD and DD (Figure E1). Cluster 2 patients were more likely to be male (51% vs 47%; P<0.001) and older (mean [SD], years: 68 [15] vs 61 [19]; P<0.001) (Table 3). Their pre-existing co-morbidity profile demonstrated increased frequency of CHF (24% vs 21%; P<0.001), hypertension (61% vs 56%; P<0.001), and diabetes mellitus (DM) (35% vs 29%; P<0.001), and they were less likely to have skin and soft tissue infections (13% vs 23%; P<0.001).
Figure 2. Association between Cumulative Delay and in-hospital mortality for patient subgroups and by lactate stratification.

A) Cluster analysis demonstrating associations between Cumulative Delay and in-hospital mortality, with adjusted odds ratios and 95% CI shown for the following groups: total study population (n=60,817), cluster 1 (n=54,067), cluster 2 (6,750), patients with initial lactate measurement <2mmol/L (n=46,042), and patients with initial lactate measurement ≥2mmol/L (n=14,755). B) Variable importance plot for causal forests model showing the top 20 most important variables in descending order.
Table 3.
Comparison of patient characteristics, clinical interventions and processes, and outcomes between the two patient subgroups identified in causal forests analysis.
| Cluster 1 (n = 54067) | Cluster 2 (n = 6750) | P value | |
|---|---|---|---|
| Age, mean (SD) | 61 (19) | 68 (15) | <0.001 |
| Gender, n (%) | <0.001 | ||
| Male | 25654 (47) | 3473 (51) | |
| Female | 28413 (53) | 3277 (49) | |
| Race, n (%) | 0.132 | ||
| Black | 21032 (39) | 2588 (38) | |
| White | 26807 (50) | 3329 (49) | |
| Other | 6228 (11) | 833 (12) | |
| Number of comorbidities, median (IQR) | 4 (1–7) | 4 (1–7) | <0.001 |
| Elixhauser comorbidities, n (%) | |||
| Congestive heart failure | 11164 (21) | 1617 (24) | <0.001 |
| Hypertension | 30325 (56) | 4136 (61) | <0.001 |
| Chronic pulmonary disease | 10900 (20) | 1290 (19) | 0.042 |
| Diabetes mellitus | 15513 (29) | 2355 (35) | <0.001 |
| Renal failure | 10909 (20) | 1418 (21) | 0.109 |
| Liver disease | 4752 (9) | 837 (12) | <0.001 |
| Malignancy | 11795 (22) | 1640 (24) | <0.001 |
| Infection site, n (%) | |||
| Pulmonary | 17076 (32) | 2517 (37) | <0.001 |
| Gastrointestinal | 6045 (11) | 1070 (16) | <0.001 |
| Genitourinary | 14396 (27) | 1922 (28) | 0.001 |
| Skin and soft tissue | 12239 (23) | 854 (13) | <0.001 |
| Critical care interventions by 6 hours, n (%) | |||
| High flow nasal cannula | 112 (0.2) | 47 (0.7) | 0.001 |
| Non-invasive positive pressure ventilation | 1090 (2) | 329 (5) | <0.001 |
| Mechanical ventilation | 1942 (4) | 792 (12) | <0.001 |
| Vasoactives | 1148 (2) | 528 (8) | <0.001 |
| SOFA at 1 hour, median (IQR) | 1 (0–3) | 3 (1–4) | <0.001 |
| Initial lactate value, median (IQR) | 1.5 (1.1–2.1) | 3.6 (3.0–4.8) | <0.001 |
| Time to first lactate, median (IQR) | 1.5 (0.9–2.5) | 1.18 (0.7–2.0) | <0.001 |
| Admitted to ICU from ED, n (%) | 7838 (15) | 2783 (41) | <0.001 |
| Ever developed septic shock, n (%) | 2202 (4) | 1157 (17) | <0.001 |
| Delay periods in hours, median (IQR) | |||
| OD | 2.6 (1.3–5.0) | 2.0 (1.0–4.1) | <0.001 |
| DD | 0.7 (0.3–1.3) | 0.6 (0.3–1.3) | 0.004 |
| CD | 3.5 (2.0–6.4) | 2.9 (1.7–5.4) | <0.001 |
| LOS in days, median (IQR) | 4.0 (2.3–7.0) | 5.3 (3.0–9.4) | <0.001 |
| Mortality, n (%) | 2206 (4) | 1039 (15) | <0.001 |
OD = Order Delay; DD = delivery delay; CD = cumulative delay; SD = standard deviation; IQR = interquartile range; SOFA = Sequential Organ Failure Assessment; ICU = intensive care unit; ED = emergency department; LOS = length of stay.
Cluster 2 patients also had higher SOFA scores at 1 hour after presentation (median [IQR]: 3 [1–4] vs 1 [0–3]; P<0.001). They received early critical care support at frequencies two to four times higher than cluster 1 patients. Initial serum lactate values in cluster 2 were more than double those of cluster 1 (median [IQR], mmol/L: 3.6 [3.0–4.8] vs 1.5 [1.1–2.1]; P<0.001), with 93% of patients with measured lactates in cluster 2 found to have an initial value ≥2mmol/L. OD was lower in cluster 2 (median [IQR], hours: 2.0 [1.0–4.1] vs 2.6 [IQR 1.3–5.0]; P<0.001), while DD was only slightly lower (median [IQR], hours: 0.6 [0.3–1.3] vs 0.7 [0.3–1.3]; P<0.001). Cluster 2 patients were much more likely to be admitted directly to the ICU (41% vs 15%, P<0.001) and to ever develop septic shock (17% vs 4%, P<0.001). Mortality in cluster 2 was 15%, almost quadruple the 4% mortality rate of cluster 1.
A variable importance plot for the causal forests model revealed that lactate was the most important variable defining the cluster groups (Figure 2B). Therefore, post-hoc mortality analyses were performed with stratification by normal (<2mmol/L) or abnormal (≥2mmol/L) initial lactate measurements. The abnormal lactate group demonstrated a 6% increase in the odds of death with each additional hour of CD (OR 1.06, 95% CI 1.05–1.07; P<0.001), double the 3% increase observed in the normal lactate group (OR 1.03, 95% CI 1.01–1.04; P<0.001) (Figure 2A).
DISCUSSION
In this multicenter study of over 60,000 infected patients, we performed an analysis of the association between time to antibiotic therapy and in-hospital mortality by dividing the total period into two distinct delay components, OD and DD. We found that over half of patients experienced at least one of these delays, and that each type was independently associated with a similar increase in mortality. Those who experienced delays were significantly different from their counterparts, suggesting that certain patient-level features may place individuals at increased risk for harmful delays. We identified and described a subgroup of patients who experienced especially high increases in mortality associated with CD to antibiotic therapy, of which only a minority met criteria for septic shock, suggesting that traditional disease categorization is inadequate for identifying patients who are most harmed from delays.
The “time to antibiotic” metric has been studied and targeted for improvement as a single period. We split this period into two distinct components to reflect fundamental differences in the mechanisms underlying each and found that both were associated with similar increases in mortality. Faster recognition of disease is key to decreasing OD, and may be achieved through improved sepsis screening, developing technologies such as prediction algorithms, and reducing wait times to initial provider assessment. Once antibiotic orders have been placed, delays in execution are also associated with significant harm. Kashiouris et al. also demonstrated this in a single center 2019 study, in which delays in antibiotic administration >1 hour after order were associated with increased mortality in 4,429 patients presenting to the ED with sepsis30. A similar increase in mortality despite differences in characteristics suggests that the association between delays and outcomes may be a true causal relationship. Importantly, DD can be shortened through a different set of interventions aimed at addressing system processes (e.g., pharmacy interventions)31,32.
We found that antibiotic delays were frequent, as 58% of patients experienced some form of excessive delay. Delays in sepsis therapy are widespread and have been linked to hospital-level factors, such as safety-net status33–37. Less is known about patient-level characteristics that may increase the risk of delays. Our findings suggest that patients who present with classic manifestations of sepsis, with pulmonary infections and early organ dysfunction requiring critical care, are recognized more quickly and experience less OD. Compared to patients who experienced OD alone, those with DD alone had greater similarities to patients without delays but much higher rates of ICU admission, early critical care interventions, and early septic shock. This suggests that challenges in prioritizing antibiotic administration in care workflows may be a significant contributor to DD and preventable harm. Meanwhile, female and African American patients were more likely to experience either type of delay. Further investigation is warranted to fully understand these differences and to determine whether an increased risk of delayed antibiotic therapy may contribute to disparities in sepsis outcomes.
Clinicians must care for a heterogeneous patient population while balancing avoidance of harmful delays against minimizing adverse effects from antibiotic over-utilization38–45. Significant concern exists regarding potential patient harm and strain on healthcare resources caused by indiscriminate antibiotic administration46,47. Consequently, identifying the patients who will experience the greatest harm associated with delays is critical to effectively and appropriately target early therapy. Using causal forests, we identified a subgroup of patients who had a 7% increase in odds of death with each hour of CD, more than triple that of the remaining population. This subgroup was comprised of older patients who were more likely male, with greater pre-existing comorbidities and early organ dysfunction. Simple stratification by focusing on the septic shock category misses 83% of this high-risk subgroup, which has unique clinical features not included in prior or current sepsis definitions. The association between delays and mortality was not consistently related to published standard definitions, although analyses were limited by small sample sizes in the septic shock group.
Lactate was the most important variable defining these novel subgroups, and we found that patients with elevated initial lactate measurements experienced greater increases in mortality associated with delays. This supports our prior study which demonstrated that delays in lactate measurement were associated with longer time to antibiotic administration and increased mortality in patients with elevated lactate values, and suggests that lactate might serve as a simple bedside test for identifying patients who would be harmed most by antibiotic administration delays48. However, lactate values should be interpreted carefully in clinical context as they can be elevated for reasons unrelated to sepsis (e.g., certain medications).
Strengths of our study include a diverse cohort defined using clinical criteria for infection, granular EHR data to better address confounding, identification of separate delay types, and a novel subphenotype analysis. Unlike early studies, we utilized both medication order and administration times to evaluate delays. Differences in cohort definitions and variables used when adjusting for confounding could explain some of the prior mixed results, and our findings regarding CD are similar to that of Liu et al. who also used a large, granular EHR dataset10. We demonstrated that delays are associated with increased mortality, but that there is heterogeneity in this relationship related to the heterogeneity of the patients themselves. Our findings and that of Kashiouris et al. imply that DD could be an important quality metric for evaluation and improvement30. We defined a high-risk subphenotype that should be prioritized for early therapy and whose unique features may help inform future infection identification algorithms and clinical workflows.
Our study has several limitations. First, we were unable to determine if the antibiotic regimens for each patient were adequate for their specific infection, and antibiotic order priority status was unknown. Second, while we adjusted our analyses for some clinical interventions, there were others that we were unable to account for. Finally, we did not have information regarding systems strain, such as ED over-crowding or limited staffing, or the time from onset of infection to healthcare access as reflected by symptom duration. These factors affect the time to disease recognition and/or drug delivery and warrant further study.
CONCLUSIONS
In a large, multicenter cohort of patients with infection, we found that delays in initial antibiotic order >3 hours were associated with a 23% increase in the odds of death while delays in system delivery of antibiotics >1 hour were associated with a 26% increase in the odds of death. Specific patient-level characteristics may place certain individuals at higher risk for experiencing these harmful delays. A subgroup with elevated initial lactate values, larger pre-existing comorbidity burden, and greater early organ dysfunction experienced particularly high mortality associated with delays. While an elevated lactate alone is not an indication for antibiotics, in the appropriate clinical context it should spur rapid assessment and consideration for treatment. This high-risk subgroup with both clinical suspicion of infection and elevated lactate represents a population that could be specifically targeted for early antibiotics in order to reduce preventable death.
Supplementary Material
ACKNOWLEDGEMENTS
AUTHOR CONTRIBUTIONS: Study concept and design: XH, MMC, MGK; acquisition of data: MMC, ERG, NSS, CW, MA; analysis and interpretation of data: XH, AS, MMC; first drafting of the manuscript: XH; critical revision of the manuscript for important intellectual content: all authors; statistical analysis: XH, AS; obtained funding: MMC; administrative, technical, and material support: KC; study supervision: MMC. Data access and responsibility: MMC, KC, and XH had full access to all the data in the study, and take responsibility for the integrity of the data and the accuracy of the data analysis.
Financial Statement:
XH is supported by the National Institutes of Health (NIH) grant T32 HL007605. NL is supported by the NIH grants R01 MD013420, U18 HS026151, and R18 HS027910. MA is supported by the NIH grants K23 AA024503 and R01 DA051464. MMC is supported by the NIH grant R01 GM123193.
Copyright Form Disclosure:
Drs. Han, Spicer, and Churpek’s institutions received funding from the National Institutes of Health (NIH)/National Heart, Blood, and Lung Institute grant T32 HL007605. Drs. Han, Spicer, Afshar, and Churpek received support for article research from the NIH. Dr. Kashiouris received funding from Xelia Pharmaceuticals. The remaining authors have disclosed that they do not have any potential conflicts of interest.
Footnotes
Work for this study was performed at the University of Wisconsin-Madison and the University of Chicago.
REFERENCES
- 1.Liu V, Escobar GJ, Greene JD, et al. : Hospital Deaths in Patients With Sepsis From 2 Independent Cohorts. JAMA. 2014;312(1):90–92. [DOI] [PubMed] [Google Scholar]
- 2.Rudd KE, Johnson SC, Agesa KM, et al. : Global, regional, and national sepsis incidence and mortality, 1990–2017: analysis for the Global Burden of Disease Study. The Lancet. 2020;395(10219):200–211. [DOI] [PMC free article] [PubMed] [Google Scholar]
- 3.Rhee C, Dantes R, Epstein L, et al. : Incidence and Trends of Sepsis in US Hospitals Using Clinical vs Claims Data, 2009–2014. JAMA. 2017;318(13):1241–1249. [DOI] [PMC free article] [PubMed] [Google Scholar]
- 4.Hospital Inpatient Specifications Manuals. AccessedSeptember 3, 2020. https://www.qualitynet.org/inpatient/specifications-manuals
- 5.Rhodes A, Evans LE, Alhazzani W, et al. : Surviving Sepsis Campaign: International Guidelines for Management of Sepsis and Septic Shock: 2016. Crit Care Med. 2017;45(3):486–552. [DOI] [PubMed] [Google Scholar]
- 6.Levy MM, Evans LE, Rhodes A. The Surviving Sepsis Campaign Bundle: 2018 Update. Crit Care Med. 2018;46(6):997–1000. [DOI] [PubMed] [Google Scholar]
- 7.Hershey TB, Kahn JM. State Sepsis Mandates — A New Era for Regulation of Hospital Quality. N Engl J Med. 2017;376(24):2311–2313. [DOI] [PubMed] [Google Scholar]
- 8.Seymour CW, Gesten F, Prescott HC, et al. : Time to Treatment and Mortality during Mandated Emergency Care for Sepsis. N Engl J Med. 2017;376(24):2235–2244. [DOI] [PMC free article] [PubMed] [Google Scholar]
- 9.Kumar A, Roberts D, Wood KE, et al. : Duration of hypotension before initiation of effective antimicrobial therapy is the critical determinant of survival in human septic shock. Crit Care Med. 2006;34(6):1589–1596. [DOI] [PubMed] [Google Scholar]
- 10.Liu VX, Fielding-Singh V, Greene JD, et al. : The Timing of Early Antibiotics and Hospital Mortality in Sepsis. Am J Respir Crit Care Med. 2017;196(7):856–863. [DOI] [PMC free article] [PubMed] [Google Scholar]
- 11.Puskarich MA, Trzeciak S, Shapiro NI, et al. : Association Between Timing of Antibiotic Administration and Mortality from Septic Shock in Patients Treated with a Quantitative Resuscitation Protocol. Crit Care Med. 2011;39(9):2066–2071. [DOI] [PMC free article] [PubMed] [Google Scholar]
- 12.Ferrer R, Martin-Loeches I, Phillips G, et al. : Empiric Antibiotic Treatment Reduces Mortality in Severe Sepsis and Septic Shock From the First Hour: Results From a Guideline-Based Performance Improvement Program*. Crit Care Med. 2014;42(8):1749–1755. [DOI] [PubMed] [Google Scholar]
- 13.Bloos F, Thomas-Rüddel D, Rüddel H, et al. : Impact of compliance with infection management guidelines on outcome in patients with severe sepsis: a prospective observational multi-center study. Crit Care. 2014;18(2):R42. [DOI] [PMC free article] [PubMed] [Google Scholar]
- 14.de Groot B, Ansems A, Gerling DH, et al. : The association between time to antibiotics and relevant clinical outcomes in emergency department patients with various stages of sepsis: a prospective multi-center study. Crit Care. 2015;19(1). [DOI] [PMC free article] [PubMed] [Google Scholar]
- 15.Alam N, Oskam E, Stassen PM, et al. : Prehospital antibiotics in the ambulance for sepsis: a multicentre, open label, randomised trial. Lancet Respir Med. 2018;6(1):40–50. [DOI] [PubMed] [Google Scholar]
- 16.Vilella AL, Seifert CF. Timing and appropriateness of initial antibiotic therapy in newly presenting septic patients. Am J Emerg Med. 2014;32(1):7–13. [DOI] [PubMed] [Google Scholar]
- 17.Sterling SA, Miller WR, Pryor J, et al. : The Impact of Timing of Antibiotics on Outcomes in Severe Sepsis and Septic Shock: A Systematic Review and Meta-analysis. Crit Care Med. 2015;43(9):1907–1915. [DOI] [PMC free article] [PubMed] [Google Scholar]
- 18.Pepper DJ, Jaswal D, Sun J, et al. : Evidence Underpinning the Centers for Medicare & Medicaid Services’ Severe Sepsis and Septic Shock Management Bundle (SEP-1). Ann Intern Med. 2018;168(8):558–568. [DOI] [PMC free article] [PubMed] [Google Scholar]
- 19.Gaieski DF, Edwards JM, Kallan MJ, et al. : Benchmarking the incidence and mortality of severe sepsis in the United States. Crit Care Med. 2013;41(5):1167–1174. [DOI] [PubMed] [Google Scholar]
- 20.Rhee C, Gohil S, Klompas M. Regulatory Mandates for Sepsis Care — Reasons for Caution. N Engl J Med. 2014;370(18):1673–1676. [DOI] [PMC free article] [PubMed] [Google Scholar]
- 21.Jafarzadeh SR, Thomas BS, Marschall J, et al. : Quantifying the improvement in sepsis diagnosis, documentation, and coding: the marginal causal effect of year of hospitalization on sepsis diagnosis. Ann Epidemiol. 2016;26(1):66–70. [DOI] [PMC free article] [PubMed] [Google Scholar]
- 22.Bone RC, Balk RA, Cerra FB, et al. : Definitions for Sepsis and Organ Failure and Guidelines for the Use of Innovative Therapies in Sepsis. Chest. 1992;101(6):1644–1655. [DOI] [PubMed] [Google Scholar]
- 23.Levy MM, Fink MP, Marshall JC, et al. : 2001 SCCM/ESICM/ACCP/ATS/SIS International Sepsis Definitions Conference. Intensive Care Med. 2003;29(4):530–538. [DOI] [PubMed] [Google Scholar]
- 24.Singer M, Deutschman CS, Seymour CW, et al. : The Third International Consensus Definitions for Sepsis and Septic Shock (Sepsis-3). JAMA. 2016;315(8):801–810. [DOI] [PMC free article] [PubMed] [Google Scholar]
- 25.Vincent J-L, Moreno R, Takala J, et al. : The SOFA (Sepsis-related Organ Failure Assessment) score to describe organ dysfunction/failure. Intensive Care Med. 1996;22(7):707–710. [DOI] [PubMed] [Google Scholar]
- 26.Churpek MM, Yuen TC, Winslow C, et al. : Multicenter Development and Validation of a Risk Stratification Tool for Ward Patients. Am J Respir Crit Care Med. 2014;190(6):649–655. [DOI] [PMC free article] [PubMed] [Google Scholar]
- 27.R Core Team (2019). R: A Language and Environment for Statistical Computing. R Foundation for Statistical Computing; https://www.R-project.org/ [Google Scholar]
- 28.Wager S, Athey S. Estimation and Inference of Heterogeneous Treatment Effects using Random Forests. ArXiv151004342 Math Stat. Published online July 9, 2017. AccessedSeptember 16, 2020. http://arxiv.org/abs/1510.04342 [Google Scholar]
- 29.Sinha P, Calfee CS, Delucchi KL. Practitioner’s Guide to Latent Class Analysis: Methodological Considerations and Common Pitfalls. Crit Care Med. Published onlineNovember 9, 2020. [DOI] [PMC free article] [PubMed] [Google Scholar]
- 30.Kashiouris MG, Zemore Z, Kimball Z, et al. : Supply Chain Delays in Antimicrobial Administration After the Initial Clinician Order and Mortality in Patients With Sepsis*. Crit Care Med. 2019;47(10):1388–1395. [DOI] [PubMed] [Google Scholar]
- 31.Sarani B, Brenner SR, Gabel B, et al. : Improving Sepsis Care Through Systems Change: The Impact of a Medical Emergency Team. Jt Comm J Qual Patient Saf. 2008;34(3):179–182. [DOI] [PubMed] [Google Scholar]
- 32.Moussavi K, Nikitenko V. Pharmacist impact on time to antibiotic administration in patients with sepsis in an ED. Am J Emerg Med. 2016;34(11):2117–2121. [DOI] [PubMed] [Google Scholar]
- 33.Rhodes A, Phillips G, Beale R, et al. : The Surviving Sepsis Campaign bundles and outcome: results from the International Multicentre Prevalence Study on Sepsis (the IMPreSS study). Intensive Care Med. 2015;41(9):1620–1628. [DOI] [PubMed] [Google Scholar]
- 34.Levy MM, Gesten FC, Phillips GS, et al. : Mortality Changes Associated with Mandated Public Reporting for Sepsis. The Results of the New York State Initiative. Am J Respir Crit Care Med. 2018;198(11):1406–1412. [DOI] [PMC free article] [PubMed] [Google Scholar]
- 35.Barbash IJ, Davis B, Kahn JM. National Performance on the Medicare SEP-1 Sepsis Quality Measure. Crit Care Med. 2019;47(8):1026–1032. [DOI] [PMC free article] [PubMed] [Google Scholar]
- 36.Barbash IJ, Kahn JM. Sepsis quality in safety-net hospitals: An analysis of Medicare’s SEP-1 performance measure. J Crit Care. 2019;54:88–93. [DOI] [PMC free article] [PubMed] [Google Scholar]
- 37.Corl K, Levy M, Phillips G, et al. : Racial And Ethnic Disparities In Care Following The New York State Sepsis Initiative. Health Aff (Millwood). 2019;38(7):1119–1126. [DOI] [PMC free article] [PubMed] [Google Scholar]
- 38.Bhavani SV, Carey KA, Gilbert ER, et al. : Identifying Novel Sepsis Subphenotypes Using Temperature Trajectories. Am J Respir Crit Care Med. 2019;200(3):327–335. [DOI] [PMC free article] [PubMed] [Google Scholar]
- 39.Seymour CW, Kennedy JN, Wang S, et al. : Derivation, Validation, and Potential Treatment Implications of Novel Clinical Phenotypes for Sepsis. JAMA. 2019;321(20):2003–2017. [DOI] [PMC free article] [PubMed] [Google Scholar]
- 40.Leligdowicz A, Matthay MA. Heterogeneity in sepsis: new biological evidence with clinical applications. Crit Care. 2019;23(1):80. [DOI] [PMC free article] [PubMed] [Google Scholar]
- 41.Hiensch R, Poeran J, Saunders-Hao P, et al. : Impact of an electronic sepsis initiative on antibiotic use and health care facility-onset Clostridium difficile infection rates. Am J Infect Control. 2017;45(10):1091–1100. [DOI] [PubMed] [Google Scholar]
- 42.Tamma PD, Avdic E, Li DX, et al. : Association of Adverse Events With Antibiotic Use in Hospitalized Patients. JAMA Intern Med. 2017;177(9):1308–1315. [DOI] [PMC free article] [PubMed] [Google Scholar]
- 43.Spiegel R, Farkas JD, Rola P, et al. : The 2018 Surviving Sepsis Campaign’s Treatment Bundle: When Guidelines Outpace the Evidence Supporting Their Use. Ann Emerg Med. 2019;73(4):356–358. [DOI] [PubMed] [Google Scholar]
- 44.Rhee C, Chiotos K, Cosgrove SE, et al. : Infectious Diseases Society of America Position Paper: Recommended Revisions to the National Severe Sepsis and Septic Shock Early Management Bundle (SEP-1) Sepsis Quality Measure. Clin Infect Dis. 2020; ciaa059. [DOI] [PMC free article] [PubMed] [Google Scholar]
- 45.Klompas M, Rhee C. Current Sepsis Mandates Are Overly Prescriptive, and Some Aspects May Be Harmful. Crit Care Med. 2020;48(6):890–893. [DOI] [PubMed] [Google Scholar]
- 46.Klompas M, Calandra T, Singer M. Antibiotics for Sepsis-Finding the Equilibrium. JAMA. 2018;320(14):1433–1434. [DOI] [PubMed] [Google Scholar]
- 47.Singer M Antibiotics for Sepsis: Does Each Hour Really Count, or Is It Incestuous Amplification? Am J Respir Crit Care Med. 2017;196(7):800–802. [DOI] [PubMed] [Google Scholar]
- 48.Han X, Edelson DP, Snyder A, et al. : Implications of Centers for Medicare & Medicaid Services Severe Sepsis and Septic Shock Early Management Bundle and Initial Lactate Measurement on the Management of Sepsis. Chest. 2018;154(2):302–308. [DOI] [PMC free article] [PubMed] [Google Scholar]
Associated Data
This section collects any data citations, data availability statements, or supplementary materials included in this article.