

SUMMARY
Hedgehog pathway components and select GPCRs localize to the primary cilium, an organelle specialized for signal transduction. We investigated whether cells distinguish between ciliary and extraciliary GPCR signaling. To test whether ciliary and extraciliary cAMP convey different information, we engineered optogenetic and chemogenetic tools to control the subcellular site of cAMP generation. Generating equal amounts of ciliary and cytoplasmic cAMP in zebrafish and mammalian cells revealed that ciliary cAMP, but not cytoplasmic cAMP, inhibited Hedgehog signaling. Modeling suggested that the distinct geometries of the cilium and cell body differentially activate local effectors. The search for effectors identified a ciliary pool of Protein Kinase A (PKA). Blocking the function of ciliary PKA, but not extraciliary PKA, activated Hedgehog signal transduction and reversed the effects of ciliary cAMP. Therefore, cells distinguish ciliary and extraciliary cAMP using functionally and spatially distinct pools of PKA, and different subcellular pools of cAMP convey different information.
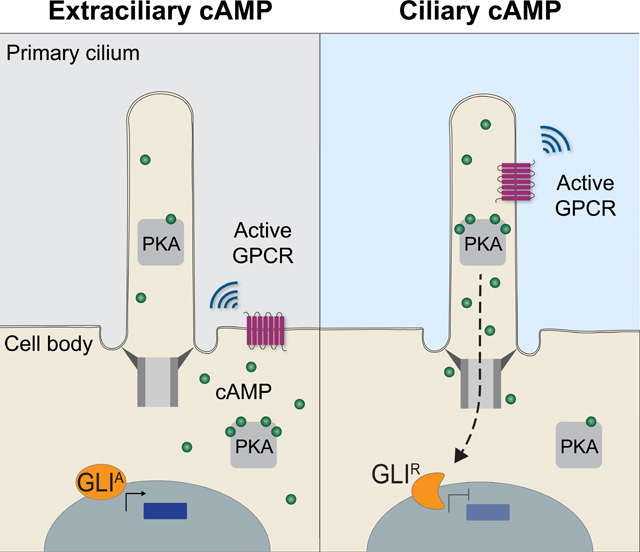
Graphical Abstract
INTRODUCTION
Development and homeostasis require cells to discriminate between signals, many of which are received by G protein-coupled receptors (GPCRs), the largest class of vertebrate receptors and the targets of many therapeutic drugs (Hauser et al., 2017; Pierce et al., 2002). Ligand binding rearranges GPCR transmembrane domains to activate heterotrimeric G proteins such as Gαs and Gαi. Activating Gαs stimulates adenylyl cyclases to produce cAMP whereas activating Gαi inhibits cAMP production (Pierce et al., 2002).
A subset of GPCRs localize not to the plasma membrane, but to the membrane of the primary cilium, an organelle specialized for signal transduction and present on most vertebrate cells (Anvarian et al., 2019; Gigante and Caspary, 2020). The distinct lipid and protein composition of the cilium is maintained through a diffusion barrier at the ciliary base called the transition zone (Gonçalves and Pelletier, 2017). More than 30 different GPCRs localize to cilia, including SSTR3, GPR161 and MC4R, as well as the GPCR-related protein Smoothened (SMO) (Mykytyn and Askwith, 2017).
SMO is the central component of the Hedgehog (HH) signal transduction pathway and, in vertebrates, functions at primary cilia to activate GLI transcriptional effectors (Bangs and Anderson, 2017; Corbit et al., 2005; Huangfu et al., 2003). In addition to positive effectors of HH signal transduction, negative pathway regulators localize to cilia, including GPR161 (Mukhopadhyay et al., 2013). Apart from GPR161, both cAMP and PKA negatively regulate HH signal transduction (Hammerschmidt et al., 1996; Jiang and Struhl, 1995; Kong et al., 2019; Li et al., 1995; Wang et al., 1999).
HH signaling orchestrates diverse developmental and homeostatic processes, including patterning of somites (Fan and Tessier-Lavigne, 1994). Somites are segmental mesodermal aggregates that give rise to multiple cell types, including muscle (Blagden et al., 1997; Devoto et al., 1996; Morin-Kensicki and Eisen, 1997; Roy et al., 2001). In zebrafish, the notochord produces Sonic hedgehog (Shh) which at high levels specifies muscle pioneers (MPs) which express the transcription factors Engrailed (En) and Prox1 and at lower levels specifies superficial slow fibers (SSFs) which express the transcription factor Prox1 alone (Barresi et al., 2000; Hirsinger et al., 2004; Wolff et al., 2003).
Despite the many signals communicated through cAMP, cells distinguish these signals in order to impart distinct effects (Calebiro and Koszegi, 2019; Zaccolo and Pozzan, 2002). For example, epinephrine and prostaglandin E1 induce similar increases in cAMP and PKA activity in cardiomyocytes, but only epinephrine induces Troponin I phosphorylation and increases contractility (Brunton et al., 1979; Keely, 1979).
How cells distinguish signals that induce a shared diffusible second messenger is poorly understood. One suggestion has been that different receptors form stable complexes with dedicated effectors (Tolkovsky and Levitzki, 1978a, 1978b). Another hypothesis is that different signals are transduced in distinct subcellular domains (Buxton and Brunton, 1983). Subcellular domains with differential GPCR activity include lipid nanodomains and clathrin-associated hot spots within the plasma membrane (Agarwal et al., 2014; Allen et al., 2007; Insel et al., 2005; Sungkaworn et al., 2017).
We hypothesized that physically sequestering signaling pathways to either the cilium or the cell body allows parallel information processing without crosstalk. To test whether cells distinguish ciliary and nonciliary cAMP, we generated optogenetic and chemogenetic tools to specifically manipulate ciliary and nonciliary cAMP levels.
RESULTS
An optogenetic system to generate cAMP inside or outside cilia
To assess whether cAMP generated inside or outside cilia communicate different information, we developed an optogenetic system based on a bacterial photoactivatable adenylyl cyclase (bPAC) (Figure 1A) (Stierl et al., 2010). bPAC generates cAMP in proportion to the amount of blue light delivered. We generated transgenic zebrafish that express either MYC-tagged cytoplasmic bPAC (Cyto-bPAC) or MYC-tagged ARL13B-bPAC (Cilia-bPAC) to investigate the functions of cytosolic and ciliary cAMP during vertebrate development. Immunofluorescence imaging of Cyto-bPAC and Cilia-bPAC in zebrafish embryos revealed that as expected, Cyto-bPAC localized to the cytoplasm and Cilia-bPAC localized to the cilium (Figure 1B and S1A).
Figure 1. An optogenetic system for inducing cAMP in vivo at specific subcellular locations.

(A) Schematic of system to optogenetically control cAMP generation by targeting bPAC, a blue-light activated adenylyl cyclase, to subcellular locations. Cyto-bPAC (green) localizes to the cytoplasm. Cilia-bPAC (green), a fusion of bPAC and the ciliary protein ARL13B, localizes to cilia.
(B) Immunofluorescence imaging of wild-type and transgenic zebrafish expressing either Myc-tagged Cyto-bPAC or Cilia-bPAC. Images depict 24hpf somites stained for bPAC (Myc, green), cilia (acetylated tubulin, TubAC, red) and nuclei (Hoechst, blue). Arrowheads indicate cilia depicted in the insets. Insets display overlay of bPAC, cilia and nuclei (top), cilia alone (middle), and bPAC alone (bottom). Scale bars, 10μm and 1μm (inset).
(C) Quantification of cAMP in wild-type and transgenic bPAC embryos with and without light stimulation. The adenylyl cyclase agonist forskolin (FSK, 10μM) increased cAMP in wild-type embryos. The phosphodiesterase inhibitor 3-isobutyl-1-methylxanthine (IBMX, 100μM) was used to inhibit cAMP degradation for all conditions. n=9–17 embryos per condition. Significance was determined via two-way ANOVA followed by Tukey’s multiple comparison test throughout. A p value less than 0.05 was considered statistically significant and is denoted as follows: *<0.05, **<0.01, ***<0.001, and ****<0.0001. Data are represented as means ± SD.
(D) Immunofluorescence imaging of somites expressing Gli:mCherry, a reporter of Hedgehog signal transduction. Embryos treated with increasing doses of FSK from 6 to 24hpf were stained for Gli:mCherry (mCherry, red) and nuclei (Hoechst, blue). Scale bar, 40μm.
To assess whether Cyto-bPAC and Cilia-bPAC embryos generate cAMP specifically upon stimulation with blue light, we measured cAMP levels and found that Cyto-bPAC and Cilia-bPAC embryos raised in the dark contained levels of cAMP equivalent to those of wild-type embryos (Figure 1C). Treatment with the adenylyl cyclase agonist forskolin increased cAMP levels, as expected (Figure 1C). Similar to forskolin, blue light regimens induced equivalent amounts of cAMP in Cyto-bPAC and Cilia-bPAC transgenic embryos (Figure 1C). Transgenic embryos treated with these light regimens were morphologically indistinguishable from light-stimulated wild-type embryos or transgenic embryos raised in the dark, indicating that neither blue light nor the resultant cAMP grossly alters development (Figure S1B).
Ciliary cAMP specifically modulates HH signal transduction
As cAMP negatively regulates HH signal transduction (Barresi et al., 2000; Wang et al., 1999), we investigated whether ciliary or cytoplasmic cAMP affect HH signal transduction. To begin to investigate HH signaling, we assessed Gli:mCherry, a previously described reporter that induces mCherry expression upon activation of HH signaling (Mich et al., 2014). As expected, treating zebrafish embryos with forskolin reduced Gli:mCherry expression in the developing somite (Figure 1D). Cilia-bPAC expression in the absence of light had no effect on Gli:mCherry expression (Figure 2A,B), indicating that the ARL13B ciliary targeting sequence does not affect HH signaling. Notably, treating Cyto-bPAC transgenic zebrafish embryos with light had no effect on Gli:mCherry expression (Figure 2A,B). In striking contrast, activating Cilia-bPAC attenuated Gli:mCherry expression (Figure 2A,B).
Figure 2. Cilium-generated cAMP specifically inhibits HH signal transduction.

(A) Immunofluorescence imaging of somites 12–14 in 24hpf Gli:mCherry transgenic embryonic somites without bPAC (Control), expressing Cyto-bPAC or expressing Cilia-bPAC raised in the dark or stimulated with light. Scale bar, 40μm.
(B) Quantification of Gli:mCherry-expressing cells per somite. n=8–10 embryos collected over two independent clutches. Cells in somites 12 through 15 were counted and an average value of cells per somite was determined for each embryo. The average values per embryo were used as individual data points in all graphs and statistical analyses.
(C) Schematic of how HH signaling affects somitic cell fate. Muscle pioneer cells (MPs, green) express high levels of En and are specified by high levels of HH signaling. Superficial slow fibers (SSFs) express Prox1 and are specified by lower levels of HH signaling. Modest attenuation of HH signaling attenuates MP development, and more severe attenuation of HH signaling attenuates SFF development.
(D) Immunofluorescence imaging of En (green) and Prox1 (magenta) in wild-type and Cyto-bPAC- or Cilia-bPAC-expressing embryos with or without light stimulation. Scale bar, 40μm.
(E) Quantification of the average number of En-expressing cells per somite.
(F) Quantification of the average number of Prox1-expressing cells per somite. n=9–20 embryos for each condition. Each data point represents the average number of En or Prox1 expressing cells per somite 12 through 15 per 24hpf embryo. Significance was determined via two-way ANOVA followed by Tukey’s multiple comparison test. A p value less than 0.05 was considered statistically significant and is denoted as follows: *<0.05, **<0.01, ***<0.001, and ****<0.0001. Data are represented as means ± SD.
As another control for the dependence on ciliary localization, we created a version of Cilia-bPAC containing a missense mutation in human ARL13B that prevents ciliary localization, V359A (Gigante et al., 2020; Higginbotham et al., 2012). We injected mRNA encoding either MYC-tagged ARL13BV359A-bPAC (Nonciliary-bPAC) or Cilia-bPAC. As expected, Nonciliary-bPAC did not localize to cilia in zebrafish embryos and generates cAMP upon blue light stimulation (Figure S2A,B). Similar to Cyto-bPAC, stimulating Nonciliary-bPAC-expressing embryos with blue light had no effect on Gli:mCherry expression (Figure S2C,D). In contrast, blue light stimulation of embryos injected with mRNA encoding Cilia-bPAC decreased Gli:mCherry expression (Figure S2C,D). Therefore, in developing somites, cAMP generated in cilia, but not outside cilia, affects HH signaling.
In the developing zebrafish somite, HH signaling specifies slow muscle fiber types (Barresi et al., 2001; Blagden et al., 1997; Wolff et al., 2003). High levels of HH signaling specify high En- and Prox1-expressing MPs whereas lower levels specify Prox1-expressing SSFs. Attenuation of HH signaling therefore preferentially depletes MPs (Figure 2C). To test whether cytoplasmic or ciliary cAMP affect HH-dependent patterning, we quantified En- and Prox1-expressing somitic cells. Cyto-bPAC and Cilia-bPAC embryos raised in the dark produce numbers of En- and Prox1-expressing cells equivalent to those of wild-type embryos, confirming that the ARL13B ciliary targeting sequence does not affect HH signaling (Figure 2D–F). Stimulating wild-type or Cyto-bPAC embryos with light did not alter the number of En- or Prox1-expressing somitic cells (Figure 2D–F). In contrast, stimulating Cilia-bPAC embryos with light reduced the numbers of both En- and Prox1-expressing cells (Figures 2D–F). Thus, HH-dependent cell fates in the developing somite are preferentially inhibited by ciliary, but not cytoplasmic, cAMP production.
To test whether ciliary or cytoplasmic cAMP affect HH signaling in tissues beyond the somites, we examined how cAMP affects HH-dependent cell fates in the developing neural tube. In vertebrates, Shh produced in the notochord and medial floor plate patterns the ventral neural tube (Figure S2E) (Briscoe et al., 2000; Chiang et al., 1996; Ericson et al., 1996). Lateral floor plate cells expressing nkx2.2b are specified by high HH signaling, and neighboring motor neuron progenitor cells expressing olig2 are specified by lower HH signaling (Guner and Karlstrom, 2007; Odenthal et al., 2000). As in somite development, neither embryos expressing Cyto-bPAC and stimulated with light nor embryos expressing Cilia-bPAC and raised in the dark exhibited perturbation of HH-mediated patterning (Figure S2F,G). In contrast, Cilia-bPAC embryos treated with light exhibited decreased expression of both nkx2.2b and olig2 (Figure S2F,G). Thus, in neural tube patterning, as in somite patterning, cilium-generated cAMP but not cytoplasm-generated cAMP inhibits HH signaling. We conclude that zebrafish cells interpret cAMP generated in the cilium differently from cAMP generated in the cytoplasm.
To assess whether mammalian cells also differentially interpret cilium- and cytoplasm-generated cAMP, we generated NIH/3T3 cell lines stably expressing either GFP-tagged Cyto-bPAC or Cilia-bPAC. Immunofluorescence imaging revealed that, as in zebrafish, Cyto-bPAC localized to the cytoplasm and Cilia-bPAC localized to the cilium (Figure 3A). Immunoblot revealed that Cyto-bPA and Cilia-bPAC are expressed at comparable levels (Figure 3B). Blue light stimulation of Cyto-bPAC and Cilia-bPAC cell lines generated similar levels of cAMP, as measured by ELISA (Figure 3C).
Figure 3. Cilium-generated cAMP inhibits HH signal transduction in mammalian cells.

(A) Immunofluorescence imaging of wild-type and transgenic NIH/3T3 cells stably expressing GFP-tagged Cyto-bPAC or Cilia-bPAC under the control of a minimal δ-crystallin promoter stained for GFP-tagged bPAC (green), cilia (TUBAC, red), basal bodies (γTUB, grayscale) and nuclei (blue). Arrowheads indicate cilia depicted in insets. Insets display overlay (top), cilia and basal bodies alone (middle), and GFP-tagged bPAC alone (bottom). Scale bars, 10μm and 2μm (inset).
(B) Immunoblot of wild-type and transgenic NIH/3T3 cells stably expressing GFP-tagged Cyto-bPAC and Cilia-bPAC under the control of the EF1α promoter. Whole-cell protein lysates were immunoblotted with antibodies to GFP and GAPDH loading control.
(C) Quantification of cAMP in wild-type or transgenic cells expressing Cyto-bPAC or Cilia-bPAC under the control of a minimal δ-crystallin promoter by ELISA. Cells were stimulated with pulsed 0.14mW/cm2 470nm blue light or kept in the dark in the presence of 100μM IBMX for 30 minutes. cAMP concentration was determined by ELISA and normalized to total protein content. n=4 biological replicates. Significance was determined via two-way ANOVA followed by Tukey’s multiple comparison test.
(D) Quantitation of Ciliary Pink Flamindo fluorescence in Cyto-bPAC-expressing (red) or Cilia-bPAC-expressing (blue) cells either with (open points) or without blue light (filled points). Cells were stimulated with 100ms pulses of 52.7mW/cm2 blue light every three seconds for 1 minute. At the end of that minute, 100μM Forskolin was added. We calculated the ratio of Pink Flamindo to mIFP fluorescence normalized to the ratio at t=0. Each trace represents n>12 cells from three independent experiments. The maximum Ciliary Pink Flamindo fluorescence upon blue light stimulation is also shown. Significance was assessed using two-way ANOVA followed by Tukey’s multiple comparison test.
(E) qRT-PCR measurement of Gli1 expression by wild-type, Cyto-bPAC-expressing or Cilia-bPAC-expressing cells stimulated for 4 hours with vehicle (DMSO), 200nM SAG, or 200nM SAG with pulsed 0.14mW/cm2 470nm blue light. n=3 biological replicates. Significance was assessed using one-way ANOVA followed by Tukey’s multiple comparison test.
(F) Ratios of Gli1 expression in wild-type and Cyto-bPAC-expressing or Cilia-bPAC-expressing cells treated with 200nM SAG and blue light to Gli1 expression treated with 200nM SAG alone. Significance was assessed using one-way ANOVA followed by Tukey’s multiple comparison test.
(G) Immunoblots of GLI3 and GAPDH of whole-cell lysates from wild-type, Cyto-bPAC-expressing or Cilia-bPAC-expressing cells stimulated as in (E).
(H) Quantification of GLI3 repressor (GLI3R) normalized to GAPDH (loading control). n=3 biological replicates. For all panels, p values are indicated as follows: *<0.05, **<0.01, ***<0.001 and ****<0.0001. Data are represented as means ± SD.
As cAMP is highly diffusible and no membrane barrier exists between the cilium and the cytoplasm, we predicted that cAMP generated in the cilium can enter the cytoplasm and vice versa. To test this hypothesis, we visualized cAMP dynamics in the cilium and cytoplasm upon Cyto-bPAC and Cilia-bPAC activation. To record cAMP levels independent of blue light stimulation of bPAC, we utilized a red fluorescent cAMP indicator, Pink Flamindo (Pink Fluorescent cAMP indicator) (Harada et al., 2017). cAMP increases Pink Flamindo fluorescence and, as expected, stimulating Cyto-bPAC and Cilia-bPAC with blue light induced similar increases in Pink Flamindo fluorescence (Figure S3A).
To generate a ratiometric cAMP biosensor targeted to cilia, we fused it to RAB23 Q68L, which constitutively localizes to cilia, and a far-red fluorescent protein mIFP to generate Ciliary Pink Flamindo (Lim and Tang, 2015; Yu et al., 2015). As expected, forskolin increased the ratio of Pink Flamindo to mIFP fluorescence at the cilium (Figure S3B,C). To measure cAMP diffusion between the cytoplasm and cilium, we deployed Ciliary Pink Flamindo in Cyto-bPAC and Cilia-bPAC cells. Consistent with the absence of barriers to cAMP diffusion between the cytoplasm and the cilium, stimulating Cyto-bPAC increased Ciliary Pink Flamindo fluorescence (Figure 3D). Interestingly, Cyto-bPAC activation did not increase Ciliary Pink Flamindo fluorescence to the same levels as did Cilia-bPAC activation (Figure 3D). Thus, cAMP produced in the cytoplasm diffuses into the cilium but does not reach levels equivalent to those caused by local production.
As cilium-generated cAMP specifically inhibits HH-dependent patterning in zebrafish embryos, we investigated whether cilium-generated or cytoplasm-generated cAMP inhibits HH signal transduction in mammalian cells. To this end, we treated wild type, Cyto-bPAC- or Cilia-bPAC-expressing cells with the Smoothened agonist SAG. Each cell line equivalently induced Gli1 in response to SAG, indicating that neither unstimulated bPAC nor its ciliary targeting sequence perturbs HH signaling (Figure 3E,F). Stimulating Cyto-bPAC-expressing cells with blue light had no effect on SAG-mediated induction of Gli1 (Figure 3E,F). In contrast, stimulating Cilia-bPAC-expressing cells with blue light inhibited SAG-mediated induction of Gli1 (Figure 3E,F). Thus, as in zebrafish, cilium-produced cAMP preferentially inhibits HH signal transduction in mammalian cells.
To investigate how cilium-produced cAMP preferentially inhibits HH signal transduction, we examined whether cAMP affects the trafficking of SMO and GPR161 at cilia. In the absence of HH stimulation, the GPCR GPR161 accumulates in cilia (Mukhopadhyay et al., 2013). Addition of HH ligand causes coordinated trafficking of SMO into cilia and GPR161 out of cilia (Corbit et al., 2005; Pal et al., 2016). To determine whether ciliary cAMP impacts trafficking of SMO or GPR161 to or from cilia, we quantified SMO and GPR161 fluorescence at the cilium in wild-type, Cyto-bPAC and Cilia-bPAC-expressing cells, both with and without SAG. SMO robustly localized to cilia in the presence of SAG (Figure S3D,E). Stimulation of wild-type, Cyto-bPAC or Cilia-bPAC cells with blue light did not attenuate SAG-induced ciliary localization of SMO (Figure S3D,E). GPR161 localized to cilia in vehicle (DMSO)-treated cells and not upon SAG treatment (Figure S3F,G). Stimulation of wild-type, Cyto-bPAC and Cilia-bPAC cells with blue light in the presence of SAG did not attenuate GPR161 exit from cilia (Figure S3F,G). Therefore, ciliary cAMP does not affect the regulated ciliary trafficking of SMO or GPR161.
In the absence of HH, GLI3 is proteolytically processed to form GLI3R, a truncated form that functions as a transcriptional repressor of HH transcriptional targets (Dai et al., 1999; Wen et al., 2010). Activation of HH signaling inhibits GLI3R formation (Humke et al., 2010; Jiang and Struhl, 1998; Wang et al., 2000). To determine whether cilium- or cytoplasm-generated cAMP affects GLI3 processing, we activated HH signaling in wild-type, Cyto-bPAC-expressing or Cilia-bPAC-expressing cells using SAG either with or without blue light stimulation and immunoblotted for GLI3. In the absence of blue light, SAG reduced GLI3R in all three cell lines (Figure 3G,H). Blue light had no effect on this reduction of GLI3R in wild-type or Cyto-bPAC-expressing cells (Figure 3G,H). In contrast, blue light blocked the SAG-induced reduction of GLI3R in Cilia-bPAC-expressing cells (Figure 3G,H). Thus, ciliary cAMP generation specifically inhibits HH signal transduction downstream of SMO and GPR161 trafficking and upstream of GLI3 processing.
Ciliary GPCRs regulate HH pathway output
If cilium-generated cAMP specifically inhibits the HH pathway, we hypothesized that ciliary GPCRs should regulate the HH pathway, but plasma membrane GPCRs should not. To test this hypothesis, we developed cilium- and plasma membrane-localized versions of a Gαs-coupled designer receptor exclusively activated by a designer drug (DREADD). DREADDs are GPCRs engineered to be selectively activated by the otherwise pharmacologically inert drug clozapine-N-oxide (CNO) (Armbruster et al., 2007; Roth, 2016). Upon binding of CNO, Gαs-coupled DREADD activates the production of cAMP (Guettier et al., 2009). To localize Gαs-coupled DREADD to cilia, we fused it to the ciliary protein ARL13B and GFP (hereafter referred to as Cilia-DREADD, Figure 4A). We generated NIH/3T3 fibroblast cell lines stably expressing GFP-tagged Cilia-DREADD or DREADD without ARL13B (hereafter referred to as Plasma membrane- or PM-DREADD). Immunofluorescence imaging confirmed that, as expected, PM-DREADD localized to the plasma membrane and Cilia-DREADD localized to the cilium (Figure 4B, Figure S4A). Immunoblotting whole-cell lysates from PM-DREADD- and Cilia-DREADD-expressing cells for the GFP tag indicated that the DREADDs are expressed at similar levels (Figure S4B).
Figure 4. Ciliary GPCR activity specifically modulates HH signal transduction.

(A) Schematic of tools to control a Gɑs-coupled designer GPCR at distinct subcellular locations. PM-DREADD localizes to the plasma membrane. Cilia-DREADD, a fusion with the ciliary protein ARL13B, localizes to cilia. These Gɑs-coupled DREADDs induce cAMP generation upon stimulation with their ligand, the otherwise pharmacologically inert drug CNO.
(B) Immunofluorescence imaging of wild-type and transgenic NIH/3T3 cells stably expressing GFP-tagged PM-DREADD or Cilia-DREADD. Images depict cells stained for the GFP-tagged DREADDs (GFP, green), cilia (TUBAC, red), basal bodies (γTUB, grayscale) and nuclei (Hoechst, blue). Insets indicate amount of GFP-tagged DREADD localization to the cilium (defined by TUBAC and γTUB). Scale bars, 10μm and 1μm (inset).
(C) Quantification of cAMP in wild-type and PM-DREADD- or Cilia-DREADD-expressing NIH/3T3 transgenic cell lines. Cells were stimulated with either vehicle (DMSO) or 100nM CNO in the presence of 10μM IBMX for 3 hours. cAMP concentration was determined by ELISA and normalized to total protein content. n=4 biological replicates. Significance was determined via two-way ANOVA followed by Tukey’s multiple comparison test. Data are represented as means ± SD.
(D)Expression of Gli1 by wild-type and PM-DREADD- or Cilia-DREADD-expressing cells stimulated with vehicle (DMSO), 200nM SAG, or 200nM SAG and 5nM CNO for 5 hours before measurement by qRT-PCR. n=4–5 biological replicates. Significance was determined via one-way ANOVA followed by Tukey’s multiple comparison test.
(E) Ratios of Gli1 expression in WT and PM-DREADD- or Cilia-DREADD-expressing cells treated with 200nM SAG and 5nM CNO to Gli1 expression treated with 200nM SAG alone. Significance was determined via one-way ANOVA followed by Tukey’s multiple comparison test. n=4–5 biological replicates.
(F) Immunofluorescence imaging of wild-type and transgenic NIH/3T3 cells stably expressing SSTR3-GFP, a ciliary Gαi-coupled GPCR, fused to GFP. Images depict cells stained for SSTR3-GFP (GFP, green), cilia (ARL13B, red), basal bodies (FOP, grayscale) and nuclei (Hoechst, blue). Cells were treated either vehicle (DMSO) or 10μM somatostatin (SST) for 5 hours. Insets depict SSTR3-GFP localization to the cilium (defined by ARL13B and FOP). Scale bars, 10μm and 1μm (inset).
(G) Quantification of SSTR3-mediated inhibition of cAMP production. Wild-type and SSTR3-GFP-expressing NIH/3T3 cells were stimulated with either vehicle (DMSO), 10 μM FSK, or 10μM FSK and 10μM SST in the presence of 10μM IBMX for 30 minutes. cAMP concentration was measured by ELISA and normalized to total protein content. n=3–6 biological replicates. Significance was determined via one-way ANOVA followed by Tukey’s multiple comparison test. Data are represented as means ± SD.
(H) Expression of Gli1 by wild-type and SSTR3-GFP-expressing NIH/3T3 cells treated with vehicle (DMSO), 3nM SAG or 10μM SST for 5 hours and measured by qRT-PCR. n=4 biological replicates. Significance was determined via one-way ANOVA followed by Tukey’s multiple comparison test. Data are represented as means ± SD. For all panels, a p value less than 0.05 was considered statistically significant and is denoted as follows: *<0.05, **<0.01, ***<0.001, and ****<0.0001.
To test whether Cilia-DREADD can activate G proteins, we expressed mini-G, a fluorescently-tagged engineered G protein that is recruited to active GPCRs (Carpenter and Tate, 2016; Wan et al., 2018). In Cilia-DREADD-expressing cells, CNO induced translocation of mApple-tagged mini-G to the cilium (Figure S4C,D). Thus, Cilia-DREADD adopts an active conformation in the cilium specifically upon ligand binding. Importantly, PM-DREADD- and Cilia-DREADD-expressing cells with CNO generated equivalent amounts of cAMP (Figure 4C). Activating either DREADD with CNO did not affect cell survival or ciliary length (Figure S4E,F).
Because we had found that ciliary, but not cytoplasmic, cAMP regulated HH signaling, we hypothesized that ciliary, but not plasma membrane, GPCR signaling would regulate HH signaling. To begin to test whether ciliary and nonciliary GPCRs can modulate HH pathway activity, we treated wild-type, PM-DREADD- or Cilia-DREADD-expressing NIH/3T3 cells with SAG. Each cell line induced Gli1 in response (Figure 4D). Treatment with CNO alone did not affect basal Gli1 expression (Figure S4G). Activating PM-DREADD with CNO in the presence of SAG did not affect Gli1 induction (Figure 4D,E). In contrast, activating Cilia-DREADD with CNO inhibited the ability of SAG to induce Gli1 (Figure 4D,E). Thus, as with cAMP, ciliary GPCR activity specifically affects HH signal transduction.
Whereas Gαs-coupled GPCRs, such as Cilia- and PM-DREADDs, stimulate cAMP production, Gαi-coupled GPCRs inhibit cAMP production. As Cilia-DREADD, a ciliary Gαs-coupled GPCR, inhibits the HH pathway, we hypothesized that a ciliary Gαi-coupled GPCR would activate the HH pathway. To test this hypothesis, we investigated the activity of SSTR3, a Gαi-coupled GPCR that localizes to primary cilia (Berbari et al., 2008; Green et al., 2015; Händel et al., 1999). We stably expressed GFP-tagged SSTR3 in NIH/3T3 cells (Figure 4F). As expected, activating SSTR3 with somatostatin opposed forskolin-mediated induction of cAMP, confirming that SSTR3 is Gαi-coupled (Figure 4G). We stimulated wild-type or SSTR3-expressing cells with somatostatin and assayed HH pathway activity. Wild-type cells showed increased expression of the HH target gene Gli1 in response to SAG, but not somatostatin. However, stimulating SSTR3-expressing cells with somatostatin induced Gli1 expression to similar levels as treatment with SAG (Figure 4H). Thus, whereas ciliary cAMP inhibits the HH transcriptional response, activating a ciliary Gαi-coupled GPCR activates the HH transcriptional response.
Together, these experiments with engineered and natural GPCRs further support the conclusion, demonstrated above using subcellular control of cAMP generation, that ciliary and nonciliary cAMP convey separate information to the cell. Additionally, the ability of a ciliary Gαi-coupled GPCR to activate the HH transcriptional response and a ciliary Gαs-coupled GPCR to do the opposite indicates that HH signal transduction is responsive to both increases and decreases in ciliary cAMP.
Ciliary PKA regulates HH signal transduction
The diffusibility of cAMP between the cytoplasm and the cilium would seem to preclude the cell from distinguishing subcellular pools, critical for the ability of separate pools to impart distinct information (Marley et al., 2013). To investigate how the cell may distinguish ciliary and extraciliary cAMP even without barriers to its intracellular movement, we constructed a computational model of a ciliated cell and modeled the kinetics of how ciliary and extraciliary cAMP activate a cAMP effector protein, such as PKA, at the cilium (Figure 5A and Table S1). Our model illustrated that the approximately 13-fold greater surface to volume ratio of the cilium can account for more efficient activation of a ciliary cAMP effector protein by ciliary cAMP than by nonciliary cAMP (Figure 5A and Figure S5A,B). Interestingly, this difference in effector sensitivity did not require differences in ciliary and nonciliary diffusion or PKA concentrations but did depend on both ciliary length and diameter (Figure S5C,D). Thus, the different geometries of the cilium and cell body may allow cells to differentially activate cAMP effector proteins at the cilium and cell body.
Figure 5. PKA acts at cilia to regulate HH signal transduction in vivo.

(A) Modeling differential ciliary membrane localized PKA activation upon cAMP generated at either the ciliary membrane or at the plasma membrane. Left panel, simulated distribution of PKA localization to the plasma membrane and cilium (inset). Scale bar, 5μm. Right panel depicts the percent of activated ciliary membrane localized PKA upon either ciliary membrane or plasma membrane cAMP generation.
(B) Schematic of tools to inhibit PKA at distinct subcellular locations. Dominant negative PKA (dnPKA), a form of PKA-R that constitutively binds and inhibits PKA-C, was fused to RAB23 S23N to prevent it from localizing to cilia (Extraciliary dnPKA). dnPKA was fused to RAB23 Q68L to localize it to cilia (Ciliary dnPKA). dnPKA was fused to 2x-PACT to localize it to the basal body (Basal Body dnPKA).
(C) Immunofluorescence imaging of zebrafish somites either uninjected or expressing GFP-tagged untargeted dnPKA, Extraciliary dnPKA, Basal Body dnPKA, or Ciliary dnPKA. Images depict 24hpf somites stained for the GFP tag on dnPKA (green), cilia (TubAC, red), basal bodies (γTUB, grayscale) and nuclei (Hoechst, blue). Arrowheads indicate cilia depicted in inset. Insets display overlay of dnPKA, cilia and basal bodies (left), overlay of cilia and basal bodies (middle), and dnPKA alone (right). Scale bars, 4μm and 1μm (inset).
(D) Immunofluorescence imaging of Gli:mCherry-transgenic somites expressing GFP alone or the indicated dnPKAs. Images depict 24hpf somites stained for En (green) and mCherry (magenta). Scale bar, 40μm.
(E) Immunoblot of lysates from 24hpf zebrafish embryo expressing indicated GFP-tagged forms of dnPKA. Blotting for β-actin controls for loading.
(F) Relative GFP fluorescence of control uninjected embryos, Extraciliary dnPKA-expressing embryos and Ciliary dnPKA-expressing embryos. Fluorescence was normalized to the mean of uninjected embryos. Data are represented as means ± SD.
(G) Quantification of Gli:mCherry-expressing cells per somite of uninjected embryos, and those expressing GFP, untargeted dnPKA, Extraciliary dnPKA, Basal Body dnPKA, or Ciliary dnPKA. Each point represents the number of mCherry-expressing cells averaged over four somites per embryo. Cells in somites 12 through 15 were counted and an average value of cells per somite was determined for each embryo. The average values per embryo were used as individual data points in all graphs and statistical analyses.
(H) Quantification of En-expressing MPs per somite of uninjected embryos, and those expressing GFP, untargeted dnPKA, Extraciliary dnPKA, Basal Body dnPKA, or Ciliary dnPKA. For Basal Body dnPKA-expressing embryos, n=18 and for all other conditions, n>30 from three independent injections. Significance was determined via one-way ANOVA followed by Tukey’s multiple comparison test. A p value less than 0.05 was considered statistically significant and is denoted as follows: *<0.05, **<0.01, ***<0.001, and ****<0.0001. Data are represented as means ± SD.
One prediction of this computational model is that producing supraphysiological levels of cAMP will overcome the geometric differences preventing cytoplasmic cAMP from triggering ciliary effectors (Figure S5E,F and Table S2). To test this prediction, we shined more light on Cilia-bPAC- or Cyto-bPAC-expressing zebrafish embryos. Increasing the amount of blue light delivered to Cilia-bPAC-expressing zebrafish embryos 5.4-fold or 13.4-fold further reduced the number of En-expressing somite cells, and blocked En-expressing cell formation at the high level (Figure S5G). As predicted by the model, stimulating Cyto-bPAC-expressing zebrafish embryos with more light attenuated the number of En-expressing somite cells (Figure S5G). Interestingly, even at the highest amount of light, Cilia-bPAC more potently inhibited the induction of En-expressing cells (Figure S5G). Similarly, in Cilia-DREADD-expressing NIH/3T3 cells, treatment with 20-fold increased concentrations of CNO further inhibited Gli1 induction in response to SAG (Figure S5H). As predicted by the model, treatment with high concentrations of CNO also attenuated relative Gli1 induction in response to SAG in PM-DREADD cells (Figure S5H). These results suggest that differential interpretation of cAMP generated inside and outside of the cilium can be overwhelmed by high, possibly supraphysiological concentrations of cAMP.
As the model suggested that even in the absence of a barrier to cAMP diffusion, differences in geometry can account for differential activation of a ciliary cAMP effector by cilium- and nonciliary-generated cAMP, we investigated whether the cAMP effector PKA was present in the cilium. In its inactive state, PKA is comprised of regulatory (e.g., PKA-RIα) and catalytic subunits (e.g., PKA-Cα) bound to an A kinase anchoring protein (AKAP) (Taylor et al., 2012; Wong and Scott, 2004). To test whether PKA can localize to cilia, we co-expressed PKA-RIα, PKA-Cα and the previously described ciliary AKAP GPR161 in NIH/3T3 cells (Bachmann et al., 2016). Co-expressed PKA-RIα and PKA-Cα co-localized with GPR161 in cilia (Figure S6A–C), suggesting that a ciliary pool PKA may allow the cell to discriminate between ciliary and cytoplasmic cAMP.
Previous work suggested that PKA acts at the basal body to regulate HH output, as PKA antibody staining shows an enrichment at the ciliary base (Barzi et al., 2009; Tuson et al., 2011). To test where within the cell PKA regulates HH signal transduction, we targeted dominant negative PKA (dnPKA), a constitutively repressive version of PKA-RI that is insensitive to cAMP (Clegg et al., 1987; Ungar and Moon, 1996), to three subcellular locations: the basal body, the cilium and outside of the cilium (Figure 5B). More specifically, we targeted dnPKA to the to the basal body by fusing it to tandem PACT domains (Gillingham and Munro, 2000). To target dnPKA to the cilium, we fused it to RAB23 Q68L, which constitutively localizes to cilia (Lim and Tang, 2015). To exclude dnPKA from the cilium, we fused it to RAB23 S23N, which localizes to the cell body (Leaf and von Zastrow, 2015). Expression of either RAB23 S23N or RAB23 Q68L by themselves in zebrafish did not affect somite patterning (Figure S6D–F). To assess the subcellular localization of the targeted forms of dnPKA, we expressed GFP-tagged versions in zebrafish embryos and assessed subcellular localization. As anticipated, dnPKA-GFP-2x-PACT localized to the ciliary base, dnPKA-GFP-RAB23 Q68L localized to cilia, and dnPKA-GFP-RAB23 S23N was extraciliary (Figure 5C). Therefore, we subsequently refer to these three forms of dnPKA as Basal body dnPKA, Ciliary dnPKA and Extraciliary dnPKA, respectively.
We hypothesized that, if ciliary PKA responds to ciliary cAMP to inhibit HH signaling, then blocking PKA within the cilium, but not at the basal body or outside the cilium, would activate the HH pathway. To begin to test this hypothesis, we assessed how inhibiting different subcellular pools of PKA affected the Gli:mCherry reporter of HH signaling in zebrafish embryos. Consistent with earlier reports, expression of GFP alone did not affect HH pathway activity and expression of untargeted dnPKA-GFP increased HH pathway activity (Figure 5D,G) (Barresi et al., 2000; Du et al., 1997). Neither Basal body dnPKA nor Extraciliary dnPKA affected Gli:mCherry reporter activity (Figure 5D,G). In contrast, expression of equivalent amounts of Ciliary dnPKA, as assayed by immunoblot and immunofluorescence quantification, expanded Gli:mCherry reporter activity (Figure 5D–G).
To assess whether ciliary PKA regulates, in addition to HH signal transduction, HH-mediated patterning, we examined whether inhibiting PKA in different subcellular locations affects somite patterning. Consistent with previous reports, expression of untargeted dnPKA-GFP increased the number of En-expressing cells per somite (Figure 5D,H) (Hammerschmidt et al., 1996). Extraciliary and Basal body dnPKA did not affect numbers of En-expressing cells. In contrast, Ciliary dnPKA increased En-expressing cells (Figures 5D,H). As inhibiting PKA in the cilium, but not elsewhere, activates GLI-dependent transcription and increases a HH-dependent fate, we conclude that a ciliary pool of PKA specifically regulates the HH pathway.
Ciliary PKA interprets ciliary cAMP
As we had found that ciliary PKA controls HH signal transduction, we hypothesized that ciliary PKA specifically interprets ciliary cAMP. However, Drosophila PKA acts in the HH pathway independent of cAMP (Jiang and Struhl, 1995). We predicted that if vertebrate ciliary PKA acts differently from Drosophila PKA and interprets ciliary cAMP levels, inhibiting ciliary PKA, but not extraciliary PKA, would restore HH-dependent cell fates suppressed by ciliary cAMP.
To begin to test the hypothesis that vertebrate PKA interprets ciliary cAMP, we made use of Cilia-bPAC transgenic embryos. Consistent with prior results, light-stimulated Cilia-bPAC transgenic embryos formed fewer HH-dependent high En-expressing cells than Cilia-bPAC transgenic embryos not stimulated with light (Figure 6A,B). Injection of untargeted dnPKA-GFP mRNA into Cilia- bPAC embryos stimulated with light restored the number of high En-expressing cells. Thus, cAMP affects HH-dependent patterning through activating PKA.
Figure 6. Ciliary PKA interprets ciliary cAMP to inhibit HH signal transduction.

(A) Immunofluorescence imaging of Cilia-bPAC transgenic embryos expressing GFP, untargeted dnPKA, Extraciliary dnPKA, Basal Body dnPKA, or Ciliary dnPKA and either raised in the dark or stimulated with light. Images depict 24hpf somites stained for MPs (En, green) and nuclei (Hoechst, blue). Scale bar, 40μm.
(B) Quantification of En-expressing cells per somite. Dark bars indicate embryos raised in the dark. Light bars indicate embryos stimulated with light. n=12–20 embryos per condition, from three independent injections. Statistical significance was assessed using a two-tailed unpaired t-test test to compare dark- and light-treated embryos for each construct. A p value less than 0.05 was considered statistically significant and is denoted as follows: *<0.05, **<0.01, ***<0.001, and ****<0.0001. Data are represented as means ± SD.
(C) Schematic model of how ciliary cAMP and PKA regulate HH signal transduction. Ciliary cAMP regulated by ciliary GPCRs locally activates a pool of ciliary PKA, which phosphorylates GLI to generate its transcriptional repressor form (GLIR). Equivalent amounts of cAMP produced by GPCRs in the plasma membrane do not activate ciliary PKA. Thus, upon HH stimulation and in the absence of ciliary PKA activity, GLI assumes its transcriptional activator form (GLIA) and induces HH target genes in the nucleus.
To address whether ciliary and extraciliary PKA respond differently to cilium- and cytoplasm-produced cAMP, we injected Cilia-bPAC transgenic embryos with mRNA encoding Basal Body, Extraciliary or Ciliary dnPKA and stimulated them with light. Expression of Basal Body or Extraciliary dnPKA did not restore En-expressing cells. In contrast, expression of Ciliary dnPKA specifically restored formation of En-expressing cells in Cilia-bPAC transgenic embryos treated with light (Figures 6A,B). These data demonstrate that ciliary PKA interprets ciliary cAMP to regulate vertebrate HH signal transduction in vivo.
DISCUSSION
The primary cilium transduces some forms of intercellular signaling, including signaling via the HH pathway and select ciliary GPCRs (Gigante and Caspary, 2020). Ciliary signals are transduced through diffusible second messengers, such as cAMP and calcium, that are shared with nonciliary signaling, raising the question of whether cells distinguish ciliary and extraciliary signaling. To investigate whether cells distinguish ciliary and extraciliary cAMP, we engineered optogenetic and chemogenetic tools that enable precise spatiotemporal control of cAMP production or GPCR activation specifically inside or outside of cilia.
Using the optogenetic tools in mammalian cells or zebrafish development revealed that activating cAMP production in cilia, but not outside cilia, preferentially inhibited HH signal transduction and HH-dependent cell fate specification in vivo. Similarly, in mammalian cells, generating cAMP in cilia, but not outside cilia, inhibited HH signal transduction. Thus, cilia-generated cAMP is functionally distinct from cAMP produced in the cytoplasm, and the information content of cAMP depends on its site of origin.
The conventional view of GPCR signaling is that coupling to heterotrimeric G proteins occurs at the plasma membrane (Neves et al., 2002). The primary ciliary membrane is contiguous to, but compositionally distinct from, the plasma membrane. To directly test how ciliary and plasma membrane GPCRs may function differently, we engineered a Gαs-coupled DREADD localized to either the ciliary or plasma membranes. Interestingly, we found that only ciliary DREADD activation inhibited HH target gene induction. Thus, both subcellularly targeted bPAC and DREADDs reveal that the cell distinguishes between cilium-generated and nonciliary cAMP (Figure 6C).
We conclude that, by discriminating between ciliary and plasma membrane production of cAMP, cells independently interpret GPCR-mediated information in these two compartments even though both are transduced through a common, diffusible second messenger. In addition to SSTR3 and GPR161, approximately 30 GPCRs localize to primary cilia (Hilgendorf et al., 2016; Mykytyn and Askwith, 2017). We previously demonstrated that one of these, MC4R, operates at the primary cilia of hypothalamic neurons to trigger satiety and control feeding behavior (Siljee et al., 2018). We propose that the dependence of MC4R and other cilium-localized GPCRs on the cilium reflects the fact that their physiological effects are mediated, like HH patterning, specifically by ciliary cAMP.
One possible explanation for how cells differentially interpret equivalent amounts of cAMP produced in the cilium or cytoplasm would be if the ciliary transition zone, in addition to controlling protein trafficking between the cilium and cell body, also prevented the free diffusion of cAMP. However, the use of the Ciliary Pink Flamindo cAMP biosensor revealed that no barrier to cAMP diffusion exists. Instead, our computational model suggested that ciliary PKA can be specifically activated by ciliary cAMP to generate specific outputs, such as modulating HH signal transduction. Generating an equal amount of cAMP in the cilium or cytoplasm is expected to result in a higher local concentration in the cilium due to the approximately 5,000-fold difference in volume. Thus, even in the absence of a barrier to the free diffusion of cAMP separating the two compartments or differences in PKA concentration, ciliary PKA is differentially sensitive to ciliary cAMP.
In addition, as adenylyl cyclases are integral membrane proteins and the ratio of membrane area to cytosol volume is higher for a cylindrical cilium than for a spherical cell, the different geometries of the two compartments are also expected to contribute to differential sensitivity of ciliary PKA to ciliary cAMP. Our modeling further suggests that the length and diameter of the cilium tunes the cell’s differential sensitivity to ciliary and nonciliary cAMP. Similarly, modeling of neurons indicates that the length and diameter of dendrites and their spines affects cAMP-regulated calcium dynamics (Neves et al., 2008; Ohadi and Rangamani, 2019). While the model we computed does not incorporate the possibility that different adenylyl cyclases generate different basal levels of cAMP in the cell body and cilium, nor account for the possibility of differential sensitivity of PKA to cAMP (Jiang et al., 2019; Koschinski and Zaccolo; Moore et al., 2016), it does indicate that differences in geometry can explain how different subcellular locales can impart different information to the cell, even if the locales are contiguous and the information is diffusible.
PKA is a prominent effector of cAMP and an evolutionarily conserved regulator of the HH pathway (Hammerschmidt et al., 1996; Jiang and Struhl, 1995; Li et al., 1995). PKA prominently localizes to the basal body, where it has been proposed to inhibit the HH pathway (Tuson et al., 2011). Previous proteomics studies have identified PKA subunits in cilia (Bachmann et al., 2016; Mick et al., 2015). To test whether PKA acts at the basal body or cilium to interpret ciliary cAMP, we targeted dnPKA to the basal body, the cilium, or outside of cilia in zebrafish embryos. Whereas inhibiting PKA outside the cilium or at the basal body had no effect on HH signal transduction, blocking PKA within the cilium specifically activated HH signal transduction and expanded HH-dependent cell fates. Moreover, blocking PKA in the cilium restored MPs suppressed by Cilia-bPAC stimulation indicating that a functionally distinct pool of PKA within the cilium interprets ciliary cAMP. Importantly, blocking PKA in the cilium was sufficient to perturb HH signaling downstream of endogenous cAMP concentrations in the developing embryo.
We conclude that a ciliary pool of PKA is regulated specifically by ciliary cAMP to control HH signal transduction, and this local interpretation allows ciliary and extraciliary cAMP to impart different information to the cell. Ultimately, it is likely that ciliary PKA activity is communicated to the cell via regulation of GLI transcription factors that move from the cilium to the nucleus (Figure 6C) (Aza-Blanc et al., 1997; Méthot and Basler, 1999; Niewiadomski et al., 2013; Price and Kalderon, 1999; Wang et al., 1999). Consistent with this possibility, we found that generating cAMP in the cilium specifically affected GLI3 proteolytic processing. The finding that ciliary cAMP promotes GLI3 processing does not exclude the possibility that ciliary cAMP also inhibits GLI2 activation, especially as the fates inhibited by ciliary cAMP in the somite and neural tube partially depend on GLI2 activation (Karlstrom et al., 2003; Tyurina et al., 2005). It will be interesting to assess whether other second messengers use specific local effectors to distinguish the information content of different subcellular pools. Calcium may be another example, as it, like cAMP, diffuses and its concentration within the cilium and cell body can be independently regulated to have distinct biological effects (Delling et al., 2013; McGrath et al., 2003; Nonaka et al., 1998; Pazour et al., 2002; Pennekamp et al., 2002; Yoshiba et al., 2012).
This work reveals that ciliary cAMP, but not cytoplasmic cAMP, preferentially inhibits HH signaling in vivo. Ciliary cAMP activates PKA in the cilium to modulate HH signaling. More generally, our results reveal that cells differentially interpret cAMP generated in different subcellular domains, allowing for a shared second messenger to denote different meanings to the cell.
Limitations of the Study
The mathematical model of activation of PKA by ciliary and nonciliary cAMP assumed that the diffusion constant of cAMP in zebrafish cilia is similar to that measured in mammalian cytoplasm and that ciliary ATP is not limiting. Moreover, our model did not incorporate phosphodiesterase function, as the kcat, Vmax and subcellular locale of many phosphodiesterases are poorly defined. To investigate the ciliary and nonciliary functions of cAMP and PKA, we used multiple orthogonal tools that we localized to cilia, cytosol or plasma membrane using a variety of mechanisms. A small proportion of each may not localize to the principal subcellular location, and this subpopulation may contribute to the observed outputs. The recapitulation of key results using bPAC, a GPCR (SSTR3) and chemogenetic tools (DREADDs) suggests that levels of ciliary cAMP generated in this work are physiological. Confirming that the experimentally produced ciliary cAMP levels are physiological will require measuring ciliary cAMP concentrations in cilia under different signaling conditions.
STAR METHODS
RESOURCE AVAILABILITY
Lead Contact
Further information and requests for resources and reagents should be directed to and will be fulfilled by the Lead Contact, Jeremy Reiter (jeremy.reiter@ucsf.edu).
Materials Availability
All unique/stable reagents generated in this study are available from the Lead Contact without restriction.
Data and Code Availability
All software and code used in this study has been described and referenced under “Quantification and Statistical Analysis”.
EXPERIMENTAL MODEL AND SUBJECT DETAILS
Zebrafish husbandry
Adult Danio rerio zebrafish were maintained under standard laboratory conditions. Embryos were maintained at 28°C and staged as described previously (Kimmel et al., 1995). Cyto-bPAC and Cilia-bPAC transgenic zebrafish were raised in the dark until 5 days post fertilization, and then maintained on a 14h light/10h dark cycle. Zebrafish of Ekkwill (EKW) background were used as wild type. Cyto-bPAC and Cilia-bPAC transgenic lines were maintained on an EKW background. Gli:mCherry (Tg(8xGliBS:mCherry-NLS-Odc1)) transgenic zebrafish were a gift from James Chen (Mich et al., 2014). Embryos were maintained in egg water containing 60μg/mL sea salt (Instant Ocean) in distilled water. For forskolin treatment, embryos were incubated in forskolin dissolved in DMSO from 6 hours post fertilization (hpf) until 24hpf. Experimental zebrafish embryos typically were less than 24hpf, a stage at which sex cannot be readily determined and is unlikely to influence the biological processes under study. All zebrafish protocols were approved by the Institutional Animal Care and Use Committee (IACUC) of the University of California, San Francisco.
Mammalian Cell culture
NIH/3T3 Flp-In cells (ThermoFisher Scientific) were cultured in Dulbecco’s modified Eagle’s medium with high glucose (Gibco Cat# 11965118) supplemented with 10% newborn bovine calf serum (Gibco Cat# 16010159) and GlutaMAX supplement (Gibco Cat# 35050061). Cells were grown in the absence of antibiotics. To induce ciliation, cells were grown to confluence and starved overnight in Opti-MEM reduced serum medium (UCSF Cell Culture Facility).
METHOD DETAILS
Vector construction and mRNA synthesis
We amplified bPAC and full length human ARL13B (PfuUltra II, Stratagene) and cloned the amplicons into pDONR221 using BP Clonase II (ThermoFisher) to create pENTR-Cyto-bPAC-6x Myc and pENTR-Cilia-bPAC-6x Myc. bPAC was a gift from Mark von Zastrow (Tsvetanova and von Zastrow, 2014). To generate transposons, we combined pENTR-Cyto-bPAC or pENTR-Cilia-bPAC with p5E-Ub, Tol2 and p3E-MT-pA using LR Clonase II Plus (ThermoFisher Scientific) (Kwan et al., 2007). Clones were verified by sequencing (Integrated DNA Technologies).
For generating NIH/3T3 Flp-In cell lines expressing bPAC, Cyto-bPAC-GFP and Cilia-bPAC-GFP were cloned into a version of pGLAP5 (gift from Peter Jackson, Addgene Cat# 19706) with a minimal chicken lens δ-crystallin promoter (Ye et al., 2018) using the In-Fusion HD cloning kit (Takara). To generate a red-shifted ratiometric ciliary cAMP sensor, Pink Flamindo was fused to monomeric infrared fluorescent protein (mIFP) and RAB23 Q68L using In-Fusion. mIFP and RAB23 Q68L were gifts from Xiaokun Shu and Carol Wicking, respectively (Evans et al., 2003; Yu et al., 2015). Both Ciliary Pink Flamindo and Pink Flamindo alone were cloned into lentiviral vector pLVX to generate pLVX-Pink Flamindo-mIFP-RAB23 Q68L and pLVX-Pink Flamindo, respectively. Lentivirus was generated using the Lenti-X packaging single shot kit according to the manufacturer’s protocol (Takara).
For generating mRNA encoding ARL13B-bPAC-6xMyc, ARL13B-bPAC-6xMyc was cloned into the pCS2+8 expression vector using In-Fusion HD. The nonciliary control, ARL13BV359A-bPAC-6x Myc, was subsequently generated by site-directed mutagenesis using In-Fusion. To generate ciliary, nonciliary, and basal body dnPKA constructs, Rab23 or tandem PACT domains were appended to the 3’ end of pCS2+-dnPKA-GFP (Ungar and Moon, 1996) using In-Fusion. dnPKA is a PKA RIα (Prkar1a) containing mutations at cAMP binding sites (Addgene #16716) (Clegg et al., 1987). 2x PACT was amplified from 6x Halo-EGFP-2x PACT (Addgene #107265). RAB23 Q68L and RAB23 S23N constructs were gifts from Carol Wicking (Evans et al., 2003). For zebrafish injections, we synthesized capped messenger RNA using the mMESSAGE mMACHINE SP6 kit (Ambion) from pCS2+ constructs linearized with NotI.
Generation of stable cell lines and transient transfections
NIH/3T3 cell lines stably expressing Cyto-bPAC, Cilia-bPAC, PM-DREADD, Cilia-DREADD and SSTR3 were generated using the Flp-In system following manufacturer’s instructions. In brief, Flp-In NIH/3T3 cells (ThermoFisher) were transfected with Lipofectamine LTX with Plus reagent (Invitrogen) with the appropriate plasmids and a mouse codon-optimized FLP recombinase (gift from Philippe Soriano, Addgene Cat# 13793) and selected with 70μg/mL hygromycin (Gibco), with the exception of clones expressing bPAC under the control of an attenuated promoter when 40μg/mL was used. Single colonies were expanded, and protein expression was confirmed by immunoblotting and fluorescence microscopy for GFP (1:1000, Rockland, RRID:AB_218182).
To generate bPAC cell lines stably expressing Pink Flamindo-based cAMP biosensors, cells were transduced with lentivirus containing either Pink Flamindo or Ciliary Pink Flamindo in the presence of 4μg/mL polybrene and selected with 1μg/mL puromycin.
Transient transfections were performed using Transit-X2 transfection reagents (Mirus Bio) according to manufacturer’s instructions for NIH/3T3 cells. Plasmids encoding GPR161, PKA-RIα and PKA-Cα were generous gifts from Mark von Zastrow, Max Nachury and Roshanak Irannejad, respectively (Irannejad et al., 2017; Mick et al., 2015). mApple-tagged Mini-Gs was a generous gift from Roshanak Irannejad.
Generation of transgenic zebrafish and mRNA injection
Transgenic zebrafish were generated through Tol2-based transgenesis, as previously described (Kawakami et al., 2004). The resulting adults were mated with wild-type EKW fish and founders transmitting Cyto-bPAC or Cilia-bPAC were identified by genotyping progeny. Genotyping was performed using DNA extracted from either dechorionated embryos or adult fins. In brief, samples were incubated in DNA extraction buffer (10mM Tris pH8.0, 2mM EDTA, 0.2% Triton X-100) supplemented with 200μg/mL Proteinase K (Millipore Sigma) for 2 hours at 55°C. Proteinase K was inactivated by incubation at 100°C for 5 minutes. Genotyping was performed with specified primers (see Key Resources Table) using DreamTaq Green DNA Polymerase (ThermoFisher Scientific). We outcrossed founders to EKW wild-type zebrafish at least three times before experimentation. For each experiment, eggs were collected from a natural mating of one Cyto-bPAC or Cilia-bPAC transgenic animal and one EKW wild-type animal. This yielded approximately 50% transgenic embryos in each clutch. For dnPKA mRNA injections, we injected 45pg of capped mRNA at the one-cell stage. For bPAC mRNA injections, we injected 4.5pg of capped mRNA at the one-cell stage, examined localization of Nonciliary-bPAC and Cilia-bPAC at 18hpf, and stimulated with pulsed (500ms on, 500ms off) 0.35mW/cm2 470nm blue light from 14–18hpf. For injection of Rab23 S23N and Rab23 Q68L alone, we injected 18pg of capped mRNA at the one-cell stage. We incubated injected embryos in egg water and unfertilized embryos were removed 6–8 hours post injection.
KEY RESOURCES TABLE
| REAGENT or RESOURCE | SOURCE | IDENTIFIER |
|---|---|---|
| Antibodies | ||
|
| ||
| Rabbit anti-TUBAC | Cell Signaling | Cat# 5335; RRID:AB_10544694 |
| Rabbit anti-mCHERRY | Abeam | Cat# ab167453; RRID:AB_2571870 |
| Mouse anti-ENG | Developmental Studies Hybridoma Bank | Cat# 4D9 anti-engrailed/invected; RRID:AB_528224 |
| Rabbit anti-PROX1 | EMD Millipore | Cat# AB5475; RRID:AB_177485 |
| Goat anti-GFP | Rockland | Cat# 600–101-215; RRID:AB_218182 |
| Mouse anti-yTUB | Sigma Aldrich | Cat# T6557; RRID:AB_477584 |
| Mouse anti-ARL13B | UC Davis/NIH Neuromab Facility | Cat# 73–287; RRID:AB_11000053 |
| Mouse anti-SMO | Santa Cruz | Cat# sc-166685; RRID:AB_2239686 |
| Mouse anti-TUBAC | Sigma Aldrich | Cat# T6793; RRID:AB_477585 |
| Rabbit anti-GPR161 | Proteintech | Cat# 13398–1-AP; RRID:AB_2113965 |
| Goat anti-MYC | Novus | Cat# NB600–335; RRID:AB_10002720 |
| Rabbit anti-FOP | Proteintech | Cat# 11343–1-AP; RRID:AB_2103362 |
| Mouse anti-FLAG, clone M2 | Sigma Aldrich | Cat# P2983; RRID:AB_439685 |
| Mouse anti-mNeonGreen | ChromoTek | Cat# 32f6–100; RRID:AB_2827566 |
| Donkey seceondary antibodies for immunofluorescence | ThermoFisher Scientific | N/A |
| Hoechst 33342 | ThermoFisher Scientific | Cat# H2570 |
| Goat anti-GLI3 | R&D Systems | Cat # AF3690; RRID: AB_2232499 |
| Mouse anti-p-actin | Proteintech | Cat# 66009–1 -Ig; RRID:AB_2687938 |
| Mouse anti-GAPDH | Proteintech | Cat# 60004–1-Ig; RRID:AB_2107436 |
| Goat secondary HRP conjugated antibodies | Jackson ImmunoResearch Laboratories, Inc | N/A |
| Chemicals, peptides, and recombinant proteins | ||
|
| ||
| Forskolin | Cayman Chemical | CAS# 66575–29–9, Cat# 11018 |
| 3-isobutyl-1 -methylxanthine (IBMX) | Millipore Sigma | CAS# 28822–58–4, Cat# I5879 |
| SAG | Millipore Sigma | CAS# 364590–63–6, Cat# 566660 |
| Clozapine N-oxide | Abeam | CAS# 34233–69–7, Cat# ab141704 |
| Somatostatin | Millipore Sigma | CAS# 38916–34–6, Cat# S1763 |
| SiR-Tubulin | Spirochrome | Cat# CHF420.00 |
| Hygromycin | Thermo Fisher Scientific | Cat# 10687010 |
| Puromycin | EMD Millipore | Cat# 5.08838.0001 |
| DMSO | ATCC | Cat# ATCC 4-X |
|
| ||
| Critical commercial assays | ||
|
| ||
| mMessage Machine Sp6 Transcription Kit | ThermoFisher | Cat# AM 1340 |
| RNeasy Plus Mini Kit | QIAGEN | Cat# 74136 |
| iSCRIPT cDNA synthesis Kit | Bio-Rad | Cat# 74136 |
| cAMP ELISA | Enzo | Cat# ADI-901-066 |
|
| ||
| Experimental models: Cell lines | ||
|
| ||
| GS-DREADD-EGFP | This paper | N/A |
| GS-DREADD-ARL13B-EGFP | This paper | N/A |
| SSTR3-EGFP | Gift from Mark Von Zastrow | N/A |
| EF1 α-Cyto-bPAC-GFP | This paper | N/A |
| EF1 α-Arl13b-bPAC-GFP | This paper | N/A |
| CRYS-Cyto-bPAC-GFP | This paper | N/A |
| CRYS-Arl13b-bPAC-GFP | This paper | N/A |
| CRYS-Cyto-bPAC-GFP + Pink Flamindo-mlFP-Rab23 Q68L | This paper | N/A |
| CRYS-Arl13b-bPAC-GFP + Pink Flamindo-mlFP-Rab23 Q68L | This paper | N/A |
| CRYS-Cyto-bPAC-GFP + Pink Flamindo | This paper | N/A |
| CRYS-Arl13b-bPAC-GFP + Pink Flamindo | This paper | N/A |
| Flp-ln NIH/3T3 Cell Line | ThermoFisher | Cat# R76107 |
|
| ||
| Experimental models: Organisms/strains | ||
|
| ||
| Zebrafish: Tg(8xGli:mCherry-NLS-Odc1) | Gift from James Chen; Mich et al.f 2014 | N/A |
| Zebrafish: Tg(Arl13b-bPAC-Myc) | This paper | N/A |
| Zebrafish: Tg(Cyto-bPAC-Myc) | This paper | N/A |
| Zebrafish Danio rerio Ekkwill wildtype | EkkWill Waterlife Resources | ZDB-G ENO-990520–2 |
|
| ||
| Oligonucleotides | ||
|
| ||
| Cyto-bPAC F genotyping primer (GTCAACCGGTACTTCAGCAT CT) | Integrated DNA Technologies | N/A |
| Cyto-bPAC R genotyping primer (TCGTAGTACTTCTGGGCCTCAT) | Integrated DNA Technologies | N/A |
| Cilia-bPAC F genotyping primer (AGATGACTGTGCTCCTGAGA) | Integrated DNA Technologies | N/A |
| Cilia-bPAC R genotyping primer (ACCAGGATTTTCTTGTACAGCT) | Integrated DNA Technologies | N/A |
| GIH qPCR F primer (TTATGGAGCAGCCAGAGAGA) | Integrated DNA Technologies | N/A |
| Gli1 qPCR R primer (GAGCCCGCTTCTTTGTTAAT) | Integrated DNA Technologies | N/A |
| HPRT qPCR F primer (CATAACCTGGTTCATCATCGC) | Integrated DNA Technologies | N/A |
| HPRT qPCR R primer (TCCTCCTCAGACCGGTTTT) | Integrated DNA Technologies | N/A |
| RPLPO qPCR F primer (TATAACCCT GAAGTGCTCGACA) | Integrated DNA Technologies | N/A |
| RPLPO qPCR R primer (GCGCTTGTACCCATTGATGAT) | Integrated DNA Technologies | N/A |
|
| ||
| Recombinant DNA | ||
|
| ||
| pPGKFLPobpA | Gift from Philippe Soriano, Addgene | RRID:Addgene_13793 |
| pgl_AP5-EF1 α-bPAC-GFP | This paper | N/A |
| pgl_AP5-EF1 α-Arl13b-bPAC-GFP | This paper | N/A |
| pgLAP5-CRYS-bPAC-GFP | This paper | N/A |
| pgl_AP5-CRYS-Arl13b-bPAC-GFP | This paper | N/A |
| pgLAP5 | Gift from Peter Jackson, Addgene | RRID:Addgene_19706 |
| pgl_AP5-Gs-DREADD-EGFP | Gift from Mark Von Zastrow | N/A |
| pgLAP5-Gs-DREADD-ARL13B-EGFP | Gift from Mark Von Zastrow and Aaron Mar ley | N/A |
| mApple-C1-Mini Gs | Gift from Roshanak Irannejad | N/A |
| plRES-Neo3-SS-Flag-hGPR161 | Gift from Mark Von Zastrow and Aaron Mar ley | N/A |
| pcDNA3.1-PKAC | Gift from Roshanak Irannejad; Irannejad et al., 2017 | N/A |
| pEF5B-mNeonGreen-PKA-Rlα | Gift from Maxence Nachury; Mick et al., 2015 | N/A |
| pCS2+-dnPKA-GFP: linearize Noti, polymerase SP6 | Gift from Randall Moon, Addgene | RRID:Addgene_16716 |
| pCS2+-dnPKA-GFP-Rab23 Q68L linearize Noti, polymerase SP6 | This paper | N/A |
| pCS2+-dnPKA-GFP-Rab23 S23N: linearize Noti, polymerase SP6 | This paper | N/A |
| pCS2+-dnPKA-GFP-2x PACT: linearize Noti, polymerase SP6 | This paper | N/A |
| pEGFP-C1-Rab23 Q68L | Gift from Carol Wicking; Evans et al., 2003 | N/A |
| pEGFP-C1-Rab23 S23N | Gift from Carol Wicking; Evans et al., 2003 | N/A |
| pCS2+-EGFP-Rab23 Q68L | This paper | N/A |
| pCS2+-EGFP-Rab23 S23N | This paper | N/A |
| 6x Halo-EGFP-2x PACT | Gift from Michael Lampson, Addgene | RRID:Addgene_107265 |
| pcDNA3.1-bPAC | Gift from Mark Von Zastrow; Tsvetanova and von Zastrow, 2014 | N/A |
| pcDNA3.1-Pink Flamindo | Gift from Tetsuya Kitaguchi, Addgene; Harada et al., 2017 | RRID:Addgene_102356 |
| mIFP | Gift from Xiaokun Shu, Addgene; Yu et al., 2015 | RRID:Addgene_54620 |
| pLVX-Pink Flamindo-mlFP-Rab23 Q68L | This paper | N/A |
| pCS2+-Arl13b-bPAC-6x Myc: linearize Notl, polymerase SP6 | This paper | N/A |
| pCS2+-Arl13b V359A-bPAC-6x Myc: linearize Notl, polymerase SP6 | This paper | N/A |
| nkx2.2b in situ probe: linearize BamH\, polymerase T7 | Gift from Peng Huang | N/A |
| olig2 in situ probe; linearize BglII, polymerase T3 | Gift from Peng Huang | N/A |
| pTol2-Ubi-bPAC-Myc-6x Myc | This paper | N/A |
| pTol2-Ubi-ARL13B-bPAC-6x Myc | This paper | N/A |
|
| ||
| Software and algorithms | ||
|
| ||
| Adobe Illustrator version 24.1.0 | Adobe Systems | https://www.adobe.com/products/illustrator.html |
| KiCad software suite | KiCad | http://kicad.org/ |
| MATLAB R2020a | Math Works | https://www.rnathworks.com/products/matlab.html |
| Arduino IDE version 1.8.0 | Arduino | https://www.arduino.cc/en/software |
| Fiji | Open Source | https://fiji.se/ |
| GraphPad Prism version 8 | GraphPad Software | https://www.graphpad.com/scientific-software/prism/ |
Optogenetic stimulation
We performed optogenetic experiments in 35mm dishes using custom LED devices. Briefly, the device consisted of 1) a printed circuit board with LEDs and control circuitry positioned to illuminate six individual 35 mm dishes; 2) a 3D printed adapter to ensure diffuse illumination and no cross-stimulation between samples; 3) an Arduino microcontroller to control the LED illumination during the experiment. The printed circuit board was designed using KiCad Electronic Design Automation software (KiCad) and manufactured by PCB Unlimited. The circuit board accommodated 10 blue/red bi-color LEDs (Wurth, Cat# 150141RB73100) under each of six 35mm wells. Groups of five LEDs were controlled by one pin of a constant-current LED driver chip (Texas Instruments, Cat# TLC5947) supporting independent 12-bit control (4096 steps) by pulse-width modulation, as used in similar devices (Bugaj and Lim, 2019; Repina et al., 2019). The LED drivers were controlled by an Arduino Uno microcontroller, which was programmed with a custom script written in the Arduino Integrated Development Environment. 3D printed adapters that mated the LED array with the 35 mm plates were designed using Inventor CAD software (Autodesk) and printed on a uPrint 3D printer (Stratasys).
We collected zebrafish embryos from timed natural matings and raised them in the dark. We identified transgenic lines that generate equivalent amounts of cAMP upon light stimulation. For light titration experiments, we stimulated embryos with four hours of pulsed (500ms on, 500ms off) low (0.065mW/cm2), medium (0.35mW/cm2) or high (0.87mW/cm2) amounts of 470nm blue light. For all other activations of transgenic bPAC-expressing zebrafish, we used the low (0.065mW/cm2) amount of 470nm blue light. We measured lighting power density with a digital power meter console (Thorlabs Cat# PM100D). For each zebrafish experiment, eggs were collected from a natural mating of one Cyto-bPAC or Cilia-bPAC transgenic zebrafish and one EKW wild-type zebrafish, yielding approximately 50% transgenic embryos in each clutch. For immunofluorescence analyses, we stimulated embryos from 14–18hpf, fixed at 24hpf, and assessed patterning of somites 12–15. For embryos injected with mRNA encoding either Cilia-bPAC (ARL13B-bPAC) and Nonciliary-bPAC (ARL13BV359A-bPAC), we stimulated at 14–18hpf with pulsed (500ms on, 500ms off) 0.35mW/cm2 470nm blue light, fixed at 24hpf, and assessed patterning of somites 12–15. For cAMP measurements in transgenic animals, we stimulated embryos from 24–28hpf with 0.065mW/cm2 light in the presence of 100μM IBMX. For cAMP measurements in injected embryos, we stimulated embryos from 14–18hpf with 0.35mW/cm2 470nm pulsed blue light in the presence of 100μM IBMX.
To optogenetically stimulate bPAC-expressing NIH/3T3 cell lines, we plated cells in 35mm dishes, grew them to confluency, and serum starved overnight in Opti-MEM to promote ciliation. Prior to qRT-PCR, immunofluorescence or immunoblot analysis, we stimulated the cells for four hours of pulsed (500ms on, 500ms off) 0.14mW/cm2 470nm blue light while incubating with the indicated drugs diluted in Opti-MEM. Prior to ELISA-based measurement of cAMP levels, we stimulated the cells with 0.87mW/cm2 470nm blue light for 30 minutes in the presence of 100μM IBMX.
Immunofluorescence staining
We fixed zebrafish embryos in 4% methanol-free PFA (Electron Microscopy Sciences Cat# 100504–782) diluted in PBS for 2 hours at room temperature on a nutator and then stored them in 100% methanol at −20° C until further analysis. We rehydrated embryos in a graded series of methanol and PBST (PBS+0.1% Tween) solutions (75%, 50%, 25% and 0% methanol). For Engrailed staining, we incubated embryos in −20°C acetone for 7 minutes. We blocked embryos in 10% donkey serum, 1% DMSO, 1% BSA and 0.5% Triton X-100 in PBS for 1 hour. After blocking, we incubated embryos overnight at 4°C with primary antibodies diluted in PBDT (1% DMSO, 1% BSA, 0.5% Triton X-100 in PBS). Primary antibodies used were: goat anti-Myc (1:500, Novus, RRID:AB_10002720), rabbit anti-TubAC (1:500, Cell Signaling, RRID:AB_10544694), rabbit anti-mCherry (1:500, Abcam, RRID:AB_2571870), mouse anti-Eng (1:10, DSHB, RRID:AB_528224), rabbit anti-Prox1 (1:100, EMD Millipore, RRID:AB_177485), goat anti-GFP (1:1000, Rockland, RRID:AB_218182), mouse anti-γ-Tub (1:500, Sigma Aldrich, RRID:AB_477584). Subsequently, we incubated embryos in donkey Alexa Fluor-conjugated secondary antibodies (1:500, Life Technologies) and Hoechst (ThermoFisher Scientific) diluted in PBDT for 2 hours at room temperature, nutating. We mounted embryos in ProLong Diamond antifade mountant (ThermoFisher Scientific Cat# P36970).
We seeded cells on 12mm coverslips (Azer Scientific, Cat# ES0117520) at a density of 5×10⁴ cells per well in a 24-well plate and starved in Opti-MEM reduced serum media (UCSF Tissue Culture). We transfected PKA using TransIT-X2 (Mirus Bio) 24h after seeding. 48h after seeding, we starved cells overnight in Opti-MEM. We fixed cells for 10 minutes in 4% PFA diluted in PBS. We also fixed PKA-transfected cells in −20°C methanol for 3 minutes after PFA fixation. We blocked cells in 0.1% Triton X-100, 2.5% BSA and PBS for 1h at room temperature. We diluted primary antibodies in blocking buffer and incubated them overnight at 4°C. Primary antibodies used were goat anti-GFP (1:1000, Rockland, RRID:AB_218182), rabbit anti-TUBAC (1:500, Cell Signaling, RRID:AB_10544694), mouse anti-γ-TUB (1:500, Sigma Aldrich, RRID:AB_477584), mouse anti-ARL13B (1:1000, NeuroMab, RRID:AB_11000053), rabbit anti-FOP (1:500, ProteinTech, RRID:AB_2103362), mouse anti-FLAG (1:500, Sigma Aldrich, RRID:AB_439685), mouse anti-mNeonGreen (1:1000, ChromoTek, RRID:AB_2827566), mouse anti-SMO (1:100, Santa Cruz Biotechnology, RRID:AB_2239686), mouse anti-TUBAC (1:500, Sigma-Aldrich, RRID:AB_477585), rabbit anti-GPR161 (1:100, Proteintech, RRID:AB_2113965). Subsequently, we incubated cells in donkey Alexa Fluor-conjugated secondary antibodies (1:500, Life Technologies) and Hoechst (ThermoFisher Scientific) diluted in blocking buffer at room temperature for 2 hours. We mounted coverslips in ProLong Diamond antifade mountant (ThermoFisher Scientific Cat# P36970).
Image Acquisition
We imaged live zebrafish with a Zeiss Observer D1 microscope and an Axiocam MRc camera. We imaged live cells using a Yokogawa CSU-X1 spinning disk confocal equipped with a 60× 1.4 numerical aperture oil objective, a Nikon Perfect Focus system, and a Prime95B sCMOS camera (Photometrics). We seeded cells onto 35mm dishes with Poly-D-Lysine coated No. 1.5 coverslips (MatTek Cat# P35GC-1.5–10-C). After 24h of growth, we transfected cells using Transit-X2 transfection reagents (Mirus Bio). 48h after seeding, we starved cells in Opti-MEM reduced serum media overnight. On the day of imaging, we incubated cells in SiR-Tubulin without verapamil (Spirochrome) to label cilia. During imaging, we maintained cells at 37°C and 5% CO2 using an OkoLab Cage Incubator and CO2 mixer. We added drugs one minute after the start of image acquisition and imaged cells every 30 seconds for 15 minutes in FluoroBrite DMEM (ThermoFisher Cat# A1896701) supplemented with 25mM HEPES, pH7.4 (ThermoFisher Cat# 15630080). For Ciliary Pink Flamindo and Pink Flamindo imaging, we stimulated bPAC-expressing NIH/3T3 cells with 100ms 52.7mW/cm2 light (Axiom Optics, Argo-POWER) using the 488nm laser (Vortran) during image acquisition. For each cell, images were continuously acquired for 1 minute with the 488nm laser to stimulate bPAC, the 640nm laser to identify cilia stained either with SiR-Tubulin (in the case of cytoplasmic Pink Flamindo) or mIFP (in the case of Ciliary Pink Flamindo), and the 561nm laser to image Pink Flamindo fluorescence. bPAC stimulation began after two acquisitions of ciliary and Pink Flamindo fluorescence detection in the absence of blue laser stimulation. Cells were stimulated with 100μM Forskolin after bPAC stimulation was completed.
We imaged fixed cells with a Zeiss LSM 800 laser scanning confocal microscope equipped with a 63x/1.4 oil immersion objective and captured using the Zen Imaging Software (Zeiss). We imaged fixed zebrafish with either a Leica TCS SPE or a Zeiss LSM 800 laser scanning confocal microscope. We imaged zebrafish somite cilia using a 63x/1.4 oil immersion objective and somites 12 through 15 using either a 20x air objective or 40x oil objective. While collecting images, we held constant the gain, offset and laser power for each antibody combination. We processed images identically and used FIJI software to generate maximal projections.
cAMP measurement
To measure cAMP concentrations in cultured cells, we used a Direct cAMP ELISA kit (Enzo, Cat# ADI-900–066) without the optional acetylation step. Prior to determining cAMP concentration in DREADD- or SSTR3-expressing cells, we seeded NIH/3T3 cells in 12-well plates at a density of 1×10⁵ cells per well. For bPAC-based NIH/3T3 experiments, we seeded bPAC-expressing cells in 35mm dishes at a density of 2×10⁵ cells per well. 24h after seeding, we starved cells overnight in Opti-MEM reduced serum medium to promote ciliation. On the day of treatment, we treated cells with drugs or light in the presence of 10μM IBMX for DREADD and SSTR3 experiments and 100μM IBMX for bPAC cells (Millipore Sigma) diluted in Opti-MEM reduced serum medium. We stimulated SSTR3-expressing cells with Somatostatin for 30 minutes. We stimulated DREADD-expressing cells with CNO for 3 hours. Immediately after stimulation, cells were scraped into lysis buffer (0.1M HCl, Enzo). We calculated cAMP concentrations using a 4-parameter logistic (4PL) curve fitting program (Prism version 8, GraphPad Software). We normalized interpolated cAMP values using total protein concentrations determined by BCA assay (Thermo Scientific Pierce Cat# PI23228).
To measure cAMP in zebrafish embryos stably expressing bPAC, we stimulated embryos from 24–28hpf with pulsed blue light or 10μM forskolin in the presence of 100μM IBMX (Millipore Sigma) diluted in egg water. For embryos injected with mRNA encoding either Cilia-bPAC (ARL13B-bPAC) or Nonciliary-bPAC (ARL13BV359A-bPAC), we shined pulsed (500ms on, 500ms off) 0.35mW/cm2 470nm blue light in the presence of 100μM IBMX from 14–18hpf. Injected embryos were lysed at 18hpf. After light stimulation, we dechorionated and lysed embryos in 0.1M HCl (Enzo). We lysed control embryos raised in the dark in batches of 10 embryos and calculated the average concentration per embryo. Transgenic embryos stably expressing bPAC were lysed individually. Injected embryos were lysed in pairs at 18hpf and the average concentration of cAMP per embryo reported. ELISA was performed as described above using 100μL undiluted embryo lysate without the optional acetylation protocol. cAMP concentration was determined utilizing a 4-parameter logistic (4PL) curve fitting program (Prism version 8, GraphPad software).
Immunoblotting
Cells were lysed using RIPA buffer (150nm NaCl, 50mM Tris, pH 7.6, 0.1% SDS, 0.1% NP-40 and 0.5% sodium deoxycholate) supplemented with protease inhibitors (Roche). Protein concentration was determined using a Pierce BCA Protein Assay Kit (Thermo Fisher Scientific). Zebrafish embryos were deyolked before lysis in RIPA buffer supplemented with protease inhibitors, as previously described (Link et al., 2006). All lysates were boiled for 5 minutes in 4x SDS-PAGE loading buffer, except prior to immunoblotting for DREADD expression, for which lysates were incubated at room temperature for 45 minutes. Protein samples were separated on 4–15% gradient TGX precast gels (Bio-Rad) and transferred to PVDF membrane (Bio-Rad). 5% non-fat dried milk in TBS with 0.1% Tween was used to block membranes and to dilute antibodies. HRP signal was detected using Clarity Western ECL substrate (Bio-Rad). Primary antibodies used were goat anti-GFP (1:1,000, Rockland, RRID:AB_218182), mouse anti-GAPDH (1:100,000, Proteintech, RRID:AB_2107436), goat anti-GLI3 (1:200, R&D Systems, Cat #AF3690), goat anti-c-Myc (1:5,000, Novus, RRID:AB_10004121) and mouse anti-β-actin (1:100,000, Proteintech, RRID:AB_2687938). We used HRP-conjugated secondary antibodies at 1:5,000 dilution (Jackson ImmunoResearch Laboratories, Inc).
In situ hybridization
In situ probes for Nkx2.2b, Olig2 and Pax3 were gifts from Peng Huang. Nkx2.2b was digested with BamHI and in vitro transcribed using T7 RNA polymerase. Olig2 was digested with BglII and in vitro transcribed using T3 RNA polymerase. Pax3 was digested with NotI and in vitro transcribed using T7 RNA polymerase. Probes were purified using lithium chloride and ethanol precipitation. Whole mount in situ hybridization was performed on 24hpf embryos fixed overnight at 4°C in 4% paraformaldehyde and stored in methanol at −20°C. Hybridization with dioxigenin (DIG) (Roche)-labeled riboprobes was performed following standard procedures, as described previously (Reiter et al., 1999). In brief, embryos were rehydrated into PBST (0.1% Tween-20), digested with 10μg/mL proteinase K (Roche) for 10 minutes and re-fixed with 4% paraformaldehyde, followed by thorough washing. Embryos were prehybridized in in hybridization solution (50% formamide, 5x SSC, 500μg/mL yeast tRNA, 50μg/mL heparin, 0.1% Tween-20, 9mM citric acid) for at least 1 hour at 68°C, followed by hybridization overnight at 68°C. Embryos were blocked for 2 hours (PBST, 2mg/mL BSA, 5% sheep serum), then incubated with anti-Digoxigenin-AP, Fab fragments (Roche) diluted in block overnight at 4°C. The next day, embryos were washed extensively in PBST/BSA, equilibrated in fresh NTMT buffer (0.1M Tris, pH 9.5, 0.1M NaCl, 0.05M MgCl2, 0.1% Tween-20), then stained with NBT and BCIP (Roche) diluted in NTMT buffer. Embryos were mounted in 70% glycerol. Transverse sections and wholemount embryos were imaged using a Zeiss Observer D1 microscope equipped with an Axiocam MRc camera.
Quantitative RT-PCR
Cells were seeded in 12-well plates at a density of 1×10⁵ cells per well. 24h after seeding, cells were starved in Opti-MEM reduced serum media overnight to promote ciliation. Cells were incubated with indicated drugs diluted in Opti-MEM for 5 hours. RNA was extracted using RNeasy Mini (Qiagen) according to the manufacturer’s instructions. RNA was used to make cDNA using the iSCRIPT cDNA synthesis kit (Bio-Rad). qRT-PCR was performed in technical quadruplicates on a 384-well plate (USA Scientific, Cat# 1438–4700) using PowerUp SYBR Green master mix (Applied Biosystems) and run on a QuantStudio 5 real-time PCR system (Applied Biosystems). Relative expression was calculated using the ΔΔCT method normalized to HPRT and RLPL0 expression. Data were normalized to wild-type cells treated with DMSO.
Mathematical modeling of cAMP subcellular dynamics and PKA activation
A frame-by-frame Monte Carlo simulation was performed for the diffusion of cAMP molecules in cells. The cell-cilium system was modeled as a ball-shaped cell body (radius R = 5 μm) connected with a cylindrical-shaped cilium (length L = 5 μm, diameter Φ = 300 nm) through a smooth junction at the ciliary base.
cAMP molecules were introduced at random locations in either the ciliary membrane or the plasma membrane at a constant rate of 34 molecules per second (Figure 5A and Figure S5A–D) or 340 molecules per second (Figure S5E–F) to simulate ciliary and plasma membrane cAMP generation, respectively. The cAMP molecules underwent random walks in the cell (Berg, 1993). For each step of random walk, the probability distribution function for a cAMP initially located at position (x0,y0,z0) in a frame to be found at position (x,y,z) in the next frame after time Δt takes the form of 3D-Gaussian distribution:
| (1) |
Here, σ is the standard deviation of each step, and is related to the diffusion coefficient (D) and the time interval between two frames (Δt) by
| (2) |
In our simulation, we used σ = 100 nm. This value was specified to be smaller than the smallest dimension of the cell (diameter of cilium Φ = 300 nm), yet not exceedingly small to allow for reasonable computation speed. An assumed diffusion coefficient D = 10 μm2/s therefore corresponded to Δt = 0.5 ms. We considered elastic collisions between the cAMP and the cell membrane so that the cAMPs appeared at their mirrored positions with respect to the cell membrane in cases where cAMP trajectories would have exited the cell after the application of equation (1). We recorded the PKA interaction locations (xc,yc,zc) for the further analysis of the PKA activation.
The PKA molecules were modeled to be evenly distributed on the ciliary and the plasma membranes at the same surface density, ρ = 1 PKA / (140nm)2. Each PKA holoenzyme was activated by binding of 4 cAMP molecules. To simulate binding, we modeled PKA molecules to have a radius of rPKA = 2.5 nm, and one binding event was counted when a cAMP molecule collided with the adjacent membrane within rPKA of the PKA center (xPKA,yPKA,zPKA):
| (3) |
A PKA molecule was considered activated after encountering 4 such binding events.
QUANTIFICATION AND STATISTICAL ANALYSIS
For all cell culture experiments shown, sample size (n) indicates the number of independent experiments. In all data panels, representative data from 3–5 independent experiments are shown. For zebrafish experiments, all sample sizes (n) are indicated for the number of embryos used in each experiment. To calculate the number of En-expressing, mCherry-expressing or Prox1-expressing cells per somite, images were converted to binary images using the threshold function and a minimum/maximum size exclusion filter was applied in Fiji. Cells were counted using the 3D objects counter function in Fiji. Cells in somites 12 through 15 were counted and an average value of cells per somite was determined for each embryo. The average values per embryo were used as individual data points in all graphs and statistical analyses.
For fluorescence intensity measurements, a sum projection containing 10 slices was generated. Raw integrated density was measured in Fiji for a region of interest that was used for all measurements. For quantification of ciliary enrichment and quantification of SMO and GPR161 trafficking in cultured cells, a sum projection containing 10 optical sections was generated. A 5-pixel-wide segmented line was used to trace cilia, as defined by staining for TubAC. For ciliary enrichment, raw integrated density was measured in Fiji and calculated as the ratio of signal at the cilium to the average of two cell body measurements. For quantification of ciliary SMO and GPR161 fluorescence, the average of two background fluorescence measurements adjacent to the cilium was subtracted from ciliary fluorescence. A negative value indicates background fluorescence was greater than ciliary fluorescence. Fluorescence was normalized to the mean of wild-type cells treated with vehicle in the dark.
For quantification of ciliary cAMP levels, a 5-pixel-wide segmented line was used to trace cilia at each timepoint. The ratio of ciliary Pink Flamindo to mIFP raw integrated density was measured for each timepoint using Fiji software. Relative intensity change was calculated using the fluorescence intensity ratio F/F0. Quantification of cytoplasmic Pink Flamindo fluorescence was performed on unprocessed TIFF images using MATLAB (Jullié et al., 2020). Briefly, Pink Flamindo fluorescence intensity was measured after thresholding and background fluorescence subtraction. Data are represented as the ratio of Pink Flamindo F/F0, where F0 is the Pink Flamindo fluorescence before stimulation. Average measurements for >20 cells over three independent experiments are reported.
Quantification of GLI3R was performed in Fiji. In brief, Mean Grey Value was measured for each band using a defined region of interest and an adjacent background value was subtracted. This resulting value for this GLI3R band was normalized to the loading control (GAPDH). All values were normalized to Wild-type cells treated with vehicle and no light.
For statistical analyses of two samples, significance was determined via two-tailed unpaired t-test. For more than two samples, significance was determined via one-way ANOVA followed by Tukey’s multiple comparison test for one variable or two-way ANOVA followed by Tukey’s multiple comparison test for two variables. A p value less than 0.05 was considered statistically significant and is denoted as follows: *<0.05, **<0.01, ***<0.001, and ****<0.0001.
Supplementary Material
(A) Immunoblot for Myc-tagged Cyto-bPAC and Cilia-bPAC in 24hpf zebrafish embryo lysates. β-actin serves as a loading control.
(B) Whole-mount brightfield images of transgenic Cyto-bPAC and Cilia-bPAC zebrafish embryos either raised in the dark or stimulated with blue light from 14–18 hours post fertilization.
(A) Immunofluorescence images of zebrafish somites either uninjected or injected with mRNA encoding Myc-tagged Nonciliary-bPAC (ARL13BV359A-bPAC-MYC) or Cilia-bPAC (ARL13B-bPAC-MYC). Images depict 18hpf somites stained for bPAC (Myc, green), cilia (TubAC, red), basal bodies (γTUB, grayscale) and nuclei (Hoechst, blue). Arrowheads indicate cilia depicted in insets. Insets display overlay of bPAC, cilia and basal bodies (left), overlay of cilia and basal bodies (middle), and bPAC alone (right). Scale bars, 20μm for main images and 2μm for insets.
(B) Quantification of cAMP in uninjected and embryos expressing either Nonciliary-bPAC or Cilia-bPAC. Embryos were stimulated in the presence of 100μM IBMX with 0.35mW/cm2 470nm pulsed blue light from 14–18hpf.
(C) Immunofluorescence images of Gli:mCherry transgenic embryos either uninjected, or injected with mRNA encoding Nonciliary-bPAC or Cilia-bPAC. Embryos were stained for mCherry (greyscale). Embryos were either raised in the dark or stimulated with 0.35mW/cm2 470nm pulsed blue light from 14–18hpf and then allowed to develop until 24hpf. Scale bar, 40μm.
(D) Quantification of Gli:mCherry-expressing cells per somite of uninjected embryos and those injected with mRNA encoding the indicated forms of bPAC. Each point represents the average number of mCherry-expressing cells over somites 12–15 of one embryo. Embryos were generated in three independent sets of injections. For both (B) and (D), significance was determined via two-way ANOVA with Tukey’s multiple comparison test. A p value less than 0.05 was considered statistically significant and is denoted as follows: *<0.05, ***<0.001, and ****<0.0001. Data are represented as means ± SD.
(E) Schematic of HH-dependent neural tube patterning. A gradient of Shh secreted from the notochord (NT) and medial floorplate (blue) patterns lateral floor plate cells expressing Nkx2.2b (red) and motorneuron precursors expressing Olig2 (yellow).
(F,G) Whole-mount in situ hybridization to detect neural tube markers in Wild-type, Cyto-bPAC, and Cilia-bPAC-expressing transgenic zebrafish either raised in the dark or stimulated with blue light. Left panels depict views of lateral whole mount 24hpf embryos. Right panels depict transverse cross-sections. Dotted lines outline the neural tubes. Expression of Nkx2.2b (F) and Olig2 (G) are reduced specifically in Cilia-bPAC embryos stimulated with light. Scale bar, 40μm.
(A) Untargeted Pink Flamindo expressed in either ciliated Cyto-bPAC (red) or ciliated Cilia-bPAC (blue) cells was stimulated with (open circles) or without (solid circles) 52.7mW/cm2 blue light. 100μM Forskolin was added at the indicated time (arrow) after blue light stimulation. Left panel depicts quantification of Pink Flamindo fluorescence over time. Right panel depicts the maximum Pink Flamindo fluorescence after blue light stimulation. n>15 cells quantified over two independent experiments. Significance was determined via two-way ANOVA followed by Tukey’s multiple comparison test.
(B) A red-shifted cAMP sensor, Pink Flamindo, was fused to the far-red fluorescent protein mIFP and Rab23 Q68L, which constitutively localizes to the cilium, to generate Ciliary Pink Flamindo. Bottom panel depicts representative images of Pink Flamindo (Fire) and mIFP (greyscale) fluorescence in NIH/3T3 cells stably expressing Ciliary Pink Flamindo upon addition of either vehicle (DMSO) or 100μM Forskolin. Forskolin increases Pink Flamindo fluorescence. Scale bar, 2μm.
(C) Quantification of Ciliary Pink Flamindo fluorescence over time upon increasing concentrations of Forskolin. The ratio of Pink Flamindo fluorescence to mIFP fluorescence at cilia was measured, then normalized to baseline fluorescence (F/F0). Traces represent the average of n>15 cells over 3 independent experiments. The maximum Ciliary Pink Flamindo fluorescence (Fmax/F0) is also displayed for each cell. Significance was determined via one-way ANOVA followed by Tukey’s multiple comparison test. p values less than 0.05 were considered statistically significant and is denoted as follows: *<0.05 and ****<0.0001. Data are represented as means ± SD.
(D) Immunofluorescence images of wild-type, Cyto-bPAC and Cilia-bPAC NIH/3T3 cells treated with either vehicle (DMSO) or 200nM SAG in the presence or absence of 4 hours of 0.14mW/cm2 pulsed blue light. Cells were stained for SMO (green), cilia (TUBAC, magenta), and nuclei (Hoechst, blue). Insets display SMO localization to the cilium (defined by TUBAC staining). Scale bar, 10μm. Inset scale bar, 2μm.
(E) Quantification of ciliary SMO immunofluorescence. Fluorescence was normalized to the mean of that of wild-type cells treated with vehicle in the dark.
(F) Immunofluorescence images of wild-type, Cyto-bPAC and Cilia-bPAC NIH/3T3 cells stimulated as above and stained for GPR161 (green), cilia (TUBAC, magenta), and nuclei (Hoechst, blue). Insets display GPR161 localization to the cilium (defined by TUBAC staining). Scale bar, 10μm. Inset scale bar, 2μm.
(G) Quantification of ciliary GPR161 fluorescence. For (B) and (D), significance was determined using one-way ANOVA followed by Tukey’s multiple comparison test. A p value less than 0.05 was considered statistically significant and is denoted as follows: ****<0.0001. Data are represented as means ± SD.
(A) Oversaturated immunofluorescence images of transgenic NIH/3T3 cells stably expressing GFP-tagged PM-DREADD or Cilia-DREADD. Images depict cells stained for the GFP-tagged DREADDs (GFP, green), cilia (TUBAC, red), basal bodies (γTUB, grayscale) and nuclei (Hoechst, blue). Insets indicate amount of GFP-tagged DREADD localization to the cilium (defined by TUBAC and γTUB). Scale bars, 10μm and 1μm (inset). With increased exposure, PM-DREADD is not observed in the ciliary membrane.
(B) Immunoblot for GFP-tagged PM-DREADD and Cilia-DREADD. Immunoblot for GAPDH was used to control for protein loading.
(C) Mini-G sensors visualized G-protein activity in Cilia-DREADD-expressing cells. Cilia in live cells were identified through enrichment of a tubulin dye (SiR-Tubulin, magenta) and localization of GFP-tagged Cilia-DREADD (green). The mApple-tagged mini-G sensor (grayscale) was not enriched in cilia both before and 10 minutes after treatment with vehicle (DMSO). Yellow arrowheads indicate cilia depicted in insets. Scale bars, 10μm and 2μm (inset).
(D) In Cilia-DREADD cells incubated with 10μM CNO for 10 minutes, the mApple-tagged mini-G sensor (grayscale) accumulated in cilia. Scale bars, 10μm and 2μm (inset).
(E-F) Quantification of cilia length (E) and nuclei per field of view (F) in wild-type, PM-DREADD- or Cilia-DREADD-expressing cells upon treatment with either vehicle (DMSO) or 5nM CNO for 5 hours. n>50 cilia were quantified over four random fields. For (E) and (F), significance was determined via two-tailed unpaired t-test.
(G) Measurement of Gli1 expression in wild-type, PM-DREADD- or Cilia-DREADD-expressing cells treated with either vehicle or 5nM CNO by qRT-PCR. n=3–4 biological replicates. Significance was determined via one-way ANOVA followed by Tukey’s multiple comparison test. A p value less than 0.05 was considered statistically significant. Data are represented as means ± SD.
(A) Graphical depiction of PKA activation upon either ciliary membrane or plasma membrane cAMP generation. Grey points indicate inactive PKA. Magenta points indicate PKA computed to have bound 4 cAMP molecules and thus be active. Scale bar, 5μm.
(B) Percent of activated plasma membrane PKA following either ciliary (red) or plasma membrane (blue) cAMP generation, as a function of time (compare to Figure 5A).
(C) The model was re-run with a doubling of ciliary diameter (with a concomitant fourfold increase in ciliary volume). Percent of activated ciliary membrane (middle) and plasma membrane (right) PKA following either ciliary (red) or plasma membrane (blue) cAMP generation, as functions of time. Increasing ciliary diameter is predicted to compromise the difference between ciliary PKA activation by ciliary and plasma membrane cAMP (compare to Figure 5A).
(D) To model the effects of changing ciliary diameter and volume separately, the model was re-run with the larger ciliary diameter, but keeping ciliary volume equal to the original model described in Figure S5A by reducing ciliary length. Percent of activated ciliary membrane (middle) and plasma membrane (right) PKA following either ciliary (red) or plasma membrane (blue) cAMP generation, as functions of time. Decreasing ciliary length is predicted to further compromise the difference between ciliary PKA activation by ciliary and plasma membrane cAMP.
(E) Graphical depiction of PKA activation upon high levels of either ciliary membrane or plasma membrane cAMP generation. Grey points indicate inactive PKA. Magenta points indicate PKA computed to have bound 4 cAMP molecules and thus be active. Scale bar, 5μm.
(F) Percent of activated ciliary membrane- (top panel) or plasma membrane- (bottom panel) localized PKA upon 340 cAMPs/second generation at either ciliary or plasma membranes.
(G) Quantification of En-expressing somitic cells in Cyto-bPAC and Cilia-bPAC transgenic zebrafish embryos stimulated with low (0.065mW/cm2, as utilized in Figure 2), medium (0.35mW/cm2), or high (0.87mW/cm2) intensity blue light from 14–18hpf. Each data point represents the average number of En-expressing cells per somite 12 through 15 per 24hpf embryo. Statistical significance was assessed using a two-way ANOVA followed by Tukey’s multiple comparison test. A p value less than 0.05 was considered statistically significant and is denoted as follows: **<0.01, ***<0.001, and ****<0.0001. Data are represented as means ± SD.
(H) Ratios of Gli1 expression in WT and PM-DREADD- or Cilia-DREADD-expressing cells treated with 200nM SAG and indicated concentrations of CNO to Gli1 expression treated with 200nM SAG alone. Significance was determined via one-way ANOVA followed by Tukey’s multiple comparison test. A p value less than 0.05 was considered statistically significant and is denoted as follows: ***<0.001, and ****<0.0001. Data are represented as means ± SD.
(A) Immunofluorescence imaging of NIH/3T3 cells transfected with GFP alone and stained for GFP and cilia (TUBAC). Nuclei are stained with Hoechst. Arrowheads indicate cilia depicted in inset. Scale bars, 10μm and 2μm (inset).
(B) NIH/3T3 cells were co-transfected with GPR161-FLAG, PKA-Cα-YFP, and NeonGreen-PKA-RIα and stained for cilia (TUBAC) and indicated constructs: (i) GPR161-FLAG (FLAG), (ii) PKA Cα-YFP (YFP), (iii) NG-PKA RIα (NeonGreen). Nuclei are stained with Hoechst. Yellow arrowheads indicate cilia depicted in inset. Scale bars, 10μm and 2μm (inset).
(C) Quantification of relative ciliary enrichment of PKA-Cα-YFP compared to GFP alone. n=18 cells from 3 independent experiments. Significance was determined via two-tailed unpaired t-test. p values less than 0.05 were considered statistically significant and are denoted as follows: ****<0.0001. Data are represented as means ± SD.
(D) Immunofluorescence imaging of somites 12–15 in Gli:mCherry transgenic embryos expressing GFP alone, RAB23 S23N, or RAB23 Q68L. Images depict 24hpf somites stained for MPs (En, green) or mCherry (magenta).
(E) Quantification of Gli:mCherry-expressing cells per somite of uninjected embryos, and those expressing GFP, RAB23 S23N, or RAB23 Q68L. mCherry-expressing cells in somites 12 through 15 were counted and the average per somite determined for each embryo.
(F) Quantification of En-expressing MPs per somite of uninjected embryos, and those expressing GFP, RAB23 S23N, or RAB23 Q68L. n>12 embryos quantified from two injections. Significance was determined by one-way ANOVA followed by Tukey’s multiple comparison test. p values less than 0.05 were considered statistically significant and are denoted as follows: *<0.05. Data are represented as means ± SD.
Truong et al., 2021 Highlights.
Primary cilium-generated cAMP communicates different information than extraciliary cAMP
Vertebrate Hedgehog signaling is preferentially regulated by cilium-generated cAMP
The distinct subcellular geometry of the cilium contributes to information integrity
A ciliary pool of protein kinase A (PKA) interprets ciliary cAMP
ACKNOWLEDGEMENTS
We thank members of the Reiter laboratory for discussion and advice, Roshanak Irannejad, Markus Delling, Didier Stainier and Mark von Zastrow for comments on the manuscript, DeLaine Larsen and Kari Herrington from the UCSF Center for Advanced Light Microscopy for microscope use and imaging assistance, and the UCSF Cardiovascular Building fish facility for zebrafish husbandry. We also thank Peng Huang, James Chen, Xiaokun Shu, Maxence Nachury, Roshanak Irannejad, Aaron Marley and Mark von Zastrow for providing reagents. The UCSF Center for Advanced Light Microscopy is funded by the UCSF Research Evaluation and Allocation Committee, the Gross Fund, and the Heart Anonymous Fund. L.J.B. was funded by an Arnold O. Beckman Postdoctoral Fellowship. M.E.T. was supported by UCSF Discovery Fellowship and NIH grant T32HD007470. This work was supported by grants from the NIH (R01DE029454 and R01AR054396) to J.F.R. K.X. and J.F.R. acknowledge support by the Packard Fellowships for Science and Engineering. K.X. and J.F.R. are Chan Zuckerberg Biohub Investigators.
Footnotes
DECLARATION OF INTERESTS
The authors declare no competing interests.
Publisher's Disclaimer: This is a PDF file of an unedited manuscript that has been accepted for publication. As a service to our customers we are providing this early version of the manuscript. The manuscript will undergo copyediting, typesetting, and review of the resulting proof before it is published in its final form. Please note that during the production process errors may be discovered which could affect the content, and all legal disclaimers that apply to the journal pertain.
REFERENCES
- Agarwal SR, Yang P-C, Rice M, Singer CA, and Nikolaev VO (2014). Role of Membrane Microdomains in Compartmentation of cAMP Signaling. PLoS One 9, 95835. [DOI] [PMC free article] [PubMed] [Google Scholar]
- Allen JA, Halverson-Tamboli RA, and Rasenick MM (2007). Lipid raft microdomains and neurotransmitter signalling. Nat. Rev. Neurosci. 8, 128–140. [DOI] [PubMed] [Google Scholar]
- Anvarian Z, Mykytyn K, Mukhopadhyay S, Pedersen LB, and Christensen ST (2019). Cellular signalling by primary cilia in development, organ function and disease. Nat. Rev. Nephrol. 15, 199–219. [DOI] [PMC free article] [PubMed] [Google Scholar]
- Armbruster BN, Li X, Pausch MH, Herlitze S, and Roth BL (2007). Evolving the lock to fit the key to create a family of G protein-coupled receptors potently activated by an inert ligand. Proc. Natl. Acad. Sci. U. S. A. 104, 5163–5168. [DOI] [PMC free article] [PubMed] [Google Scholar]
- Aza-Blanc P, Ramírez- Weber FA, Laget MP, Schwartz C, and Kornberg TB (1997). Proteolysis that is inhibited by hedgehog targets cubitus interruptus protein to the nucleus and converts it to a repressor. Cell 89, 1043–1053. [DOI] [PubMed] [Google Scholar]
- Bachmann VA, Mayrhofer JE, Ilouz R, Tschaikner P, Raffeiner P, Röck R, Courcelles M, Apelt F, Lu T-W, Baillie GS, et al. (2016). Gpr161 anchoring of PKA consolidates GPCR and cAMP signaling. Proc. Natl. Acad. Sci. U. S. A. 113, 7786–7791. [DOI] [PMC free article] [PubMed] [Google Scholar]
- Bangs F, and Anderson KV (2017). Primary cilia and Mammalian Hedgehog signaling. Cold Spring Harb. Perspect. Biol. 9. [DOI] [PMC free article] [PubMed] [Google Scholar]
- Barresi MJ, Stickney HLL, Devoto SHH, F Barresi MJ, Stickney HLL, and Devoto SHH (2000). Slow muscle requires Slow-muscle-omitted. Development 127. [Google Scholar]
- Barresi MJF, D’Angelo JA, Hernández LP, and Devoto SH (2001). Distinct mechanisms regulate slow-muscle development. Curr. Biol. 11, 1432–1438. [DOI] [PubMed] [Google Scholar]
- Barzi M, Berenguer J, Menendez A, Alvarez-Rodriguez R, and Pons S. (2009). Sonic-hedgehog-mediated proliferation requires the localization of PKA to the cilium base. J. Cell Sci. 123. [DOI] [PubMed] [Google Scholar]
- Berbari NF, Johnson AD, Lewis JS, Askwith CC, and Mykytyn K. (2008). Identification of ciliary localization sequences within the third intracellular loop of G protein-coupled receptors. Mol. Biol. Cell 19, 1540–1547. [DOI] [PMC free article] [PubMed] [Google Scholar]
- Berg HC (1993). Random Walks in Biology, New and Expanded Edition. [Google Scholar]
- Blagden CS, Currie PD, Ingham PW, and Hughes SM (1997). Notochord induction of zebrafish slow muscle mediated by sonic hedgehog. Genes Dev. 11, 2163–2175. [DOI] [PMC free article] [PubMed] [Google Scholar]
- Briscoe J, Pierani A, Jessell TM, and Ericson J. (2000). A homeodomain protein code specifies progenitor cell identity and neuronal fate in the ventral neural tube. Cell 101, 435–445. [DOI] [PubMed] [Google Scholar]
- Brunton LL, Hayes JS, and Mayer SE (1979). Hormonally specific phosphorylation of cardiac troponin I and activation of glycogen phosphorylase [24]. Nature 280, 78–80. [DOI] [PubMed] [Google Scholar]
- Bugaj LJ, and Lim WA (2019). High-throughput multicolor optogenetics in microwell plates. Nat. Protoc. 14, 2205–2228. [DOI] [PubMed] [Google Scholar]
- Buxton ILO, and Brunton LL (1983). Compartments of cyclic AMP and protein kinase in mammalian cardiomyocytes. J. Biol. Chem. 258, 10233–10239. [PubMed] [Google Scholar]
- Calebiro D, and Koszegi Z. (2019). The subcellular dynamics of GPCR signaling. Mol. Cell. Endocrinol. 483, 24–30. [DOI] [PubMed] [Google Scholar]
- Carpenter B, and Tate CG (2016). Engineering a minimal G protein to facilitate crystallisation of G protein-coupled receptors in their active conformation. Protein Eng. Des. Sel. 29, 583–594. [DOI] [PMC free article] [PubMed] [Google Scholar]
- Chiang C, Litingtung Y, Lee E, Young KE, Corden JL, Westphal H, and Beachy PA (1996). Cyclopia and defective axial patterning in mice lacking Sonic hedgehog gene function. Nature 383, 407–413. [DOI] [PubMed] [Google Scholar]
- Clegg CH, Correll LA, Cadd GG, and McKnight GS (1987). Inhibition of intracellular cAMP-dependent protein kinase using mutant genes of the regulatory type I subunit. J. Biol. Chem. 262, 13111–13119. [PubMed] [Google Scholar]
- Corbit KC, Aanstad P, Singla V, Norman AR, Stainier DYR, and Reiter JF (2005). Vertebrate Smoothened functions at the primary cilium. Nature 437, 1018–1021. [DOI] [PubMed] [Google Scholar]
- Dai P, Akimaru H, Tanaka Y, Maekawa T, Nakafuku M, and Ishii S. (1999). Sonic hedgehog-induced activation of the Gli1 promoter is mediated by GLI3. J. Biol. Chem. 274, 8143–8152. [DOI] [PubMed] [Google Scholar]
- Delling M, DeCaen PG, Doerner JF, Febvay S, and Clapham DE (2013). Primary cilia are specialized calcium signalling organelles. Nature 504, 311–314. [DOI] [PMC free article] [PubMed] [Google Scholar]
- Devoto SH, Melancon E, Eisen JS, and Westerfield M. (1996). Identification of separate slow and fast muscle precursor cells in vivo, prior to somite formation. Development 122. [DOI] [PubMed] [Google Scholar]
- Du SJ, Devoto SH, Westerfield M, and Moon RT (1997). Positive and Negative Regulation of Muscle Cell Identity by Members of the hedgehog and TGF-β Gene Families. J. Cell Biol. 139. [DOI] [PMC free article] [PubMed] [Google Scholar]
- Ericson J, Morton S, Kawakami A, Roelink H, and Jessell TM (1996). Two critical periods of Sonic Hedgehog signaling required for the specification of motor neuron identity. Cell 87, 661–673. [DOI] [PubMed] [Google Scholar]
- Evans TM, Ferguson C, Wainwright BJ, Parton RG, and Wicking C. (2003). Rab23, a Negative Regulator of Hedgehog Signaling, Localizes to the Plasma Membrane and the Endocytic Pathway. Traffic 4, 869–884. [DOI] [PubMed] [Google Scholar]
- Fan C-M, and Tessier-Lavigne M. (1994). Patterning of Mammalian Somites by Surface Ectoderm and Notochord: Evidence for Sclerotome Induction by a Hedgehog Homolog. Cell 79, 1175–1186. [DOI] [PubMed] [Google Scholar]
- Gigante ED, and Caspary T. (2020). Signaling in the primary cilium through the lens of the Hedgehog pathway. Wiley Interdiscip. Rev. Dev. Biol. e377. [DOI] [PMC free article] [PubMed] [Google Scholar]
- Gigante ED, Taylor MR, Ivanova AA, Kahn RA, and Caspary T. (2020). ARL13B regulates Sonic Hedgehog signaling from outside primary cilia. Elife 9. [DOI] [PMC free article] [PubMed] [Google Scholar]
- Gillingham AK, and Munro S. (2000). The PACT domain, a conserved centrosomal targeting motif in the coiled-coil proteins AKAP450 and pericentrin. EMBO Rep. 1, 524–529. [DOI] [PMC free article] [PubMed] [Google Scholar]
- Gonçalves J, and Pelletier L. (2017). The ciliary transition zone: Finding the pieces and assembling the gate. Mol. Cells 40, 243–253. [DOI] [PMC free article] [PubMed] [Google Scholar]
- Green JA, Schmid CL, Bley E, Monsma PC, Brown A, Bohn LM, and Mykytyn K. (2015). Recruitment of β-arrestin into Neuronal Cilia Modulates Somatostatin Receptor Subtype 3 Ciliary Localization. Mol. Cell. Biol. MCB.00765–15. [DOI] [PMC free article] [PubMed] [Google Scholar]
- Guettier JM, Gautam D, Scarselli M, De Azua IR, Li JH, Rosemond E, Ma X, Gonzalez FJ, Armbruster BN, Lu H, et al. (2009). A chemical-genetic approach to study G protein regulation of β cell function in vivo. Proc. Natl. Acad. Sci. U. S. A. 106, 19197–19202. [DOI] [PMC free article] [PubMed] [Google Scholar]
- Guner B, and Karlstrom RO (2007). Cloning of zebrafish nkx6.2 and a comprehensive analysis of the conserved transcriptional response to Hedgehog/Gli signaling in the zebrafish neural tube. Gene Expr. Patterns 7, 596–605. [DOI] [PMC free article] [PubMed] [Google Scholar]
- Hammerschmidt M, Bitgood MJ, and McMahon AP (1996). Protein kinase A is a common negative regulator of Hedgehog signaling in the vertebrate embryo. Genes Dev. 10, 647–658. [DOI] [PubMed] [Google Scholar]
- Händel M, Schulz S, Stanarius A, Schreff M, Erdtmann-Vourliotis M, Schmidt H, Wolf G, and Höllt V. (1999). Selective targeting of somatostatin receptor 3 to neuronal cilia. Neuroscience 89, 909–926. [DOI] [PubMed] [Google Scholar]
- Harada K, Ito M, Wang X, Tanaka M, Wongso D, Konno A, Hirai H, Hirase H, Tsuboi T, and Kitaguchi T. (2017). Red fluorescent protein-based cAMP indicator applicable to optogenetics and in vivo imaging. Sci. Rep. 7, 7351. [DOI] [PMC free article] [PubMed] [Google Scholar]
- Hauser AS, Attwood MM, Rask-Andersen M, Schiöth HB, and Gloriam DE (2017). Trends in GPCR drug discovery: New agents, targets and indications. Nat. Rev. Drug Discov. 16, 829–842. [DOI] [PMC free article] [PubMed] [Google Scholar]
- Higginbotham H, Eom TY, Mariani LE, Bachleda A, Hirt J, Gukassyan V, Cusack CL, Lai C, Caspary T, and Anton ES (2012). Arl13b in Primary Cilia Regulates the Migration and Placement of Interneurons in the Developing Cerebral Cortex. Dev. Cell 23, 925–938. [DOI] [PMC free article] [PubMed] [Google Scholar]
- Hilgendorf KI, Johnson CT, and Jackson PK (2016). The primary cilium as a cellular receiver: organizing ciliary GPCR signaling. Curr. Opin. Cell Biol. 39, 84–92. [DOI] [PMC free article] [PubMed] [Google Scholar]
- Hirsinger E, Stellabotte F, Devoto SH, and Westerfield M. (2004). Hedgehog signaling is required for commitment but not initial induction of slow muscle precursors. Dev. Biol. 275, 143–157. [DOI] [PubMed] [Google Scholar]
- Huangfu D, Liu A, Rakeman AS, Murcia NS, Niswander L, and Anderson KV (2003). Hedgehog signalling in the mouse requires intraflagellar transport proteins. Nature 426, 83–87. [DOI] [PubMed] [Google Scholar]
- Humke EW, Dorn KV, Milenkovic L, Scott MP, and Rohatgi R. (2010). The output of Hedgehog signaling is controlled by the dynamic association between Suppressor of Fused and the Gli proteins. Genes Dev. 24, 670–682. [DOI] [PMC free article] [PubMed] [Google Scholar]
- Insel PA, Head BP, Ostrom RS, Patel HH, Swaney JS, Tang CM, and Roth DM (2005). Caveolae and lipid rafts: G protein-coupled receptor signaling microdomains in cardiac myocytes. Ann. N. Y. Acad. Sci. 1047, 166–172. [DOI] [PubMed] [Google Scholar]
- Irannejad R, Pessino V, Mika D, Huang B, Wedegaertner PB, Conti M, and von Zastrow M. (2017). Functional selectivity of GPCR-directed drug action through location bias. Nat. Chem. Biol. 13, 799–806. [DOI] [PMC free article] [PubMed] [Google Scholar]
- Jiang J, and Struhl G. (1995). Protein kinase A and hedgehog signaling in drosophila limb development. 80, 563–572. [DOI] [PubMed] [Google Scholar]
- Jiang J, and Struhl G. (1998). Regulation of the Hedgehog and Wingless signalling pathways by the F- box/WD40-repeat protein Slimb. Nature 391, 493–496. [DOI] [PubMed] [Google Scholar]
- Jiang JY, Falcone JL, Curci S, and Hofer AM (2019). Direct visualization of cAMP signaling in primary cilia reveals up-regulation of ciliary GPCR activity following Hedgehog activation. Proc. Natl. Acad. Sci. U. S. A. 116, 12066–12071. [DOI] [PMC free article] [PubMed] [Google Scholar]
- Jullié D, Stoeber M, Sibarita JB, Zieger HL, Bartol TM, Arttamangkul S, Sejnowski TJ, Hosy E, and von Zastrow M. (2020). A Discrete Presynaptic Vesicle Cycle for Neuromodulator Receptors. Neuron 105, 663–677.e8. [DOI] [PMC free article] [PubMed] [Google Scholar]
- Karlstrom RO, Tyurina OV, Kawakami A, Nishioka N, Talbot WS, Sasaki H, and Schier AF (2003). Genetic analysis of zebrafish gli1 and gli2 reveals divergent requirements for gli genes in vertebrate development. Development 130, 1549–1564. [DOI] [PubMed] [Google Scholar]
- Kawakami K, Takeda H, Kawakami N, Kobayashi M, Matsuda N, and Mishina M. (2004). A transposon-mediated gene trap approach identifies developmentally regulated genes in zebrafish. Dev. Cell 7, 133–144. [DOI] [PubMed] [Google Scholar]
- Keely SL (1979). Prostaglandin E1 activation of heart cAMP-dependent protein kinase: Apparent dissociation of protein kinase activation from increases in phosphorylase activity and contractile force. [PubMed] [Google Scholar]
- Kimmel CB, Ballard WW, Kimmel SR, Ullmann B, and Schilling TF (1995). Stages of embryonic development of the zebrafish. Dev. Dyn. 203, 253–310. [DOI] [PubMed] [Google Scholar]
- Kong JH, Siebold C, and Rohatgi R. (2019). Biochemical mechanisms of vertebrate hedgehog signaling. Development 146. [DOI] [PMC free article] [PubMed] [Google Scholar]
- Koschinski A, and Zaccolo M. Activation of PKA in cell requires higher concentration of cAMP than in vitro: implications for compartmentalization of cAMP signalling. [DOI] [PMC free article] [PubMed] [Google Scholar]
- Kwan KM, Fujimoto E, Grabher C, Mangum BD, Hardy ME, Campbell DS, Parant JM, Yost HJ, Kanki JP, and Chien C-B (2007). The Tol2kit: A multisite gateway-based construction kit forTol2 transposon transgenesis constructs. Dev. Dyn. 236, 3088–3099. [DOI] [PubMed] [Google Scholar]
- Leaf A, and von Zastrow M. (2015). Dopamine receptors reveal an essential role of IFT-B, KIF17, and Rab23 in delivering specific receptors to primary cilia. Elife 4. [DOI] [PMC free article] [PubMed] [Google Scholar]
- Li W, Ohlmeyer JT, Lane ME, and Kalderon D. (1995). Function of protein kinase A in hedgehog signal transduction and Drosophila imaginal disc development. Cell 80, 553–562. [DOI] [PubMed] [Google Scholar]
- Lim YS, and Tang BL (2015). A role for Rab23 in the trafficking of Kif17 to the primary cilium. J. Cell Sci. 128, 2996–3008. [DOI] [PubMed] [Google Scholar]
- Link V, Shevchenko A, and Heisenberg CP (2006). Proteomics of early zebrafish embryos. BMC Dev. Biol. 6, 1. [DOI] [PMC free article] [PubMed] [Google Scholar]
- Marley A, Choy RW-Y, von Zastrow M, Bonci A, and Zastrow M. von (2013). GPR88 Reveals a Discrete Function of Primary Cilia as Selective Insulators of GPCR Cross-Talk. PLoS One 8, e70857. [DOI] [PMC free article] [PubMed] [Google Scholar]
- McGrath J, Somlo S, Makova S, Tian X, and Brueckner M. (2003). Two Populations of Node Monocilia Initiate Left-Right Asymmetry in the Mouse. Cell 114, 61–73. [DOI] [PubMed] [Google Scholar]
- Méthot N, and Basler K. (1999). Hedgehog controls limb development by regulating the activities of distinct transcriptional activator and repressor forms of cubitus interruptus. Cell 96, 819–831. [DOI] [PubMed] [Google Scholar]
- Mich JK, Payumo AY, Rack PG, and Chen JK (2014). In Vivo Imaging of Hedgehog Pathway Activation with a Nuclear Fluorescent Reporter. PLoS One 9, e103661. [DOI] [PMC free article] [PubMed] [Google Scholar]
- Mick DU, Rodrigues RB, Leib RD, Adams CM, Chien AS, Gygi SP, and Nachury MV (2015). Proteomics of Primary Cilia by Proximity Labeling. Dev. Cell 35, 497–512. [DOI] [PMC free article] [PubMed] [Google Scholar]
- Moore BS, Stepanchick AN, Tewson PH, Hartle CM, Zhang J, Quinn AM, Hughes TE, and Mirshahi T. (2016). Cilia have high cAMP levels that are inhibited by Sonic Hedgehog-regulated calcium dynamics. Proc. Natl. Acad. Sci. U. S. A. 201602393. [DOI] [PMC free article] [PubMed] [Google Scholar]
- Morin-Kensicki EM, and Eisen JS (1997). Sclerotome development and peripheral nervous system segmentation in embryonic zebrafish. Development 124, 159–167. [DOI] [PubMed] [Google Scholar]
- Mukhopadhyay S, Wen X, Ratti N, Loktev A, Rangell L, Scales SJ, and Jackson PK (2013). The Ciliary G-Protein-Coupled Receptor Gpr161 Negatively Regulates the Sonic Hedgehog Pathway via cAMP Signaling. Cell 152, 210–223. [DOI] [PubMed] [Google Scholar]
- Mykytyn K, and Askwith C. (2017). G-Protein-Coupled Receptor Signaling in Cilia. Cold Spring Harb. Perspect. Biol. 9, a028183. [DOI] [PMC free article] [PubMed] [Google Scholar]
- Neves SR, Ram PT, and Iyengar R. (2002). G protein pathways. Science (80-. ). 296, 1636–1639. [DOI] [PubMed] [Google Scholar]
- Neves SR, Tsokas P, Sarkar A, Grace EA, Rangamani P, Taubenfeld SM, Alberini CM, Schaff JC, Blitzer RD, Moraru II, et al. (2008). Cell Shape and Negative Links in Regulatory Motifs Together Control Spatial Information Flow in Signaling Networks. Cell 133, 666–680. [DOI] [PMC free article] [PubMed] [Google Scholar]
- Niewiadomski P, Zhujiang A, Youssef M, and Waschek JA (2013). Interaction of PACAP with Sonic hedgehog reveals complex regulation of the Hedgehog pathway by PKA. Cell. Signal. 25, 2222–2230. [DOI] [PMC free article] [PubMed] [Google Scholar]
- Nonaka S, Tanaka Y, Okada Y, Takeda S, Harada A, Kanai Y, Kido M, and Hirokawa N. (1998). Randomization of left-right asymmetry due to loss of nodal cilia generating leftward flow of extraembryonic fluid in mice lacking KIF3B motor protein. Cell 95, 829–837. [DOI] [PubMed] [Google Scholar]
- Odenthal J, Van Eeden FJM, Haffter P, Ingham PW, and Nüsslein-Volhard C. (2000). Two distinct cell populations in the floor plate of the Zebrafish are induced by different pathways. Dev. Biol. 219, 350–363. [DOI] [PubMed] [Google Scholar]
- Ohadi D, and Rangamani P. (2019). Geometric Control of Frequency Modulation of cAMP Oscillations due to Calcium in Dendritic Spines. Biophys. J. 117, 1981–1994. [DOI] [PMC free article] [PubMed] [Google Scholar]
- Pal K, Hwang S, Somatilaka B, Badgandi H, Jackson PK, DeFea K, and Mukhopadhyay S. (2016). Smoothened determines β-arrestin–mediated removal of the G protein–coupled receptor Gpr161 from the primary cilium. J. Cell Biol. 212, 861–875. [DOI] [PMC free article] [PubMed] [Google Scholar]
- Pazour GJ, San Agustin JT, Follit JA, Rosenbaum JL, and Witman GB (2002). Polycystin-2 localizes to kidney cilia and the ciliary level is elevated in orpk mice with polycystic kidney disease. Curr. Biol. 12, R378–R380. [DOI] [PubMed] [Google Scholar]
- Pennekamp P, Karcher C, Fischer A, Schweickert A, Skryabin B, Horst J, Blum M, and Dworniczak B. (2002). The ion channel polycystin-2 is required for left-right axis determination in mice. Curr. Biol. 12, 938–943. [DOI] [PubMed] [Google Scholar]
- Pierce KL, Premont RT, and Lefkowitz RJ (2002). Seven-transmembrane receptors. Nat. Rev. Mol. Cell Biol. 3, 639–650. [DOI] [PubMed] [Google Scholar]
- Price MA, and Kalderon D. (1999). Regulation of Ci proteolysis by PKA. Development 4331–4339. [DOI] [PubMed] [Google Scholar]
- Reiter JF, Alexander J, Rodaway A, Yelon D, Patient R, Holder N, and Stainier DYR (1999). Gata5 is required for the development of the heart and endoderm in zebrafish. Genes Dev. 13, 2983–2995. [DOI] [PMC free article] [PubMed] [Google Scholar]
- Repina NA, McClave T, Bao X, Kane RS, and Schaffer DV (2019). Engineered illumination devices for optogenetic control of cellular signaling dynamics. BioRxiv. [DOI] [PMC free article] [PubMed] [Google Scholar]
- Roth BL (2016). DREADDs for Neuroscientists. Neuron 89, 683–694. [DOI] [PMC free article] [PubMed] [Google Scholar]
- Roy S, Wolff C, and Ingham PW (2001). The u-boot mutation identifies a Hedgehog-regulated myogenic switch for fiber-type diversification in the zebrafish embryo. Genes Dev. 15, 1563–1576. [DOI] [PMC free article] [PubMed] [Google Scholar]
- Siljee JE, Wang Y, Bernard AA, Ersoy BA, Zhang S, Marley A, Von Zastrow M, Reiter JF, and Vaisse C. (2018). Subcellular localization of MC4R with ADCY3 at neuronal primary cilia underlies a common pathway for genetic predisposition to obesity. Nat. Genet. 50, 180–185. [DOI] [PMC free article] [PubMed] [Google Scholar]
- Stierl M, Stumpf P, Udwari D, Gueta R, Hagedorn R, Losi ʈ A, Gä rtner W, Petereit L, Efetova M, Schwarzel M, et al. (2010). Light Modulation of Cellular cAMP by a Small Bacterial Photoactivated Adenylyl Cyclase, bPAC, of the Soil Bacterium. Journal 286, 1181–1188. [DOI] [PMC free article] [PubMed] [Google Scholar]
- Sungkaworn T, Jobin ML, Burnecki K, Weron A, Lohse MJ, and Calebiro D. (2017). Single-molecule imaging reveals receptor-G protein interactions at cell surface hot spots. Nature 550, 543–547. [DOI] [PubMed] [Google Scholar]
- Taylor SS, Ilouz R, Zhang P, and Kornev AP (2012). Assembly of allosteric macromolecular switches: Lessons from PKA. Nat. Rev. Mol. Cell Biol. 13, 646–658. [DOI] [PMC free article] [PubMed] [Google Scholar]
- Tolkovsky AM, and Levitzki A. (1978a). Coupling of a Single Adenylate Cyclase to Two Receptors: Adenosine and Catecholamine. Biochemistry 17, 3811–3817. [DOI] [PubMed] [Google Scholar]
- Tolkovsky AM, and Levitzki A. (1978b). Mode of Coupling between theβ- Adrenergic Receptor and Adenylate Cyclase in Turkey Erythrocytes. Biochemistry 17, 3795–3810. [DOI] [PubMed] [Google Scholar]
- Tsvetanova NG, and von Zastrow M. (2014). Spatial encoding of cyclic AMP signaling specificity by GPCR endocytosis. Nat. Chem. Biol. 10, 1061–1065. [DOI] [PMC free article] [PubMed] [Google Scholar]
- Tuson M, He M, and Anderson KV (2011). Protein kinase A acts at the basal body of the primary cilium to prevent Gli2 activation and ventralization of the mouse neural tube. Development 138, 4921–4930. [DOI] [PMC free article] [PubMed] [Google Scholar]
- Tyurina OV, Guner B, Popova E, Feng J, Schier AF, Kohtz JD, and Karlstrom RO (2005). Zebrafish Gli3 functions as both an activator and a repressor in Hedgehog signaling. Dev. Biol. 277, 537–556. [DOI] [PubMed] [Google Scholar]
- Ungar AR, and Moon RT (1996). Inhibition of protein kinase A phenocopies ectopic expression of hedgehog in the CNS of wild-type and cyclops mutant embryos. Dev. Biol. 178, 186–191. [DOI] [PubMed] [Google Scholar]
- Wan Q, Okashah N, Inoue A, Nehme R, Carpenter B, Tate CG, and Lambert NA (2018). Mini G protein probes for active G protein– coupled receptors (GPCRs) in live cells. J. Biol. Chem. 293, 7466–7473. [DOI] [PMC free article] [PubMed] [Google Scholar]
- Wang B, Fallon JF, and Beachy PA (2000). Hedgehog-Regulated Processing of Gli3 Produces an Anterior/Posterior Repressor Gradient in the Developing Vertebrate Limb. Cell 100, 423–434. [DOI] [PubMed] [Google Scholar]
- Wang G, Wang B, and Jiang J. (1999). Protein kinase A antagonizes Hedgehog signaling by regulating both the activator and repressor forms of Cubitus interruptus. Genes Dev. 13, 2828–2837. [DOI] [PMC free article] [PubMed] [Google Scholar]
- Wen X, Lai CK, Evangelista M, Hongo J-A, de Sauvage FJ, and Scales SJ (2010). Kinetics of Hedgehog-Dependent Full-Length Gli3 Accumulation in Primary Cilia and Subsequent Degradation. Mol. Cell. Biol. 30, 1910–1922. [DOI] [PMC free article] [PubMed] [Google Scholar]
- Wolff C, Roy S, and Ingham PW (2003). Multiple Muscle Cell Identities Induced by Distinct Levels and Timing of Hedgehog Activity in the Zebrafish Embryo. Curr. Biol. 13, 1169–1181. [DOI] [PubMed] [Google Scholar]
- Wong W, and Scott JD (2004). AKAP signalling complexes: focal points in space and time. Nat. Rev. Mol. Cell Biol. 5, 959–970. [DOI] [PubMed] [Google Scholar]
- Ye F, Nager AR, and Nachury MV (2018). BBSome trains remove activated GPCRs from cilia by enabling passage through the transition zone. J. Cell Biol. 217, 1847–1868. [DOI] [PMC free article] [PubMed] [Google Scholar]
- Yoshiba S, Shiratori H, Kuo IY, Kawasumi A, Shinohara K, Nonaka S, Asai Y, Sasaki G, Belo JA, Sasaki H, et al. (2012). Cilia at the node of mouse embryos sense fluid flow for left-right determination via Pkd2. Science (80-. ). 338, 226–231. [DOI] [PMC free article] [PubMed] [Google Scholar]
- Yu D, Baird MA, Allen JR, Howe ES, Klassen MP, Reade A, Makhijani K, Song Y, Liu S, Murthy Z, et al. (2015). A naturally monomeric infrared fluorescent protein for protein labeling in vivo. Nat. Methods 12, 763–765. [DOI] [PMC free article] [PubMed] [Google Scholar]
- Zaccolo M, and Pozzan T. (2002). Discrete microdomains with high concentration of cAMP in stimulated rat neonatal cardiac myocytes. Science (80-. ). 295, 1711–1715. [DOI] [PubMed] [Google Scholar]
Associated Data
This section collects any data citations, data availability statements, or supplementary materials included in this article.
Supplementary Materials
(A) Immunoblot for Myc-tagged Cyto-bPAC and Cilia-bPAC in 24hpf zebrafish embryo lysates. β-actin serves as a loading control.
(B) Whole-mount brightfield images of transgenic Cyto-bPAC and Cilia-bPAC zebrafish embryos either raised in the dark or stimulated with blue light from 14–18 hours post fertilization.
(A) Immunofluorescence images of zebrafish somites either uninjected or injected with mRNA encoding Myc-tagged Nonciliary-bPAC (ARL13BV359A-bPAC-MYC) or Cilia-bPAC (ARL13B-bPAC-MYC). Images depict 18hpf somites stained for bPAC (Myc, green), cilia (TubAC, red), basal bodies (γTUB, grayscale) and nuclei (Hoechst, blue). Arrowheads indicate cilia depicted in insets. Insets display overlay of bPAC, cilia and basal bodies (left), overlay of cilia and basal bodies (middle), and bPAC alone (right). Scale bars, 20μm for main images and 2μm for insets.
(B) Quantification of cAMP in uninjected and embryos expressing either Nonciliary-bPAC or Cilia-bPAC. Embryos were stimulated in the presence of 100μM IBMX with 0.35mW/cm2 470nm pulsed blue light from 14–18hpf.
(C) Immunofluorescence images of Gli:mCherry transgenic embryos either uninjected, or injected with mRNA encoding Nonciliary-bPAC or Cilia-bPAC. Embryos were stained for mCherry (greyscale). Embryos were either raised in the dark or stimulated with 0.35mW/cm2 470nm pulsed blue light from 14–18hpf and then allowed to develop until 24hpf. Scale bar, 40μm.
(D) Quantification of Gli:mCherry-expressing cells per somite of uninjected embryos and those injected with mRNA encoding the indicated forms of bPAC. Each point represents the average number of mCherry-expressing cells over somites 12–15 of one embryo. Embryos were generated in three independent sets of injections. For both (B) and (D), significance was determined via two-way ANOVA with Tukey’s multiple comparison test. A p value less than 0.05 was considered statistically significant and is denoted as follows: *<0.05, ***<0.001, and ****<0.0001. Data are represented as means ± SD.
(E) Schematic of HH-dependent neural tube patterning. A gradient of Shh secreted from the notochord (NT) and medial floorplate (blue) patterns lateral floor plate cells expressing Nkx2.2b (red) and motorneuron precursors expressing Olig2 (yellow).
(F,G) Whole-mount in situ hybridization to detect neural tube markers in Wild-type, Cyto-bPAC, and Cilia-bPAC-expressing transgenic zebrafish either raised in the dark or stimulated with blue light. Left panels depict views of lateral whole mount 24hpf embryos. Right panels depict transverse cross-sections. Dotted lines outline the neural tubes. Expression of Nkx2.2b (F) and Olig2 (G) are reduced specifically in Cilia-bPAC embryos stimulated with light. Scale bar, 40μm.
(A) Untargeted Pink Flamindo expressed in either ciliated Cyto-bPAC (red) or ciliated Cilia-bPAC (blue) cells was stimulated with (open circles) or without (solid circles) 52.7mW/cm2 blue light. 100μM Forskolin was added at the indicated time (arrow) after blue light stimulation. Left panel depicts quantification of Pink Flamindo fluorescence over time. Right panel depicts the maximum Pink Flamindo fluorescence after blue light stimulation. n>15 cells quantified over two independent experiments. Significance was determined via two-way ANOVA followed by Tukey’s multiple comparison test.
(B) A red-shifted cAMP sensor, Pink Flamindo, was fused to the far-red fluorescent protein mIFP and Rab23 Q68L, which constitutively localizes to the cilium, to generate Ciliary Pink Flamindo. Bottom panel depicts representative images of Pink Flamindo (Fire) and mIFP (greyscale) fluorescence in NIH/3T3 cells stably expressing Ciliary Pink Flamindo upon addition of either vehicle (DMSO) or 100μM Forskolin. Forskolin increases Pink Flamindo fluorescence. Scale bar, 2μm.
(C) Quantification of Ciliary Pink Flamindo fluorescence over time upon increasing concentrations of Forskolin. The ratio of Pink Flamindo fluorescence to mIFP fluorescence at cilia was measured, then normalized to baseline fluorescence (F/F0). Traces represent the average of n>15 cells over 3 independent experiments. The maximum Ciliary Pink Flamindo fluorescence (Fmax/F0) is also displayed for each cell. Significance was determined via one-way ANOVA followed by Tukey’s multiple comparison test. p values less than 0.05 were considered statistically significant and is denoted as follows: *<0.05 and ****<0.0001. Data are represented as means ± SD.
(D) Immunofluorescence images of wild-type, Cyto-bPAC and Cilia-bPAC NIH/3T3 cells treated with either vehicle (DMSO) or 200nM SAG in the presence or absence of 4 hours of 0.14mW/cm2 pulsed blue light. Cells were stained for SMO (green), cilia (TUBAC, magenta), and nuclei (Hoechst, blue). Insets display SMO localization to the cilium (defined by TUBAC staining). Scale bar, 10μm. Inset scale bar, 2μm.
(E) Quantification of ciliary SMO immunofluorescence. Fluorescence was normalized to the mean of that of wild-type cells treated with vehicle in the dark.
(F) Immunofluorescence images of wild-type, Cyto-bPAC and Cilia-bPAC NIH/3T3 cells stimulated as above and stained for GPR161 (green), cilia (TUBAC, magenta), and nuclei (Hoechst, blue). Insets display GPR161 localization to the cilium (defined by TUBAC staining). Scale bar, 10μm. Inset scale bar, 2μm.
(G) Quantification of ciliary GPR161 fluorescence. For (B) and (D), significance was determined using one-way ANOVA followed by Tukey’s multiple comparison test. A p value less than 0.05 was considered statistically significant and is denoted as follows: ****<0.0001. Data are represented as means ± SD.
(A) Oversaturated immunofluorescence images of transgenic NIH/3T3 cells stably expressing GFP-tagged PM-DREADD or Cilia-DREADD. Images depict cells stained for the GFP-tagged DREADDs (GFP, green), cilia (TUBAC, red), basal bodies (γTUB, grayscale) and nuclei (Hoechst, blue). Insets indicate amount of GFP-tagged DREADD localization to the cilium (defined by TUBAC and γTUB). Scale bars, 10μm and 1μm (inset). With increased exposure, PM-DREADD is not observed in the ciliary membrane.
(B) Immunoblot for GFP-tagged PM-DREADD and Cilia-DREADD. Immunoblot for GAPDH was used to control for protein loading.
(C) Mini-G sensors visualized G-protein activity in Cilia-DREADD-expressing cells. Cilia in live cells were identified through enrichment of a tubulin dye (SiR-Tubulin, magenta) and localization of GFP-tagged Cilia-DREADD (green). The mApple-tagged mini-G sensor (grayscale) was not enriched in cilia both before and 10 minutes after treatment with vehicle (DMSO). Yellow arrowheads indicate cilia depicted in insets. Scale bars, 10μm and 2μm (inset).
(D) In Cilia-DREADD cells incubated with 10μM CNO for 10 minutes, the mApple-tagged mini-G sensor (grayscale) accumulated in cilia. Scale bars, 10μm and 2μm (inset).
(E-F) Quantification of cilia length (E) and nuclei per field of view (F) in wild-type, PM-DREADD- or Cilia-DREADD-expressing cells upon treatment with either vehicle (DMSO) or 5nM CNO for 5 hours. n>50 cilia were quantified over four random fields. For (E) and (F), significance was determined via two-tailed unpaired t-test.
(G) Measurement of Gli1 expression in wild-type, PM-DREADD- or Cilia-DREADD-expressing cells treated with either vehicle or 5nM CNO by qRT-PCR. n=3–4 biological replicates. Significance was determined via one-way ANOVA followed by Tukey’s multiple comparison test. A p value less than 0.05 was considered statistically significant. Data are represented as means ± SD.
(A) Graphical depiction of PKA activation upon either ciliary membrane or plasma membrane cAMP generation. Grey points indicate inactive PKA. Magenta points indicate PKA computed to have bound 4 cAMP molecules and thus be active. Scale bar, 5μm.
(B) Percent of activated plasma membrane PKA following either ciliary (red) or plasma membrane (blue) cAMP generation, as a function of time (compare to Figure 5A).
(C) The model was re-run with a doubling of ciliary diameter (with a concomitant fourfold increase in ciliary volume). Percent of activated ciliary membrane (middle) and plasma membrane (right) PKA following either ciliary (red) or plasma membrane (blue) cAMP generation, as functions of time. Increasing ciliary diameter is predicted to compromise the difference between ciliary PKA activation by ciliary and plasma membrane cAMP (compare to Figure 5A).
(D) To model the effects of changing ciliary diameter and volume separately, the model was re-run with the larger ciliary diameter, but keeping ciliary volume equal to the original model described in Figure S5A by reducing ciliary length. Percent of activated ciliary membrane (middle) and plasma membrane (right) PKA following either ciliary (red) or plasma membrane (blue) cAMP generation, as functions of time. Decreasing ciliary length is predicted to further compromise the difference between ciliary PKA activation by ciliary and plasma membrane cAMP.
(E) Graphical depiction of PKA activation upon high levels of either ciliary membrane or plasma membrane cAMP generation. Grey points indicate inactive PKA. Magenta points indicate PKA computed to have bound 4 cAMP molecules and thus be active. Scale bar, 5μm.
(F) Percent of activated ciliary membrane- (top panel) or plasma membrane- (bottom panel) localized PKA upon 340 cAMPs/second generation at either ciliary or plasma membranes.
(G) Quantification of En-expressing somitic cells in Cyto-bPAC and Cilia-bPAC transgenic zebrafish embryos stimulated with low (0.065mW/cm2, as utilized in Figure 2), medium (0.35mW/cm2), or high (0.87mW/cm2) intensity blue light from 14–18hpf. Each data point represents the average number of En-expressing cells per somite 12 through 15 per 24hpf embryo. Statistical significance was assessed using a two-way ANOVA followed by Tukey’s multiple comparison test. A p value less than 0.05 was considered statistically significant and is denoted as follows: **<0.01, ***<0.001, and ****<0.0001. Data are represented as means ± SD.
(H) Ratios of Gli1 expression in WT and PM-DREADD- or Cilia-DREADD-expressing cells treated with 200nM SAG and indicated concentrations of CNO to Gli1 expression treated with 200nM SAG alone. Significance was determined via one-way ANOVA followed by Tukey’s multiple comparison test. A p value less than 0.05 was considered statistically significant and is denoted as follows: ***<0.001, and ****<0.0001. Data are represented as means ± SD.
(A) Immunofluorescence imaging of NIH/3T3 cells transfected with GFP alone and stained for GFP and cilia (TUBAC). Nuclei are stained with Hoechst. Arrowheads indicate cilia depicted in inset. Scale bars, 10μm and 2μm (inset).
(B) NIH/3T3 cells were co-transfected with GPR161-FLAG, PKA-Cα-YFP, and NeonGreen-PKA-RIα and stained for cilia (TUBAC) and indicated constructs: (i) GPR161-FLAG (FLAG), (ii) PKA Cα-YFP (YFP), (iii) NG-PKA RIα (NeonGreen). Nuclei are stained with Hoechst. Yellow arrowheads indicate cilia depicted in inset. Scale bars, 10μm and 2μm (inset).
(C) Quantification of relative ciliary enrichment of PKA-Cα-YFP compared to GFP alone. n=18 cells from 3 independent experiments. Significance was determined via two-tailed unpaired t-test. p values less than 0.05 were considered statistically significant and are denoted as follows: ****<0.0001. Data are represented as means ± SD.
(D) Immunofluorescence imaging of somites 12–15 in Gli:mCherry transgenic embryos expressing GFP alone, RAB23 S23N, or RAB23 Q68L. Images depict 24hpf somites stained for MPs (En, green) or mCherry (magenta).
(E) Quantification of Gli:mCherry-expressing cells per somite of uninjected embryos, and those expressing GFP, RAB23 S23N, or RAB23 Q68L. mCherry-expressing cells in somites 12 through 15 were counted and the average per somite determined for each embryo.
(F) Quantification of En-expressing MPs per somite of uninjected embryos, and those expressing GFP, RAB23 S23N, or RAB23 Q68L. n>12 embryos quantified from two injections. Significance was determined by one-way ANOVA followed by Tukey’s multiple comparison test. p values less than 0.05 were considered statistically significant and are denoted as follows: *<0.05. Data are represented as means ± SD.
Data Availability Statement
All software and code used in this study has been described and referenced under “Quantification and Statistical Analysis”.