

Abstract
The CYP3A4 enzyme is the most abundant drug-metabolizing enzyme in the liver, metabolizing ~50% of commonly used medications. CYP3A4 displays large inter-person variability in expression and enzyme activity with unknown causes. This study aims to identify cis-acting regulatory elements controlling the transcription of CYP3A4, using chromatin conformation capture (4C and 3C assays), chromatin immunoprecipitation followed by qPCR (ChIP-qPCR), CRISPR-mediated deletions of genomic regions and reporter gene assays in primary culture human hepatocytes and hepatic cell lines. 4C assays identified four regions (R1–R4) interacting with the CYP3A4 promoter, one of which overlaps with the previously identified upstream enhancers CLEM4/XREM (R2) while the other three are novel. ChIP-qPCR, reporter gene assays and CRISPR-mediated deletion experiments indicate regulatory roles for both R2 and R4. Interestingly, deletion of R4 increased CYP3A4 while decreasing CYP3A43 expression, possibly due to competitive domain-domain interactions within the CYP3A cluster, supported by deletion of R4 increasing interaction between the CYP3A4 promoter and R2. We also identified a SNP rs62471956 within R4, with the variant allele A having increased transcriptional activity in a reporter gene assay. The rs62471956 A allele is associated with higher CYP3A43 expression and lower CYP3A4 expression in a cohort of 136 liver samples, further supporting the opposing effects of R4 on CYP3A4 and CYP3A43. rs62471956 is in complete LD with CYP3A4*22, potentially contributing to reduced expression of CYP3A4*22. These results validate previously identified enhancers (CLEM4 and XREM) of CYP3A4 and demonstrate additional regulatory mechanisms underlying CYP3A4 transcriptional control via competitive domain-domain interactions within the CYP3A cluster.
Keywords: CYP3A4, cis-acting regulatory elements, gene expression
Introduction
The CYP3A4 enzyme is the most abundant among all drug-metabolizing enzymes in the liver [1,2], targeting 30–45% of commonly used drugs [3,4]. Large inter-person variability in both basal and induced CYP3A4 expression/activity [1,5] strongly influences optimal drug dosage, efficacy and toxicity [6,7], but the underlying causes remain largely unknown. Coding region variants of CYP3A4 are rare and cannot account for the observed variability in CYP3A4 enzyme activity. We have previously identified a common regulatory variant CYP3A4*22 (rs35599367) [6,8] which substantially reduces hepatic CYP3A4 activity in carriers and has been incorporated into biomarker panels. Yet, CYP3A4*22 can only account for part of the large population variability in CYP3A4 activity because of its low allele frequency (2–6%). Moreover, the expression of CYP3A4 is regulated by trans-acting transcription factors, for example, NR1I2, NR1I3, HNF4A, RXRA and PPARA [9–13], epigenetic factors [14] and non-genetic factors [15]. Although the DNA binding sites for some of the transcription factors were found upstream of CYP3A4 promoter [10,13]the cis-acting sequences required for CYP3A4 transcriptional regulation and their relationship with the other three CYP3A genes, CYP3A5, CYP3A7 and CYP3A43 within CYP3A cluster are still not completely understood.
Recent advances in functional genomic research have shed new light on the dynamic and complex architecture of gene expression. Genome wide analyses reveal a hierarchical order of genome organization, with linear genomic features (e.g. binding of transcription factors to DNA, histone modifications and gene expression) directing long-range interactions between promoter/enhancer regulatory regions in a multi-gene cluster, thereby shaping the organization of three-dimensional chromatin [16–20]. We propose that distal enhancer (or regulatory) regions regulate transcription of CYP3A4 and can interact with multiple regulatory regions in a competitive fashion. Previously, by searching nearby upstream regions (2–13kb) and using reporter gene assays, several transcription factor binding sites and two putative distal enhancers (> 6kb) have been identified upstream of CYP3A4 [10,21–23]. One enhancer is inducible by the pregnane X receptor (PXR/NR1I2) and named the xenobiotic-responsive enhancer module (XREM) [10], while another regulates constitutive CYP3A4 expression (the constitutive liver enhancer module 4, CLEM4) [21]. However, it is still unclear whether these previously identified distal enhancers regulate CYP3A4 in the native chromatin context of living cells/tissues, as reporter gene assays inherently disconnect regulatory elements from their target genes and may not reflect in vivo activity, as reported by us [24] and others [25,26]. Furthermore, it is unknown how these sites communicate with the CYP3A4 promoter, and whether other regions are also involved. The purpose of this study is to search for regulatory regions that interact with the CYP3A4 promoter using chromatin conformation capture combined with high throughput sequencing (4C assay). This was followed by ChIP-qPCR, reporter gene assays and CRISPR-mediated deletions of genomic sections to characterize the functions of these interacting regions. The results confirmed two previously identified enhancer regions involved in regulation of CYP3A4 and revealed a complex regulatory landscape occurring within CYP3A cluster.
Materials and Methods:
Human liver tissues were obtained from the Cooperative Human Tissue Network under approved IRB protocol (non-human, UF IRB201801313). Human primary hepatocytes were obtained from the Liver Tissue Cell Distribution System (LTCDS, Pittsburgh, PA). The demographic information of hepatocytes and liver tissues is shown in Supplemental Table 1.
Preparation of 4C template:
The 4C template for human primary hepatocytes was prepared as described [27]. Briefly, 10 million primary culture human hepatocytes (pool of Hep8 and Hep10) were treated with DMSO or rifampicin (Rif, 25 μM) for 18 hrs, and then were detached with trypsin to obtain a single cell suspension. Cells were then cross-linked with 2% formaldehyde for 10 min before lysis to release cell nuclei. Cell nuclei were digested with DpnII at 37°C overnight followed by proximity ligation with T4 ligase after a >20-fold dilution. After reverse cross-linking, the purified DNA was subjected to secondary digestion with NlaIII, followed again by proximity ligation in a diluted condition. The resulting DNA was purified by phenol/chloroform extraction.
PCR amplification of 4C template and Ion Torrent sequencing:
We used our modified protocol [28,29] for 4C template amplification followed by Ion Torrent sequencing. Inverse primers were designed as described [30]. PCR was performed over 25 cycles with inverse primers (Supplemental Table 2) specific to the CYP3A4 promoter using 25 ng 4C templates. A total of eight PCR reactions were performed and the PCR products were combined. We used 100 ng DNA for Ion Torrent library preparation using the NEB Next Fast DNA Library Preparation kit (New England BioLabs, Ipswich, MA, USA). After adaptor ligation, the DNA was purified with four columns of High Pure PCR Product Purification columns (Roche, Madison, WI, USA) to avoid adaptor dimer contamination. The adaptor-ligated library was PCR amplified for eight cycles followed by DNA purification with two columns of High Pure PCR Product Purification columns. The amplified library was diluted and subjected to emulsion PCR using an Ion OneTouch 2 instrument (Life Technology, Grant Island, NY, USA). The resulting library was sequenced on Ion Torrent PGM using the Ion PGM 200 Sequencing kit (Life Technology). The sequencing data was analyzed with CLC Genomics Workbench 4.8 (CLC bio, Denmark) as described [28]. We focused our analysis on chromosome 7 since our goal is to identify cisacting regulatory regions for CYP3A4. To identify robust interacting fragments, we selected only replicated signals from two independent experiments and focused on signals with >100 reads (two-fold genome-wide noise background).
Chromatin confirmation capture followed by qPCR (3C assays):
The 3C assays followed by quantitative PCR were performed as described [31]. Briefly, 10 million primary culture human hepatocytes (pool of Hep8 and Hep10) were detached with trypsin to obtain a single cell suspension. Cells were then cross-linked with 2% formaldehyde for 10 min before lysis to release cell nuclei. Cell nuclei were digested with DpnII at 37°C overnight followed by proximity ligation with T4 ligase after a >20-fold dilution. A total of 16 DpnII cutting sites surrounding target regions were assayed with TaqMan probes (Supplemental Table 2).
Chromatin immuno-precipitation (ChIP) assays:
ChIP was performed in primary human hepatocytes using the ChIP-IT Express Enzymatic kit (Active Motif, Carlsbad, CA, USA) with an anti-p300 antibody (Active Motif #61401) [28]. P300-enriched DNA fragments were measured with real-time PCR using SYBR Green and specific primers (Supplemental Table 2) and fold enrichment was calculated relative to a negative control prepared without the p300 antibody. Data sets are an average of five donors, each performed in triplicates.
Deletion of enhancer regions using CRISPR-mediated genome editing in Huh7 cells [28]:
A lentiviral-based single vector (LentiCRISPR V2) that simultaneously delivers Cas9, single guide RNA (sgRNA), and a puromycin selection marker engineered by the Zhang Laboratory [32] was purchased from Addgene (http://www.addgene.org/). Oligonucleotides (20 bp in length) corresponding to guide RNA sequence were designed using an online tool (tools.genomeengineering.org) (Supplemental Table 2). Two sets of gRNAs were designed for each target region and the best two pairs of gRNAs were used based on their cutting efficiency. We obtained at least 50% deletion efficiency of target regions with each gRNA pair (Supplemental Figure 1). Because the results from both pairs of gRNA were similar, the results from two sets of gRNAs were combined. Experimental details and analyses are published [28].
Quantitation of the total mRNA levels of CYP3A4, CYP3A43, and transcription factors:
Total CYP3A4, CYP3A43, PXR, RXR, CAR, PPARA and HNF4A mRNAs were measured using real time PCR with specific primers (Supplemental Table 2) and SYBR Green PCR master mix (Life Technologies) using β-actin as an internal control [28].
Genotyping:
SNP rs62471956 was genotyped using the OpenArray genotyping platform (probe# ANH6F7J, QuanStudio 12K Flex System) according to the manufacturer’s protocol (Life Technologies, California, USA).
Cell culture and transfection:
Primary hepatocytes were incubated for 24 hrs in serum-free William’s E media supplemented with penicillin/streptomycin/fungizone (100 U/100 μg/0.25 μg per ml), 100 nM dexamethasone, 2 mM L-glutamine, 15 mM HEPES, and ITS (0.55 mg/ml human transferrin, 1 mg/ml bovine insulin and 0.5 μg/ml sodium selenite, from Sigma). Cells were then used for 4C, 3C (Hep10 and Hep8) and ChIP (from all five donors). Huh7 and HepG2 cells were cultured at 37°C in a humidified incubator at 5% CO2 in DMEM supplemented with 10% fetal bovine serum, 100 U/ml penicillin, and 100 μg/ml streptomycin, and were used for CRISPR-mediated deletions and reporter gene assays, respectively.
Reporter gene assays:
Regulatory regions (R1, R2, R3, R4 and XREM, ~1kb) were PCR amplified and cloned into KpnI cloning site of the pGL3 basic vector, using the In-Fusion HD cloning kit (Takara Bio USA, California, USA) (see Supplemental Table 2 for primer information). R4 regions with different genotypes were generated by PCR amplification from gDNA with the corresponding genotypes. All constructs were sequenced to ensure fidelity. To avoid variability arising from colonized bacterial clones, the plasmids were re-transformed into DH5α competent cells, and for each construct, three clones were selected for plasmid DNA preparation. HepG2 cells were transfected with 1 μg plasmid DNA and luciferase activity measured 48 h later with Dual-Glo luciferase assay kits (Promega, Madison, WI, USA) on a Fusion Universal Microplate Analyzer (PerkinElmer Life and Analytical Science, Waltham, MA, USA). As an internal control, Renilla luciferase constructs (Promega #E2231) driven by a TK promoter were co-transfected with promoter constructs at a 1:5 ratio. To test the effect of Rifinduction on the XREM reporter gene, we co-transfected 1 μg XREM reporter gene (in pGL4.23 vector) with either 100 ng PXR or an empty pcDNA vector. Twenty-four hours posttransfection, cells were treated with Rif for 24 hrs before being harvested for luciferase measurement.
Data analysis:
Data are shown as mean ± SD. Statistical analyses were performed using Prism (GraphPad Software, San Diego, CA, USA).
Association between rs62471956 genotype and liver CYP3A4 and CYP3A43 gene expression:
A multiple linear regression model was used to test the associations between the rs62471956 genotypes and liver CYP3A4 and CYP3A43 gene expression using Minitab software, adjusting for covariates. The potential covariates screened include sex, race, age and the expression levels of transcription factors (PXR, CAR, RXR, HNF4A and PPARA) known to effect CYP3A expression. We used Mallows Cp value to select the best subset of predictors in the multiple linear regression models. For CYP3A4, sex and the expression levels of PXR, CAR and RXR were included as covariates, while for CYP3A43, sex, race and expression levels of PXR, CAR, RXR and HNF4A were included. Log transformed mRNA expression data of CYP3A4, CYP3A43, and all transcription factors followed a normal distribution.
Results:
4C assays identified regions interacting with the CYP3A4 promoter
We performed 4C-seq assays in human hepatocytes using the CYP3A4 promoter as an anchor, using the same methods as described previously for CYP2D6 and CYP7A1 [28,29]. This identified several clusters of interacting signals occurring within 150 kb both up- and down-stream of the CYP3A4 promoter (Figure 1). Some signals overlap with promoters of other nearby genes (ZSCAN25, CYP3A5, CYP3A7 and CYP3A43, labelled with a *), indicating promoter-promoter interactions. We have observed similar results previously when using CYP2D6 promoter as a bait [28]. Moreover, data from genome-wide studies also show frequent promoter-promoter interactions of nearby genes [17,18,33]. Treatment with the CYP3A4 inducer Rif yielded similar interaction patterns, with decreased or increased signals occurring at some regions (Figure 1a).
Figure 1.

Panel a. 4C assay signals anchored to the CYP3A4 promoter in human hepatocytes treated with inducer rifampin (Rif) or DMSO. The x axis represents relative distance from the CYP3A4 promoter. H3K4me1, histone H3 monomethylation at lysine 4; H3K27ac, histone H3 acetylation at lysine 27. *indicates 4C signal overlapping with promoter region of four genes. Panel b. Diagram of the genomic organization of CYP3A cluster and the location of R1–R4 regions. XREM, xenobiotic-responsive enhancer module.
It is well-characterized that post-translational modifications (PTMs) on the histones demark promoters and enhancers [34], for example, the PTMs H3K4me1 plus H3K27ac indicate active enhancers while the lone H3K4me1 PTM marks poised enhancers [35]. We therefore compared the 4C signals with H3K4me1 and H3K27ac ChIP-seq data [36] generated in human hepatocytes to identify putative regulatory regions (Figure 1). Four regions (R1, R2, R3 and R4) show co-localization of strong 4C signals with H3K4me1 and H3K27ac signals (within a ± 3kb window), suggesting that they are active enhancers. R1 is located between CYP3A5 and CYP3A7, within the CYP3AP1 locus, ~12kb upstream of CYP3A5 promoter and ~12kb downstream of the CYP3A7 gene (Figure 1b). R2 overlaps with the previously identified CLEM4 enhancer region located ~10kb upstream of CYP3A4 promoter and is close to XREM [10,21], while R3 and R4 are novel and located farther upstream of CYP3A4. The distance between R4 and CYP3A43 promoter is ~5 kb (Figure 1b).
Evaluating the regulatory activity of the 4C-interacting regions
To test the enhancer activities of the identified regions, we conducted chromatin immunoprecipitation followed by qPCR (ChIP-qPCR) targeting the universal enhancer-binding protein P300 in hepatocytes untreated or treated with Rif. As shown in Figure 2a, compared to the negative control (ChIP with IgG instead of the anti-P300 antibody), three regions (R1, R2 and R4) had over 10-fold enrichment of P300 binding regardless of Rif treatment, while the ChIP signal at R3 is low (Figure 2a). We also tested for P300 enrichment at the XREM region [10]. As expected, XREM showed low P300 enrichment in the absence of Rif (<10-fold), while the signal increased after Rif treatment (Figure 2a).
Figure 2.
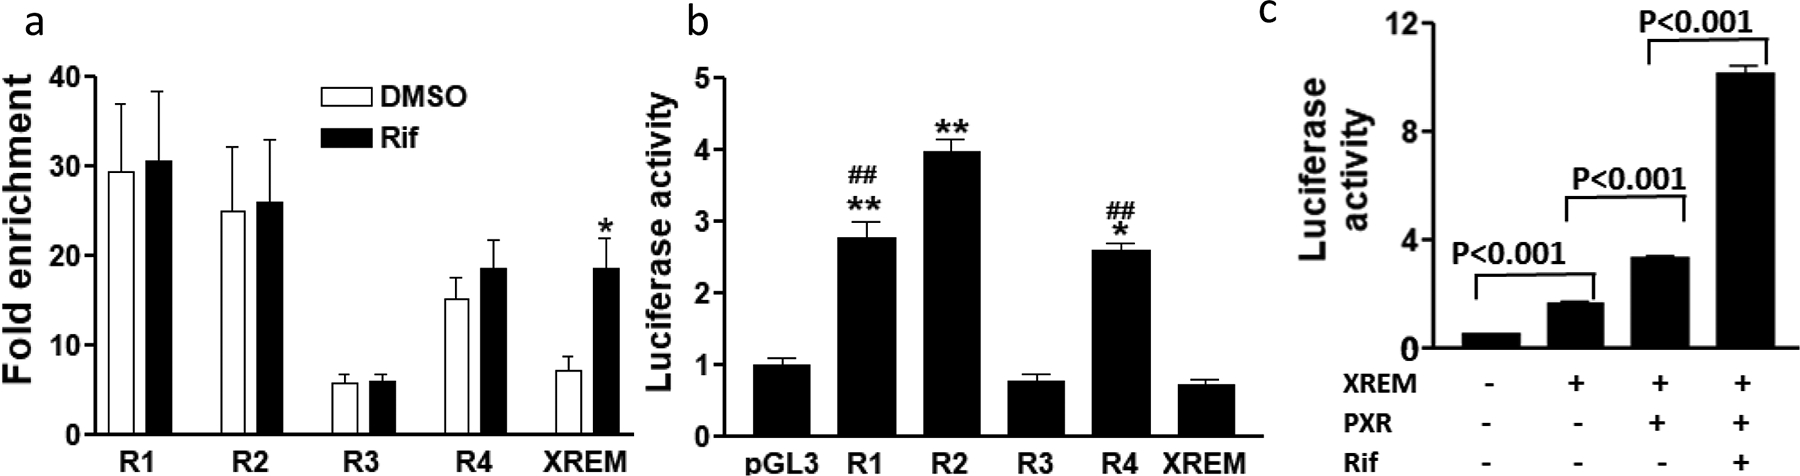
Panel a. ChIP-qPCR with p300 antibody in human hepatocytes treated with rifampin or DMSO. Mean ± SD, compared to DMSO, * p<0.05, student t-test. Panel b. Reporter gene assays showing luciferase activities of regulatory regions 48 hr post-transfection in HepG2 cells. Mean ± SD, compared to pGL3 empty vector, * p<0.05, ** p<0.01, one-way ANOVA with Dunnett post hoc test. Panel c. Reporter gene assays of XREM with or without PXR co-transfection and rifampin treatment (50 μM for 24hr) as indicated. Luciferase activities were measured 48 h post transfection. Mean ± SD, student t-test.
Next, we used reporter gene assays to test the transcriptional activity of these regions in HepG2 cells. R1, R2 and R4 increased transcription of the luciferase reporter with R2 having higher activity than R1 and R4 (Figure 2b). In contrast, R3 did not show transcriptional activity in the reporter gene assays (Figure 2b), consistent with the ChIP-qPCR results. As expected, the XREM control did not increase reporter gene activity in the absence of Rif. However, co-transfection with the XREM-binding PXR/NR1I2 and treatment with Rif (Figure 2b & 2c) led to increased luciferase activity in HepG2 cells, consistent with previous results [10]. Hence, our results validate the previously identified regulatory regions R2 (CLEM4) and XREM, and also support R1 and R4 as novel regulatory elements within the CYP3A cluster.
CRISPR-guided deletion of R1–R4 to test their regulatory effects on CYP3A4 expression
To test the roles of the R1–R4 regions on transcriptional control of CYP3A4, we used CRISPR-mediated deletions [28,29] and measured expression of CYP3A4 in Huh7 cells. As shown in Figure 3a, compared to the negative control (NC, gRNA without a human genome target, Supplemental Table 2), deletion of R2 reduced CYP3A4 expression, whereas deletion of R1 and R3 had no significant effect. Although deletion of XREM had no effect on basal CYP3A4 expression, it reduced induction of CYP3A4 by Rif treatment (fold induction 4.6±1.5 vs 1.3±0.4 for NC and XREM deletion, respectively) (Figure 3a & 3b), further supporting XREM as a PXR inducible enhancer for CYP3A4. Interestingly, deletion of R4 increased CYP3A4 expression, indicating R4 as a potential repressor for CYP3A4. Due to the proximity of R4 to the CYP3A43 promoter (~5kb upstream), we tested whether R4 may also regulate CYP3A43 expression. Indeed, deletion of R4 reduced the expression of CYP3A43 by 2-fold (48 ± 10% of NC, p<0.001), indicating that while R4 serves as a repressor for CYP3A4, it functions as an enhancer for CYP3A43.
Figure 3.

CYP3A4 mRNA expression in Huh7 cells after CRISPR deletion of regulatory regions, using two combinations of guide RNAs (gRNA)-Lenti-CRISPR and 5-d puromycin selection without (panel a) or with rifampin (Rif, 50 μM for 24hr) treatment (panel b). CYP3A4 mRNA levels were measured with real-time PCR with SYBR green and CYP3A4 specific primers (Supplemental Table 2). Mean ± SD, panel a, compared to negative control (NC, using gRNA without targeting human genome), ** p<0.01, one-way ANOVA with Dunnett post hoc test; panel b, compared to DMSO treatment, *** p<0.001, student t-test.
3C assays in Huh7 cells indicate alternate chromatin interactions after R4 deletion
To get a better understanding of how R4 may be repressing transcription of CYP3A4, we investigated changes to chromatin interactions between the CYP3A4 promoter and R1–R4 by performing 3C assays followed by real-time PCR. As expected, deletion of R4 reduced the crosslinking frequency between the CYP3A4 promoter and R4 (Figure 4). Moreover, deletion of R4 increased the interaction between the CYP3A4 promoter and the R1 and R2 regions (Figure 4), indicating that interaction of R1, R2 and R4 with the CYP3A4 promoter are competitive. As a control, we also performed 3C assays in cells with deletion of R1. As expected, R1 deletion reduced interaction between R1 and the CYP3A4 promoter, but in contrast to the R4 deletion, no changes occurred to interactions between the CYP3A4 promoter and other regions (Figure 4).
Figure 4.

Changes in the interaction frequencies between CYP3A4 promoter and regulatory regions in Huh7 cells with deletion of R4 or R1, revealed by 3C assays. Relative crosslinking frequencies between CYP3A4 promoter and selected 3–5 DpnII fragments within each regulatory region are shown. Mean ± SD, compared to control cells without deletion, *** p<0.001, student t-test.
A SNP in the R4 region alters expression of CYP3A4 and CYP3A43
Our results indicate that the R4 region plays a role in the regulation of both CYP3A4 and CYP3A43 and therefore genetic variants occurring within this region may affect expression of either, or both, of these loci. We tested a SNP rs62471956 that occurs within the R4 region for its potential effects on transcription. In reporter gene assays, the variant A allele of rs62471956 showed approximately 4-fold increased luciferase activity compared to the reference G allele (Figure 5a). Due to the observed opposing effects of R4 on gene expression (deletion of R4 reduced CYP3A43 expression and increased CYP3A4 expression), we tested the effect of the rs62471956 on both CYP3A4 and CYP3A43 expression in 136 human liver samples. The mRNA levels of CYP3A4 and CYP3A43 in the liver are significantly correlated (r=0.514, p<0.0001), consistent with CYP3A genes sharing a common trans-acting regulatory pathway [37]. Without adjusting for covariates, rs62471956 GA/AA carriers showed lower CYP3A4 expression (0.49-fold, P=0.080) and higher CYP3A43 expression (4.5-fold, P=0.003) than GG carriers. After adjusting for covariates (see method section for covariates selection), the associations remain with slight differences in significant levels: higher significance for CYP3A4 (0.38-fold, P=0.006) and less significance for CYP3A43 (3.11-fold, P=0.005) (Figure 5b & 5c). These results further support a role of the R4 region in its dual regulation of CYP3A4 and CYP3A43.
Figure 5.

Panel a. Reporter gene assays showing luciferase activities of R4 harboring either the reference (G) or variant (A) allele of rs62471956. Mean ± SD, compared to pGL3 vector, *p<0.05, ***p<0.001; compared to reference allele (Ref), ###p<0.001. Panel b & c. Adjusted mRNA levels of CYP3A4 (b) or CYP3A43 (c) in 136 human liver samples (log 10 scale) grouped by rs62471956 genotype. Statistical analyses were performed using a multiple linear regression model. Box and horizontal lines: 25th to 75th percentiles and mean; whiskers: minimum and maximum values.
Discussion
Using chromatin conformation capture (4C) followed by ChIP-qPCR, reporter gene assays and CRISPR-mediated deletion of genomic regions, we validated previously identified enhancer regions (R2 or CLEM4 and XREM) and identified an additional regulatory region (R4) regulating expression of CYP3A4 and CYP3A43. We showed an inhibitory effect of the R4-CYP3A43 interaction on the interactions between the CYP3A4 promoter and its enhancer R2. These inter-dependent domain-domain interactions result in gene expression changes within the CYP3A cluster. Specifically, we demonstrated that deletion of CYP3A43 enhancer R4 reduced CYP3A43 expression while simultaneously increasing interactions between the CYP3A4 promoter and the R2 region. The R2 region appears to be an active enhancer for CYP3A4, and its increased contact at the CYP3A4 promoter results in increased CYP3A4 expression. Consistent with these findings, the SNP rs62571956 in the R4 region simultaneously increases CYP3A43 expression in human liver samples while decreasing CYP3A4 expression, possibly by stabilizing interaction between R4-CYP3A43 and potentially R4-CYP3A4, thereby creating a spatial constrain that prevents R2CYP3A4 interaction. Our results indicate inter-dependent domain-domain interactions occurring within the CYP3A cluster and reveal a complex regulatory landscape at the CYP3A genes.
Chromatin conformation capture combined with high throughput sequencing (4C) identified four regions (R1–R4) that physically interact with CYP3A4 promoter in human hepatocytes. Except for R3, all these regions (R1, R2 and R4) also showed co-localization with the universal enhancer-binding protein P300 and increased transcription in reporter gene assays, suggesting that these regions have a regulatory role. R2 overlaps with a previously reported CYP3A4 enhancer (CLEM4) located ~10kb upstream of CYP3A4 promoter. Deletion of R2 reduced CYP3A4 expression, supporting that R2 serves as a key enhancer controlling the constitutive expression of CYP3A4, consistent with previous results [21]. Previous studies also identified a PXR-inducible enhancer XREM located ~7kp upstream of CYP3A4 promoter. Because of the short distance between XREM and CLEM4, we were not able to clearly separate these regions in our 4C data. However, we did observe 4C signal at R2 that extends to XREM region. Similarly, ChIP-qPCR, reporter gene assays and CRISPR-mediated XREM deletion experiments support XREM as a PXR inducible enhancer of CYP3A4, as reported [10]. Thus, our results validate previously identified enhancers, CLEM4 and XREM, controlling both constitutive and PXR-induced CYP3A4 expression, respectively.
Although R1 showed enhancer activity in ChIP-qPCR and reporter gene assays, CRISPR-mediated deletion of R1 did not change CYP3A4 expression, suggesting that R1 does not regulate CYP3A4 expression in Huh7 cells. Compared to other regions, it appears that the efficiency of the R1 deletion is lower (~50% vs >80%) (Supplemental Figure 1), with a concomitant 50% reduction in R1-CYP3A4 interactions (Figure 4). Thus, it is unlikely that R1 deletion fails to change CYP3A4 expression due to low deletion efficiency. However, we cannot rule out the possibility that differences in cellular context (e.g. trans-acting factors or epigenetic modifications) between Huh7 cells and hepatocytes may reduce R1 effects at CYP3A4, because Huh7 cells express CYP3A4 at much lower levels than hepatocytes. Whether R1 regulates the expression of other genes, including the additional three CYP3A genes in the same cluster requires further characterization.
The observation that deletion of R3 did not change CYP3A4 expression is consistent with our results showing no enhancer activity of R3 in ChIP-qPCR and reporter gene assays. Interestingly, deletion of R4 showed opposing effects on CYP3A4 and CYP3A43, increasing and decreasing expression, respectively. This promoting effect at CYP3A43 is supported by our ChIP-qPCR and reporter gene assays showing the enhancer activity of R4, however, how R4 simultaneously represses CYP3A4 expression remains unclear. Shown in Figure 6, it is plausible that R2 and R4 competitively interact with CYP3A4, with R2 being the primary CYP3A4 enhancer due to it having higher binding affinity and transcriptional activity than R4. This is supported by R2 having higher transcriptional activity than R4 in reporter gene assays (Figure 2b). Interaction between CYP3A4 and R4 may create a spatial constrain that inhibits interaction between CYP3A4 with R2, explaining the increased R2-CYP3A4 interaction and CYP3A4 expression after deletion of R4 (Figure 6b). Switching of domain-domain interactions among shared regulatory regions has been reported to alter gene expression patterns at the globin gene cluster [39,40]. Our results indicate that this additional regulatory mechanism may also underlie regulation of gene expression in the CYP3A cluster.
Figure 6.

Schematic diagram of the competitive interactions between R2 and R4 with the CYP3A4 promoter and changes in gene expression under different conditions: typical conformation (a), R4 deletion (b) and in the presence of the rs62471956 A allele (c). The thickness of the lines indicate the strength of the interactions, arrows located next to CYP3A4 and CYP3A43 indicate increased (upward) or decreased (downward) gene expression compared to the normal condition..
Consistent with deletion of R4, the SNP rs62571956 within the R4 region also showed opposing effects on the expression of CYP3A4 and CYP3A43, with the variant allele A increasing CYP3A43 expression while decreasing CYP3A4 expression. The variant A allele showed higher transcription of the luciferase reporter gene, suggesting that the A allele has increased affinity for transcription factor binding. Because interactions between promoters and enhancers are mediated by transcription factor binding [41], it is likely that the A allele increases the binding affinity of R4 to the CYP3A43 or CYP3A4 promoters via altered transcription factor binding at rs62571956. This increased R4-CYP3A43 interaction enhances CYP3A43 expression as expected. Contrarily, increased R4-CYP3A4 interaction reduces interaction between CYP3A4 and the R2 region due to spatial constraints (i.e. R2 is being “looped out”), thereby decreasing CYP3A4 expression (Figure 6c). While a detailed molecular mechanism underlying the dual effects of R4 on CYP3A4 and CYP3A43 expression remains to be further elucidated, our results indicate that a complex gene regulatory landscape exists within the CYP3A cluster, where inter-dependent and competitive domain-domain interactions regulate CYP3A gene expression. The results suggest the importance of studying the CYP3A cluster as an entire unit instead of as independent genes.
It should be noted that the SNP rs62471956 is in complete linkage disequilibrium (LD) with CYP3A4*22 in all reported 1000 genome populations. We have previously demonstrated that the *22 variant T allele reduced total CYP3A4 RNA expression by promoting alternative RNA splicing [6,8]. The rs62471956 variant A allele showed reduced transcription of CYP3A4 in this study and may also contribute to the reduced mRNA level associated with CYP3A4*22 variant T allele. Conversely, the reduced CYP3A4 expression associated with rs62471956 shown in this study may be caused by its linkage disequilibrium with CYP3A4*22. Further studies using CRISPR-mediated genome editing to study the effect of rs62471956 on CYP3A4 transcription in live cells are therefore warranted.
In addition to CYP3A4*22, rs62471956 is in high LD with two intronic SNPs of CYP3A43 rs62471957 (R2=0.9) and rs62474460 (R2=0.82) in all populations. ENCODE data (HaploReg v4.1) suggests that rs62471956, but not rs62471957 or rs62474460, is inside an enhancer region demarked by H3K4me1 and H3K27ac in adult livers, and that the variant A allele of rs62471956 is predicted to increase binding affinity of seven transcription factors (AP-1, E2F, Gfi1, Msx2, NF-Y, Pbx3 and RFX5). This is consistent with our experimental results showing increased enhancer activity of the rs62471956 variant A allele in reporter gene assays (Figure 5a), and supporting that the observed association between rs62471956 and CYP3A43 expression is caused by rs62471956 itself and not by the other two SNPs in LD. Further studies are needed to characterize transcription factor binding at this site and to fully understand how the binding is affected by rs62471956.
A more comprehensive domain-domain interaction map within the CYP3A cluster will provide further insight into regulation of gene expression in this locus, which is an ongoing project in our laboratory. Moreover, the clinical significance of the opposing effects of the single SNP rs62471956 on the expression of CYP3A4 and CYP3A43 remains to be further investigated.
In summary, we have validated two previously identified enhancer regions as main regulatory elements for both basal and PXR-induced CYP3A4 expression. Furthermore, we have demonstrated additional cis-regulatory domains and potential mechanisms underlying regulation of gene expression within the CYP3A cluster. The information gained in this study may serve as a guide to dissect genetic, epigenetic and non-genetic factors affecting CYP3A gene expression.
Supplementary Material
Acknowledgements
Liver samples were provided by the Cooperative Human Tissue Network, which is funded by the National Cancer Institute. Human hepatocytes were provided by the Liver Tissue Cell Distribution System (Pittsburgh, PA), which is funded by NIH contract No. HHSN276201200017C. LentiCRISPR was provided by Dr. Feng Zhang (Broad Institute, Cambridge, MA, USA); pCMVVSV-G was provided by Dr. Bob Weinburg (Whitehead Institute for Biomedical Research, Cambridge, MA, USA) and psPAX2 was provided by Dr. Didier Trono (Ecole Polytechnique Federale de Lausanne, Switzerland).
Funding:
This work was supported by National Institute of Health (R01 GM120396 to DW). The content is solely the responsibility of the authors and does not necessarily represent the official views of the National Institutes of Health.
Abbreviations:
- 3C
chromatin conformation capture
- 4C
chromatin conformation capture combined with high throughput sequencing
- ChIP
chromatin immunoprecipitation
- CRISPR
clustered regularly interspaced short palindromic repeats
- XREM
xenobiotic-responsive enhancer module
- CLEM4
constitutive liver enhancer module 4
- Rif
rifampin
- SNP
single nucleotide polymorphism
- PTMs
post-translational modifications
- PXR
pregnane X receptor
- CAR
constitutive androstane receptor or nuclear receptor NR1I3
- RXR
retinoid X receptor
- HNF4A
hepatocyte nuclear factor 4 alpha
Footnotes
Conflict of interest statement: Authors declare no conflict of interests.
References:
- 1.Achour B, Barber J, Rostami-Hodjegan A. Expression of hepatic drug-metabolizing cytochrome p450 enzymes and their intercorrelations: a meta-analysis. Drug Metab Dispos. 2014; 42 (8):1349–1356. [DOI] [PubMed] [Google Scholar]
- 2.Paine MF, Hart HL, Ludington SS, Haining RL, Rettie AE, Zeldin DC. The human intestinal cytochrome P450 “pie”. Drug Metab Dispos. 2006; 34 (5):880–886. [DOI] [PMC free article] [PubMed] [Google Scholar]
- 3.Yamazaki H, Guo Z, Persmark M, Mimura M, Inoue K, Guengerich FP, et al. Bufuralol hydroxylation by cytochrome P450 2D6 and 1A2 enzymes in human liver microsomes. Mol Pharmacol. 1994; 46 (3):568–577. [PubMed] [Google Scholar]
- 4.McKinnon RA, Burgess WM, Hall PM, Roberts-Thomson SJ, Gonzalez FJ, McManus ME. Characterisation of CYP3A gene subfamily expression in human gastrointestinal tissues. Gut. 1995; 36 (2):259–267. [DOI] [PMC free article] [PubMed] [Google Scholar]
- 5.Rahmioglu N, Heaton J, Clement G, Gill R, Surdulescu G, Zlobecka K, et al. Genetic epidemiology of induced CYP3A4 activity. Pharmacogenet Genomics. 2011; 21 (10):642–651. [DOI] [PubMed] [Google Scholar]
- 6.Wang D, Guo Y, Wrighton SA, Cooke GE, Sadee W. Intronic polymorphism in CYP3A4 affects hepatic expression and response to statin drugs. Pharmacogenomics J. 2011; 11 (4):274286. [DOI] [PMC free article] [PubMed] [Google Scholar]
- 7.Werk AN, Cascorbi I. Functional gene variants of CYP3A4. Clin Pharmacol Ther. 2014; 96 (3):340–348. [DOI] [PubMed] [Google Scholar]
- 8.Wang D, Sadee W. CYP3A4 intronic SNP rs35599367 (CYP3A4*22) alters RNA splicing. Pharmacogenet Genomics. 2016; 26 (1):40–43. [DOI] [PMC free article] [PubMed] [Google Scholar]
- 9.Willson TM, Kliewer SA. PXR, CAR and drug metabolism. Nat Rev Drug Discov. 2002; 1 (4):259–266. [DOI] [PubMed] [Google Scholar]
- 10.Goodwin B, Hodgson E, Liddle C. The orphan human pregnane X receptor mediates the transcriptional activation of CYP3A4 by rifampicin through a distal enhancer module. Mol Pharmacol. 1999; 56 (6):1329–1339. [DOI] [PubMed] [Google Scholar]
- 11.Goodwin B, Hodgson E, D’Costa DJ, Robertson GR, Liddle C. Transcriptional regulation of the human CYP3A4 gene by the constitutive androstane receptor. Mol Pharmacol. 2002; 62 (2):359–365. [DOI] [PubMed] [Google Scholar]
- 12.Tirona RG, Lee W, Leake BF, Lan LB, Cline CB, Lamba V, et al. The orphan nuclear receptor HNF4alpha determines PXR- and CAR-mediated xenobiotic induction of CYP3A4. Nat Med. 2003; 9 (2):220–224. [DOI] [PubMed] [Google Scholar]
- 13.Thomas M, Burk O, Klumpp B, Kandel BA, Damm G, Weiss TS, et al. Direct transcriptional regulation of human hepatic cytochrome P450 3A4 (CYP3A4) by peroxisome proliferatoractivated receptor alpha (PPARα). Mol Pharmacol. 2013; 83 (3):709–718. [DOI] [PubMed] [Google Scholar]
- 14.Kacevska M, Ivanov M, Wyss A, Kasela S, Milani L, Rane A, et al. DNA methylation dynamics in the hepatic CYP3A4 gene promoter. Biochimie. 2012; 94 (11):2338–2344. [DOI] [PubMed] [Google Scholar]
- 15.Papageorgiou I, Grepper S, Unadkat JD. Induction of hepatic CYP3A enzymes by pregnancy-related hormones: studies in human hepatocytes and hepatic cell lines. Drug Metab Dispos. 2013; 41 (2):281–290. [DOI] [PubMed] [Google Scholar]
- 16.Bonora G, Plath K, Denholtz M. A mechanistic link between gene regulation and genome architecture in mammalian development. Curr Opin Genet Dev. 2014; 27:92–101. [DOI] [PMC free article] [PubMed] [Google Scholar]
- 17.Sanyal A, Lajoie BR, Jain G, Dekker J. The long-range interaction landscape of gene promoters. Nature. 2012; 489 (7414):109–113. [DOI] [PMC free article] [PubMed] [Google Scholar]
- 18.Zhang Y, Wong CH, Birnbaum RY, Li G, Favaro R, Ngan CY, et al. Chromatin connectivity maps reveal dynamic promoter-enhancer long-range associations. Nature. 2013; 504 (7479):306310. [DOI] [PMC free article] [PubMed] [Google Scholar]
- 19.Heidari N, Phanstiel DH, He C, Grubert F, Jahanbani F, Kasowski M, et al. Genome-wide map of regulatory interactions in the human genome. Genome Res. 2014; 24 (12):1905–1917. [DOI] [PMC free article] [PubMed] [Google Scholar]
- 20.Li G, Ruan X, Auerbach RK, Sandhu KS, Zheng M, Wang P, et al. Extensive promotercentered chromatin interactions provide a topological basis for transcription regulation. Cell. 2012; 148 (1–2):84–98. [DOI] [PMC free article] [PubMed] [Google Scholar]
- 21.Matsumura K, Saito T, Takahashi Y, Ozeki T, Kiyotani K, Fujieda M, et al. Identification of a novel polymorphic enhancer of the human CYP3A4 gene. Mol Pharmacol. 2004; 65 (2):326334. [DOI] [PubMed] [Google Scholar]
- 22.Martinez-Jimenez CP, Jover R, Donato MT, Castell JV, Gomez-Lechon MJ. Transcriptional regulation and expression of CYP3A4 in hepatocytes. Curr Drug Metab. 2007; 8 (2):185–194. [DOI] [PubMed] [Google Scholar]
- 23.Tegude H, Schnabel A, Zanger UM, Klein K, Eichelbaum M, Burk O. Molecular mechanism of basal CYP3A4 regulation by hepatocyte nuclear factor 4alpha: evidence for direct regulation in the intestine. Drug Metab Dispos. 2007; 35 (6):946–954. [DOI] [PubMed] [Google Scholar]
- 24.Wang D, Chen H, Momary KM, Cavallari LH, Johnson JA, Sadee W. Regulatory polymorphism in vitamin K epoxide reductase complex subunit 1 (VKORC1) affects gene expression and warfarin dose requirement. Blood. 2008; 112 (4):1013–1021. [DOI] [PMC free article] [PubMed] [Google Scholar]
- 25.Bu Y, Gelman IH. v-Src-mediated down-regulation of SSeCKS metastasis suppressor gene promoter by the recruitment of HDAC1 into a USF1-Sp1-Sp3 complex. J Biol Chem. 2007; 282 (37):26725–26739. [DOI] [PubMed] [Google Scholar]
- 26.Kato M, Zhang J, Wang M, Lanting L, Yuan H, Rossi JJ, et al. MicroRNA-192 in diabetic kidney glomeruli and its function in TGF-beta-induced collagen expression via inhibition of Ebox repressors. Proc Natl Acad Sci U S A. 2007; 104 (9):3432–3437. [DOI] [PMC free article] [PubMed] [Google Scholar]
- 27.Simonis M, Kooren J, de Laat W. An evaluation of 3C-based methods to capture DNA interactions. Nat Methods. 2007; 4 (11):895–901. [DOI] [PubMed] [Google Scholar]
- 28.Wang D, Papp AC, Sun X. Functional characterization of CYP2D6 enhancer polymorphisms. Hum Mol Genet. 2015; 24 (6):1556–1562. [DOI] [PMC free article] [PubMed] [Google Scholar]
- 29.Wang D, Hartmann K, Seweryn M, Sadee W. Interactions Between Regulatory Variants in CYP7A1 (Cholesterol 7α-Hydroxylase) Promoter and Enhancer Regions Regulate CYP7A1 Expression. Circ Genom Precis Med. 2018; 11 (10):e002082. [DOI] [PMC free article] [PubMed] [Google Scholar]
- 30.van de Werken HJ, Landan G, Holwerda SJ, Hoichman M, Klous P, Chachik R, et al. Robust 4C-seq data analysis to screen for regulatory DNA interactions. Nat Methods. 2012; 9 (10):969972. [DOI] [PubMed] [Google Scholar]
- 31.Hagège H, Klous P, Braem C, Splinter E, Dekker J, Cathala G, et al. Quantitative analysis of chromosome conformation capture assays (3C-qPCR). Nat Protoc. 2007; 2 (7):1722–1733. [DOI] [PubMed] [Google Scholar]
- 32.Shalem O, Sanjana NE, Hartenian E, Shi X, Scott DA, Mikkelson T, et al. Genome-scale CRISPR-Cas9 knockout screening in human cells. Science. 2014; 343 (6166):84–87. [DOI] [PMC free article] [PubMed] [Google Scholar]
- 33.Grubert F, Zaugg JB, Kasowski M, Ursu O, Spacek DV, Martin AR, et al. Genetic Control of Chromatin States in Humans Involves Local and Distal Chromosomal Interactions. Cell. 2015; 162 (5):1051–1065. [DOI] [PMC free article] [PubMed] [Google Scholar]
- 34.Ernst J, Kheradpour P, Mikkelsen TS, Shoresh N, Ward LD, Epstein CB, et al. Mapping and analysis of chromatin state dynamics in nine human cell types. Nature. 2011; 473 (7345):43–49. [DOI] [PMC free article] [PubMed] [Google Scholar]
- 35.Creyghton MP, Cheng AW, Welstead GG, Kooistra T, Carey BW, Steine EJ, et al. Histone H3K27ac separates active from poised enhancers and predicts developmental state. Proc Natl Acad Sci U S A. 2010; 107 (50):21931–21936. [DOI] [PMC free article] [PubMed] [Google Scholar]
- 36.Smith RP, Eckalbar WL, Morrissey KM, Luizon MR, Hoffmann TJ, Sun X, et al. Genome-wide discovery of drug-dependent human liver regulatory elements. PLoS Genet. 2014; 10 (10):e1004648. [DOI] [PMC free article] [PubMed] [Google Scholar]
- 37.Lin YS, Dowling AL, Quigley SD, Farin FM, Zhang J, Lamba J, et al. Co-regulation of CYP3A4 and CYP3A5 and contribution to hepatic and intestinal midazolam metabolism. Mol Pharmacol. 2002; 62 (1):162–172. [DOI] [PubMed] [Google Scholar]
- 38.Zanger UM, Schwab M. Cytochrome P450 enzymes in drug metabolism: regulation of gene expression, enzyme activities, and impact of genetic variation. Pharmacol Ther. 2013; 138 (1):103–141. [DOI] [PubMed] [Google Scholar]
- 39.Lower KM, Hughes JR, De Gobbi M, Henderson S, Viprakasit V, Fisher C, et al. Adventitious changes in long-range gene expression caused by polymorphic structural variation and promoter competition. Proc Natl Acad Sci U S A. 2009; 106 (51):21771–21776. [DOI] [PMC free article] [PubMed] [Google Scholar]
- 40.Choi OR, Engel JD. Developmental regulation of beta-globin gene switching. Cell. 1988; 55 (1):17–26. [DOI] [PubMed] [Google Scholar]
- 41.Palstra RJ, Grosveld F. Transcription factor binding at enhancers: shaping a genomic regulatory landscape in flux. Front Genet. 2012; 3:195. [DOI] [PMC free article] [PubMed] [Google Scholar]
Associated Data
This section collects any data citations, data availability statements, or supplementary materials included in this article.