

Abstract
The use of fluorescence techniques has an enormous impact on various research fields including imaging, biochemical assays, DNA‐sequencing and medical technologies. This has been facilitated by the development of numerous commercial dyes with optimized photophysical and chemical properties. Often, however, information about the chemical structures of dyes and the attached linkers used for bioconjugation remain a well‐kept secret. This can lead to problems for research applications where knowledge of the dye structure is necessary to predict or understand (unwanted) dye‐target interactions, or to establish structural models of the dye‐target complex. Using a combination of optical spectroscopy, mass spectrometry, NMR spectroscopy and molecular dynamics simulations, we here investigate the molecular structures and spectroscopic properties of dyes from the Alexa Fluor (Alexa Fluor 555 and 647) and AF series (AF555, AF647, AFD647). Based on available data and published structures of the AF and Cy dyes, we propose a structure for Alexa Fluor 555 and refine that of AF555. We also resolve conflicting reports on the linker composition of Alexa Fluor 647 maleimide. We also conducted a comprehensive comparison between Alexa Fluor and AF dyes by continuous‐wave absorption and emission spectroscopy, quantum yield determination, fluorescence lifetime and anisotropy spectroscopy of free and protein‐attached dyes. All these data support the idea that Alexa Fluor and AF dyes have a cyanine core and are a derivative of Cy3 and Cy5. In addition, we compared Alexa Fluor 555 and Alexa Fluor 647 to their structural homologs AF555 and AF(D)647 in single‐molecule FRET applications. Both pairs showed excellent performance in solution‐based smFRET experiments using alternating laser excitation. Minor differences in apparent dye‐protein interactions were investigated by molecular dynamics simulations. Our findings clearly demonstrate that the AF‐fluorophores are an attractive alternative to Alexa‐ and Cy‐dyes in smFRET studies or other fluorescence applications.
Keywords: biolabeling, organic fluorophores, Alexa dyes, Förster resonance energy transfer, fluorescence spectroscopy
Molecular properties of dyes from the Alexa Fluor and AF series are investigated. Based on mass spectrometry, NMR and optical spectroscopy refined structures for Alexa Fluor 555, AF555, Alexa Fluor 647 and AF647 are proposed. The dyes also show excellent performance in solution‐based smFRET experiments. Minor differences in apparent dye‐protein interactions were investigated by time‐resolved spectroscopy and molecular dynamics simulations. The findings establish the AF‐fluorophores as an attractive alternative to Alexa‐ and Cy‐dyes for fluorescence applications.
1. Introduction
The exploitation of fluorescence techniques has impacted various research fields and specific applications such as optical imaging, biochemical assays, DNA‐sequencing, and medical technologies. The molecular contrast agents, i. e., the light absorbing and emitting molecules used, and their properties govern the success of these applications (for instance in PCR‐based amplification of disease‐related genomes[1]) and the information depth of state‐of‐the‐art techniques in specialized research fields such as single‐molecule[2] and super‐resolution microscopy.[3, 4, 5, 6, 7, 8, 9] Whereas fluorescent proteins are more frequently used in live‐cell applications, in most other settings, where high photostability and tailored functional properties are required,[2, 10] synthetic organic fluorophores dominate.
The common molecular scaffolds of modern synthetic organic fluorophores are fluoresceins, rhodamines, carbon‐ and silicon‐pyronines, rylenes, bodipys, and cyanines.[10] They all feature intense absorption and emission in the visible spectrum.[10] Years of structural optimization has resulted in commercially available compounds with favorable photophysical properties and reactive linkers for flexible bioconjugation. The general structural design of such commercial fluorophores aims at high absorbance cross sections, high fluorescence quantum yields, and low rates for internal conversion and intersystem crossing e. g., achieved by the exclusion of heavy atoms to reduce the latter (see e. g., ref. [2] and references cited therein). In addition, self‐healing,[11, 12, 13, 14, 15, 16] self‐blinking,[17] and photoactivatable dyes,[18] fluorescent sensors for ions[19] and pH etc. have become (commercially) available. Small‐molecule additives[20, 21, 22, 23, 24, 25] are frequently used as intermolecular reaction partners for dyes to either improve their performance by reduction of photodamage by triplet‐states,[9] oxygen[9, 26] and other reactive fluorophore species, or to achieve photoswitching.[8, 27]
The increasing availability of dyes from commercial sources has been a boon to research and medicine. Companies, however, have often not been forthcoming with information on the chemical structures of the dyes (and their linkers), which has been an obstacle for some applications. Prominent examples are the nucleic acids stains of the SYBR family (SYBR Green, SYBR Gold),[28, 29] the Alexa Fluor dye series (Alexa Fluor 555),[30] and the ATTO dye family (ATTO643). A few structures from these suppliers have recently been made available (SYBR Green,[31] ATTO647 N,[32] ATTO655[33]). There are many applications where knowledge of the chemical structure of a dye is not compulsary, e. g., when using Alexa Fluor 555 in imaging[34, 35, 36, 37, 38, 39, 40, 41, 42] and spectroscopic studies.[43, 44, 45, 46] However, Alexa Fluor 555 and Alexa Fluor 647 are dyes that are frequently and successfully used for single‐molecule FRET in combination with other fluorophores,[47, 48, 49, 50, 51] or as a donor‐acceptor pair.[52, 53, 54, 55, 56, 57] They have become a popular choice because of their favorable performance in many assays, and this is largely due to their high solubility in water and the absence of strong (unwanted) interactions between dye and target after bioconjugation.
For Alexa Fluor 647, the chemical structure is known, but there are conflicting reports in the literature on the linker length connecting the two sulfonated SO3 − groups (both 3‐carbon[48, 58, 59] or 4‐carbon atoms[60, 61, 62, 63, 64] have been reported), as well as the structure of the maleimide‐linker connecting the chromophore to a biological target.[61, 65] For Alexa Fluor 555, on the other hand, there is no verified information on its fluorophore class or molecular structure. Fluorescent lifetimes were found to be similar to Cy3[16] suggesting that Alexa Fluor 555 might have a cyanine core.[58] Also chemical structures were proposed, but never verified experimentally.[63, 66, 67, 68] The lack of unequivocal structural data for all these fluorophores limits their proper use for FRET‐restrained structural modelling, and in situations where an understanding of dye‐target interactions is important,[69] such as in molecular dynamics simulations.[57, 63, 70]
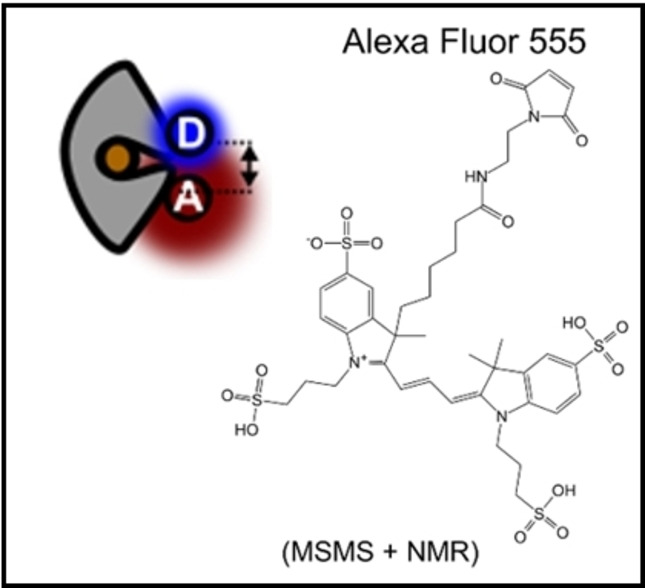
We have here studied the molecular and spectroscopic properties of Alexa Fluor 555 and Alexa Fluor 647 in relation to other cyanine fluorophores with known molecular structures (Cy3, sulfo‐Cy3, AF555, Cy5, sulfo‐Cy5, AF(D)647, Figure 1).
Figure 1.

Confirmed chemical structures of cyanine fluorophores from the Cy‐, Alexa Fluor and the AF‐series. For Cy3, Cy5, Sulfo‐Cy3, Sulfo‐Cy5 all structures were obtained from the literature.[60, 61, 65] The structures of AF555 and Alexa Fluor 555 were determined by NMR and mass spectrometry in this manuscript. For AF647, AFD647 and Alexa Fluor 647, we confirmed the published structures (AF(D)647 in,[71] Alexa Fluor 647 structure in [58]) by mass spectrometry. Please note that the AF‐fluorophore homologues of Cy5 are available in two distinct versions called AFD647 (n=1) and AF647 (n=2).
Using a combination of visible spectroscopy, mass spectrometry and NMR spectroscopy, we show that Alexa Fluor 555 has a cyanine‐based fluorophore core identical to Cy3. Based on the available data, we propose the structure of Alexa Fluor 555 closely related to Cy3 (Figure 1). We further identified inconsistencies between NMR data and the proposed structure of AF555, which presumably had an incorrect assignment of the locations of alkylsulfonate sidechains. We thus present a refined structure of AF555 that is compatible with our NMR data (Figure 1). We finally clarified the precise molecular structure of commercial Alexa Fluor 647 maleimide to settle contradicting reports on its linker composition. Using a combination of spectroscopic techniques including continuous‐wave absorption and emission spectroscopy, quantum yield determination, fluorescence lifetime and anisotropy spectroscopy of free and protein‐attached dyes, we finally compared Alexa Fluor 555 and Alexa Fluor 647 to their structural homologs Cy3/AF555 and Cy5/AF(D)647 in single‐molecule FRET applications. Based on the high similarity of the molecular and spectroscopic parameters presented in this manuscript, we explored and characterized the performance of donor‐acceptor pairs AF555‐AFD647 for smFRET in direct comparison to Alexa Fluor 555‐Alexa Fluor 647. Both dye pairs showed good performance in solution‐based smFRET experiments using alternating laser excitation. Subtle differences in protein‐dye interactions in spectroscopic experiments were further investigated with molecular dynamics simulations. In summary our study suggests that the AF‐fluorophores are an attractive alternative to Alexa‐ and Cy‐dyes for smFRET studies but also other fluorescence applications.
Material and Methods
Sample Preparation and Labelling of Proteins
MalE single and double cysteine variants were obtained and fluorophore‐labelled as described previously.[72, 73] The cysteine positions for fluorophore attachment were chosen based on the open and closed x‐ray crystal structures of MalE (1OMP, 1ANF, respectively). The double cysteine variants were (i) stochastically labelled with the maleimide derivative of the dyes Alexa Fluor 555 and Alexa Fluor 647 (ThermoFischer Scientific, A20346 & A20347), and AF555, AFD647 & AF647 (Jena Bioscience, APC‐007, APC‐009 and APC‐009) for smFRET experiments. (ii) Corresponding single cysteine variants were labelled with one fluorophore as indicated. His‐tagged proteins were incubated in buffer containing 1 mM DTT to keep all cysteine residues in a reduced state. Subsequently proteins were immobilized on a Ni Sepharose 6 Fast Flow resin (GE Healthcare). The resin was incubated 2–4 h at 4 °C with 25 nmol of each fluorophore dissolved in labelling buffer 1 (50 mM Tris‐HCl pH 7.4–8.0, 50 mM KCl, 5 % glycerol) and subsequently washed sequentially with 1 CV labelling buffer 1 and 2 (50 mM Tris‐HCl pH 7.4–8.0, 50 mM KCl, 50 % glycerol) to remove unbound fluorophores. Bound proteins were eluted with 500 μl of elution buffer (50 mM Tris‐HCl pH 8, 50 mM KCl, 5 % glycerol, 500 mM imidazole) The labelled protein was further purified by size‐exclusion chromatography (ÄKTA pure, Superdex 75 Increase 10/300 GL, GE Healthcare) to remove remaining fluorophores and aggregates. For all proteins, the labelling efficiency was higher than 80 % for each labelling site (Supplementary Figure S1).
Sample Handling for Quantum‐yield, Time‐resolved Anisotropy, and Single‐Molecule FRET Measurements
The labelled MalE proteins were stored in 50 mM Tris‐HCl pH 7.4, 50 mM KCl with 1 mg/ml bovine serum albumin (BSA) at 4 °C for less than seven days. The samples were stored at protein concentrations between 100–500 nM and diluted for the measurements indicated as described below.
Single‐Molecule FRET Measurements and Data Analysis
ALEX experiments were carried out by diluting the labelled proteins to concentrations of ≈50 pM in 50 mM Tris‐HCl pH 7.4, 50 mM KCl supplemented with the ligand maltose as described in the text and figures. Before each experiment, the coverslip was passivated for 5 minutes with a 1 mg/ml BSA solution in PBS buffer. The measurements were performed without photostabilizer, which showed little effects on the resulting data quality (Supplementary Figure S2), which is in contrast to the pair Cy3B/ATTO647 N used previously for amino‐acid binding proteins[53, 73, 74] and ribosome recycling factor ABCE1[75] where the addition of TX/MEA had a significant positive impact.
Data acquisition and correction procedures were performed for confocal measurements similar to the procedure as described by Hellenkamp et al.[48] Solution based smFRET experiments were performed on a homebuilt confocal ALEX microscope as described in.[76] All samples were studied using a 100 μl droplet of imaging buffer (50 mM Tris‐HCl pH 7.4–8.0, 50 mM KCl) on a coverslip. The donor molecules were excited by a diode laser at 532 nm (OBIS 532‐100‐LS, Coherent, USA) operated at 60 μW power. The acceptor molecules were excited by a diode laser at 640 nm (OBIS 640‐100‐LX, Coherent, USA) operated at 25 μW power. Both lasers were alternated at 20 kHz frequency, combined and coupled into a polarization maintaining single‐mode fiber (P3‐488PM‐FC‐2, Thorlabs, USA). The laser light was guided into an epi‐illuminated confocal microscope (Olympus IX71, Hamburg, Germany) by a dual‐edge beamsplitter ZT532/640rpc (Chroma/AHF, Germany) and focused to a diffraction‐limited excitation spot by a water immersion objective (UPlanSApo 60x/1.2w, Olympus Hamburg, Germany). The emitted fluorescence was collected through the same objective, spatially filtered using a pinhole with 50 μm diameter and spectrally split into donor and acceptor channel by a single‐edge dichroic mirror H643 LPXR (AHF). Fluorescence emission was filtered (donor: BrightLine HC 582/75 (Semrock/AHF), acceptor: Longpass 647 LP Edge Basic (Semroch/AHF)) and focused onto avalanche photodiodes (SPCM‐AQRH‐64, Excelitas). The detector outputs were recorded by a NI‐Card (PCI‐6602, National Instruments, USA).
Data analysis was performed using a home written software package as described in.[73] Single‐molecule events were identified using an all‐photon‐burst‐search algorithm with a threshold of 15, a time window of 500 μs and a minimum total photon number of 150.[77] E‐histograms of double‐labelled FRET species with Alexa555 and Alexa647 were extracted by selecting 0.25<S<0.75. E‐histograms of the open state without ligand (apo) and closed state with saturation of the ligand (holo) were fitted with a Gaussian distribution .
Visible Absorption and Fluorescence Spectroscopy
Absorbance measurements were performed in buffer (50 mM Tris‐HCl pH 7.4, 50 mM KCl) on a continuous‐wave UV/VIS spectrometer (LAMBDA 465, Perkin Elmer). Absorbance spectra were recorded at a maximum absorbance of ∼0.4 and base‐line corrected to remove background.
Fluorescence emission was recorded in buffer (50 mM Tris‐HCl pH 7.4, 50 mM KCl) on a fluorescence spectrometer (LS 55, Perkin Elmer) with excitation/emission slit width of 5 nm and gain values set to 775 V (PMT R928, Hamamatsu). The spectra were corrected for wavelength‐dependent detection efficiencies.
For data representation and Förster radius calculation, the mean of three repeats of absorbance and emission spectra was calculated and normalized.
Quantum Yield Measurements
For quantum yield measurements, three dilution series at five different concentrations were recorded in absorbance and emission. The absorbance value at the excitation wavelength was averaged over the interval 510±2.5 nm for green and 610±2.5 nm for red fluorophores. The integrated fluorescence was calculated according to . The respective absorbance values at 510 nm (green fluorophore) and 610 nm (red fluorophore) were fitted to the function , where the factor accounts for the absorption of the excitation light of the emission spectra measurements. The fit returns the initial slopes ( for the fluorophore under investigation and for a reference fluorophore with known quantum yield). The fluorescence quantum yield of the fluorophores is calculated from the slopes and as
| (1) |
where we used the literature values for Rhodamine 6G[78] (green fluorophores) and for Alexa Fluor 647[79] (red fluorophores) as reference. The reported values and standard deviations result from three independent experiments.
Förster Radius Calculation
The Förster radius R0 was calculated according to
| (2) |
with the following values set to theoretical or literature values: orientation factor : 2/3, averaged refractive index n: 1.33 in buffer/1.4 for protein (according to ref. [80]) and the extinction coefficient at maximum : 270 000 1/(M cm) (ref. [79, 81]). All other parameters were derived from absorption/emission spectra and quantum yield measurements as described above.
Time‐correlated Single‐Photon Counting for Lifetime and Anisotropy Determination
Bulk lifetime and polarization decay measurements were performed using on a homebuilt setup (Supplementary Figure S3a) as also described in ref. [82] (Chapter 11): 400 μl of sample was measured in a 1.5×10 mm cuvette at a concentration of around 100 nM. The samples were excited by a pulsed laser (LDH‐P‐FA‐530B for green fluorophores/LDH‐D‐C‐640 for red fluorophores with PDL 828 “Sepia II” controller, Picoquant, GER). Excitation polarization was set with a lambda‐half‐waveplate (ACWP‐450‐650‐10‐2‐R12 AR/AR, Laser Components) and a linear polarizer (glass polarizer #54‐926, Edmund Optics). Emission light was polarization filtered (wire grid polarizer #34‐315, Edmund Optics). The emission light was collected with a lens (AC254‐100‐A, Thorlabs) and scattering light or Raman contributions were blocked with filters (green: 532 LP Edge Basic & 596/83 BrightLine HC, AHF; red: 635 LP Edge Basic & 685/80 ET Bandpass, AHF). The signal was recorded with an avalanche‐photo‐diode (SPCM‐AQRH‐34, Excelitas) and a TCSPC module (HydraHarp400, Picoquant). Polarization optics were mounted in homebuilt, 3D‐printed rotation mounts and the APD was protected from light with a 3D‐printed shutter unit. An additional neutral density filter with OD=4 in combination with a flip‐mirror was used to guide the laser directly into the detection path for the measurement of the instrument response function.
In a typical experiment, the excitation power was set to 10 μW at a repetition rate of 20 MHz. The sample concentration was always tuned to obtain a ∼50 kHz photon count rate. For anisotropy and lifetime measurements, data sets were recorded for each polarization setting for 5 min in the order vertical (VV1), horizontal (VH1), magic angle (MA), horizontal (VH2), and vertical polarization (VV2) under vertical excitation. The anisotropy was calculated based on the sum of two vertical and horizontal measurements to compensate for small drifts in laser power or slow changes in fluorophore concentration due to sticking. With and , we obtained the anisotropy decay as , where is the correction factor obtained by measuring with horizontal excitation ( and is the total signal in the vertical or horizontal channel, respectively).[82]
The IRF was approximated as a sum of (up to) 3 Gaussians convoluted with a fast exponential decay, which fitted and reproduced the IRF in our setup:
| (3) |
The times of the Gaussian‐exponential convolutes for are defined as relative time shifts with respect to in order to enable that the instrument response function can be shifted with one single time parameter . Please note that the choice for this function was due to the possibility to analytically convolute the IRF with exponential decays. Alternatively, other functions could be used to describe the IRF, e. g., a sum of gamma distribution, with the same benefit. Alternatively, well‐established numerical re‐convolution fits could have been performed.[82, 83] For our system, however, the fits were more robust with respect to small IRF mismatches with the described analytical approach.
The parameters were derived from a fit of ( ) to the measured instrument response function (Supplementary Figure S3b). The lifetime decays were fitted as convolution of the background‐free IRF with a single (N=1) or double exponential decay (N=2), were the fitted IRF parameter were fixed, except of to compensate for small shifts due to heating/cooling effects (Supplementary Figure S3c/e).
| (4) |
The polarization intensities read as
| (5) |
| (6) |
(see also ref. [84, 85]) where the parameters , , , and are fixed. The calculated anisotropy was fitted with the model , where the inverse rotational correlation time and the intrinsic anisotropy are the only free parameter (Supplementary Figure S3d/f). All fits were performed as least square fits with weighted residuals according to Poissonian photon statistics.
Mass Spectrometry
For mass spectrometric analysis fluorophore standards were run on an ultra‐high‐performance liquid chromatographic (UHPLC) system including a diode array detector (DAD; Dionex Ultimate 3000 UHPLC, Thermo Fisher Scientific, Waltham, USA) coupled to a timsTOF MS (Bruker Daltonik, Bremen, Germany). Five microliter of each fluorophore sample was injected and separated using a C8 reversed phase column (Ultra C8, 3 μm, 2.1×100 mm, Restek GmbH, Bad Homburg, Germany) with 300 μl flow per minute at 60 °C. Solvents were water (A) and a mixture (70/30 v/v) of acetonitrile and isopropanol (B), both containing 1 % ammonium acetate and 0.1 % acetic acid. The gradient started with 1 min at 55 % B followed by a slow ramp to 99 % B and a fast ramp within 14 min. This was kept constant for 7 min and returned to 55 % B with additional 4 min of re‐equilibration.
Using the DAD the absorption spectra of 190–800 nm were recorded. In parallel mass spectra were acquired by otofControl 4.0 in negative MSMS mode from 100–1300 m/z mass range. The most important parameters are set as followed: capillary voltage 4000 V, nebulizer pressure 1.8 bar, nitrogen dry gas 8 l min−1 at 200 °C, collision energy 70 eV, Collision RD 800 Vpp (volt peak to peak). The evaluation was performed by Data Analysis 4.5 and MetaboScape 4.0. All software tools were provided by Bruker (Bruker Daltonik, Bremen, Germany).
NMR Spectroscopy
The maleimide derivatives of the dyes Alexa Fluor 555 (ThermoFischer Scientific, A20346, 5*1 mg) and AF555 (Jena Bioscience, APC‐007, 2*5 mg) were dissolved in 0.6 mL DMSO‐d6 (99.96 % 2H, Eurisotope, St‐Aubin, France). NMR spectra were acquired at 298 K on different NMR spectrometers (Avance III/III HD, Bruker Rheinstetten; 1H frequenc 500/600/800/950 MHz, mostly equipped with helium‐cooled HCN‐frequency inverse triple‐resonance cryoprobes) using the Topspin3.5pl7 software package (Bruker, Rheinstetten). In addition to 1D 1H and 13C spectra, various 2D spectra were acquired to achieve the complete signal assignment and structure elucidation of both compounds (2D DQF‐COSY, 2D TOCSY, 2D long‐range COSY, 2D NOESY, 2D ROESY, 1H,13C‐DEPT, 1H,13C‐HSQC, 1H,13C‐HMBC, 1H,15N‐HSQC, 1H, 15N‐HMBC). DOSY diffusion spectra were used to identify impurities in the samples. 13C chemical shifts were also simulated with the help of the nmrdb.org website[86] and compared to the experimentally assigned values in Table S3.
The exact positions of the alkylsulfonate sidechains and the maleimide linker in Alexa Fluor 555 and AF555 were established from 1H, 13C‐HMBC long‐range correlations between their CH2 groups and the signals of the cyanine core. The connectivities were further confirmed by observation of the expected NOE correlations between sidechain and cyanine protons. While the assignment allowed us to propose one unique structure for Alexa Fluor 555, we found that for AF555 both the HMBC and NOESY correlations were in disagreement with the previously published structure and suggested an alternative sidechain arrangement as shown below.
Molecular Dynamics Simulations
Molecular dynamics (MD) simulations of mutants A186C and S352C of the E. coli maltose binding protein (PDB ID 1OMP[87]), each labelled with either AF555 or Alexa Fluor at the mutated site, were performed using the GROMACS MD simulation engine.[88] The initial structures of the fluorophore‐labelled proteins were built in PyMOL.[89] The fluorophore was initially oriented away from the protein. For the protein, the amber99sb[90] force‐field description was used. Fluorophore parameters were obtained as follows. The fluorophore was cut off including the linking cysteine residue and the cysteine termini were capped with an N‐methyl amide group at the C‐terminus and an acetyl group at the N‐terminus. The AM1 method[91] in the AMBER antechamber package[92] was used to optimize the geometries and determine partial charges for the two dye structures, as well as to determine atom types based on the gaff force field.[93] The resulting partial charges are very similar in equivalent functional groups in the two dyes (Supplementary Figure S4). The partial charges assigned to the sulphonate groups SO3 − were found to be similar to other existing dye parameterizations[94] (Supplementary Table S1, Supplementary Figure S4/5). If available, covalent interaction terms were taken from the AMBER‐DYES force field.[61] Missing terms were taken from the gaff‐based antechamber parameterization.
The fluorophore‐labelled proteins were solvated in cubic computational water boxes of edge length 9.5–10.2 nm. The TIP3P water model[95] was used. A neutralizing amount of sodium counterions was added to the solvent. The systems were energy‐minimized using the steepest descent algorithm. Position restraints with a force constant of 1000 kJ mol nm−2 were put on all solute heavy atoms and the system was simulated for 100 ps at constant volume and a temperature of 100 K. Throughout, the Berendsen thermostat[96] with a coupling time of 0.1 ps was used for temperature control. In a second and third equilibration step, the system was simulated with reduced (force constant 500 kJ mol nm−2) and vanishing position restraints, respectively, at temperatures of 200 and 300 K, respectively, for 100 ps. In a final equilibration step of 100 ps length, pressure control was introduced via the Berendsen barostat[96] using a target pressure of 1 bar, a coupling time of 1.0 ps and an isothermal compressibility of 4.5 ⋅ 10−5 bar−1. For all MD simulations, a time step of 0.002 ps was used, bond lengths were kept constant with the LINCS algorithm,[97] van der Waals interactions were described with the Lennard‐Jones potential[98] and a cutoff of 1.4 nm and electrostatic interactions were described with the reaction‐field method,[99] a cutoff of 1.4 nm and a dielectric constant of 80. Coordinates were written to file every 6 ps.
For each of the four equilibrated systems, four long production runs at 300 K and 1 bar, differing in the set of initial velocities assigned from the Maxwell‐Boltzmann distribution, of 200 ns length were performed. From these simulations, the minimum distances between the SO3 − sulfur atoms and any protein heavy atom were determined. Distinct fluorophore‐dependent behavior concerning the terminal SO3 − in the indole ring attached to the protein linker was detected which is why a set of 19–21 configurations were sampled from the compiled 800 ns simulations per fluorophore‐protein system such that these configurations reflect the 800 ns‐simulation data in terms of the probability distribution of minimum distances between the terminal SO3 − in the indole ring attached to the protein linker and any protein heavy atom (Supplementary Figure S6). These structures were used as initial structures in multiple short simulations (20 ns) to calculate the rotational anisotropy decay,
| (7) |
where P 2(x)=(3x 2−1)/2 is the second Legendre polynomial and μ(t) is the transition dipole moment vector at time t and the averaging denoted by angular brackets is done over time origins.[100, 101]
2. Results
2.1. Spectroscopic Characterization of Alexa and AF Dyes
We started our investigation of Alexa Fluor 555 and Alexa Fluor 647 properties by a comparison of absorbance and fluorescence spectra and the determination of spectroscopic parameters such as fluorescence lifetime and anisotropy against well‐characterized green dyes such as Cy3, sulfo‐Cy3, AF555 (cyanines), and Alexa546 (rhodamine). For comparison of Alexa Fluor 647, we selected Cy5, sulfo‐Cy5, AF647 (cyanines) and ATTO647 N (carbopyronine); data see Figure 2.
Figure 2.

Spectroscopic characterization of bulk solutions of free green and red cyanine fluorophores. (a) Absorbance and emission spectra of Alexa Fluor 555 and AF555 in comparison to Cy3, Sulfo‐Cy3 and Alexa Fluor 546 (left) show red‐shifted spectra for increased number of SO3 ‐ groups and difference in spectral shape compared to the rhodamine‐derivative Alexa Fluor 546. Absorbance and emission spectra of Alexa Fluor 647, AFD647 and AF647 in comparison to Cy5, Sulfo‐Cy5 and Atto647 N (left) show red‐shifted spectra for increased number of SO3 ‐ groups with small difference in spectral shape compared to Atto647 N. (b) Lifetime (left) and time‐resolved anisotropy measurements (right) of free Fluor Alexa 555 (lighter green) and AF555 (darker green) at 100 nM concentration. (c) Lifetime (left) and time‐resolved anisotropy measurements (right) of free Fluor Alexa 647 (lighter red) and AFD647 (darker red) at 100 nM concentration. (d) Integrated intensity versus absorbance at 510 nm at five different concentrations (squares) for Alexa Fluor 555 (top) and AF555 (bottom) with absorbance‐corrected curve fit (solid line, see methods). (e) Integrated intensity versus absorbance at 610 nm at five different concentrations (squares) for Alexa Fluor 647 (top) and AF647 (bottom) with absorbance‐corrected curve fit as in (c).
By inspection of normalized spectra of the green‐absorbing dyes in both absorption and emission (Figure 2a), we see a clear bathochromic shift when SO3 − groups are attached to the Cy3‐core structure (Cy3→sulfo‐Cy3→AF555). All dyes show three vibronic peaks, e. g., for Cy3 at 540 nm, 510 nm and 475 nm, which are also seen for sulfo‐Cy3, AF555 and Alexa Fluor 555, yet at higher wavelengths. The spectra of Alexa Fluor 555 and AF555 are almost indistinguishable. These spectral characteristics of the cyanine dyes can be distinguished from e. g., rhodamine dyes such as Alexa Fluor 546 which shows absorption and emission in a similar spectral window, but with different ratios of the vibronic levels.[102]
Additional indication for a cyanine fluorophore‐core in Alexa Fluor 555 is provided by fluorescence lifetimes experiments and relative quantum yields in comparison to AF555 (Table 1). Both the lifetime decays of Alexa Fluor 555 and AF555 and the relative quantum yields are highly similar. Any observed discrepancy was likely due to different background levels in fluorescence experiments. A reconvolution fitting procedure revealed similar lifetimes of 0.35±0.05 ns and 0.33±0.04 ns for Alexa Fluor 555 and AF555, respectively, in agreement with literature values for free Alexa Fluor 555 of 0.3 ns.[30] Time‐resolved anisotropy decays also revealed comparable anisotropy decays of Alexa Fluor 555 and AF555 with steady‐state anisotropies of 0.20±0.01. Rotational decay times and errors based on fit uncertainties were found for Alexa Fluor 555 of 0.40±0.04 ns and 0.45±0.04 ns for AF555. All this is in agreement with previously determined steady‐state anisotropy values of ∼0.19 for Alexa Fluor 555.[18]
Table 1.
Photophysical and chemical parameters of Alexa Fluor 555/647 and AF555/AF(D)647.
|
Label |
Extinction coefficient [1/(M*cm)] |
Quantum yield |
Lifetime [ns] |
Chemical formula |
Molar weight [u] |
|---|---|---|---|---|---|
|
Alexa Fluor 555 – C2 Maleimide |
155.000[79][a] |
0.1[79] 0.09(m) |
0.3[79] 0.35(m) |
C40H50N4O15S4 (m) |
955.10(m) |
|
AF555 Maleimide |
0.09(m) |
0.34(m) |
C41H52N4O15S4 [105,106](m) |
969.12[105,106](m) |
|
|
Alexa Fluor 647 – C2 Maleimide |
270.000[79][b] |
0.33[79] |
1.0[79] 1.12(m) |
C42H52N4O15S4 (m) |
981.14(m) |
|
AFD647 Maleimide |
270.000(p) |
0.33(m*) |
1.1(m) |
C42H52N4O15S4 (m) |
981.14(m) |
|
AF647 Maleimide |
– |
1.08(m) |
C43H54N4O15S4 [71,81](m) |
995.16[71,81](m) |
[a] other reported values of 150.000[107] and 158.000[108] can be found on manufacturer page. [b] other reported values of 239.000[107] and 265.000[109] can be found on manufacturer page. (m) determined in this manuscript. (m*) determined in this manuscript in reference to Alexa Fluor 647. (p) Jena Bioscience, personal communication, Mai 6, 2020.
Similar systematic trends can be observed for Alexa Fluor 647, AF(D)647 in comparison to Cy5 and sulfo‐Cy5 related to spectral shifts and variation of oscillator strength of vibronic transitions (Figure 2b). Also, the lifetime analysis of Alexa Fluor 647 and AFD647 and AF647 showed similar decays. A reconvolution fitting procedure revealed fluorescence lifetimes of 1.12±0.04 ns, 1.10±0.04 ns, and 1.08±0.05 ns for Alexa Fluor 647, AFD647 and AF647, respectively, all in agreement with literature values reported for Alexa Fluor 647 of 1.0 ns.[30] Time‐resolved anisotropy decays revealed comparable anisotropy decays of Alexa Fluor 647 and AFD647, and AF647 with steady‐state anisotropies of 0.13±0.01 for all three fluorophores, in agreement with published values of 0.16 for Alexa Fluor 647.[18] The rotational decay time was determined to be 0.58±0.06 ns, 0.54±0.04 ns, and 0.52±0.07 ns for Alexa Fluor 647, AFD647, and AF647, respectively. The differences in rotational correlation times were not significant for the green fluorophores (Alexa Fluor 555, AF555) and red fluorophores (Alexa Fluor 647, AFD647, and AF647).
We observed, however, a clear difference between the green fluorophores ( ) and the red fluorophores ( ), which is in good agreement with reported values for Cy3 of 0.33 ns[103] or 0.38 ns[104] and 0.54 ns for Cy5.[103] The difference can be explained by the larger size of the red fluorophores and the corresponding hydrodynamic radii (Stokes radii) of 0.75 nm and 0.82 nm, respectively (according to Stokes‐Einstein‐Debye equation under the assumption of a sphere with , where is the viscosity, the sphere volume, and the thermal energy). Quantum yields of Alexa Fluor 647 and AFD647 were also found to be similar.
Overall, our spectroscopic observations support the idea that all Alexa Fluor and AF‐fluorophores studied here contain a cyanine fluorophore‐core (Figure 1/2, Table 1).
2.2. Molecular Characterization of Alexa and AF Dyes
To verify the molecular structure of Alexa Fluor 555 and Alexa Fluor 647, we first performed mass spectrometry experiments. For these we used the AF dyes as calibration standards, since the structures of both AF555 and AF647 were available on the supplier webpages. With this approach we determined the molecular mass of the maleimide‐derivatives of the fluorophores (Table 1) and identified characteristic molecular fragments in the MSMS spectrum based on the available structures of AF555 and AF647 (see methods). Alexa Fluor 555 maleimide showed a total mass of 955.10 m/z (C40H50N4O15S4), which is smaller than AF555 (969.12 m/z; C41H52N4O15S4) by the mass of exactly one methylene‐fragment (∼14 m/z); Figure 3. For Alexa Fluor 647, we found a mass of 979.21 m/z (C42H50N4O15S4) and 993.23m/z (C43H52N4O15S4) for AF647; both findings are consistent with the published structure of AF647 and the idea that Alexa Fluor 647 contains two sulfonated propyl‐groups and the standard maleimide 5‐carbon linker which is also used for various cyanine fluorophores including Cy3, Cy5 and its sulfonated versions (see also NMR); Figure 4.
Figure 3.

Mass spectrometry‐based structure elucidation. Fragmentation mass spectra of the different fluorophores (a) Alexa Fluor 555 and (b) AF555. Mass range was set to 200–1050 m/z. Mass accuracy was 0.23±0.09 ppm. Each fragmentation spectrum includes the predicted or confirmed structure. Dashed lines represent fragmentation events with resulting fragment masses or empirical formulas. M, molecular ion. Red crosses indicate fragment masses that could not be assigned, green ticks for mass fragments that are compatible with the proposed molecular structures.
Figure 4.

Mass spectrometry‐based structure elucidation. Fragmentation mass spectra of the different fluorophores (a) Alexa Fluor 647, (b) AFD647, and (c) AF647. Mass range was set to 200–1050 m/z. Mass accuracy was 0.23±0.09 ppm. Each fragmentation spectrum includes the predicted or confirmed structure. Dashed lines represent fragmentation events with resulting fragment masses or empirical formulas. M, molecular ion. Red crosses indicate fragment masses that could not be assigned, green ticks for mass fragments that are compatible with the proposed molecular structures.
To verify the proposed structural differences, we studied the fragmentation patterns of all fluorophores (Figure 3/4 and Supplementary Table S2). Alexa Fluor 555, Alexa Fluor 647 and AFD647 showed a richer fragmentation pattern in comparison to AF555 and AF647. Surprisingly, the mass spectrum for AFD647 was indistinguishable from Alexa Fluor 647, which we also verified by independent repeats of the experiments with different batches of the dyes. This high similarity raised doubts about structural differences between both compounds, since much smaller structural variations (between AF647 and AFD647) had a bigger impact on the observed spectra (Figure 4).
Most dye maleimides showed loss of small fragments with ∼80 m/z (sulfonate group) and/or ∼123 m/z (sulfonated propyl group); Figure 3 and 4. The presence of the standard pentenyl maleimide linker used for various cyanine fluorophores was verified as loss of ∼237 m/z (pentenyl maleimide linker) for Alexa Fluor 647 and AFD647 (Figure 4) or seen as part of a larger ∼566 m/z fragment for Alexa Fluor 555 (Figure 3). Importantly, for both AF555 and AF647, we could verify that these two dyes show an additional ∼137 m/z mass loss related to a sulfonated butyl group, which is not present in the other dyes (Figure 3 and 4). Based on the mass spectrometry data, we were able to restrict the pool of potential structures for Alexa Fluor 555 to two isomers, where the maleimide linker and the sulfonate‐groups are placed at opposing sites of the fluorophore core (see below). For Alexa Fluor 647, we could verify the structure shown in Figure 4.
For univocal determination of the Alexa Fluor 555 structure, we next performed NMR. 2D correlation NMR spectra allowed to reconstruct the molecular structure of both Alexa Fluor 555 and AF555 via a complete assignment of all 1H, 13C and 15N NMR signals. The positions of the alkylsulfonate sidechains and the maleimide linker were then established from 1H, 13C‐HMBC long‐range correlations between CH2 groups and signals of the cyanine core. The connectivity was confirmed by observation of NOE correlations between sidechain and cyanine protons (Figure 5a).
Figure 5.

Structure determination of Alexa Fluor 555 via NMR. (a) Based on mass spectrometry we were able to propose two possible Alexa Fluor 555 structures, from which the left structure was confirmed by NMR spectroscopy. (b) Region from the 1H,13C‐HMBC spectrum showing long range correlation via two or three bonds, proving that the H10 and H31 protons are close to C2, and H21 to C2′ (indicated by blue arrows in the structures in panel (a)). From the characteristic 1H chemical shifts, it also becomes clear that both alkyl sulfonate sidechains are connected to a nitrogen atom (H10 & H21 at 4.2–4.3 ppm), unlike the maleimide sidechain (H31 at 2.1–2.4 ppm), which rules out the alternative structure for Alexa Fluor 555. In addition, 1H,1H though space correlations from NOESY spectra are in complete agreement with the confirmed structure (green arrows), but are widely incompatible with the alternative structure (red arrows).
For Alexa Fluor 555, 1H−13C long‐range correlations to C2 observed in a 2D HMBC NMR spectrum indicate that the two side chains C10 ff and C31 ff are linked to the same indole moiety (a, correlations indicated by curved lines). However, the clearly distinct chemical shifts of the H10 signals (4.25/4.29 ppm) vs. the H31 signals (2.10/2.35 ppm) suggest that C10 must be bound to the nitrogen (similar to C21), and C31 to the aliphatic carbon atom, which rules out the discarded structure. The structure is further confirmed by typical through‐space correlations observed in NOESY spectra (green lines). Figure 5 and additional data (Supplementary Table S3, Supplementary Figure S7/S8) thus confirms the Alexa Fluor 555 structure (Figure 5a, confirmed) and discards an isomeric version (Figure 5a, discarded).
Since we benchmarked the Alexa Fluor 555 data against AF555, we also came to note inconsistencies in the NMR data set of AF555 and the structure that was available from the supplier (Figure 6). For AF555 both the HMBC and NOESY correlations were inconsistent with the structure available from the supplier (Figure 6a, discarded), but our data suggested an alternative sidechain different arrangement as shown in Figure 6a (refined).
Figure 6.

Structural analysis of AF555 by NMR. (a) Confirmed and refined structure of AF555 (left) and previously published structure (right, discarded). (b) Region from the 1H,13C‐HMBC spectrum containing long‐range correlations via two or three bonds. The cross‐peaks clearly show that both alkyl‐sulfonate sidechains (with their terminal CH2 groups H10 and H21) are linked to the same half of the cyanine core (C2′), while the maleimide sidechain is connected to the other half (correlation between H31 and C2). These correlations are depicted by the blue (possible) and red (impossible) arrows in the structures (a). In addition, experimentally observed through‐space correlations from NOESY spectra further confirm this side‐chain arrangement (green lines, thickness correlates with intensity).
The NMR data clearly show that both alkylsulfonate sidechains are linked to the same half of the cyanine core: curved lines indicate 1H,13C long‐range correlations observed in HMBC spectra (Figure 6). However, in both possible assignment schemes (broken or solid set), impossible correlations are visible that contradict the previously published structure of AF555 (red lines; Figure 6a, discarded). In the proposed refined structure, all experimentally observed HMBC correlations correlate with the sidechain arrangement. In addition, through‐space correlations from NOESY spectra (green lines, thickness correlates with intensity) are also in agreement with this sidechain pattern (Figure 6a/b). Full NMR data sets for AF555 are available in the supporting information (Supplementary Table S3, Supplementary Figure S7/S8).
2.3. Alexa and AF Dyes for Protein Labelling
Next, we compared the performance of fluorophores from the Alexa Fluor and AF series for different applications in protein biophysics. The major goal was to use the different dyes for smFRET assays. We selected the periplasmic maltose binding protein (MalE) as a model system (Figure 7a). MalE is part of the ATP binding cassette transporter MalFGK2 of E. coli.[110, 111, 112] For our studies, we created both single‐ and double‐cysteine variants of MalE (Figure 7a) that allow fluorophore labelling via maleimide chemistry at strategic positions. These protein variants were (stochastically) labeled with fluorophores AF555, Alexa Fluor 555, AF(D)647 and Alexa Fluor 647. The selected residues allowed us to create three distance pairs in MalE to monitor ligand‐induced structural changes of MalE by maltose. Two of the variants visualized conformational motion (36‐352, 87‐186) and show inverse effects for addition of maltose, i. e., increase or decrease of inter‐residue distances (Figure 7b/c). We further had one MalE variant that served as a negative control, where no ligand‐induced conformational change was expected (85‐352); Figure 7c. The functionality of all variants was verified by microscale thermophoresis experiments which showed the expected change of tryptophane fluorescence upon ligand addition. This allowed us to calculate the ligand affinity for maltose, which we found to be in the low micromolar range (Figure S9) as found for wildtype MalE.[53, 110]
Figure 7.

smFRET measurement comparison of Alexa Fluor 555 – Alexa Fluor 647 and AF555 – AFD647: (a) Overlayed crystal structures of MalE in apo state (gray, PDB 1omp) and holo state (green, PDB 1anf). Residues 4–103 are aligned and labeled residues are marked with spheres (PyMol). The FRET pairs 36–352, 87–186, and 85–352 are indicated with lines for apo (solid) and holo state (dashed). (b) Representative FRET efficiency vs. stoichiometry plots (ES‐plots) for MalE variant 87–186 labeled with Alexa Fluor 555/Alexa Fluor 647 (left) and AF555/AFD647 (right) to show data quality and ratio of double labeled donor‐acceptor pairs. (c) FRET efficiency histograms (uncorrected, raw FRET values) for the three FRET variants labeled with the Alexa Fluor and AF pair are fitted with a Gaussian fit function with mean μE and sE of the fit. The distributions show similar FRET efficiency values for all variants in apo state (top) and holo state with 1 mM maltose (bottom). Please note that (a) shows the apo and holo conformation of the protein with insufficient detail to see that MalE85‐352 has no change of inter‐dye distance upon maltose binding.
To define the dynamic range of FRET‐assays using AF‐dyes, we determined the Förster radii (R0) for different dye combinations based on our data. We calculated R0 to be 49±1 Å for Alexa Fluor 555‐Alexa Fluor 647 and 50±1 Å for AF555‐AFD647 in buffer with a refractive index of n=1.33. For labeled proteins,[80] the refractive index is often assumed to be an average of n=1.40, decreasing the Förster radii R0 to 47±1 Å for the Alexa‐ and 48±1 Å for the AF‐pair. Both determined values are in good agreement with reported values of R0 for Alexa Fluor 555 and Alexa Fluor 647 on RNA (47–48 Å)[113] and values provided by the supplier (51 Å).[79] The distances of our selected variants cover a substantial part of the dynamic range of smFRET for a Förster radius of ∼5 nm. The cyanine nature of the dyes can, however, impose changes in the donor‐quantum yield (see data in Figure 7). This implies that R0 can change up to 10 % provided the quantum yield does not change more than two‐fold.
2.4. Alexa and AF Dyes for smFRET Studies of Proteins
We benchmarked the performance of the fluorophore pair AF555‐AFD647 in smFRET experiments of diffusing molecules against Alexa Fluor 555‐Alexa Fluor 647 for the three different MalE variants (Figure 7). Labelling of MalE was conducted using established procedures and resulted in similar labelling efficiencies for each site (>80 %, see Supplementary Figure S1) with at least 30 % donor‐acceptor containing proteins (Supplementary Figure S10). Notably, a strong interaction and sticking of AF555 when attached to residue 352 led to a skewed profile on the SEC chromatogram and retarded the protein on the column (Figure S1a).
In solution‐based ALEX‐measurements of all three variants, we obtained very good data quality and similar photon count rates for both dye pairs (see also Supplementary Figure S11). The comparison of the 2D‐histograms showed a clear FRET‐related population with coincident detection of donor‐ and acceptor‐signal. We also found little bleaching/blinking effects and shot‐noise limited broadening of the FRET populations for both dye combinations (Supplementary Figure S10/S12). The high data quality can be seen by an inspection and comparison of the 2D–E*‐S histograms, where a substantial donor‐acceptor population is observed, which is well separated from both donor‐ and acceptor‐only species (Figure 7b). The latter suggest that significant blinking‐ or bleaching effects are absent, since no bridging between the three populations[114] (donor‐only: S>0.7, donor‐acceptor: 0.7>S>0.3, acceptor‐only: S<0.3) are observed; Figure 7b.
All three double‐cysteine variants also show the expected trends for the addition of ligand: low‐to‐high FRET (36‐352), high‐to‐low FRET (87‐186) and constant FRET (85‐352); see Figure 7c. Furthermore, the mean uncorrected apparent FRET values were nearly identical for both dye pairs, i. e., their absolute E*‐value varied only by about ∼1 %. The width of the distributions, which is characterized by the σ‐values of the Gaussian fits, varied only in a moderate yet non‐systematic way in between both pairs. Also, no sub‐ms dynamics due to dye‐photophysics were seen in burst‐variance analysis (Figure S12). We noted, however, a slightly elevated bridge component for the dye combination AF555/AFD647 when the residue 352 was present in the protein. This suggests that residue 352 allows for stronger sticking, which is further supported by the skewed SEC profile of AF555 at this position (see Figure S1) and other data shown below.
In summary, the similarity of the dyes Alexa Fluor 555/AF555 and Alexa Fluor 647/AF(D)647 regarding their spectroscopic properties was faithfully reflected in the FRET efficiency distributions. This was expected since both dye pairs should have similar correction factors (direct excitation, leakage, quantum yield ratios) and Förster radii (see Figure 7). All this establishes the AF‐pair as a credible alternative for smFRET investigations.
2.5. Lifetime and Anisotropy Decay of Alexa and AF Dyes on Proteins
Notably, the smFRET experiments with the AF dyes showed a broadened FRET‐population for the variants 36‐352 and 85‐352 (Figure S10). To investigate this further, we characterized the environment of dyes and their protein‐interactions at positions 186 and 352. We knew from previous steady‐state anisotropy experiments that distinct residues in proteins can behave very differently in terms of interactions with dyes, which was indeed observed for MalE.[53] In our experiments, we observed generally faster anisotropy decays and thus less dye‐protein interactions at position 186 and stronger interactions at position 352 (slower anisotropy decay) for all tested dyes (Figure 8 and Supplementary Figure S13). No detectable difference was seen for the comparison of Alexa Fluor 555 and AF555 at position 186 (Figure 8a), a result that was similar for Alexa Fluor 647 and AFD647. At residue 352, however, we identified a much slower anisotropy decay, which is indicative of strong protein‐fluorophore interactions, in comparison to residue 186. Yet there were no apparent differences between Alexa Fluor 647 and AFD647 (Figure 8b). To our surprise and despite the structural similarity of Alexa Fluor 555 and AF555, we observed significant differences in protein‐fluorophore interactions between both dyes at residue 352. This is interesting since both the confirmed dye‐structures of Alexa Fluor 555 and AF555 differ mostly in the orientation of their protein‐dye linker and the symmetric placement of the sulfonate residues.
Figure 8.

Characterization of anisotropy and lifetime decays of cyanine dyes on MalE: (a) Lifetime (top) and time‐resolved anisotropy measurements (bottom) of Alexa Fluor 555 (lighter green) and AF555 (darker green) labelled at residues 186 (left) and 352 (right) in the ligand‐free state of MalE. (b) Lifetime (top) and time‐resolved anisotropy measurements (bottom) of Alexa Fluor 647 (lighter red) and AF647 (darker red) labelled at residues 186 (left) and 352 (right) in the ligand‐free state of MalE.
Additional differences appear in the fluorescence lifetime analysis, where AF555 sticking reduces non‐radiative de‐excitation of the dye molecule and thus AF555 displays a longer fluorescence lifetime as compared to Alexa Fluor 555 at position 352. This effect is related to protein‐induced fluorescence enhancement (PIFE)[115, 116] and supports the idea that restricted motion is responsible for longer excited state lifetimes and increased brightness in the green cyanine fluorophores. The structural similarity of Alexa Fluor 555 and AF555 revealed in this paper, also provides a clear explanation for the fact that both can be used as PIFE fluorophores.[117, 118, 119, 120, 121, 122] This is also why Alexa Fluor 555‐labelled dsDNA shows PIFE upon binding to T7 DNA Polymerase gp5/trx, which we could not explain previously due to lacking knowledge of the Alexa Fluor 555 structure. Again this emphasis the relevance of verifying fluorophore structures and labelling locations in relation to possible interactions of dyes with their environment.
To further explain the observed differences between Alexa Fluor 555 and AF555 in their interactions with MalE at specific positions, we performed molecular dynamics simulations (Figure 9). As described in the methods section, the rotational anisotropy decay r(t) was calculated for multiple short simulations of the maltose binding protein labelled with the confirmed structural variants of AF555 and Alexa Fluor 555 (Figure 9).
Figure 9.

Average rotational anisotropy decay calculated from MD simulations of fluorophore‐labelled MalE. Mutants A186C and S352C were combined with fluorophores AF555 and Alexa Fluor 555, and multiple (∼20) simulations of 20 ns length were performed per protein‐dye system. The curves depict the average of the anisotropy decay r(t) over these simulations. Time origins for the averaging per simulation are separated by 6 ps.
The rotational anisotropy decay at 186C is faster than at 352C, reflecting, as observed in experiment, reduced dye‐sticking at the former site (Figure 9). The simulations suggest distinct interaction sites, which are extremely sensitive to specific structural features of the fluorophore. Relevant protein‐dye interactions that possibly contribute to the reduced motion at the 352C site and selected distances between fluorophore‐ and protein‐atoms are illustrated in Supplementary Figure S14 and S15 for Alexa Fluor 555. For the 352C site, the simulation also shows an (albeit limited) qualitative match to the experimental data for Alexa Fluor 555, where a faster anisotropy decay is found in contrast to AF555 (slow anisotropy decay; Figure 9).
3. Discussion and Conclusions
Using a combined investigation of the spectroscopic and molecular properties of Alexa Fluor 555, AF555 and Alexa Fluor 647, we were able to confirm that all indeed have a cyanine fluorophore core (Figure 1–5). NMR analysis also reveals the structure of Alexa Fluor 555 and we were able to propose a refined structure for AF555. Similar studies on Alexa Fluor 647 allowed us to accurately determine its molecular structure and with that settle conflicting reports on its linker structure and the linkers of the sulphonate groups. Our spectroscopic analysis and tests of the dyes in smFRET experiments on proteins (Figure 7/8) showed good performance of all dyes in the experiments and a high degree of similarity between the Alexa Fluor and AF dyes as was expected based on the structural similarity.
Having determined the fluorophore structures, we were able to derive force‐field parameters for MD simulations (Supplementary Table S1, Supplementary Figure S4/5) and parameters for in silico‐prediction of accessible volumes of the dyes when used as a FRET label. These parameters are important for predictions of observed mean inter‐fluorophore distances and FRET‐efficiencies for a combination of smFRET experiments with structural modelling and simulations.[123] Using the structure AF(D)647 and the corrected one of AF555 and the ones of Alexa Fluor 555 and 647 (Figure 1), we derived all relevant parameters for accessible volume (AV) calculations following the method by Kalinin et al.[123] (Table 2). For these simulations a parametrization for linker and fluorophore core – modelled as an ellipsoid – is provided in Table 2 according to the proposed procedure (Supplementary Figure S16).[123]
Table 2.
Geometric Parameters for in silico predictions of FRET labels using the FRET‐restrained positioning system.
|
Label |
Linker length [Å] |
W [Å] |
R1 [Å] |
R2 [Å] |
R3 [Å] |
|---|---|---|---|---|---|
|
Alexa Fluor 555 – C2 Maleimide(d) |
21 |
4.5 |
8.8 |
4.2 |
1.5 |
|
AF555 Maleimide(d) |
20.5 |
4.5 |
8.8 |
4.4 |
1.5 |
|
Alexa Fluor 647 – C2 Maleimide[124] |
21 |
4.5 |
11 |
4.7 |
1.5 |
|
AF(D)647 Maleimide(d) |
20.5 |
4.5 |
11 |
4.9 |
1.5 |
(d) derived from approximated ellipsoid to fluorophore core and measured atom distances in fluorophore structure.
We finally note that the high structural resemblance of the dyes might render it reasonable to use either of the dyes without considering the small differences. Yet as shown above, slight structural variations of the dyes can impact dye‐protein interactions greatly, e. g., as seen for Alexa Fluor 555 and AF555 with differing lifetimes/anisotropy decays (Figure 8/9). Such effects, which we also observed for a comparison of Alexa Fluor 647 and AF647 (but not with AFD647) can largely alter various parameters in a biophysical assay (Figure 10). Here, we observed significant differences in lifetime and anisotropy decay for a mere addition of a methylene‐bridge of the sulfonated group (sulfonated butyl‐group instead of propyl‐groups). While changes in the donor lifetime can alter the Förster radius, strong dye‐protein interactions can produce a large number of additional artifacts ranging from long rotational correlation times of the respective dye to an impact of the dye on the biochemical properties of the protein.
Figure 10.

Characterization of anisotropy and lifetime decays of Alexa Fluor 647 and AF(D)647 on MalE (position 352) in the ligand‐free state of MalE. The change in one methylene‐group from AFD647 to AF647 shows a significant increased anisotropy and lifetime.
Overall, we conclude that the gathered structural knowledge on Alexa Fluor 555 and 647 will finally enable their applications wherever precise chemical information is required. Furthermore, we conclude that AF555 and AF(D)647 are suitable replacements of the Alexa Fluor dyes in applications for which similar spectroscopic and molecular parameters are required.
Author contributions
C.G. and T.C. conceived and designed the study. T.C. supervised the study. C.G performed research and analyzed data. M.L. performed mass spectrometry. G.G. performed and analyzed NMR measurements. M.M.R. and M.Z. designed the simulation setup, M.M.R performed and analyzed simulations. C.G. and T.C. wrote the manuscript. All authors discussed and interpreted the results and approved the final version of the manuscript.
Conflict of interest
The authors declare no conflict of interest.
Supporting information
As a service to our authors and readers, this journal provides supporting information supplied by the authors. Such materials are peer reviewed and may be re‐organized for online delivery, but are not copy‐edited or typeset. Technical support issues arising from supporting information (other than missing files) should be addressed to the authors.
Supporting Information
Acknowledgements
This work was financed by an ERC Starting Grant (ERC‐StG 638536 – SM‐IMPORT to T.C.), Deutsche Forschungsgemeinschaft within GRK2062 (project C03 to T.C.) and SFB863 (project A13 to T.C., project A10 and A13‐111166240 to M.Z.), LMUexcellent (start‐up funding to T.C.), the Center for integrated protein science Munich (CiPSM) and the Center for Nanoscience (CeNS). C.G. acknowledges a PhD fellowship from the Studienstiftung des deutschen Volkes. Compute resources for this project were partially provided by the Regionales Rechenzentrum Erlangen (RRZE). NMR measurements were performed on spectrometers of the “Bayerisches NMR‐Zentrum (B NMRZ)”, jointly supported by TU München and the Helmholtz Zentrum für Gesundheit und Umwelt. We thank D.A. Griffith for carefully reading and commenting on the manuscript. Open access funding enabled and organized by Projekt DEAL.
C. Gebhardt, M. Lehmann, M. M. Reif, M. Zacharias, G. Gemmecker, T. Cordes, ChemPhysChem 2021, 22, 1566.
A previous version of this manuscript has been deposited on a preprint server (https://www.biorxiv.org/content/10.1101/2020.11.13.381152v1).
Contributor Information
PD Dr. Gerd Gemmecker, Email: gerd.gemmecker@tum.de.
Prof. Dr. Thorben Cordes, Email: cordes@bio.lmu.de.
References
- 1.Corman V. M., Landt O., Kaiser M., Molenkamp R., Meijer A., Chu D. K. W., Bleicker T., Brünink S., Schneider J., Schmidt M. L., Mulders D. G. J. C., Haagmans B. L., van der Veer B., van den Brink S., Wijsman L., Goderski G., Romette J.-L., Ellis J., Zambon M., Peiris M., Goossens H., Reusken C., Koopmans M. P. G., Drosten C., Euro Surveill. 2020, 25. [Google Scholar]
- 2.M. Sauer, J. Hofkens, J. Enderlein, in Handbook of Fluorescence Spectroscopy and Imaging 2011, 1–30.
- 3.Hell S. W., Science 2007, 316, 1153 LP–1158. [DOI] [PubMed] [Google Scholar]
- 4.Hell S. W., Nat. Methods 2009, 6, 24–32. [DOI] [PubMed] [Google Scholar]
- 5.Hell S. W., Sahl S. J., Bates M., Zhuang X., Heintzmann R., Booth M. J., Bewersdorf J., Shtengel G., Hess H., Tinnefeld P., Honigmann A., Jakobs S., Testa I., Cognet L., Lounis B., Ewers H., Davis S. J., Eggeling C., Klenerman D., Willig K. I., Vicidomini G., Castello M., Diaspro A., Cordes T., J. Phys. D 2015, 48, 443001. [Google Scholar]
- 6.Hell S. W., Wichmann J., Opt. Lett. 1994, 19, 780–782. [DOI] [PubMed] [Google Scholar]
- 7.Betzig E., Patterson G. H., Sougrat R., Lindwasser O. W., Olenych S., Bonifacino J. S., Davidson M. W., Lippincott-Schwartz J., Hess H. F., Science 2006, 313, 1642–1645. [DOI] [PubMed] [Google Scholar]
- 8.Heilemann M., van de Linde S., Schüttpelz M., Kasper R., Seefeldt B., Mukherjee A., Tinnefeld P., Sauer M., Angew. Chem. Int. Ed. 2008, 47, 6172–6176; [DOI] [PubMed] [Google Scholar]; Angew. Chem. 2008, 120, 6266–6271. [Google Scholar]
- 9.Ha T., Tinnefeld P., Annu. Rev. Phys. Chem. 2012, 63, 595–617. [DOI] [PMC free article] [PubMed] [Google Scholar]
- 10.T. Cordes, J. Vogelsang, C. Steinhauer, I. H. Stein, C. Forthmann, A. Gietl, J. J. Schmied, G. P. Acuna, S. Laurien, B. Lalkens, P. Tinnefeld, in Far-Field Optical Nanoscopy. Springer Series on Fluorescence (Methods and Applications) 2015. 215–242.
- 11.Liphardt B., Liphardt B., Lüttke W., Opt. Commun. 1981, 38, 207–210. [Google Scholar]
- 12.Altman R. B., Terry D. S., Zhou Z., Zheng Q., Geggier P., Kolster R. A., Zhao Y., Javitch J. A., Warren J. D., Blanchard S. C., Nat. Methods 2011, 9, 68–71. [DOI] [PMC free article] [PubMed] [Google Scholar]
- 13.Altman R. B., Zheng Q., Zhou Z., Terry D. S., Warren J. D., Blanchard S. C., Nat. Methods 2012, 9, 428–429. [DOI] [PMC free article] [PubMed] [Google Scholar]
- 14.Tinnefeld P., Cordes T., Nat. Methods 2012, 9, 426–427. [DOI] [PMC free article] [PubMed] [Google Scholar]
- 15.van der Velde J. H. M., Ploetz E., Hiermaier M., Oelerich J., de Vries J. W., Roelfes G., Cordes T., ChemPhysChem 2013, 14, 4084–4093. [DOI] [PubMed] [Google Scholar]
- 16.van der Velde J. H. M., Oelerich J., Huang J., Smit J. H., Aminian Jazi A., Galiani S., Kolmakov K., Gouridis G., Eggeling C., Herrmann A., Roelfes G., Cordes T., Nat. Commun. 2016, 7, 10144. [DOI] [PMC free article] [PubMed] [Google Scholar]
- 17.Uno S.-N., Kamiya M., Yoshihara T., Sugawara K., Okabe K., Tarhan M. C., Fujita H., Funatsu T., Okada Y., Tobita S., Urano Y., Nat. Chem. 2014, 6, 681–689. [DOI] [PubMed] [Google Scholar]
- 18.Jazi A. A., Ploetz E., Arizki M., Dhandayuthapani B., Waclawska I., Krämer R., Ziegler C., Cordes T., Biochemistry 2017, 56, 2031–2041. [DOI] [PMC free article] [PubMed] [Google Scholar]
- 19.Brox D., Kiel A., Wörner S. J., Pernpointner M., Comba P., Martin B., Herten D.-P., PLoS One 2013, 8, e58049. [DOI] [PMC free article] [PubMed] [Google Scholar]
- 20.Dave R., Terry D. S., Munro J. B., Blanchard S. C., Biophys. J. 2009, 96, 2371–2381. [DOI] [PMC free article] [PubMed] [Google Scholar]
- 21.Rasnik I., McKinney S. A., Ha T., Nat. Methods 2006, 3, 891–893. [DOI] [PubMed] [Google Scholar]
- 22.Vogelsang J., Kasper R., Steinhauer C., Person B., Heilemann M., Sauer M., Tinnefeld P., Angew. Chem. Int. Ed. 2008, 47, 5465–5469; [DOI] [PubMed] [Google Scholar]; Angew. Chem. 2008, 120, 5545–5550. [Google Scholar]
- 23.Cordes T., Vogelsang J., Tinnefeld P., J. Am. Chem. Soc. 2009, 131, 5018–5019. [DOI] [PubMed] [Google Scholar]
- 24.Lemke E. A., Gambin Y., Vandelinder V., Brustad E. M., Liu H.-W., Schultz P. G., Groisman A., Deniz A. A., J. Am. Chem. Soc. 2009, 131, 13610–13612. [DOI] [PMC free article] [PubMed] [Google Scholar]
- 25.Cordes T., Maiser A., Steinhauer C., Schermelleh L., Tinnefeld P., Phys. Chem. Chem. Phys. 2011, 13, 6699–6709. [DOI] [PubMed] [Google Scholar]
- 26.Aitken C. E., Marshall R. A., Puglisi J. D., Biophys. J. 2008, 94, 1826–1835. [DOI] [PMC free article] [PubMed] [Google Scholar]
- 27.Dempsey G. T., Bates M., Kowtoniuk W. E., Liu D. R., Tsien R. Y., Zhuang X., J. Am. Chem. Soc. 2009, 131, 18192–18193. [DOI] [PMC free article] [PubMed] [Google Scholar]
- 28.Cosa G., Focsaneanu K.-S., McLean J. R. N., McNamee J. P., Scaiano J. C., Photochem. Photobiol. 2001, 73, 585. [DOI] [PubMed] [Google Scholar]
- 29.Kolbeck P. J., Vanderlinden W., Nicolaus T., Gebhardt C., Cordes T., Lipfert J., Nucleic Acids Res. 2021, 49. [DOI] [PMC free article] [PubMed] [Google Scholar]
- 30.Thermo Fisher Scientific. in The Molecular Probes handbook. A guide to fluorescent probes and labeling technologies (eds. I. Johnson, M. T. Z. Spence) 2009.
- 31.Zipper H., Brunner H., Bernhagen J., Vitzthum F., Nucleic Acids Res. 2004, 32. [DOI] [PMC free article] [PubMed] [Google Scholar]
- 32.Eggeling C., Ringemann C., Medda R., Schwarzmann G., Sandhoff K., Polyakova S., Belov V. N., Hein B., von Middendorff C., Schönle A., Hell S. W., Nature 2009, 457, 1159–1162. [DOI] [PubMed] [Google Scholar]
- 33.Kottke T., van de Linde S., Sauer M., Kakorin S., Heilemann M., J. Phys. Chem. Lett. 2010, 1, 3156–3159. [Google Scholar]
- 34.Söderberg O., Gullberg M., Jarvius M., Ridderstråle K., Leuchowius K.-J., Jarvius J., Wester K., Hydbring P., Bahram F., Larsson L.-G., Landegren U., Nat. Methods 2006, 3, 995–1000. [DOI] [PubMed] [Google Scholar]
- 35.Yang W., Gelles J., Musser S. M., Proc. Natl. Acad. Sci. USA 2004, 101, 12887 LP–12892. [DOI] [PMC free article] [PubMed] [Google Scholar]
- 36.Kim H., Robinson S. B., Csaky K. G., Pharm. Res. 2009, 26, 329–337. [DOI] [PubMed] [Google Scholar]
- 37.Léveillé F., El gaamouch F., Gouix E., Lecocq M., Lobner D., Nicole O., Buisson A., FASEB J. 2008, 22, 4258–4271. [DOI] [PubMed] [Google Scholar]
- 38.Lin J.-R., Fallahi-Sichani M., Sorger P. K., Nat. Commun. 2015, 6, 8390. [DOI] [PMC free article] [PubMed] [Google Scholar]
- 39.Yarani R., Shiraishi T., Nielsen P. E., Sci. Rep. 2018, 8, 638. [DOI] [PMC free article] [PubMed] [Google Scholar]
- 40.Esteban A., Popp M. W., Vyas V. K., Strijbis K., Ploegh H. L., Fink G. R., Proc. Nat. Acad. Sci. 2011, 108, 14270 LP–14275. [DOI] [PMC free article] [PubMed] [Google Scholar]
- 41.Clayton A. H. A., Walker F., Orchard S. G., Henderson C., Fuchs D., Rothacker J., Nice E. C., Burgess A. W., J. Biol. Chem. 2005, 280, 30392–30399. [DOI] [PubMed] [Google Scholar]
- 42.French A. P., Mills S., Swarup R., Bennett M. J., Pridmore T. P., Nat. Protoc. 2008, 3, 619–628. [DOI] [PubMed] [Google Scholar]
- 43.Wingren C., Borrebaeck C. A. K., Curr. Opin. Biotechnol. 2008, 19, 55–61. [DOI] [PubMed] [Google Scholar]
- 44.Kimura R. H., Levin A. M., Cochran F. V., Cochran J. R., Proteins Struct. Funct. Bioinf. 2009, 77, 359–369. [DOI] [PMC free article] [PubMed] [Google Scholar]
- 45.Ziemba B. P., Swisher G. H., Masson G., Burke J. E., Williams R. L., Falke J. J., Biochemistry 2016, 55, 6395–6405. [DOI] [PMC free article] [PubMed] [Google Scholar]
- 46.Ballard J. L., Peeva V. K., DeSilva C. J. S., Lynch J. L., Swanson N. R., Mol. Biotechnol. 2007, 36, 175–183. [DOI] [PubMed] [Google Scholar]
- 47.Cauchon E., Falgueyret J.-P., Auger A., Melnyk R. A., J. Biomol. Screening 2011, 16, 518–524. [DOI] [PubMed] [Google Scholar]
- 48.Hellenkamp B., Schmid S., Doroshenko O., Opanasyuk O., Kühnemuth R., Rezaei Adariani S., Ambrose B., Aznauryan M., Barth A., Birkedal V., Bowen M. E., Chen H., Cordes T., Eilert T., Fijen C., Gebhardt C., Götz M., Gouridis G., Gratton E., Ha T., Hao P., Hanke C. A., Hartmann A., Hendrix J., Hildebrandt L. L., Hirschfeld V., Hohlbein J., Hua B., Hübner C. G., Kallis E., Kapanidis A. N., Kim J.-Y., Krainer G., Lamb D. C., Lee N. K., Lemke E. A., Levesque B., Levitus M., McCann J. J., Naredi-Rainer N., Nettels D., Ngo T., Qiu R., Robb N. C., Röcker C., Sanabria H., Schlierf M., Schröder T., Schuler B., Seidel H., Streit L., Thurn J., Tinnefeld P., Tyagi S., Vandenberk N., Vera A. M., Weninger K. R., Wünsch B., Yanez-Orozco I. S., Michaelis J., Seidel C. A. M., Craggs T. D., Hugel T., Nat. Methods 2018, 15, 669–676. [DOI] [PMC free article] [PubMed] [Google Scholar]
- 49.Vöpel T., Hengstenberg C. S., Peulen T.-O., Ajaj Y., Seidel C. A. M., Herrmann C., Klare J. P., Biochemistry 2014, 53, 4590–4600. [DOI] [PubMed] [Google Scholar]
- 50.Peulen T.-O., Opanasyuk O., Seidel C. A. M., J. Phys. Chem. B 2017, 121, 8211–8241. [DOI] [PMC free article] [PubMed] [Google Scholar]
- 51.Zander A., Holzmeister P., Klose D., Tinnefeld P., Grohmann D., RNA Biol. 2014, 11, 45–56. [DOI] [PMC free article] [PubMed] [Google Scholar]
- 52.Husada F., Bountra K., Tassis K., de Boer M., Romano M., Rebuffat S., Beis K., Cordes T., EMBO J. 2018, 37, e100056. [DOI] [PMC free article] [PubMed] [Google Scholar]
- 53.de Boer M., Gouridis G., Vietrov R., Begg S. L., Schuurman-Wolters G. K., Husada F., Eleftheriadis N., Poolman B., McDevitt C. A., Cordes T., eLife 2019, 8, e44652. [DOI] [PMC free article] [PubMed] [Google Scholar]
- 54.Feng Y., Zhang L., Wu S., Liu Z., Gao X., Zhang X., Liu M., Liu J., Huang X., Wang W., Angew. Chem. Int. Ed. 2016, 55, 13990–13994; [DOI] [PubMed] [Google Scholar]; Angew. Chem. 2016, 128, 14196–14200. [Google Scholar]
- 55.DeRocco V. C., Anderson T., Piehler J., Erie D. A., Weninger K., BioTechniques 2010, 49, 807–816. [DOI] [PMC free article] [PubMed] [Google Scholar]
- 56.McCann J. J., Zheng L., Chiantia S., Bowen M. E., Structure 2011, 19, 810–820. [DOI] [PMC free article] [PubMed] [Google Scholar]
- 57.Ma W., Whitley K. D., Chemla Y. R., Luthey-Schulten Z., Schulten K., eLife 2018, 7, e34186. [DOI] [PMC free article] [PubMed] [Google Scholar]
- 58.Vrljic M., Strop P., Ernst J. A., Sutton R. B., Chu S., Brunger A. T., Nat. Struct. Mol. Biol. 2010, 17, 325–331. [DOI] [PMC free article] [PubMed] [Google Scholar]
- 59.Reinartz I., Sinner C., Nettels D., Stucki-Buchli B., Stockmar F., Panek P. T., Jacob C. R., Nienhaus G. U., Schuler B., Schug A., J. Chem. Phys. 2018, 148, 123321. [DOI] [PubMed] [Google Scholar]
- 60.Gust A., Zander A., Gietl A., Holzmeister P., Schulz S., Lalkens B., Tinnefeld P., Grohmann D., Molecules 2014, 19, 15824–15865. [DOI] [PMC free article] [PubMed] [Google Scholar]
- 61.Graen T., Hoefling M., Grubmüller H., J. Chem. Theory Comput. 2014, 10, 5505–5512. [DOI] [PubMed] [Google Scholar]
- 62.Höfig H., Gabba M., Poblete S., Kempe D., Fitter J., Molecules 2014, 19. [DOI] [PMC free article] [PubMed] [Google Scholar]
- 63.Dai Y., Seeger M., Weng J., Song S., Wang W., Tan Y.-W., Sci. Rep. 2016, 6, 30282. [DOI] [PMC free article] [PubMed] [Google Scholar]
- 64.Höfig H., Gabba M., Poblete S., Kempe D., Fitter J., Molecules 2014, 19, 19269–19291. [DOI] [PMC free article] [PubMed] [Google Scholar]
- 65.Hughes L. D., Rawle R. J., Boxer S. G., PLoS One 2014, 9, e87649. [DOI] [PMC free article] [PubMed] [Google Scholar]
- 66.Tian H., Sakmar T. P., Huber T., Methods Cell Biol. 2013, 117, 267–303. [DOI] [PubMed] [Google Scholar]
- 67.Rashid F., Raducanu V.-S., Zaher M. S., Tehseen M., Habuchi S., Hamdan S. M., Nat. Commun. 2019, 10, 2104. [DOI] [PMC free article] [PubMed] [Google Scholar]
- 68.Schmidt A., Altincekic N., Gustmann H., Wachtveitl J., Hengesbach M., ACS Chem. Biol. 2018, 13, 2472–2483. [DOI] [PubMed] [Google Scholar]
- 69.Zanetti-Domingues L. C., Tynan C. J., Rolfe D. J., Clarke D. T., Martin-Fernandez M., PLoS One 2013, 8. [DOI] [PMC free article] [PubMed] [Google Scholar]
- 70.Hanson J. A., Duderstadt K., Watkins L. P., Bhattacharyya S., Brokaw J., Chu J. W., Yang H., Proc. Natl. Acad. Sci. USA 2007, 104, 18055–18060. [DOI] [PMC free article] [PubMed] [Google Scholar]
- 71.Fluoroprobes. https://fluoroprobes.com/product/af-647-maleimide/ 2020.
- 72.M. De Boer, G. Gouridis, S. Mcdevitt, F. Husada, N. Eleftheriadis, B. Poolman, C. A. McDevitt, T. Cordes, 2018.
- 73.Gouridis G., Schuurman-Wolters G. K., Ploetz E., Husada F., Vietrov R., de Boer M., Cordes T., Poolman B., Nat. Struct. Mol. Biol. 2015, 22, 57–64. [DOI] [PubMed] [Google Scholar]
- 74.Husada F., Gouridis G., Vietrov R., Schuurman-Wolters G. K., Ploetz E., de Boer M., Poolman B., Cordes T., Biochem. Soc. Trans. 2015, 43. [DOI] [PubMed] [Google Scholar]
- 75.Gouridis G., Hetzert B., Kiosze-Becker K., de Boer M., Heinemann H., Nürenberg-Goloub E., Cordes T., Tampé R., Cell Rep. 2019, 28, 723–734.e6. [DOI] [PMC free article] [PubMed] [Google Scholar]
- 76.Kapanidis A. N., Lee N. K., Laurence T. A., Doose S., Margeat E., Weiss S., Proc. Natl. Acad. Sci. USA 2004, 101, 8936–8941. [DOI] [PMC free article] [PubMed] [Google Scholar]
- 77.Eggeling C., Fries J. R., Brand L., Günther R., Seidel C. A. M., Proc. Nat. Acad. Sci. 1998, 95, 1556 LP–1561. [DOI] [PMC free article] [PubMed] [Google Scholar]
- 78.K. Rurack, Fluorescence Quantum Yields: Methods of Determination and Standards. In: Resch-Genger U. 2008.
- 79.Wiederschain G. Y., Biochemistry (Moscow) 2011, 76, 1276. [Google Scholar]
- 80.Voith von Voithenberg L., Lamb D. C., BioEssays 2018, 40, 1700078. [DOI] [PubMed] [Google Scholar]
- 81.Jena Bioscience. https://www.jenabioscience.com/probes-epigenetics/reactive-components/reactive-fluorescent-dyes/maleimides/apc-009-af647-maleimide 2020.
- 82.J. R. Lakowicz, in Springer US, 2006, 205–235.
- 83.O'Connor D. V., Ware W. R., Andre J. C., J. Phys. Chem. 1979, 83, 1333–1343. [Google Scholar]
- 84.S. S. Vogel, C. Thaler, P. S. Blank, S. V Koushik, in FLIM Microscopy in Biology and Medicine 2009.
- 85.Smith T. A., Ghiggino K. P., Methods Appl. Fluoresc. 2015, 3, 22001. [DOI] [PubMed] [Google Scholar]
- 86.Castillo A. M., Patiny L., Wist J., J. Magn. Reson. 2011, 209, 123–130. [DOI] [PubMed] [Google Scholar]
- 87.Sharff A. J., Rodseth L. E., Spurlino J. C., Quiocho F. A., Biochemistry 1992, 31, 10657–10663. [DOI] [PubMed] [Google Scholar]
- 88.Abraham M. J., Murtola T., Schulz R., Páll S., Smith J. C., Hess B., Lindahl E., SoftwareX 2015, 1–2, 19–25. [Google Scholar]
- 89.L. Schrödinger. 2020.
- 90.Hornak V., Abel R., Okur A., Strockbine B., Roitberg A., Simmerling C., Proteins 2006, 65, 712–725. [DOI] [PMC free article] [PubMed] [Google Scholar]
- 91.Jakalian A., Bush B. L., Jack D. B., Bayly C. I., J. Comput. Chem. 2000, 21, 132–146. [Google Scholar]
- 92.Wang J., Wang W., Kollman P. A., Case D. A., J. Mol. Graphics Modell. 2006, 25, 247–260. [DOI] [PubMed] [Google Scholar]
- 93.Wang J., Wolf R. M., Caldwell J. W., Kollman P. A., Case D. A., J. Comput. Chem. 2004, 25, 1157–1174. [DOI] [PubMed] [Google Scholar]
- 94.Best R. B., Hofmann H., Nettels D., Schuler B., Biophys. J. 2015, 108, 2721–2731. [DOI] [PMC free article] [PubMed] [Google Scholar]
- 95.Jorgensen W. L., Chandrasekhar J., Madura J. D., Impey R. W., Klein M. L., J. Chem. Phys. 1983, 79, 926–935. [Google Scholar]
- 96.Berendsen H. J. C., Postma J. P. M., van Gunsteren W. F., DiNola A., Haak J. R., J. Chem. Phys. 1984, 81, 3684–3690. [Google Scholar]
- 97.Hess B., Bekker H., Berendsen H. J. C., Fraaije J. G. E. M., J. Comput. Chem. 1997, 18, 1463–1472. [Google Scholar]
- 98.Jones J. E., Chapman S., Proc. R. Soc. London Ser. A 1924, 106, 441–462. [Google Scholar]
- 99.Barker J. A., Watts R. O., Mol. Phys. 1973, 26, 789–792. [Google Scholar]
- 100.Schröder G. F., Alexiev U., Grubmüller H., Biophys. J. 2005, 89, 3757–3770. [DOI] [PMC free article] [PubMed] [Google Scholar]
- 101.Corry B., Jayatilaka D., Biophys. J. 2008, 95, 2711–2721. [DOI] [PMC free article] [PubMed] [Google Scholar]
- 102.Panchuk-Voloshina N., Haugland R. P., Bishop-Stewart J., Bhalgat M. K., Millard P. J., Mao F., Leung W.-Y., Haugland R. P., J. Histochem. Cytochem. 1999, 47, 1179–1188. [DOI] [PubMed] [Google Scholar]
- 103.Blanchard S. C., Kim H. D., Gonzalez R. L., Puglisi J. D., Chu S., Proc. Natl. Acad. Sci. USA 2004, 101, 12893–12898. [DOI] [PMC free article] [PubMed] [Google Scholar]
- 104.Sanborn M. E., Connolly B. K., Gurunathan K., Levitus M., J. Phys. Chem. B 2007, 111, 11064–11074. [DOI] [PubMed] [Google Scholar]
- 105.Jena Bioscience. https://www.jenabioscience.com/probes-epigenetics/reactive-components/reactive-fluorescent-dyes/maleimides/apc-007-af555-maleimide 2020.
- 106.Fluoroprobes. https://fluoroprobes.com/product/alexa-fluor-555-maleimide/ 2020.
- 107.Thermo Fisher Scientific. https://www.thermofisher.com/de/de/home/brands/molecular-probes/key-molecular-probes-products/alexa-fluor/alexa-fluor-dyes-across-the-spectrum.html 2020.
- 108.Thermo Fisher Scientific. https://www.thermofisher.com/order/catalog/product/A20346#/A20346 2020.
- 109.Thermo Fisher Scientific. https://www.thermofisher.com/order/catalog/product/A20347#/A20347 2020.
- 110.Mächtel R., Narducci A., Griffith D. A., Cordes T., Orelle C., Res. Microbiol. 2019. [DOI] [PMC free article] [PubMed] [Google Scholar]
- 111.Davidson A. L., Dassa E., Orelle C., Chen J., Microbiol. Mol. Biol. Rev. 2008, 72, 317–64. [DOI] [PMC free article] [PubMed] [Google Scholar]
- 112.Dassa E., Essays Biochem. 2011, 50, 19–42. [DOI] [PubMed] [Google Scholar]
- 113.Muschielok A., Andrecka J., Jawhari A., Brückner F., Cramer P., Michaelis J., Nat. Methods 2008, 5, 965. [DOI] [PubMed] [Google Scholar]
- 114.Kong X., Nir E., Hamadani K., Weiss S., J. Am. Chem. Soc. 2007, 129, 4643–4654. [DOI] [PMC free article] [PubMed] [Google Scholar]
- 115.Hwang H., Kim H., Myong S., Proc. Nat. Acad. Sci. 2011, 108, 7414 LP–7418. [DOI] [PMC free article] [PubMed] [Google Scholar]
- 116.Hwang H., Myong S., Chem. Soc. Rev. 2014, 43, 1221–1229. [DOI] [PMC free article] [PubMed] [Google Scholar]
- 117.Ploetz E., Lerner E., Husada F., Roelfs M., Chung S., Hohlbein J., Weiss S., Cordes T., Sci. Rep. 2016, 6, 33257. [DOI] [PMC free article] [PubMed] [Google Scholar]
- 118.Lerner E., Ploetz E., Hohlbein J., Cordes T., Weiss S., J. Phys. Chem. B 2016, 120, 6401–6410. [DOI] [PMC free article] [PubMed] [Google Scholar]
- 119.Harvey B. J., Perez C., Levitus M., Photochem. Photobiol. Sci. 2009, 8, 1105–1110. [DOI] [PubMed] [Google Scholar]
- 120.Stennett E. M. S., Ciuba M. A., Lin S., Levitus M., J. Phys. Chem. Lett. 2015, 6, 1819–1823. [DOI] [PubMed] [Google Scholar]
- 121.Levitus M., Negri R. M., Aramendia P. F., J. Phys. Chem. 1995, 99, 14231–14239. [Google Scholar]
- 122.Gidi Y., Götte M., Cosa G., J. Phys. Chem. B 2017, 121, 2039–2048. [DOI] [PubMed] [Google Scholar]
- 123.Kalinin S., Peulen T., Sindbert S., Rothwell P. J., Berger S., Restle T., Goody R. S., Gohlke H., Seidel C. A. M., Nat. Methods 2012, 9, 1218–1225. [DOI] [PubMed] [Google Scholar]
- 124.Dimura M., Peulen T. O., Hanke C. A., Prakash A., Gohlke H., Seidel C. A. M., Curr. Opin. Struct. Biol. 2016, 40, 163–185. [DOI] [PubMed] [Google Scholar]
Associated Data
This section collects any data citations, data availability statements, or supplementary materials included in this article.
Supplementary Materials
As a service to our authors and readers, this journal provides supporting information supplied by the authors. Such materials are peer reviewed and may be re‐organized for online delivery, but are not copy‐edited or typeset. Technical support issues arising from supporting information (other than missing files) should be addressed to the authors.
Supporting Information