Abstract
Predictable colour tuning in multicomponent photoluminescent (PL) systems is achieved using mixtures of simultaneously emitting organic molecules. By mitigating the potential for energy transfer through the control of concentration, the resulting emission chromaticity of five dichromic PL systems is approximated as a linear combination of the emitting components and their corresponding brightness (χi, ϕi, and Iex,i). Despite being limited to dilute solutions (10−6 M), colour tuning within these systems was controlled by (1) varying the composition of the components and (2) exploiting the differences in the components' excitation intensities at common wavelengths. Using this approach, white light emission (WLE) was realized using a pre-determined mixture of red, green, and blue emitting organic molecules. Based on these results, materials and devices with built-in or programmable emission colour can be achieved, including highly sought-after WLE.
Predictable colour tuning in multicomponent photoluminescent (PL) systems is achieved using mixtures of simultaneously emitting organic molecules.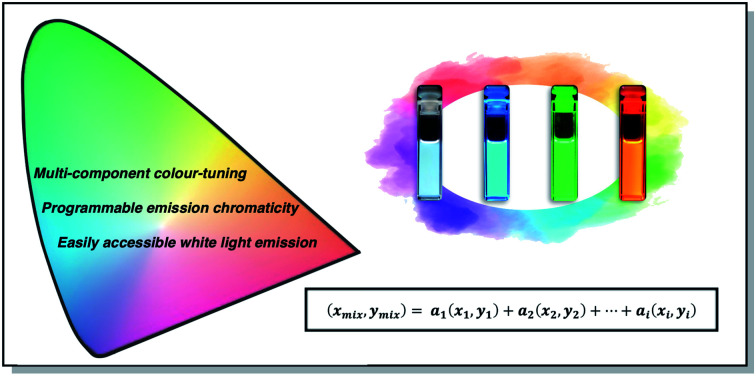
Introduction
Photoluminescence colour-tuning (PLCT) and control of emission chromaticity are critical for the continued development of functional organic and hybrid materials. Molecular systems capable of PLCT are being targeted for applications including lighting and display technologies,1 sensors,2,3 inks and encryption,4–7 and stimuli-responsive smart materials.8 These systems include but are not limited to mixed-emitting organic polymers,9 host–guest metal–organic hybrids,10,11 and simple mixtures of photoluminescent (PL) organic molecules.12–15 The emission chromaticity of multicomponent PL systems can be tuned by choice of excitation wavelength and varying the composition of each PL emitter.12,16,17 For example, there have been multiple accounts of multicomponent PLCT being used to achieve highly sought-after white light emission (WLE) by adjusting the composition of each PL component.1,12,13,15,18 Despite countless examples of multicomponent WLE PL systems, most appear to have arisen through an iterative process of varying the excitation wavelength and composition of RGB emitters as opposed to predicting and programming WLE into systems using the concept of additive colour mixing.
The concept of additive colour-mixing is well established. Combining two or more colours in equal proportion and brightness results in a colour derived from a linear combination of the components.19 However, many multicomponent PL systems possess intra- or intermolecular energy transfer (ET) mechanisms such as Fluorescence Resonance Energy Transfer (FRET).11,13,14,20,21 Accounting for ET processes makes applying colour-mixing theory a challenge since ET differs from system to system. However, what if ET processes were mitigated or suppressed? Ingenious strategies to inhibit ET have been explored, including the use of micelles to spatially isolate PL emitters, leading to the simultaneous emission of each component.14,22 Since ET is distance-dependant, simply controlling the molecular concentration can decrease the possibility of ET, which would allow the resulting emission chromaticity to be approximated as a product of each PL component's emission colour and brightness.
Using the Commission Internationale de l'Eclairage (CIE) 1931 xyz colour-matching functions, the emission spectrum of a PL emitter can be converted into a set of numerical coordinates (x,y) that defines its colour.19 The brightness (a) of a PL emitter is loosely described as a product of (1) how strongly a PL molecule absorbs light at a given wavelength (ε = Acl) and (2) how much of that absorbed light is subsequently emitted (ϕPL).23 Alternatively, one can also describe how strongly a PL molecule absorbs light at a given wavelength by substituting absorption intensity (A) for excitation intensity (Iex). Whereas the absorption intensity is measured as the logarithmic fraction of incident and transmitted light, the signal intensity (counts per second) in the excitation spectrum is directly proportional to the number of photons that are absorbed and emitted. Using excitation intensity (Iex) as a metric to quantify brightness has added benefits such as eliminating the need for a UV-vis spectrophotometer and the advantage of using lower sample concentrations due to the inherent sensitivity of fluorescence spectroscopy. For these reasons, excitation intensity (Iex) can serve as a more useful metric for quantifying molecular brightness.
In the absence of ET processes, we propose that the emission chromaticity of a multicomponent PL system can be approximated as a linear combination of each PL component's CIE coordinates (x,y) and their respective contribution or relative brightness (ai) (eqn (1)). Herein, we define each component's contribution or relative brightness (ai) as the product of the ith components mole fraction (χi), photoluminescent quantum yield (ϕi), and excitation intensity (Iex,i) at a common wavelength (eqn (2)).
| (xmix, ymix) = a1(x1, y1) + a2(x2, y2) +⋯+ ai(xi,yi) | 1 |
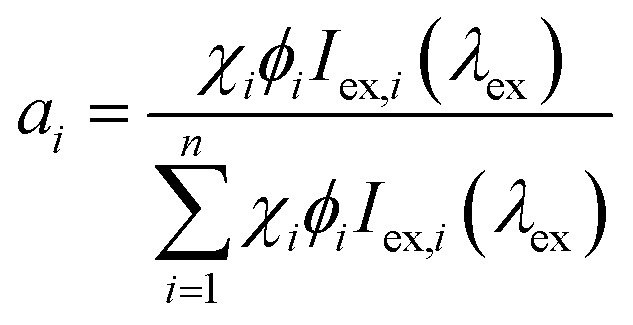 |
2 |
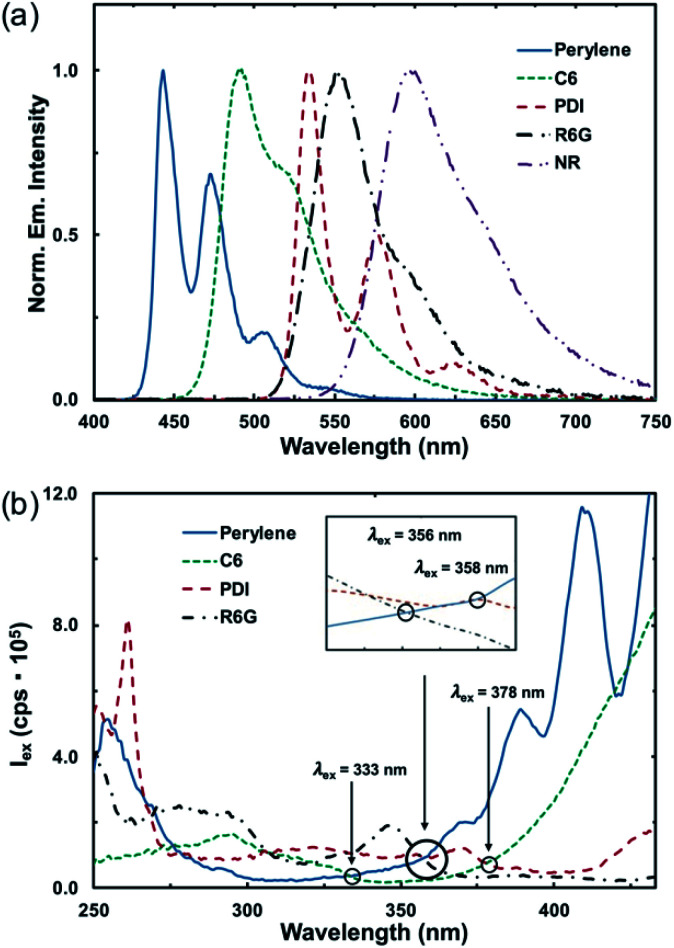
To test whether the emission chromaticity of a multicomponent PL system can be described as a linear combination of its components, various commercially available PL emitters including perylene, coumarin 6 (C6), N,N′-bis(3-pentyl)perylene-3,4,9,10-bis(dicarboximide) (PDI), Rhodamine 6G (R6G), and Nile Red (NR) were chosen and subsequently evaluated. Equimolar solutions of each emitter in chloroform (c = 1.2 × 10⁻⁶ M) were prepared, and both emission and excitation profiles were obtained at room temperature (Fig. 1a and b; S2–S11, ESI†). The emission maximum (Table 1) of each emitter was identified and then used to record the corresponding emitter's excitation spectrum (p. S3, ESI†).
Fig. 1. (a) Overlaid normalized emission profiles of perylene, C6, R6G, PDI, and NR in chloroform. (b) Overlaid excitation profiles of perylene (λem = 443 nm), C6 (λem = 491 nm), R6G (λem = 552 nm), and PDI (λem = 534 nm) in chloroform (c = 1.2 × 10⁻⁶ M). Common excitation wavelengths (λex) in which two emitters share similar intensities (Iex) are highlighted.
Compiled photophysical data of PL emitters used in this worka.
| PL emitter | λem (nm) | ϕ PL b | CIE (x,y) | Entry | Iex (cps) | |||||
|---|---|---|---|---|---|---|---|---|---|---|
| 1 | 2 | 3 | 4 | 5 | 6 | |||||
| λex 333 nm | λex 347 nm | λex 356 nm | λex 358 nm | λex 378 nm | λex 389 nm | |||||
| Perylene | 443 | 0.92 | 0.14, 0.09 | 38 170 | 40 840 | 92 770 | 92 900 | — | 54 310 | |
| C6 | 491 | 0.92 | 0.19, 0.53 | 35 630 | — | — | — | 70 342 | 14 860 | |
| PDI | 534 | 0.67 | 0.37, 0.61 | — | — | — | 92 670 | 76 520 | — | |
| R6G | 552 | 1 | 0.42, 0.57 | — | — | 100 800 | — | — | — | |
| NR | 597 | 0.91 | 0.60, 0.39 | — | 39 300 | — | — | — | — | |
Reported solution data was measured in aerated chloroform (c = 1.2 × 10⁻⁶ M) at room temperature. CIE coordinates (x,y) were extracted from the emission profiles using the Fluoracle® software package.
Absolute photoluminescence quantum yields (ϕPL) were obtained using an Edinburgh FS5 spectrofluorometer equipped with an SC-30 integrating sphere.
We then compared each PL components' excitation intensity (Iex) at common wavelengths (Table 1, entries 1–6) within a given system. Consequently, this allowed us to scale each PL component's contribution or relative brightness (eqn (2)) with respect to any excitation wavelength (λex) that is used to excite the system. However, for our initial experiments, an excitation wavelength for each system was chosen such that each emitter shared approximately the same excitation intensity (Iex)—corresponding to the region where the excitation spectra overlap for each respective system (Fig. 1b). Since the excitation intensities for each component were approximately the same (Table 1, entries 1–5), we expected that any observed difference in emission chromaticity would largely depend on the differences in quantum yields and mole fractions of each PL component.
Two-component PLCT
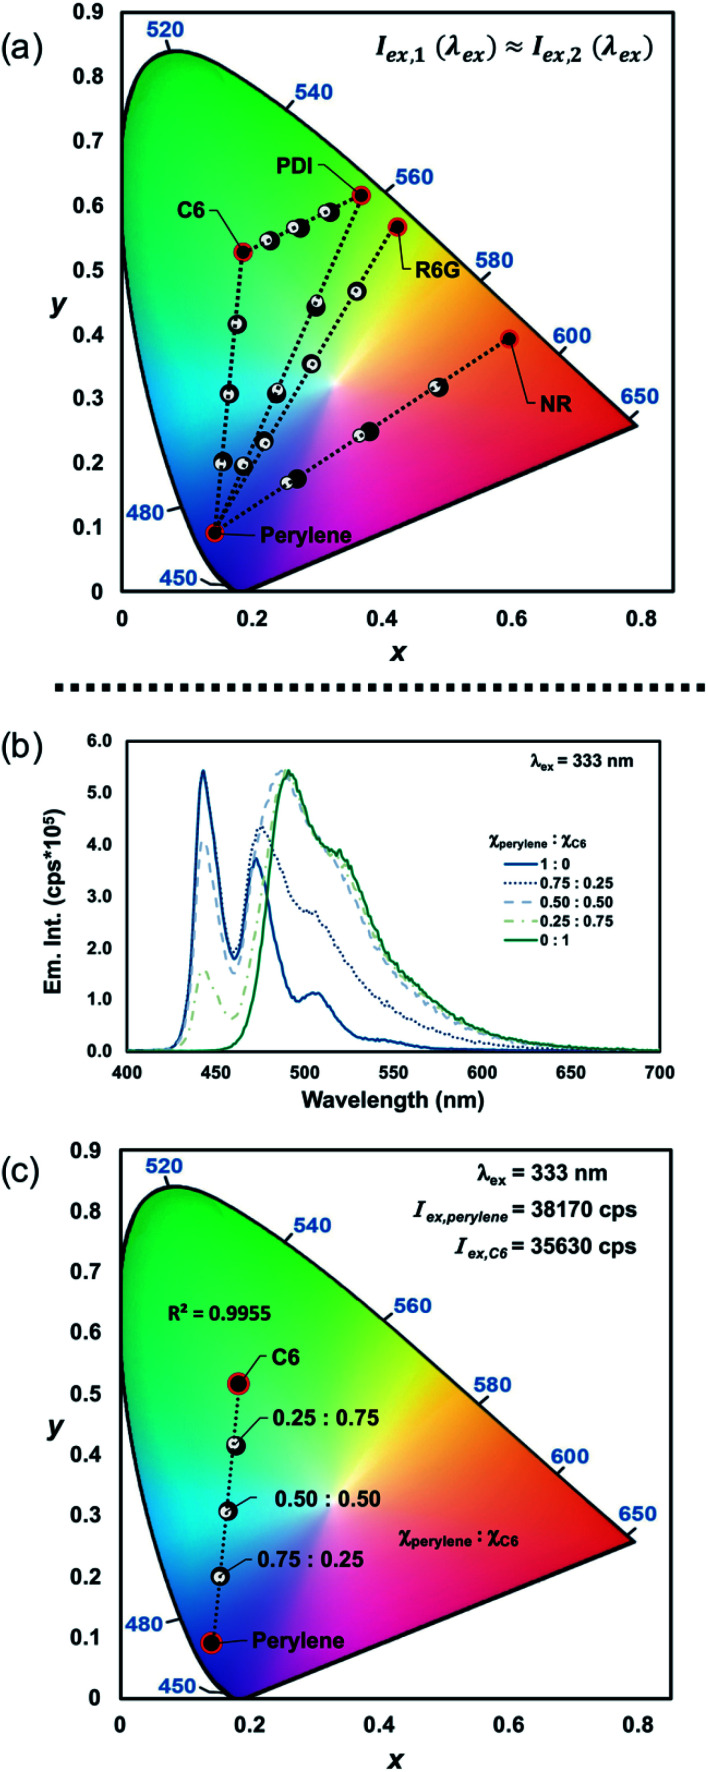
We subsequently prepared mixtures with varying mole fractions (χ1 : χ2 = 1 : 0, 0.75 : 0.25, 0.50 : 0.50, 0.25 : 0.75, 0 : 1) of five different dichromic systems (perylene–C6, perylene–PDI, perylene–R6G, perylene–NR, and PDI–C6) and measured their emission spectra. A total molecular concentration of 1.2 × 10⁻⁶ M was chosen to suppress the efficiency of any potential ET processes occurring in solution, such as FRET, which can occur up to 100 angstroms.24 As a result, the average distance between molecules can be approximated to be greater than 1000 angstroms for our studies (Fig. S1, ESI†). By selecting an excitation wavelength (λex) in which each component had similar excitation intensities (Iex), the differences in the measured emission chromaticity were shown to be linearly proportional to the mole fraction (χ) and PLQY (ϕPL) of each component (R2 > 0.98; Fig. S12–S30, ESI†). The experimentally determined CIE coordinates were then compared to the predicted results obtained using eqn (1) (Tables S1–S7, ESI†). To measure the accuracy of the approximation, absolute errors were quantified based on the distance between the measured and predicted CIE coordinates. For all five dichromic PL systems that were explored in this study, the distance between the measured and predicted CIE coordinates never exceeded 0.02 au, which demonstrates that emission chromaticity within these systems can be accurately described as a linear combination of each PL component (Fig. 2a; Tables S1–S7, ESI†). Based on this result, dichromic PL systems can be used to design emissive materials with any desired chromaticity (x,y), given that it traverses the line between each component by simply adjusting the mole fractions (χ) of the PL components.
Fig. 2. (a) CIE diagram showing the measured (●) and predicted (○) CIE coordinates obtained from mixtures of perylene–C6 (λex = 333 nm), C6–PDI (λex = 378 nm; Iex,C6 ≈ Iex,PDI), perylene–PDI (λex = 358 nm; Iex,perylene ≈ Iex,PDI), perylene–R6G (λex = 347 nm; Iex,perylene ≈ Iex,R6G), and perylene–NR (λex = 356 nm; Iex,perylene ≈ Iex,NR) with varying mole fractions. (b) Overlaid emission spectra of perylene–C6 (λex = 333 nm; Iex,perylene ≈ Iex,C6) with varying mole fractions and (c) the corresponding CIE diagram showing the measured (●) and predicted (○) CIE coordinates.
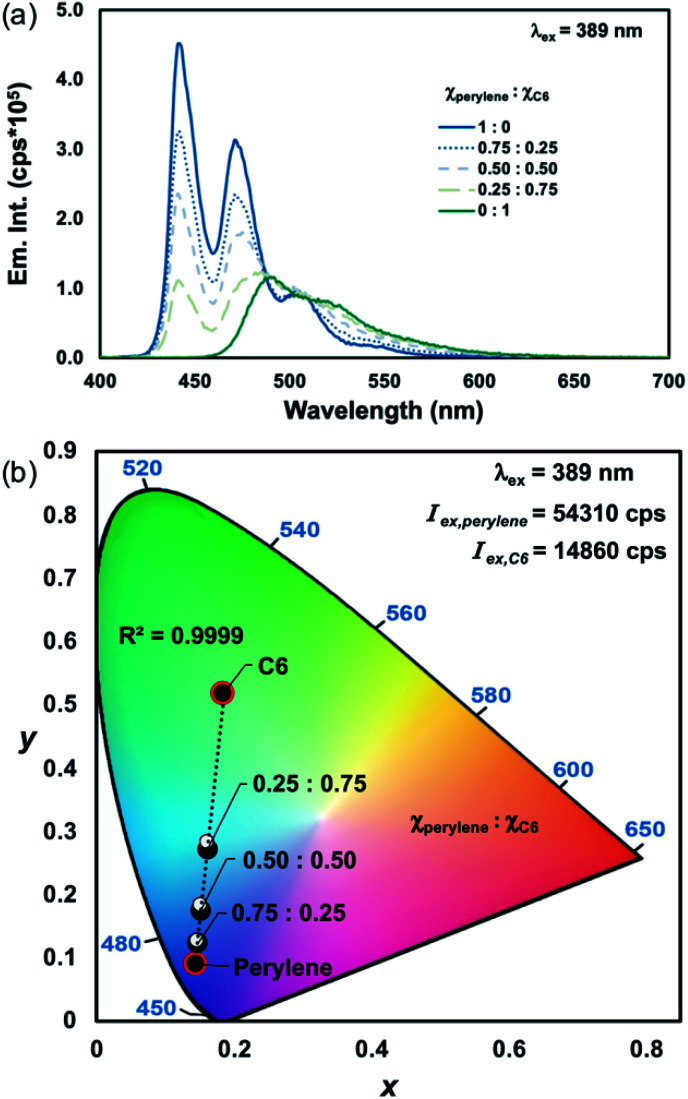
A linear relationship between excitation wavelength and the emission CIE coordinates of homometallic Ln(iii)-complexes has previously been established.17 By varying the excitation wavelength, each component's contribution to the overall chromaticity can be controlled due to their differences in excitation intensity. Therefore, we wanted to show that by accounting for the relative differences in excitation intensities of each PL component, the emission chromaticity resulting from excitation at any wavelength can still be approximated as a linear combination of each emitter. To demonstrate this, the mixtures of perylene and C6 that were excited at 333 nm (Iex,perylene ≅ Iex,C6; Table 1, entry 1), shown in Fig. 2a–c, were excited at 389 nm (Iex,perylene ≠ Iex,C6; Table 1, entry 6) for comparison.
At λex = 333 nm, perylene and C6 have approximately the same excitation intensities (Table 1, entry 1), and therefore the emission chromaticity is shown to be primarily dependent on the differences in mole fractions and PLQYs of each emitter (Fig. 2a–c, S13 and S14, ESI†). In comparison, when the same mixtures of perylene and C6 are excited at 389 nm, a blue shift is observed in the emission chromaticity that is proportional to the difference in the excitation intensities of perylene and C6 (Table 1, entry 6; Fig. 3a, b and S15, S16, ESI†). Good agreement between the measured and predicted CIE coordinates (abs. error < 0.01 au; Tables S1 and S2, ESI†) was obtained by accounting for the different excitation intensities, mole fractions, and PLQYs of perylene and C6. Based on these results, not only is PLCT possible but any desired emission chromaticity that traverses the 1D-line between two PL components can be targeted by (1) adjusting the mole fractions of the components or (2) strategic selection of an excitation wavelength.
Fig. 3. (a) Perylene–C6 emission profiles (λex = 389 nm) with varying mole fractions in chloroform (c = 1.2 × 10⁻⁶ M) and (b) the corresponding CIE diagram showing the measured (●) and predicted (○) CIE coordinates.
Excitation dependant PLCT
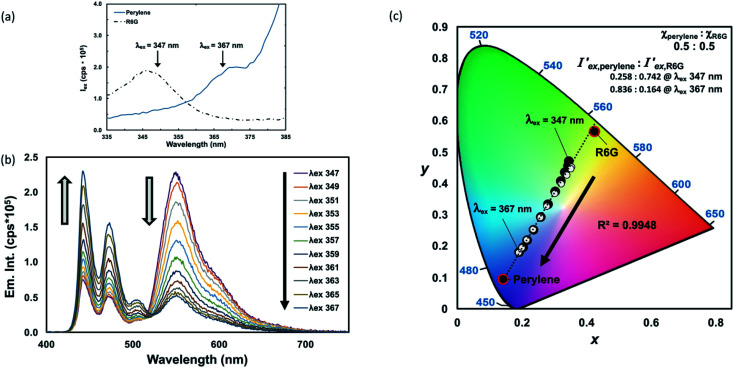
To further illustrate the significance of excitation-based PLCT, while also verifying that the approximation is accurate across a wide range of excitation wavelengths, a mixture of perylene and R6G with equal mole fractions was excited at various wavelengths between 347–367 nm at 2 nm intervals (Fig. 4a–c). Given that there is a suitable overlapping region in the excitation profile of the components, as is the case for perylene and R6G between 347–367 nm (Fig. 4a), emission chromaticity spanning considerable distances can be accessed by merely controlling the excitation wavelength (Fig. 4c). Based solely on the differences in excitation intensities of the emitters at different wavelengths (Table S6, ESI†), the emission is tuned from yellow-green to blue by simply adjusting the excitation wavelength from 347–367 nm at 2 nm intervals (Fig. 4b and c). This result was supported by an observed dependence between the excitation intensities of the components and the resulting emission chromaticity (R2 = 0.9975; Fig. S27, ESI†). When exciting the perylene–R6G mixture using 347 nm light, R6G's emission is the major contributor primarily due to its larger excitation intensity—conversely, exciting the mixture using 367 nm light results in a chromaticity mainly composed of perylene's blue emission (Fig. 4a). In addition, near-WLE was observed by exciting the perylene–R6G mixture at 355 nm (0.30, 0.37) and 357 nm (0.28, 0.34) (Table S6, ESI†).26 Good agreement between the measured and predicted CIE coordinates was obtained (Table S6, ESI†). Admittedly, the CIE coordinates appear to deviate from linearity as the excitation wavelength decreased (Fig. 4c). The non-linearity led to an increase in distance between the measured and predicted CIE coordinates (approx. 0.02 au; Table S6, ESI†), however, this may be attributed to thermal blooming, a beam-defocusing effect that has been observed when studying R6G.25
Fig. 4. (a) Overlaid excitation profiles of perylene and R6G in chloroform (c = 1.2 × 10⁻⁶ M) showing the region of interest. (b) Perylene–R6G emission profiles in chloroform (c = 1.2 × 10⁻⁶ M) obtained at various excitation wavelengths (347–367 nm, 2 nm intervals) and (c) the corresponding CIE diagram showing the measured (●) and predicted (○) CIE coordinates. Relative excitation intensities of perylene  and R6G
  were calculated using the intensities shown in Table S6, ESI.†.
Three-component PLCT (WLE)
We have demonstrated that in the absence of ET, the emission chromaticity of dichromic PL systems is accurately predicted as a linear combination of its components and their corresponding properties (eqn (1) and eqn (2)). Granted that ET continues to be suppressed, this principle can be applied to systems consisting of any number of PL emitters. As illustrated, dichromic PLCT is limited to colors that traverse the 1D-line connecting the two PL emitters. However, by incorporating three or more PL emitters, a 2D color space or gamut defined by the CIE-coordinates of each PL component is formed (Fig. S34, ESI†). Analogous to dichromic PLCT, access to any chromaticity that resides within the 2D color space is achieved by controlling the contribution or relative brightness (ai) of each PL component that defines the space—which we have shown is possible by (1) adjusting the composition (χi) of each component or (2) varying the excitation wavelength used to excite the system. Using this approach, we aimed to target highly desirable WLE (CIE = 0.33, 0.33) using a pre-determined combination of RGB emitters (perylene, C6, and NR, respectively). Despite there being many examples of mixing three primary or two complementary PL coloured emitters to access WLE, to the best of our knowledge, there has not been an example in which the composition of the RGB emitters that are necessary to achieve WLE is pre-determined based on the properties (χi, ϕi, and Iex,i(λex)) of each emitter.
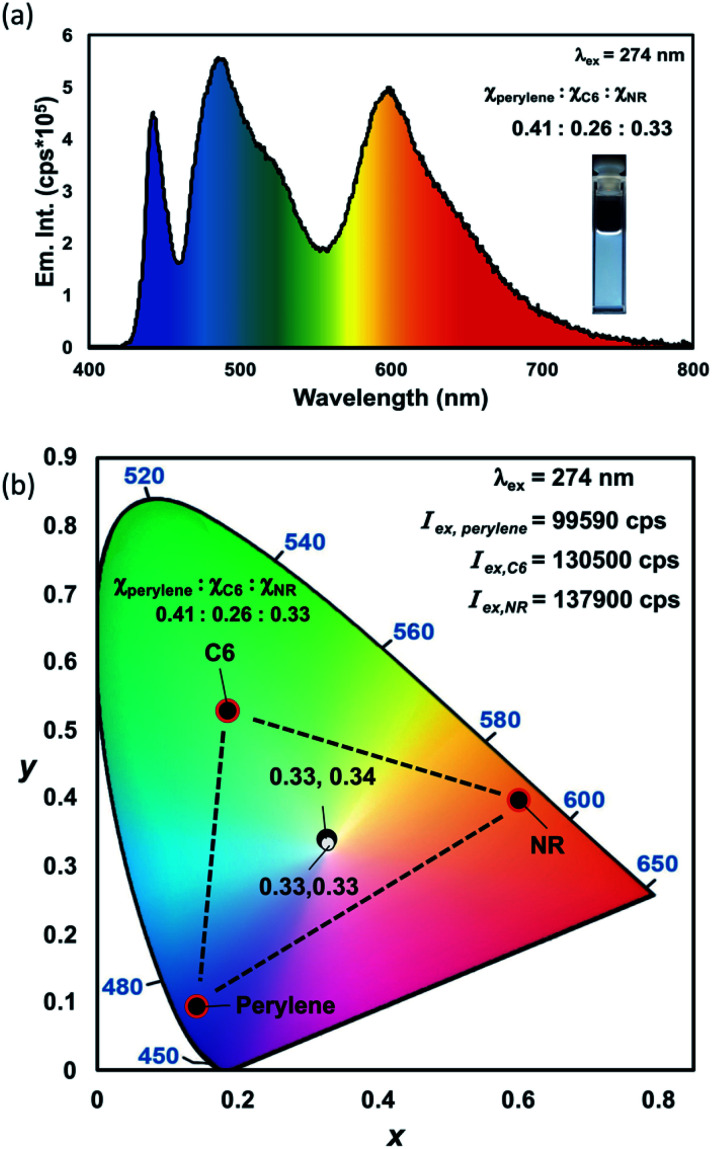
By treating the ideal WLE coordinates as a barycenter, we calculated the normalized contributions of perylene (a1 = 0.34), C6 (a2 = 0.28), and NR (a3 = 0.38) that are required to achieve WLE (Fig. S34; eqn (S3)–(S7), ESI†). Subsequently, an excitation wavelength was chosen wherein each PL component had comparatively high intensities (λex = 274 nm; Iex,perylene = 99 590 cps, Iex,C6 = 130 500 cps, and Iex,NR = 137 900 cps; Fig. S35, ESI†). However, it should be noted that any excitation wavelength in which each PL component has a non-zero intensity could have been chosen. Next, we determined the necessary mole fractions of perylene (χperylene = 0.41), C6 (χC6 = 0.26), and NR (χNR = 0.33) by selecting an arbitrary concentration of perylene and calculating the corresponding concentrations of C6 and NR needed to satisfy their contribution requirements (p. S28, ESI†). We then acquired the emission spectrum of a mixture of perylene–C6–NR (0.41 : 0.26 : 0.33) in chloroform, and as expected, the mixture's emission spectrum spanned the entire visible region and consisted of each emitter's characteristic emission profile (Fig. 5a). Moreover, the CIE coordinate (0.33,0.34) resulting from exciting the mixture at 274 nm was exceptionally close (<0.01 au) to the ideal WLE coordinate (0.33,0.33) that was targeted (Fig. 5b).
Fig. 5. (a) The emission spectrum (λex = 274 nm) of the perylene–C6–NR mixture (χperylene : χC6 : χNR = 0.41 : 0.26 : 0.33) in chloroform (c = 1.2 × 10⁻⁶ M) and (b) the corresponding CIE diagram showing the measured (●) and targeted (○) CIE coordinates. The inset showing the WLE produced by the perylene–C6–NR mixture was irradiated at 365 nm using a TLC lamp.27.
Conclusion
To summarize, we demonstrated that in the absence of significant ET and quenching processes, the emission chromaticity of a multicomponent PL system can be described as a linear combination of each component's CIE coordinates and corresponding brightness (eqn (1) and (2)). However, until an effective strategy is developed to inhibit ET processes, the accuracy and predictive power of this approach is currently limited to dilute solutions. Predictable PLCT in five dichromic PL systems (perylene–C6, perylene–PDI, perylene–R6G, perylene–NR, and C6–PDI) was shown by adjusting (1) the mole fractions of each component and (2) the excitation wavelength used to excite the system. Linear dependences of χi, ϕi, and Iex,i with emission chromaticity was established, and good agreement between the measured and predicted CIE coordinates was obtained. This approach was extended to trichromic PL systems wherein we showed that the composition of perylene–C6–NR needed to access WLE could be pre-determined. Using this method, emissive materials with any desired emission colour can be targeted by strategically combining PL emitters. In addition, devices with programmable PL colour are achievable using excitation wavelength as an input to control the resulting colour.
Data availability
All experimental details supporting this article are provided in the ESI.†
Author contributions
J. P. conceived the idea and prepared the manuscript. J. P. and B. B. performed all experiments and investigations. S. E. and B. A. B. co-supervised this work. B. A. B. provided the instrumentation required for the measurements. S. E. acquired the financial support and resources for the project. All authors discussed the results, provided scientific input, and peer-reviewed the manuscript.
Conflicts of interest
There are no conflicts to declare.
Supplementary Material
Acknowledgments
All authors thank Natural Sciences and Engineering Research Council of Canada (NSERC - RGPIN-2017-04462) and the New Brunswick Innovation Foundation (RIF 2018-034) for support of this work.
Electronic supplementary information (ESI) available. See DOI: 10.1039/d1sc03447b
References
- Pan M. Liao W.-M. Yin S.-Y. Sun S.-S. Su C.-Y. Chem. Rev. 2018;118:8889–8935. doi: 10.1021/acs.chemrev.8b00222. [DOI] [PubMed] [Google Scholar]
- Müller-Buschbaum K. Beuerle F. Feldmann C. Microporous Mesoporous Mater. 2015;216:171–199. doi: 10.1016/j.micromeso.2015.03.036. [DOI] [Google Scholar]
- Ding H. Yu S.-B. Wei J.-S. Xiong H.-M. ACS Nano. 2016;10:484–491. doi: 10.1021/acsnano.5b05406. [DOI] [PubMed] [Google Scholar]
- Wang Q. Zhang Q. Zhang Q.-W. Li X. Zhao C.-X. Xu T.-Y. Qu D.-H. Tian H. Nat. Commun. 2020;11:158. doi: 10.1038/s41467-019-13994-6. [DOI] [PMC free article] [PubMed] [Google Scholar]
- Zhu C. N. Bai T. Wang H. Bai W. Ling J. Sun J. Z. Huang F. Wu Z. L. Zheng Q. ACS Appl. Mater. Interfaces. 2018;10:39343–39352. doi: 10.1021/acsami.8b12619. [DOI] [PubMed] [Google Scholar]
- Hou X. Ke C. Bruns C. J. McGonigal P. R. Pettman R. B. Stoddart J. F. Nat. Commun. 2015;6:6884. doi: 10.1038/ncomms7884. [DOI] [PMC free article] [PubMed] [Google Scholar]
- Zuo M. Qian W. Li T. Hu X.-Y. Jiang J. Wang L. ACS Appl. Mater. Interfaces. 2018;10:39214–39221. doi: 10.1021/acsami.8b14110. [DOI] [PubMed] [Google Scholar]
- Ji X. Chen W. Long L. Huang F. Sessler J. L. Chem. Sci. 2018;9:7746–7752. doi: 10.1039/C8SC03463J. [DOI] [PMC free article] [PubMed] [Google Scholar]
- Wei K. Wen G. Zhao Y. Lin Z. Mei X. Huang L. Ling Q. J. Mater. Chem. C. 2016;4:9804–9812. doi: 10.1039/C6TC03348B. [DOI] [Google Scholar]
- Balónová B. Martir D. R. Clark E. R. Shepherd H. J. Zysman-Colman E. Blight B. A. Inorg. Chem. 2018;57:8581–8587. doi: 10.1021/acs.inorgchem.8b01326. [DOI] [PubMed] [Google Scholar]
- Ono T. Hisaeda Y. J. Mater. Chem. C. 2019;7:2829–2842. doi: 10.1039/C8TC06165C. [DOI] [Google Scholar]
- Muhamad Sarih N. Myers P. Slater A. Slater B. Abdullah Z. Tajuddin H. A. Maher S. Sci. Rep. 2019;9:11834. doi: 10.1038/s41598-019-47847-5. [DOI] [PMC free article] [PubMed] [Google Scholar]
- Park Y. I. Postupna O. Zhugayevych A. Shin H. Park Y.-S. Kim B. Yen H.-J. Cheruku P. Martinez J. S. Park J. W. Tretiak S. Wang H.-L. Chem. Sci. 2015;6:789–797. doi: 10.1039/C4SC01911C. [DOI] [PMC free article] [PubMed] [Google Scholar]
- Wang R. Peng J. Qiu F. Yang Y. Chem. Commun. 2011;47:2787–2789. doi: 10.1039/C0CC04955G. [DOI] [PubMed] [Google Scholar]
- Kumari B. Paramasivam M. Dutta A. Kanvah S. ACS Omega. 2018;3:17376–17385. doi: 10.1021/acsomega.8b02775. [DOI] [PMC free article] [PubMed] [Google Scholar]
- Ayscue R. L. Verwiel C. P. Bertke J. A. Knope K. E. Inorg. Chem. 2020;59:7539–7552. doi: 10.1021/acs.inorgchem.0c00405. [DOI] [PubMed] [Google Scholar]
- Liao W.-M. Li C.-J. Wu X. Zhang J.-H. Wang Z. Wang H.-P. Fan Y.-N. Pan M. Su C.-Y. J. Mater. Chem. C. 2018;6:3254–3259. doi: 10.1039/C8TC00458G. [DOI] [Google Scholar]
- Wang W. Wang R. Ge Y. Wu B. RSC Adv. 2018;8:42100–42108. doi: 10.1039/C8RA06793G. [DOI] [PMC free article] [PubMed] [Google Scholar]
- Schanda J., Colorimetry: understanding the CIE system, John Wiley & Sons, Inc., Hoboken, N.J, 2007 [Google Scholar]
- Manna B. Nandi A. Ghosh R. Photochem. Photobiol. Sci. 2019;18:2748–2758. doi: 10.1039/C9PP00272C. [DOI] [PubMed] [Google Scholar]
- Nara M. Orita R. Ishige R. Ando S. ACS Omega. 2020;5:14831–14841. doi: 10.1021/acsomega.0c01949. [DOI] [PMC free article] [PubMed] [Google Scholar]
- Peng J. Chen M. Qiu F. Yang Y. Sohn B.-H. Kim D. H. Appl. Phys. Lett. 2008;93:183303. doi: 10.1063/1.3000605. [DOI] [Google Scholar]
- Piatkevich K. D. Verkhusha V. V. Methods Cell Biol. 2011;102:431–461. doi: 10.1016/B978-0-12-374912-3.00017-1. [DOI] [PMC free article] [PubMed] [Google Scholar]
- Hussain S. A., arXiv:0908.1815, 2019
- Brouwer A. M. Pure Appl. Chem. 2011;83:2213–2228. [Google Scholar]
- Note that in the case of perylene and R6G, the line connecting the two emitters never actually crosses pure WLE (0.33,0.33). However, one could calculate the coordinate on the line that is nearest to 0.33,0.33, choose an excitation wavelength where each component has a suitable intensity, and then calculate the ratio of emitters that are needed to achieve the CIE coordinate closest to WLE
- CIE diagrams were adapted from Wikimedia Commons, "CIE 1931 Chromaticity Diagram.jpg" by Magica, licensed under CC BY-SA 4.0/ modified border (https://creativecommons.org/licenses/by-sa/4.0/)
Associated Data
This section collects any data citations, data availability statements, or supplementary materials included in this article.
Supplementary Materials
Data Availability Statement
All experimental details supporting this article are provided in the ESI.†


