

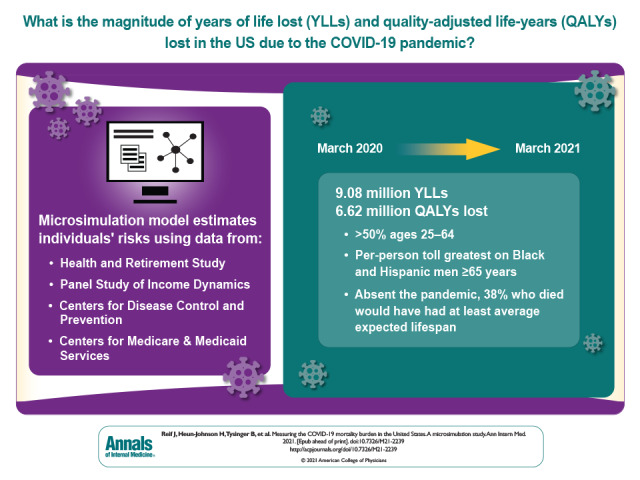
The burden of mortality due to COVID-19 can be estimated in many ways. These authors used a microsimulation model to account for years of life lost and quality-of-life differences. They project 3 cases with different assumptions on who was most affected by COVID-19.
Visual Abstract. Measuring the COVID-19 Mortality Burden.
The burden of mortality due to COVID-19 can be estimated in many ways. These authors used a microsimulation model to account for years of life lost and quality-of-life differences. They project 3 cases with different assumptions on who was most affected by COVID-19.
Abstract
Background:
Fully assessing the mortality burden of the COVID-19 pandemic requires measuring years of life lost (YLLs) and accounting for quality-of-life differences.
Objective:
To measure YLLs and quality-adjusted life-years (QALYs) lost from the COVID-19 pandemic, by age, sex, race/ethnicity, and comorbidity.
Design:
State-transition microsimulation model.
Data Sources:
Health and Retirement Study, Panel Study of Income Dynamics, data on excess deaths from the Centers for Disease Control and Prevention, and nursing home death counts from the Centers for Medicare & Medicaid Services.
Target Population:
U.S. population aged 25 years and older.
Time Horizon:
Lifetime.
Perspective:
Individual.
Intervention:
COVID-19 pandemic through 13 March 2021.
Outcome Measures:
YLLs and QALYs lost per 10 000 persons in the population. The estimates account for the age, sex, and race/ethnicity of decedents, along with obesity, smoking behavior, lung disease, heart disease, diabetes, cancer, stroke, hypertension, dementia, and nursing home residence.
Results of Base-Case Analysis:
The COVID-19 pandemic resulted in 6.62 million QALYs lost (9.08 million YLLs) through 13 March 2021, with 3.6 million (54%) lost by those aged 25 to 64 years. The greatest toll was on Black and Hispanic communities, especially among men aged 65 years or older, who lost 1138 and 1371 QALYs, respectively, per 10 000 persons. Absent the pandemic, 38% of decedents would have had average or above-average life expectancies for their subgroup defined by age, sex, and race/ethnicity.
Results of Sensitivity Analysis:
Accounting for uncertainty in risk factors for death from COVID-19 yielded similar results.
Limitation:
Estimates may vary depending on assumptions about mortality and quality-of-life projections.
Conclusion:
Beyond excess deaths alone, the COVID-19 pandemic imposed a greater life expectancy burden on persons aged 25 to 64 years, including those with average or above-average life expectancies, and a disproportionate burden on Black and Hispanic communities.
Primary Funding Source:
National Institute on Aging.
The COVID-19 pandemic has imposed considerable excess mortality burdens worldwide. In the United States, the Centers for Disease Control and Prevention (CDC) estimates that the pandemic caused 740 247 excess deaths between 22 March 2020 and 13 March 2021. Measuring this mortality burden is critical for identifying vulnerable populations and evaluating pandemic mitigation measures.
However, excess deaths do not readily translate into years of life lost (YLLs), another standard measure of mortality burden (1–3). Because COVID-19 deaths are concentrated among older adults, who have lower life expectancies than young and middle-aged adults, existing estimates of excess pandemic-related death may understate YLLs among younger adults. Moreover, the few extant studies estimating YLLs from the COVID-19 pandemic adjust for age differences but not for common risk factors for death from COVID-19, such as obesity or diabetes, or for quality of life (4–7). These prior YLL estimates may overstate mortality burden if frail persons with shorter life expectancies are more likely to die of COVID-19.
We used an established, validated microsimulation model to estimate YLLs and quality-adjusted life-years (QALYs) lost due to excess pandemic mortality from 22 March 2020 until 13 March 2021 for the U.S. population aged 25 years or older. At the end of our observation window, rates of full COVID-19 vaccination ranged from 8.1% for ages 25 to 39 years to 40.5% for ages 75 years and older, and the 2 predominant COVID-19 variants were Alpha B.1.1.7 (59.5%) and Iota B.1.526 (15.6%) (as of 10 April 2021) (8, 9).
Methods
We used microsimulation to project what life expectancy would have been for a nationally representative cohort of Americans aged 25 years or older if the COVID-19 pandemic had never happened. To compute YLLs and QALYs lost from the pandemic, we identified cohort members who most resembled persons who died of pandemic-related causes and summed the total life-years and QALYs they were projected to have lived absent the pandemic. As illustrated in Figure 1, we pursued 3 analytic approaches to identify such cohort members. The first (“average risk”) analysis assigned equal excess risk for death to all individuals within a subgroup defined by age, sex, and race/ethnicity, an approach similar to subgroup life table analyses (4–7). The second (“individualized risk”) analysis, our preferred approach, allowed risk for death to vary with individual characteristics, health status, and COVID-19 risk factors within such a subgroup. The third (“frailty-based risk”) analysis presumed that the pandemic selectively targeted individuals with the highest projected risk for death in each subgroup and serves as a lower bound for our YLL estimates.
Figure 1. Structure of the microsimulation model.
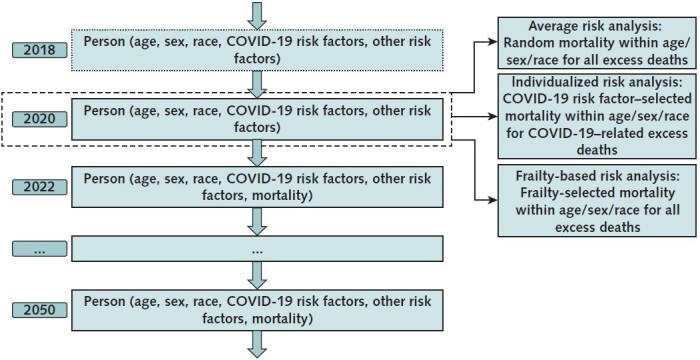
This figure shows how this study uses a microsimulation model of individuals to estimate years of life lost (YLLs) for COVID-19 excess deaths for the U.S. population. The microsimulation is based on the Future Adult Model (FAM) and the Future Elderly Model (FEM), which are used to forecast health outcomes for adults aged 25–54 y and adults aged ≥55 y, respectively, as of 2020. First, these models forecast mortality, quality of life, smoking behavior, and disease incidence at the individual level for a nationally representative population for the 2009–2117 (FAM) and 2016–2086 (FEM) time periods, under the assumption of 0 excess deaths from the COVID-19 pandemic. Second, a fixed number of individuals in the model die during 2020–2021 as a result of the COVID-19 pandemic. For each 5-y age, sex, and race/ethnicity subgroup, this fixed number of decedents is set equal to the number of excess deaths reported by the Centers for Disease Control and Prevention. The average risk analysis assumes that these deaths occurred randomly within the age–sex–race/ethnicity subgroup. The individualized risk analysis assumes that the COVID-19–related excess deaths occurred within the age–sex–race/ethnicity subgroup in proportion to COVID-19 mortality odds ratios for 12 comorbidity risk factors, and that non–COVID-19–related excess deaths occurred based on the (pre–COVID-19) mortality probabilities projected by the microsimulation. The frailty-based risk analysis assumes that, within each subgroup, all excess deaths occurred among the individuals with the highest projected mortality risk, as estimated by the FEM and FAM.
Microsimulation Modeling Steps
Projecting Life Expectancy
We used the Future Elderly Model (FEM) and the Future Adult Model (FAM) to project life expectancy under the assumption of 0 excess deaths from the COVID-19 pandemic. These microsimulation models have been used in prior research to forecast prepandemic disease incidence, functional status, quality of life, smoking behavior, and mortality (10–20). The FEM and FAM use data collected from longitudinal surveys—the Health and Retirement Study (HRS) and the Panel Study of Income Dynamics (PSID), respectively—to forecast disease incidence, smoking behavior, quality of life, and mortality for adults aged 25 years or older (Figure 1; Supplements 2 and 4) (21, 22). The HRS surveys a nationally representative sample of persons older than 50 years, and the PSID surveys a nationally representative sample of all ages. Mortality is measured in these surveys using proxy reports. Quality of life is measured using the EuroQol 5-dimension questionnaire and imputed in the HRS and PSID using variables in common with the Medical Expenditure Panel Survey (Section 3.1 of Supplement 1). Smoking behavior and disease incidence are measured using survey responses.
The FAM simulations started with PSID respondents aged 25 to 44 years in 2009, whose outcomes were simulated through 2021; in each year of the simulation, the sample was replenished with a new cohort of 25-year-olds. This produced a nationally representative sample aged 25 to 54 years in 2020. The FEM simulations began with HRS respondents aged 51 years or older in 2016, whose outcomes were simulated through 2021 (without replenishment), to produce a nationally representative sample aged 55 years or older in 2020. Together, the FEM and FAM output included 28 175 simulants, which when weighted provided a nationally representative sample of the 223 million U.S. adults who were aged 25 years or older and alive as of 1 July 2020. Mortality, quality of life, smoking behavior, and disease incidence for these simulants were then projected into years beyond 2020 on the basis of statistical models estimated from HRS and PSID data on disease incidence, disability, and mortality (Supplements 3 and 5). Projecting lifetime outcomes under the assumption of 0 excess pandemic deaths generated the nonpandemic life expectancy projections used in this study for individuals, subpopulations, and the entire population.
Mortality in the FEM and FAM microsimulations depended on both fixed and time-varying components (Supplements 3 and 5). The fixed components include sex, race/ethnicity, and education. The time-varying components, updated as the simulation progresses, include age, chronic health conditions, functional limitations, and smoking behavior. To account for expected future declines in mortality rates, we applied an adjustment factor from Social Security Administration actuarial forecasts (Section 6 of Supplement 2; Section 3.3 of Supplement 4) (23).
Estimating YLLs and QALYs Lost From the COVID-19 Pandemic
To estimate YLLs and QALYs lost during the pandemic by 5-year age group, sex, and race/ethnicity (White, Black, or Hispanic), we started with weekly data collected from the CDC (Section 1 of Supplement 1). The CDC estimated total excess deaths by comparing deaths in 2020 and 2021 with deaths in prior years and estimated COVID-19–related deaths on the basis of causes of death listed on death certificates. We aggregated these data to estimate total excess deaths and COVID-19–related deaths by 5-year age group, sex, and race/ethnicity over the period 22 March 2020 through 13 March 2021. We defined excess deaths not related to COVID-19 as the difference between total excess deaths and COVID-19–related deaths.
Next, we identified the simulants in our microsimulation model that “experienced” these excess deaths using 3 approaches, described in the following paragraph. In each approach, we computed YLLs and QALYs lost for each simulant who had an excess death by computing their projected life expectancy absent the pandemic. Summing across all simulants yielded our estimate of total YLLs and QALYs lost from excess pandemic deaths. We calculated QALYs lost similarly by incorporating the quality-of-life index, which ranges from 0 to 1, and estimating projected QALYs for each dying simulant. Both YLLs and QALYs lost are undiscounted, which facilitates their comparison and corresponds to traditional YLL calculations (24). Because quality-of-life adjustments can be imperfect (25), we report both YLLs and QALYs lost in our main tables.
The first approach to identifying simulants with excess deaths is the average risk analysis. It presumed that excess risk for death is uniform within each subgroup defined by age, sex, and race/ethnicity. The individualized risk analysis, our second and preferred approach, presumed that risk for death from COVID-19 within each subgroup varies with underlying COVID-19 risk factors identified in U.K. data on COVID-19 deaths. Excess risk for death not related to COVID-19 depended on prepandemic all-cause mortality risk, as estimated by our FEM and FAM microsimulations. The third approach (frailty-based risk analysis) presumed that individuals with the highest prepandemic all-cause mortality risk in each subgroup are also at the highest risk for death during the pandemic. All 3 approaches allocated the same numbers of excess pandemic deaths overall and by age–sex–race/ethnicity subgroup, based on CDC estimates.
To account for individual risk factors for death from COVID-19 in the individualized risk analysis, we used mortality odds ratios (ORs) for 11 comorbidity risk factors from a recent associational study of more than 17 million adults in England (Section 2 of Supplement 1) (26, 27). These estimates were derived from longitudinal electronic medical records from 40% of the population of England, spread geographically across the country. Our analysis includes the following risk factors: body mass index (BMI) of 30 to 35 kg/m2, BMI of 35 to 40 kg/m2, BMI of 40 kg/m2 or higher, former smoking, hypertension, lung disease, heart disease, diabetes mellitus, cancer, stroke, and dementia (Table 1 of Supplement 1). We excluded risk factors that lacked statistically significant (P < 0.05) OR estimates, such as current smoking. The use of electronic medical record data, rather than insurance claims, permits more reliable analysis of smoking status and BMI category (28).
In our simulated cohort, the most influential risk factor, dementia (OR, 3.62), presents in only 2.5% of the population and skews toward the oldest age groups (Figure 1 of Supplement 1). By contrast, moderate risk factors, such as former smoking (OR, 1.26), diabetes mellitus (OR, 1.41), and obesity (BMI of 30 to 35 kg/m2: OR, 1.07; BMI of 35 to 40 kg/m2: OR, 1.44; and BMI ≥40 kg/m2: OR, 2.11), are significantly more prevalent overall and among younger adults. Most of the 2020 U.S. population (72.7%) and adult population aged 25 to 64 years (67.9%) had 1 or more risk factors positively associated with COVID-19 mortality (Figure 1 of Supplement 1).
The counts of COVID-19–related deaths among residents in certified Medicare skilled-nursing facilities and Medicaid nursing facilities up through 13 March 2021 were collected from the Centers for Medicare & Medicaid Services (29). These data were used to calculate a 12th OR for COVID-19 mortality, which was applied to nursing home residents in the microsimulation (Section 2 of Supplement 1).
Microsimulation Model Validation
The mortality and quality-of-life projections produced by the FEM and FAM microsimulation models have been validated in prior research (19, 30). Mortality forecasts line up closely with published death counts and perform at least as well as alternative forecasts used by the Social Security Administration (19). In addition, we did a data-splitting exercise to validate population, smoking behavior, cancer, diabetes, heart disease, hypertension, lung disease, and stroke forecasts using data from before the COVID-19 era (Section 7 of Supplement 2; Section 10 of Supplement 4).
We provide additional validation specific to the COVID-19 context by comparing YLL estimates from the model-based average risk analysis—which does not adjust for comorbidity risk factors—versus analogous YLL estimates calculated using a 2018 period life table from the CDC that reports life expectancy by age, sex, and race/ethnicity (31).
Sensitivity Analysis
We assessed uncertainty around microsimulation parameter estimates via a nonparametric bootstrap that resampled the data underlying the FEM and FAM models (32). We assessed uncertainty in the estimated ORs for COVID-19 mortality by drawing from a multivariate normal distribution (26, 27). The distribution was based on the variance–covariance matrix resulting from estimation of the ORs (Section 3.2 of Supplement 1). We express the propagated uncertainty in our results with 95% uncertainty intervals (UIs).
Role of the Funding Source
The funding source had no role in the design of the study; the collection, analysis, or interpretation of the data; or the decision to approve publication of the finished manuscript.
Results
Table 1 presents the CDC's excess death data for adults aged 25 to 64 years and 65 years or older, by sex and race/ethnicity. A total of 740 247 excess deaths occurred between 22 March 2020 and 13 March 2021, of which 545 324 were classified as COVID-19–related and 194 923 as non–COVID-19–related. Estimates of YLLs and QALYs lost, computed for each analytic approach, appear under “Longitudinal outcomes.” To assess uncertainty in the microsimulation estimates, we report 95% UIs in Tables 2 and 3 of Supplement 1.
Table 1.
YLLs and QALYs Lost Due to the U.S. COVID-19 Pandemic, by Age Group, Sex, and Race/Ethnicity*

Mortality Burden Adjusted for Age, Sex, and Race/Ethnicity Alone
Table 1 presents YLLs based on life expectancies obtained from a 2018 period life table from the CDC that accounts only for age, sex, and race/ethnicity (31). In each subgroup, YLLs equal the number of excess deaths in that subgroup multiplied by the CDC life expectancy estimate. They are analogous to previously published estimates of YLLs due to COVID-19 (4–7). This life table approach estimates 10.68 million total YLLs from the COVID-19 pandemic.
Table 1 also reports estimates from the average risk analysis, which assumes that the COVID-19 pandemic caused deaths at random within subgroups defined by age, sex, and race/ethnicity. This approach estimated 10.56 million YLLs (95% UI, 10.43 million to 10.69 million YLLs), within 1.1% of the life table estimate of 10.68 million YLLs. This concordance provides additional validation of the microsimulation's mortality forecasts over the relevant age–sex–race/ethnicity subgroups. This estimate of 10.56 million YLLs corresponds to 7.96 million QALYs lost after decedents' projected quality of life is accounted for.
Mortality Burden Adjusted for Underlying Risk Factors
Table 1 reports results from the individualized risk analysis, which allowed COVID-19 mortality within each age–sex–race/ethnicity subgroup to vary with individual risk factors. This approach, which provides our preferred estimates, indicates that the COVID-19 pandemic resulted in 6.62 million QALYs lost (95% UI, 6.51 million to 6.73 million QALYs lost) and 9.08 million YLLs, 14% lower than the 10.56 million YLLs reported for the average risk analysis, indicating that persons with COVID-19 risk factors have below-average life expectancy for their subgroup. Adults aged 25 to 64 years lost 213 QALYs (95% UI, 208 to 218 QALYs) per 10 000 persons in the population, compared with 552 QALYs (95% UI, 544 to 560 QALYs) per 10 000 for adults aged 65 years or older. Although excess risk for death per capita was 9.9 times higher for adults over 65 than their under-65 counterparts, individualized QALYs lost per capita were only 2.6 times as high. Adults aged 85 years or older faced 70 times more excess risk for death than those aged 25 to 34 years but only 3.9 times more individualized loss of QALYs per capita (Table 2). This discrepancy remains when the analysis is limited to excess deaths related to COVID-19 (Tables 6 to 8 of Supplement 1).
Table 2.
YLLs and QALYs Lost Due to the U.S. COVID-19 Pandemic, by 10-Year Age Group*

Finally, Table 1 reports YLLs if COVID-19 systematically targeted those with the shortest life expectancies in their subgroups, thereby minimizing YLLs and QALYs lost. This frailty-based risk computation contrasts with the average risk computation, which assumed that excess deaths occurred at random within each subgroup and produced per capita YLLs and QALYs lost equal to mean life expectancies for each subgroup. Because the YLLs estimated in our preferred individualized risk computation lie much closer to the average risk estimates than to the frailty-based risk estimates, these comparisons suggest that the pandemic tends to target persons with close-to-average life expectancy for their subgroup.
Figure 2 explores how decedents' life expectancy in the individualized risk analysis compares with mean life expectancy for their age–sex–race/ethnicity subgroups. The figure plots the probability distribution of the difference between projected life expectancy (assuming 0 excess pandemic deaths) and the CDC-estimated average life expectancy for the relevant subgroup. Positive differences occur for healthier individuals predicted to die of pandemic-related causes despite longer-than-average life expectancy for their subgroup. Most decedents under our analysis had below-average life expectancy for their subgroup (median difference, −1.63 years), but 37.6% (95% UI, 36.6% to 38.6%) had a projected life expectancy equal to or exceeding their subgroup's average. In separate analyses of age, sex, and race/ethnicity subgroups, the fraction of decedents with average or above-average life expectancy ranged from 27.7% (95% UI, 25.9% to 29.5%) (non-White women aged ≥65 years) to 46.3% (95% UI, 44.4% to 48.2%) (White men aged 25 to 64 years) (Figure 5 of Supplement 1).
Figure 2. Predicted YLLs due to the U.S. COVID-19 pandemic, relative to average life expectancy in the decedent's subgroup defined by age, sex, and race/ethnicity.
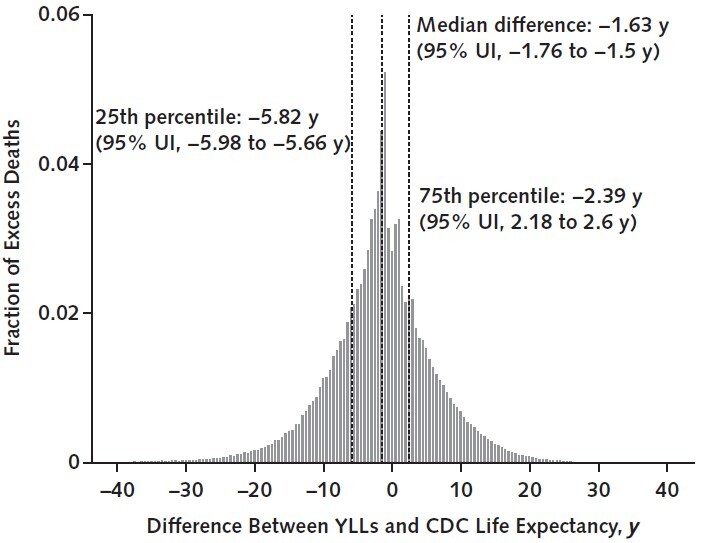
This figure reports the distribution of the difference between the life expectancy of individuals dying in the individualized risk analysis (in the absence of any excess pandemic mortality) and the simulated decedent's age-, sex-, and race/ethnicity–adjusted life expectancy as reported in the 2018 period life table from the CDC. An x-axis value of 0 indicates that the decedent's predicted YLLs, which are estimated by microsimulation under the individualized risk analysis, equals the average CDC life expectancy in their subgroup defined by age, sex, and race/ethnicity. Values greater than 0 correspond to decedents with YLLs above the average CDC life expectancy for their subgroup, whereas values less than 0 correspond to individuals with YLLs below the average CDC life expectancy. The dashed vertical lines report the median, 25th percentile, and 75th percentile of the distribution; 95% UIs for those 3 estimates are given in parentheses in the figure labels. The fraction of decedents with YLLs equal to or exceeding the CDC life expectancy for their subgroup—i.e., with an x-axis value equal to or exceeding 0—is 0.376 (95% UI, 0.366 to 0.386). Across all decedents, the mean difference between their estimated YLLs and their subgroup's CDC life expectancy is −1.81 y (95% UI, −2.00 to −1.62 y) (see text for median). CDC = Centers for Disease Control and Prevention; UI = uncertainty interval; YLL = year of life lost.
Disparities in QALYs Lost
Figure 3 reports QALYs lost per 10 000 persons for groups with various comorbid conditions. These estimates do not control for other risk factors and represent the unconditional average risk faced by persons with the relevant comorbid condition. Nursing home residence and dementia are the 2 biggest risk factors, with mortality burdens ranging from 897 to 1371 QALYs lost per 10 000 persons. For adults aged 65 years or older, the next 2 largest risk factors are history of stroke (752 QALYs lost [95% UI, 720 to 783 QALYs lost] per 10 000) and BMI greater than 40 kg/m2 (733 QALYs lost [95% UI, 674 to 792 QALYs lost] per 10 000). For adults aged 25 to 64 years, the next 2 largest risk factors are history of stroke (378 QALYs lost [95% UI, 341 to 415 QALYs lost] per 10 000) and diabetes (361 QALYs lost [95% UI, 346 to 376 QALYs lost] per 10 000) (Figures 6 and 7 of Supplement 1 provide average risk and frailty-based risk analyses).
Figure 3. Number of QALYs lost per 10 000 persons, by age group and comorbidity.
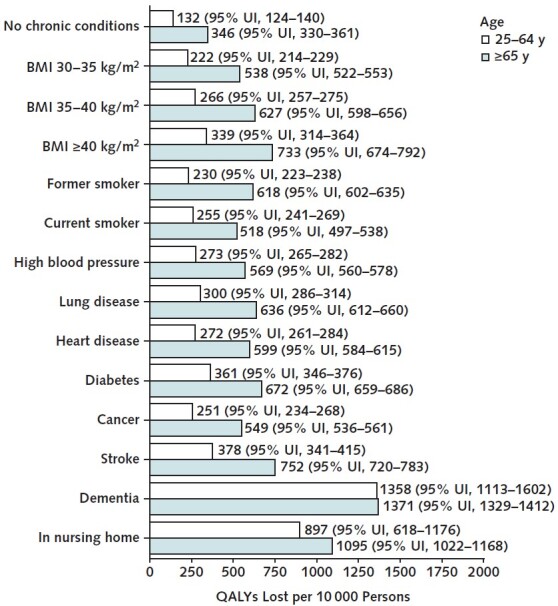
This figure reports the number of QALYs lost from the COVID-19 pandemic among U.S. adults aged 25–64 y and ≥65 y, by comorbidity, over the time period 22 March 2020 through 13 March 2021. 95% UIs are given in parentheses. The estimates are produced by the microsimulation model's individualized risk analysis, which assumes that all COVID-19 excess deaths reported by the Centers for Disease Control and Prevention are distributed within 5-y age, sex, and race/ethnicity groups in proportion to estimated COVID-19 mortality odds ratios for different comorbid conditions. Estimates for dementia and living in a nursing home pertain only to ages ≥55 y. Non–COVID-19–related excess deaths are assumed to occur on the basis of the (pre–COVID-19) mortality probabilities projected by the microsimulation. BMI = body mass index; QALY = quality-adjusted life-year; UI = uncertainty interval.
Table 1 reports QALYs lost per 10 000 persons for adults aged 65 years or older and those aged 25 to 64 years, by sex and race/ethnicity. Compared with similarly aged White populations, the Black and Hispanic populations aged 65 years or older lost about twice as many QALYs per person and those aged 25 to 64 years lost about 3 times as many (Figure 8 of Supplement 1). Hispanic men aged 65 years or older lost 1371 QALYs (95% UI, 1295 to 1447 QALYs) per 10 000, and Black men aged 65 years or older lost 1138 QALYs (95% UI, 1088 to 1189 QALYs) per 10 000. Persons in nursing homes and those with dementia had the largest absolute disparities in QALYs lost per person for the Hispanic and Black populations compared with the White population (Figure 4). We report corresponding estimates for the average risk and frailty-based risk analyses in Figures 9 and 10 of Supplement 1.
Figure 4. Number of QALYs lost per 10 000 persons, by race/ethnicity and comorbidity.
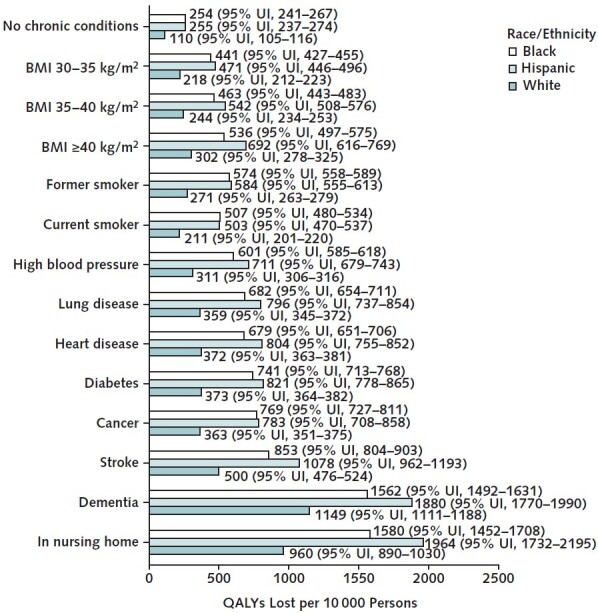
This figure reports the number of QALYs lost from the COVID-19 pandemic among U.S. adults aged ≥25 y, by comorbidity and race/ethnicity, over the time period 22 March 2020 through 13 March 2021. 95% UIs are given in parentheses. The estimates are produced by the microsimulation model's individualized risk analysis, which assumes that all COVID-19 excess deaths reported by the Centers for Disease Control and Prevention are distributed within 5-y age, sex, and race/ethnicity groups in proportion to estimated COVID-19 mortality odds ratios for different comorbid conditions. Estimates for dementia and living in a nursing home pertain only to ages ≥55 y. Non–COVID-19–related excess deaths are assumed to occur on the basis of the (pre–COVID-19) mortality probabilities projected by the microsimulation. BMI = body mass index; QALY = quality-adjusted life-year; UI = uncertainty interval.
Discussion
Our model estimated that the U.S. COVID-19 pandemic resulted in 9.08 million YLLs through 13 March 2021. By comparison, Americans lost an estimated 15.4 million YLLs from cancer and an estimated 14.7 million from cardiovascular diseases in 2019 (33). In approximately 1 year, the COVID-19 pandemic resulted in half the premature mortality caused by all cancer types combined or all cardiovascular diseases combined. Earlier research on the COVID-19 mortality burden has emphasized the much higher death rate among older populations (34, 35). Although excess deaths provide an important measure of mortality burden, calculating YLLs and QALYs lost reveals that the pandemic has also imposed a considerable mortality burden on younger populations. Over our observation window, the pandemic resulted in 4.7 million YLLs for adults aged 25 to 64 years; for comparison, in 2019 adults in this age range lost 6.8 million YLLs, 5.3 million YLLs, 1.9 million YLLs, and 0.61 million YLLs from all cancer types, cardiovascular diseases, self-harm or interpersonal violence, and unintentional injuries, respectively (33). Although the excess mortality rate for the population aged 65 years or older exceeds that of adults aged 25 to 64 years by nearly a factor of 10, this factor falls below 3 when YLLs and QALYs lost are examined.
The number of excess deaths among those aged 25 to 64 years understates their mortality burden relative to those aged 65 years or older because many of those deaths occurred among persons otherwise expected to have near-normal lifespans. Although COVID-19 disproportionately targets those with comorbid conditions, adults aged 25 to 64 years with comorbid conditions still have high life expectancy relative to those aged 65 years or older. The case of obesity, which affects 39.1% of the population aged 25 to 64 years, is instructive (Figure 1 of Supplement 1). Overall, 40-year-olds expect to live 39 more years on average, and 65-year-olds expect 18 more years. Prior studies suggest that obesity reduces life expectancy at age 40 by 6 to 7 years for nonsmokers (36). Thus, the unexpected death of a 40-year-old nonsmoker with obesity takes away 32 to 33 life-years, about 14 to 15 more than an unexpected death for a typical 65-year-old, and COVID-19 increases the otherwise moderate effect of body weight–related risk factors on lifespan.
Black and Hispanic persons bear a disproportionate share of the mortality burden, despite the former having lower age-adjusted life expectancy than White persons. Hispanic men aged 65 years or older lost 2.5 times more QALYs per capita than similarly aged White men, and Hispanic men aged 25 to 64 years lost 3 times more than similarly aged White men. For both Black and Hispanic men, the number of QALYs lost per capita exceeded those associated with all comorbid conditions except dementia and living in a nursing home.
This study has several limitations. Our results exclude deaths that occurred after 13 March 2021 and thus underestimate the total mortality burden of the COVID-19 pandemic. We do not account for the effects of possible morbidity caused by COVID-19 in survivors or for other morbidity effects that may have resulted from the pandemic response. Our analysis relies on recent estimates of the mortality ORs for COVID-19 risk factors from a study of the U.K. population. Validation analyses suggest that these estimates pertain well to the U.S. population, but knowledge about their accuracy and generalizability continues to develop (37). Although our sensitivity analysis suggests that the estimated uncertainty around these variables would not change our qualitative conclusions, major changes could significantly alter our estimates. Our microsimulation's projections of mortality and other health outcomes are based on data from the HRS and PSID. Our data-splitting exercises show that the model's projections perform well before 2020, but it is impossible to know the predictive accuracy of the microsimulation projections for future years. Our estimates are specific to the United States and may not generalize to other countries. However, our methods may be useful to researchers tackling this problem for other countries, provided that data on excess deaths by demographic group and on health characteristics are available. Similarly, our estimates depend on the set of variants circulating during our analysis window and may not generalize to more recent variants of concern, such as Delta B.1.617.2. Finally, although our analysis documents a disproportionately higher mortality burden for Black and Hispanic men, it cannot determine what underlying societal factors cause these differences.
Measuring the mortality burden of the COVID-19 pandemic in terms of YLLs and QALYs lost provides important insights. The adult population aged 25 to 64 years bears a larger share of the total burden of excess COVID-19 mortality than the population aged 65 years or older, despite the latter incurring a significantly larger total number of deaths. Excess mortality rates among adults aged 25 to 64 years were 9.9 times smaller than for adults aged 65 years or older when measured using deaths per capita but only 2.6 times smaller when measured using QALYs lost per capita. Although persons with comorbid conditions face higher risk for death, our analysis nevertheless estimates that more than one third of decedents would have enjoyed normal or better life expectancy compared with their peers of the same age, sex, and race/ethnicity. Efforts to mitigate pandemic harms should include both young and old and should particularly target Black and Hispanic populations.
Supplementary Material
Footnotes
This article was published at Annals.org on 21 September 2021.
References
- 1.Murray CJ , Lopez AD . Measuring the global burden of disease. N Engl J Med. 2013;369:448-57. [PMID: ] doi: 10.1056/NEJMra1201534 [DOI] [PubMed] [Google Scholar]
- 2.Holford TR , Meza R , Warner KE , et al. Tobacco control and the reduction in smoking-related premature deaths in the United States, 1964-2012. JAMA. 2014;311:164-71. [PMID: ] doi: 10.1001/jama.2013.285112 [DOI] [PMC free article] [PubMed] [Google Scholar]
- 3.Johansson-Stenman O , Mahmud M , Martinsson P . Saving lives versus life-years in rural Bangladesh: an ethical preferences approach. Health Econ. 2011;20:723-36. [PMID: ] doi: 10.1002/hec.1627 [DOI] [PubMed] [Google Scholar]
- 4.Wetzler HP, Wetzler EA, Cobb HW. COVID-19: how many years of life lost? medRxiv. Preprint posted online 18 June 2020. doi:10.1101/2020.06.08.20050559
- 5.Elledge SJ. 2.5 million person-years of life have been lost due to COVID-19 in the United States. medRxiv. Preprint posted online 27 October 2020. doi:10.1101/2020.10.18.20214783
- 6.Quast T , Andel R , Gregory S , et al. Years of life lost associated with COVID-19 deaths in the United States. J Public Health (Oxf). 2020;42:717-722. [PMID: ] doi: 10.1093/pubmed/fdaa159 [DOI] [PMC free article] [PubMed] [Google Scholar]
- 7.Mitra AK , Payton M , Kabir N , et al. Potential years of life lost due to COVID-19 in the United States, Italy, and Germany: an old formula with newer ideas. Int J Environ Res Public Health. 2020;17. [PMID: ] doi: 10.3390/ijerph17124392 [DOI] [PMC free article] [PubMed] [Google Scholar]
- 8.Centers for Disease Control and Prevention. Variant proportions. Accessed at https://covid.cdc.gov/covid-data-tracker/#variant-proportions on 6 July 2021.
- 9.Centers for Disease Control and Prevention. Vaccination demographics trends. Accessed at https://covid.cdc.gov/covid-data-tracker/#vaccination-demographics-trends on 6 July 2021.
- 10.Bhattacharya J , Cutler DM , Goldman DP , et al. Disability forecasts and future Medicare costs. Front Health Policy Res. 2004;7:75-94. [PMID: ] [DOI] [PMC free article] [PubMed] [Google Scholar]
- 11.Dzau VJ , Ginsburg GS , Van Nuys K , et al. Aligning incentives to fulfil the promise of personalised medicine. Lancet. 2015;385:2118-9. [PMID: ] doi: 10.1016/S0140-6736(15)60722-X [DOI] [PMC free article] [PubMed] [Google Scholar]
- 12.Goldman D, Michaud PC, Lakdawalla D, et al. The fiscal consequences of trends in population health. Natl Tax J. 2010;63:307-30. doi:10.17310/ntj.2010.2.07
- 13.Goldman DP , Cutler D , Rowe JW , et al. Substantial health and economic returns from delayed aging may warrant a new focus for medical research. Health Aff (Millwood). 2013;32:1698-705. [PMID: ] doi: 10.1377/hlthaff.2013.0052 [DOI] [PMC free article] [PubMed] [Google Scholar]
- 14.Goldman DP , Lakdawalla DN , Malkin JD , et al. The benefits from giving makers of conventional ‘small molecule' drugs longer exclusivity over clinical trial data. Health Aff (Millwood). 2011;30:84-90. [PMID: ] doi: 10.1377/hlthaff.2009.1056 [DOI] [PMC free article] [PubMed] [Google Scholar]
- 15.Goldman DP , Shang B , Bhattacharya J , et al. Consequences of health trends and medical innovation for the future elderly. Health Aff (Millwood). 2005;24 Suppl 2:W5R5-17. [PMID: ] [DOI] [PMC free article] [PubMed] [Google Scholar]
- 16.Goldman DP , Zheng Y , Girosi F , et al. The benefits of risk factor prevention in Americans aged 51 years and older. Am J Public Health. 2009;99:2096-101. [PMID: ] doi: 10.2105/AJPH.2009.172627 [DOI] [PMC free article] [PubMed] [Google Scholar]
- 17.Lakdawalla DN , Goldman DP , Michaud PC , et al. U.S. pharmaceutical policy in a global marketplace. Health Aff (Millwood). 2009;28:w138-50. [PMID: ] doi: 10.1377/hlthaff.28.1.w138 [DOI] [PMC free article] [PubMed] [Google Scholar]
- 18.Lakdawalla DN , Goldman DP , Shang B . The health and cost consequences of obesity among the future elderly. Health Aff (Millwood). 2005;24 Suppl 2:W5R30-41. [PMID: ] [DOI] [PubMed] [Google Scholar]
- 19.Leaf DE , Tysinger B , Goldman DP , et al. Predicting quantity and quality of life with the Future Elderly Model. Health Econ. 2020. [PMID: ] doi: 10.1002/hec.4169 [DOI] [PMC free article] [PubMed] [Google Scholar]
- 20.Michaud PC , Goldman DP , Lakdawalla DN , et al. The value of medical and pharmaceutical interventions for reducing obesity. J Health Econ. 2012;31:630-43. [PMID: ] doi: 10.1016/j.jhealeco.2012.04.006 [DOI] [PMC free article] [PubMed] [Google Scholar]
- 21.Panel Study of Income Dynamics. Institute for Social Research; 2021. Accessed at https://psidonline.isr.umich.edu on 5 August 2019.
- 22.Health and Retirement Study. University of Michigan; 2020. Accessed at https://hrs.isr.umich.edu on 29 August 2019.
- 23.Social Security Administration. The 2016 Annual Report of the Board of Trustees of the Federal Old-Age and Survivors Insurance and Federal Disability Insurance Trust Funds. US Gov Pr Office; 2016.
- 24.Watkins DA , Johnson CO , Colquhoun SM , et al. Global, regional, and national burden of rheumatic heart disease, 1990-2015. N Engl J Med. 2017;377:713-722. [PMID: ] doi: 10.1056/NEJMoa1603693 [DOI] [PubMed] [Google Scholar]
- 25.Attema AE, Brouwer WBF. Constant proportional trade-offs and health state evaluations. In: Michalos AC, ed. Encyclopedia of Quality of Life and Well-Being Research. Springer; 2014. doi:10.1007/978-94-007-0753-5_3839
- 26.Bhaskaran K , Bacon S , Evans SJ , et al. Factors associated with deaths due to COVID-19 versus other causes: population-based cohort analysis of UK primary care data and linked national death registrations within the OpenSAFELY platform. Lancet Reg Health Eur. 2021;6:100109. [PMID: ] doi: 10.1016/j.lanepe.2021.100109 [DOI] [PMC free article] [PubMed] [Google Scholar]
- 27.Williamson EJ , Walker AJ , Bhaskaran K , et al. Factors associated with COVID-19-related death using OpenSAFELY. Nature. 2020;584:430-436. [PMID: ] doi: 10.1038/s41586-020-2521-4 [DOI] [PMC free article] [PubMed] [Google Scholar]
- 28.Snider JT , Bognar K , Globe D , et al. Identifying patients at risk for high medical costs and good candidates for obesity intervention. Am J Health Promot. 2014;28:218-27. [PMID: ] doi: 10.4278/ajhp.121116-QUAN-561 [DOI] [PubMed] [Google Scholar]
- 29.Centers for Medicare & Medicaid Services. COVID-19 nursing home data. Accessed at https://data.cms.gov/Special-Programs-Initiatives-COVID-19-Nursing-Home/COVID-19-Nursing-Home-Dataset/s2uc-8wxp on 26 June 2021.
- 30.Tysinger B. Validating risk factor and chronic disease projections in the Future Adult Model. Int J Microsimul. 2020;13:54-69. doi:10.34196/IJM.00225
- 31.Arias E , Xu J . United States life tables, 2018. Natl Vital Stat Rep. 2020;69:1-45. [PMID: ] [PubMed] [Google Scholar]
- 32.Blaylock B. Essays on the Use of Microsimulation for Health and Economic Policy Analysis. Univ Southern California; 2015.
- 33.Global Burden of Disease Collaborative Network. Global Burden of Disease Study 2019 (GBD 2019) Results. Institute for Health Metrics and Evaluation; 2020. Accessed at http://ghdx.healthdata.org/gbd-results-tool on 20 July 2021.
- 34.Ioannidis JPA , Axfors C , Contopoulos-Ioannidis DG . Population-level COVID-19 mortality risk for non-elderly individuals overall and for non-elderly individuals without underlying diseases in pandemic epicenters. Environ Res. 2020;188:109890. [PMID: ] doi: 10.1016/j.envres.2020.109890 [DOI] [PMC free article] [PubMed] [Google Scholar]
- 35.Yanez ND , Weiss NS , Romand JA , et al. COVID-19 mortality risk for older men and women. BMC Public Health. 2020;20:1742. [PMID: ] doi: 10.1186/s12889-020-09826-8 [DOI] [PMC free article] [PubMed] [Google Scholar]
- 36.Peeters A , Barendregt JJ , Willekens F , et al; NEDCOM, the Netherlands Epidemiology and Demography Compression of Morbidity Research Group. Obesity in adulthood and its consequences for life expectancy: a life-table analysis. Ann Intern Med. 2003;138:24-32. [PMID: ] [DOI] [PubMed] [Google Scholar]
- 37.Jin J , Agarwala N , Kundu P , et al. Individual and community-level risk for COVID-19 mortality in the United States. Nat Med. 2021;27:264-269. [PMID: ] doi: 10.1038/s41591-020-01191-8 [DOI] [PubMed] [Google Scholar]
Associated Data
This section collects any data citations, data availability statements, or supplementary materials included in this article.