

Abstract
Acute liver damage causes hepatocyte stress and death, but in chronic liver disease impaired hepatocyte regeneration and immune cell infiltration prevents recovery. While the roles of both impaired liver regeneration and immune infiltration have been studied extensively in chronic liver diseases, the differential contribution of these factors is difficult to assess. We combined single-cell RNA-seq data from healthy livers and peripheral immune cells to measure cell proportions in chronic liver diseases. Using bulk RNA-seq data from patients with early alcohol-associated hepatitis (EAH), severe AH (sAH), Hepatitis C (HCV), HCV with cirrhosis, and non-alcohol-associated fatty liver disease (NAFLD), we performed gene deconvolution to predict the contribution of different cell types in each disease. Patients with sAH had the greatest change in cell composition, with increases in both periportal hepatocytes and cholangiocyte populations. Interestingly, while central vein hepatocytes were decreased, central vein endothelial cells were expanded. Endothelial cells are thought to regulate liver regeneration through WNT signaling. WNT2, important in central vein hepatocyte development, was down in sAH, while multiple other WNTs and WNT receptors were upregulated. Immunohistochemistry revealed upregulation of FZD6, a noncanonical WNT receptor, in hepatocytes in sAH. Immune cell populations also differed in disease. In sAH, a specific group of inflammatory macrophages was increased and distinct from the macrophage population in patients with HCV. Network and correlation analyses revealed that changes in the cell types in the liver were highly correlated with clinical liver function tests. In conclusion, these results identify distinct changes in the liver cell populations in chronic liver disease and illustrate the power of utilizing single-cell RNA-seq data from a limited number of samples in understanding multiple different diseases.
Keywords: Single-cell-RNA-sequencing, Liver Regeneration, Alcohol-associated Hepatitis, Gene Deconvolution, Transcriptomics
Introduction
The adult liver is the only fully regenerative organ in the body and plays a critical role in the immune system to defend against gut-derived pathogens1,2. The liver is made up of many cell types; hepatocytes make up a majority of the liver and are supported by liver sinusoidal endothelial cells (LSECs), bile duct cells called cholangiocytes, and hepatic stellate cells. The liver immune system is made up of resident macrophages, also called Kupffer cells, NK cells, and plasma B-cells and many peripheral immune cells including infiltrating monocytes, neutrophils, and T-cells.
The functional unit of the liver is the hepatic lobule consisting of the central vein in the center and portal triads surrounding it3. The portal triad includes the portal vein, which delivers gut contents, the hepatic artery, which is the source of peripheral immune cells from circulation, and the bile duct. Material from the portal vein and hepatic artery moves through the liver sinusoid and exits through the central vein. Hepatocytes provide an epithelial-like barrier between the portal vein and the bile ducts to transport metabolic byproducts between the two4. The hepatic lobule is zonated; hepatocytes associated with the portal triad express very different genes and have very different functions from those closer to the central vein3. Recent single-cell RNA-seq (scRNA-seq) data have found that gene expression varies considerably from portal vein to central vein, for both hepatocytes and LSECs, creating a gradient of gene expression5–9.
During normal homeostasis, damaged hepatocytes are removed by Kupffer cells. Due to the immunotolerant nature of the liver, this process does not lead to an inflammatory response or long term adaptive immunity. Lost hepatocytes are replaced by dividing neighbors, independent of zonation10,11. During chronic liver disease, liver progenitor cells (LPCs) adjacent to the portal vein activate and, due to their bipotential nature, LPCs can become either new hepatocytes or cholangiocytes1,12. Activation of the LPCs, called the ductular response, is associated with increased severity and mortality among patients with severe alcohol-associated hepatitis (sAH)13–15, chronic Hepatitis C infection (HCV)16, and non-alcohol-associated fatty liver disease (NAFLD)17. Additionally, LPC expansion is observed in numerous rodent models for chronic liver diseases and liver toxicity, but the source of these LPCs is controversial18. Chronic disease models in rodents have found that hepatocytes themselves contribute significantly to the ductular response, as hepatocytes are able to de-differentiate into bipotential precursors or trans-differentiate into ductular cells19–22. Many chronic liver diseases are also superimposed with inflammation, resulting from increased infiltration of peripheral immune cells. In fact, the ductular response is often highly associated with inflammation; for example, patients with non-alcohol-associated steatohepatitis (NASH) have more liver progenitor cells than patients with NAFLD16. While LPCs are also associated with fibrosis and cirrhosis, the possibility that inflammation activates LPC differentiation could explain the sudden onset and short-term mortality observed in liver diseases such as AH23,24. Further work is required to understand how increased immune cell infiltration and a shift toward LPC-dependent liver regeneration affects different chronic liver diseases.
Early studies of LPC expansion and immune cell infiltration utilized microscopic analysis of liver biopsies or explant tissue using specific LPC or immune cell markers in Alcohol-associated liver disease (ALD)/AH13,14,25,26, NAFLD/NASH17,27,28, HCV16 and other liver diseases and rodent models12,29. More recently, single-cell studies identified an increased diversity in hepatocyte proliferation in rodent models of AH and liver regeneration30. scRNA-seq technologies allow us to interrogate gene expression changes in individual cells in different diseases. scRNA-seq experiments can be challenging due to the high cost and the requirement for complicated cell dissociation protocols prior to sequencing. Cell dissociation can be difficult to perform in a clinical setting and also influences gene expression. Here, we use bulk RNA-seq data previously generated from patients with different chronic liver diseases31 to investigate the combined contribution of LPCs and infiltrating immune cells to liver disease. Using gene deconvolution with scRNA-seq data from livers and peripheral immune cells, we predict the proportions of individual cell types from the bulk RNA-seq data. By combining liver data with peripheral immune cell data, we can accurately identify specific cell types that contribute to distinct diseases. From these studies, we find that sAH has more periportal hepatocytes and cholangiocytes and fewer central vein hepatocytes, suggesting LPC activation and loss of hepatocyte zonation. Different chronic liver diseases were observed to have distinct populations of peripheral immune cell infiltration. These studies reveal a much more thorough understanding of the cell type changes that occur in liver disease that would be difficult to ascertain by microscopy or too financially challenging with scRNA-seq.
Methods
Alcohol-related Hepatitis and Healthy Control Patient Selection
Enrolled patients had confirmed diagnosis of AH by clinicians at the Cleveland Clinic based on medical history, physical examination, and laboratory results, according to the guidelines of the American College of Gastroenterology [https://gi.org/clinical-guidelines/] (Supplemental Table 3). Healthy controls were recruited from the Clinical Research Unit at the Cleveland Clinic.
Single-cell RNA-seq with LPS stimulation
Cryopreserved PBMCs from 4 AH patients and 4 age-matched healthy controls were thawed following the 10x protocol for cryopreserved PBMCs. Cells were then plated and stimulated with 100pg/mL LPS for 24 hours. To resuspend, cells were washed one time with PBS, then incubated on ice with PBS+2.5mM EDTA for 15 minutes. After gently resuspending cells by pipetting, cells were spun in eppendorf tubes at 300 x g for 5 minutes. Cells were washed with PBS+0.04%BSA, resuspended and counted for 10x sequencing. Gel beads-in-emulsion (GEMs) and libraries were performed according to manufacturer’s instructions (Chromium v3.1). Libraries were quantified using an Agilent Bioanalyzer, then pooled and sequenced using a NextSeq550v2.5.
Study Approval
The study protocol was approved by the Institutional Review Board for the Protection of Human Subjects in Research at the Cleveland Clinic and University Hospitals, Cleveland. All methods were performed in accordance with the IRB’s guidelines and regulations and written informed consent was obtained from all subjects.
Single-cell RNA-seq analysis
PBMCs were isolated from healthy controls and AH patients and cryopreserved. PBMC data were aligned to the Human genome (GRC38, release 93) using cellranger (v3.0.2). All gene expression and clustering analyses were performed using Seurat (3.1.1)32. Single-cell RNA-seq data from healthy livers were downloaded from GSE as a gene expression matrix, which was then loaded into Seurat. All samples were first normalized using SCTransform33 and then filtered to remove low quality cells (for PBMCs: nFeature_RNA<4000, nFeature_RNA>200, percent.mt<20, while for Liver: nFeature_RNA<4000, nFeature_RNA>200, percent.mt<5, which removes doublets, cells with low reads, and cells with high mitochondrial content). Clustering was performed using RunPCA and RunUMAP, and clusters were identified using FindNeighbors and FindClusters. Clusters were then identified using markers previously identified8. Differentially expressed genes were measured using Seurat FindMarkers function (log-ratio) with a cutoff FDR<0.05.
Bulk RNA-seq analysis
RNA-seq data was obtained from dbGAP (phs001807.v1.p1)31. Raw fastqs were aligned to the human genome (GRCh38, release 96) and gene expression was determined using kallisto in gene mode with 100 bootstraps34. Differential gene expression was measured using Sleuth in gene mode using the likelihood ratio test (LRT) with a cutoff of FDR<0.05. For all figures and deconvolution, bootstrap data were converted to TPMs in Sleuth. Heatmaps were generated in Sleuth, scaled by row and sample clustering turned off.
Deconvolution
Deconvolution was performed using Cibersortx35. First, single cell data was reduced significantly to establish the significant gene matrix in Cibersortx. Low cell number clusters were combined, including a single CD4 T-cell cluster, CD8-T-cell cluster, and NK-cell cluster. Macrophage clusters 2 and 4 were removed from the liver due to low cell number as well. Then each cluster was reduced to 200 cells/cluster. This data was then used to determine significant gene matrix. Deconvolution was then performed in Cibersortx using the gene expression matrix from Sleuth with all expression values converted to TPM. Deconvolution was performed with 100 permutations with batch correction in S-mode.
WGCNA
WGCNA was performed using default settings36. For all samples, clinical data and deconvolution data were combined and incorporated into the model.
Histopathology and immunohistochemistry
For immunohistochemistry, formalin-fixed paraffin embedded liver samples from explanted livers from patients with sAH undergoing transplant and healthy donors were provided by the NIAAA R24 Clinical Resource for Alcoholic Hepatitis Investigations at Johns Hopkins University. Sections from patients diagnosed with HCC and NAFLD were obtained from the CoPath biorepository at CCF. Sections were de-paraffinized and probed with antibody to FZD6 (14ug/mL, LS‑A4481, LS-Bio, Seattle, WA), and then the Vectastain Elite ABC-HRP Kit (PK-6100, Vector Laboratories, Burlingame, CA) according for factory reccomendations. Nuclei were counter-stained with hematoxylin. At least 3 images were acquired at 10X and 20X by cellSens (Olympus) per tissue section.
Results
Single-cell RNA-seq reveals differences and similarities between peripheral and resident immune cells
While a majority of liver cells are hepatocytes, other cell types, including LSECs, cholangiocytes, and a large number of resident and infiltrating immune cells from the periphery, constitute the non-parenchymal cells. In order to better understand the similarities and differences between immune cells that originate from different compartments, we created a model using publicly available scRNA-seq data from five healthy livers8 and scRNA-seq data we generated from peripheral blood mononuclear cells (PBMCs) isolated from four healthy and four patients with sAH37 (Figure 1A). We applied the SCTransform algorithm to normalize all data. This method accurately normalizes data generated from different groups and different sequencing methods33. Clustering analyses using the Uniform Manifold Approximation and Projection (UMAP) accurately distinguished different cell types into unique clusters (Figure 1A). Because of the large number of immune cells that reside in livers, single-cell data from a healthy liver should include many cell types that overlap with the PBMC data. In the liver data, there should also be cells specific to the liver, such as hepatocytes, LSECs, and cholangiocytes. In our analyses, we used the immune anchors algorithm in Seurat to first find anchor genes in cells, allowing similar cells from different experiments to cluster together. In total, we identified 5 hepatocyte clusters, 2 LSEC clusters, cholangiocytes, and plasma B-cells that were found only in the liver samples, while multiple T-cell, NK-cell, and myeloid cell clusters were present in both (Figure 1B). Because the liver lobule is zonated, we used marker gene expression to designate hepatocyte and LSEC clusters based on their position in the sinusoid, including periportal (PP) and central vein associated (CV) hepatocytes and LSECs (Supplementary Figure 1).
Figure 1: Combined Single-cell RNA-seq data from liver cells and PBMCs reveal similarities and differences between immune cell types.
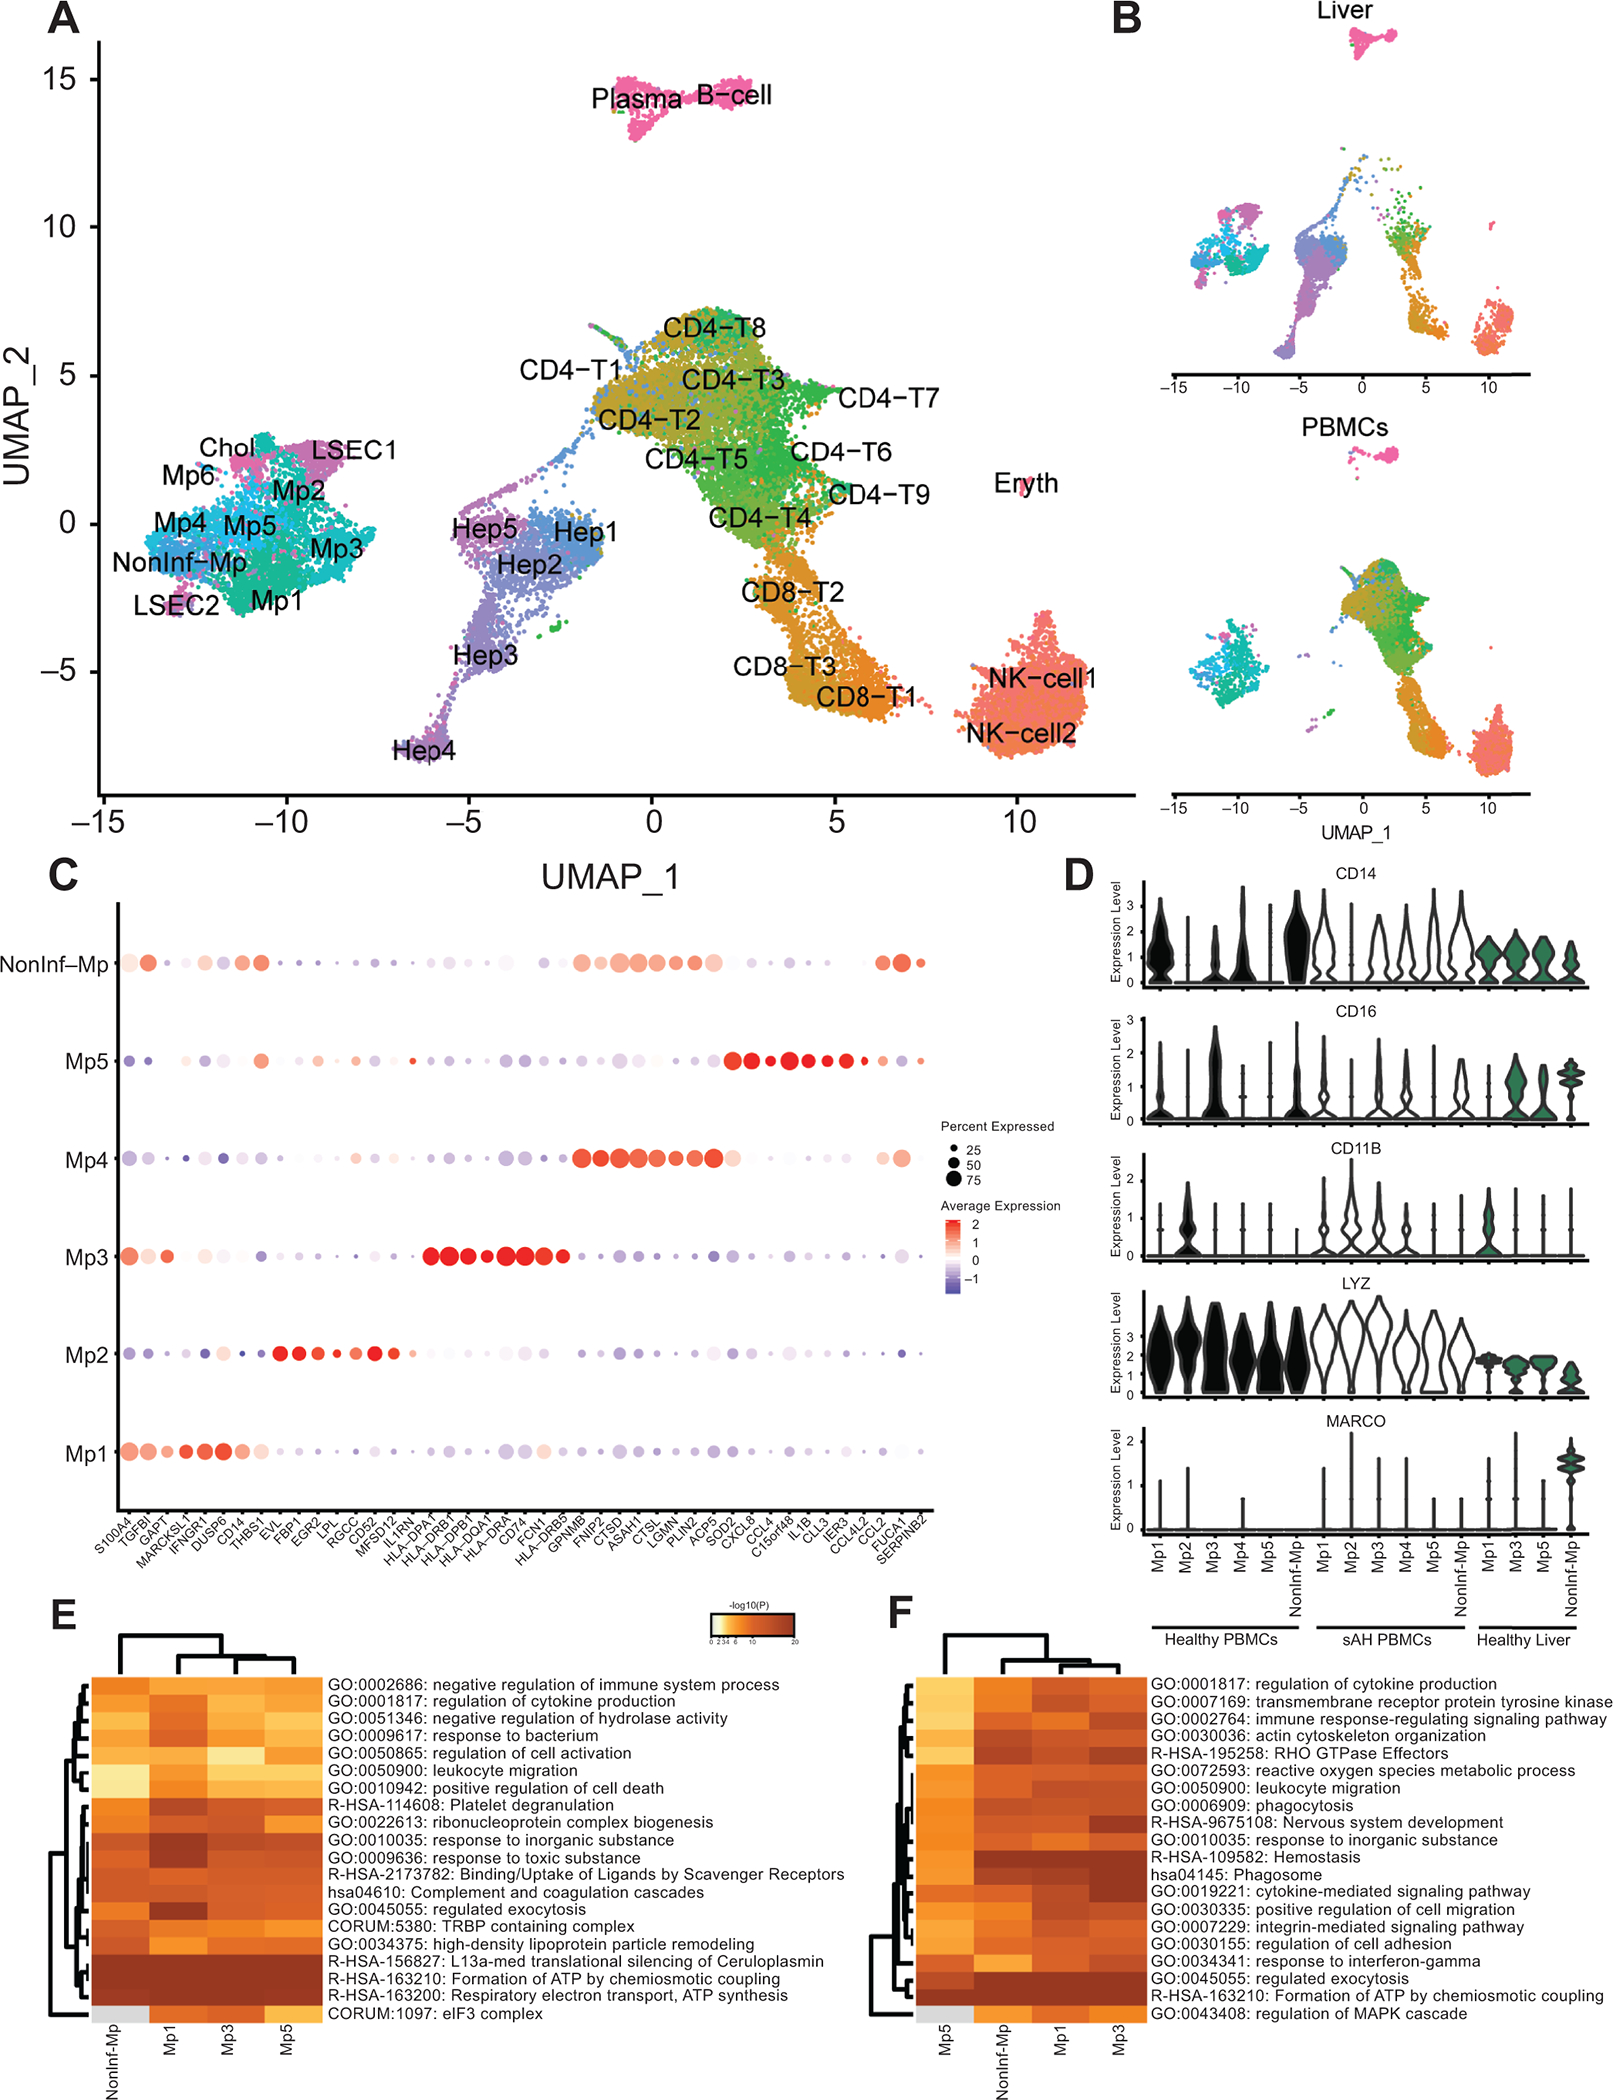
scRNA-seq data from 5 healthy livers and PBMCs isolated from 4 sAH patients and 4 healthy controls were combined and clustered. A) UMAP of combined scRNA-seq data. B) UMAP separated by peripheral cells and liver cells. C) Dot plot showing genes upregulated in each of the 6 main myeloid-derived cell subsets, where red is higher average expression and the size of the circle represents the percentage of cells expressing. D) Violin plots showing expression of common monocyte/macrophage markers in each of the myeloid-derived clusters and separated by sample origin (healthy PBMCs, AH PBMCs, and healthy liver). E and F) Heatmap of pathway analyses showing genes up regulated in resident (E) and peripheral (F) myeloid cells.
The clustering analysis identified 6 unique myeloid cell clusters (Figure 1C). MacParland et al characterized 2 types of liver myeloid cells: non-inflammatory resident Kupffer cells, which were MARCO+, and recently recruited pro-inflammatory macrophages, which were LYZ+8. The only MARCO+ cells in the liver were the non-inflammatory macrophage (NonInf-Mp) cluster, while all other myeloid clusters were LYZ+ and MARCO- (Mp1–5) (Figure 1D, Blue). CD14, CD16, and CD11B, characteristic of peripheral monocytes, was not ubiquitously expressed in healthy myeloid clusters, with some clusters phenotypically classical CD14+ cells (Mp1 and 4), while others were nonclassical CD16+ (Mp3) (Figure 1C, White). In sAH, expression of CD14, CD16, and CD11B was perturbed. Specifically, CD14 and CD11B expression was observed in more of the clusters, while CD16 was downregulated. Of the 5 inflammatory myeloid clusters, 2 consisted of cells found only in the periphery, while the other three were present in both periphery and liver (Table 1). The non-inflammatory cells were MARCO+ in the liver, but the peripheral cells that co-clustered with these cells were MARCO-, confirming the hypothesis that MARCO is a specific marker for resident Kupffer cells.
Table 1.
Proportion of each cell type cluster in PBMCs and Liver
| Total Number | Percentage | |||||
|---|---|---|---|---|---|---|
| HC_PBMC | AH-PBMC | Liver | HC_PBMC | AH-PBMC | Liver | |
| Mp1 | 222 | 672 | 289 | 4.1 | 17.2 | 3.5 |
| Mp2 | 217 | 390 | 13 | 4.0 | 10.0 | 0.2 |
| Mp3 | 98 | 164 | 373 | 1.8 | 4.2 | 4.6 |
| Mp4 | 51 | 280 | 55 | 0.9 | 7.2 | 0.7 |
| Mp5 | 40 | 112 | 103 | 0.7 | 2.9 | 1.3 |
| Nonlnf-Mp | 31 | 206 | 333 | 0.6 | 5.3 | 4.1 |
| B-cell | 81 | 80 | 129 | 1.5 | 2.1 | 1.6 |
| CD4-T1 | 322 | 164 | 31 | 5.9 | 4.2 | 0.4 |
| CD4-T2 | 604 | 195 | 13 | 11.1 | 5.0 | 0.2 |
| CD4-T3 | 662 | 102 | 7 | 12.2 | 2.6 | 0.1 |
| CD4-T4 | 245 | 134 | 163 | 4.5 | 3.4 | 2.0 |
| CD4-T5 | 387 | 141 | 15 | 7.1 | 3.6 | 0.2 |
| CD4-T6 | 227 | 80 | 28 | 4.2 | 2.1 | 0.3 |
| CD4-T7 | 248 | 42 | 16 | 4.6 | 1.1 | 0.2 |
| CD4-T8 | 161 | 76 | 1 | 3.0 | 2.0 | 0.0 |
| CD4-T9 | 25 | 14 | 11 | 0.5 | 0.4 | 0.1 |
| CD8-T1 | 304 | 45 | 163 | 5.6 | 1.2 | 2.0 |
| CD8-T2 | 376 | 69 | 364 | 6.9 | 1.8 | 4.5 |
| CD8-T3 | 178 | 86 | 353 | 3.3 | 2.2 | 4.3 |
| NK-cell1 | 486 | 268 | 486 | 9.0 | 6.9 | 6.0 |
| NK-cell2 | 364 | 435 | 398 | 6.7 | 11.2 | 4.9 |
| Hep1 | 42 | 10 | 782 | 0.8 | 0.3 | 9.6 |
| Hep2 | 0 | 4 | 817 | 0.0 | 0.1 | 10.0 |
| Hep3 | 8 | 8 | 750 | 0.1 | 0.2 | 9.2 |
| Hep4 | 5 | 7 | 610 | 0.1 | 0.2 | 7.5 |
| Hep5 | 0 | 6 | 427 | 0.0 | 0.2 | 5.2 |
| LSEC1 | 11 | 15 | 442 | 0.2 | 0.4 | 5.4 |
| LSEC2 | 2 | 37 | 295 | 0.0 | 0.9 | 3.6 |
| Chol | 5 | 33 | 158 | 0.1 | 0.8 | 1.9 |
| Plasma | 23 | 17 | 472 | 0.4 | 0.4 | 5.8 |
| Eryth | 2 | 5 | 59 | 0.0 | 0.1 | 0.7 |
Next, we measured what genes were differentially expressed between peripheral and resident cells. Of the 4 myeloid clusters found in both compartments (Mp1, Mp3, Mp5, and Non-Inf-Mp), differential expression analyses revealed common pathways upregulated in resident macrophages, including the complement pathway, uptake by scavenger receptors, and other pathways indicative of a more activated macrophage compared to the peripheral monocytes (Figure 1E, Supplementary Table 1). Peripheral monocytes expressed higher levels of HLA and other cytokine/chemokine pathway genes than resident macrophages (Figure 1F). Notably, genes upregulated in the resident macrophages and other non-parenchymal cells include many hepatocyte-specific genes, including albumin, haptoglobin, transferrin, and apolipoprotein family genes (Supplementary Figure 2). However, while expression of these genes was detectable, expression in non-parenchymal cells was less than 20% compared to true hepatocytes and likely an artifact from scRNA-seq.
Deconvolution of bulk-RNA-seq from different chronic liver diseases
Bulk RNA-seq consists of gene expression data from all cells that make up a specific tissue. Differential gene expression measurements can bedifficult to interpret whether the change is due to up/downregulation of a given gene or gain/loss of cells that express those genes. Gene deconvolution is a computational method of predicting the proportion of different cell types present in bulk RNA-seq data. We hypothesized that we could predict changes in cell type proportion from different chronic liver diseases using our liver and peripheral immune scRNA-seq model.
To do this, we simplified our scRNA-seq dataset by combining clusters with low numbers of cells, thus reducing the immune cell compartment to just a single CD4+ T-cell cluster, CD8+ T-cell cluster, and NK-cell cluster (Figure 2A). For our modelling, peripheral immune and liver clusters were separated, thus resulting in 10 total myeloid clusters, 6 peripheral (Mp1–5 and NonInf) and 4 liver (Mp1,3,5 and NonInf). Peripheral clusters included cells from healthy and AH patients. This data was then randomly subsampled to 200 cells/group and Cibersortx was used to identify signature genes for each cluster (Supplementary Table 2).
Figure 2: Deconvolution of cell types using bulk RNA-seq data from different chronic liver diseases.
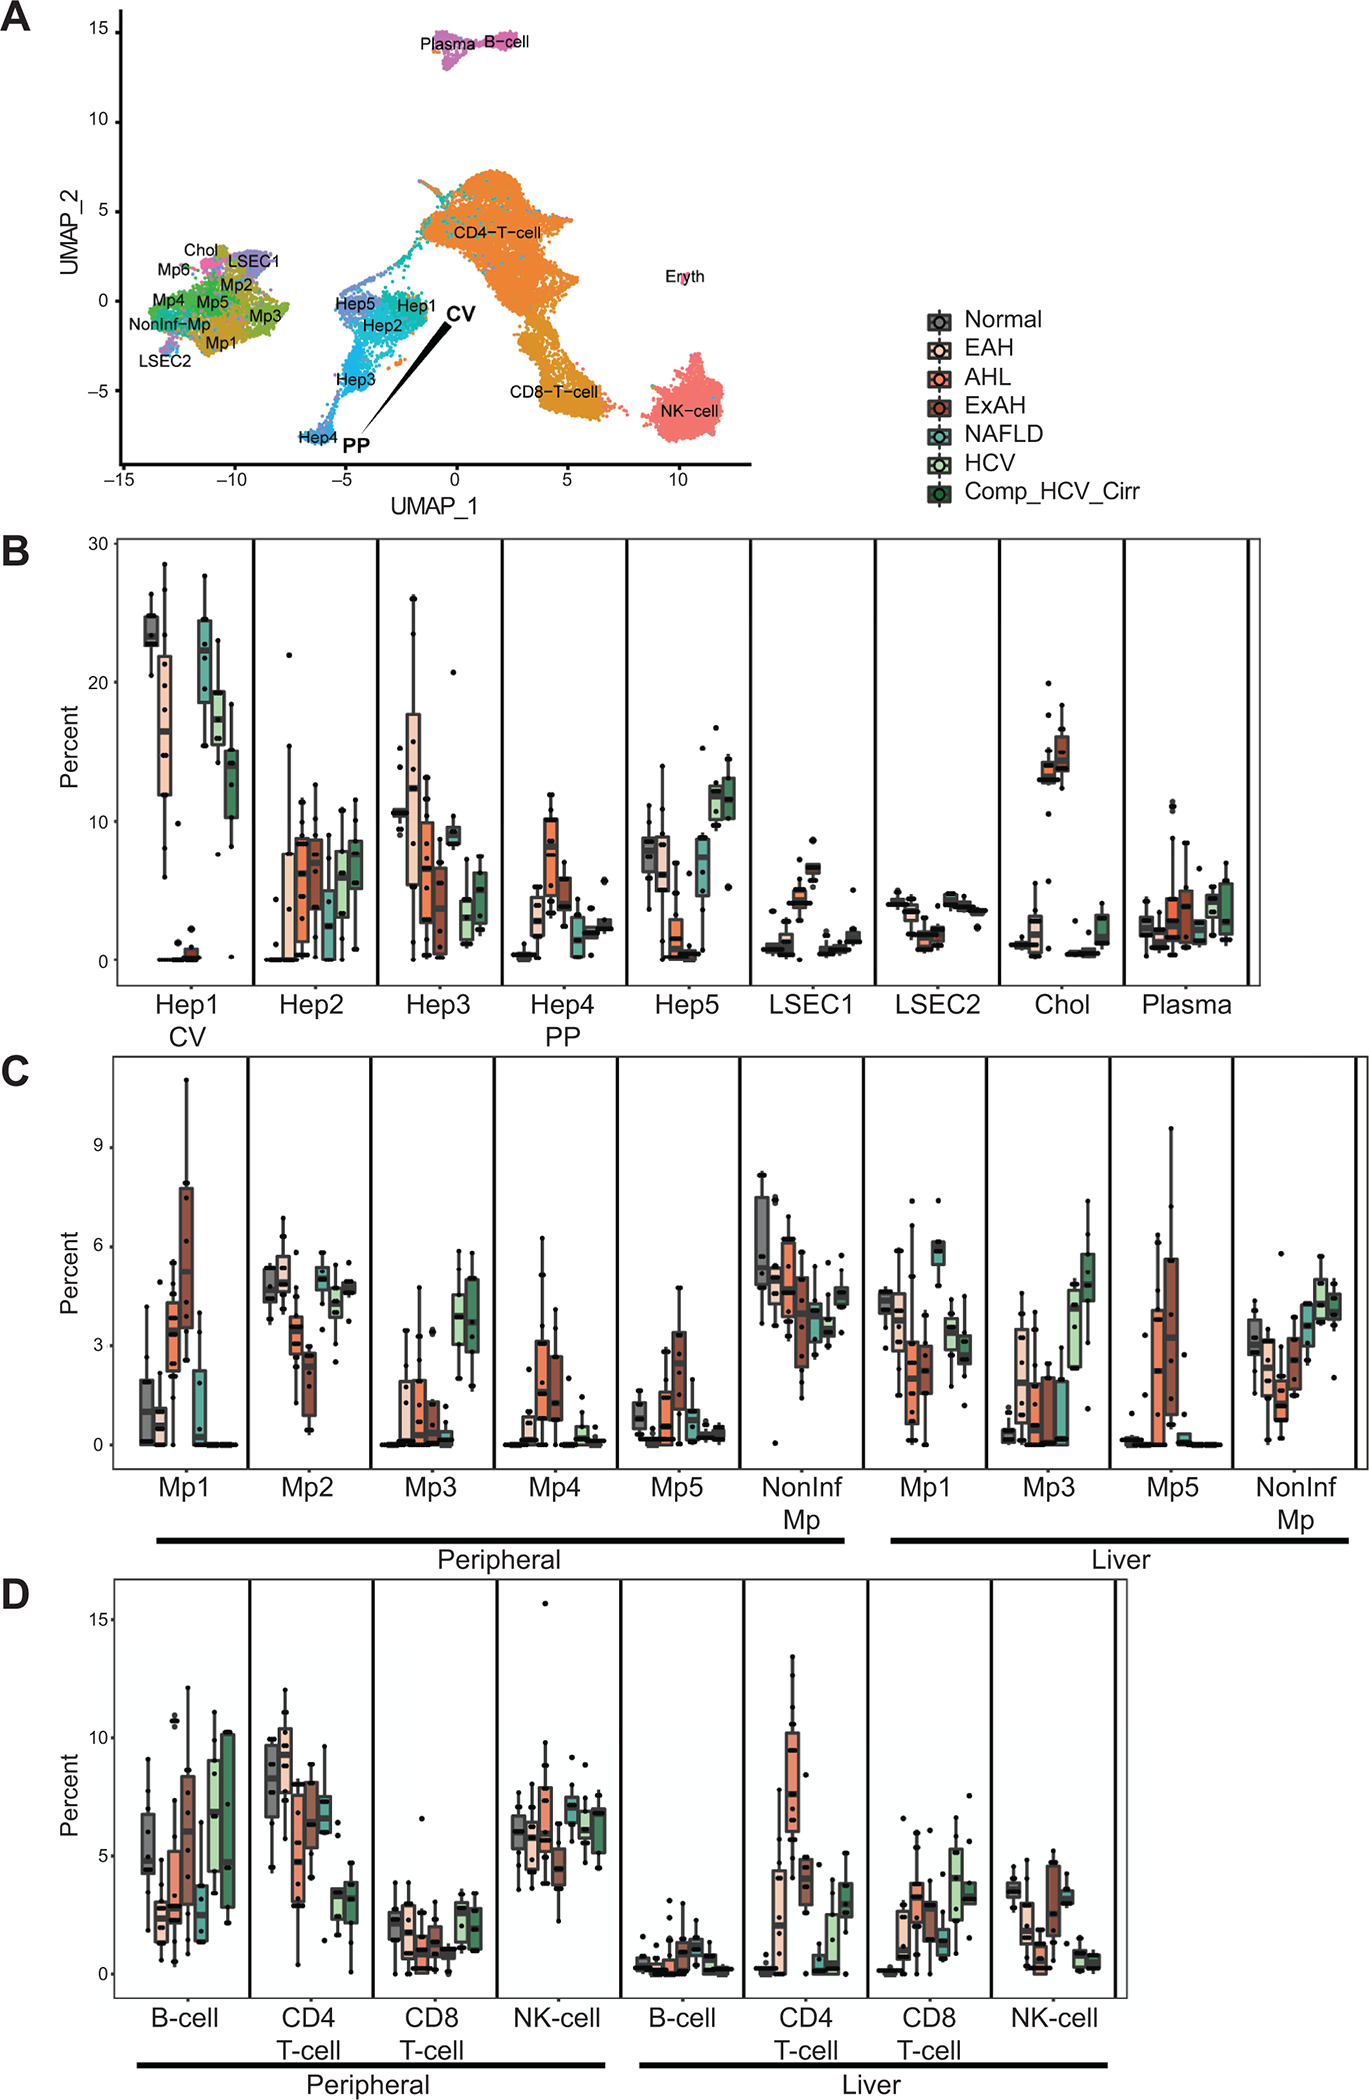
Deconvolution was performed using Cibersortx and the combined scRNA-seq data which was reduced to a smaller number of clusters from both resident liver and peripheral immune cells and included in most cases 200 cells from each cluster. A) UMAP of combined scRNA-seq data after combining clusters that contained relatively few numbers of cells, including a single CD4 T-cell, CD8 T-cell, and NK-cell cluster. B-D) Proportions of each cell type in the following diseases: healthy controls (HC, n=10), early AH (EAH, n=12), AH with liver failure (AHL, n=18), explant tissue from sAH patients with emergency liver transplants (ExAH, n=10), non-alcoholic fatty liver disease (NAFLD, n=8), Hepatitis C (HCV, n=9), HCV with cirrhosis (HCV_Cirr, n=9). B) Myeloid-derived cells (MP1–5 and NonInf-Mp). C) Other immune cells including B-cells, CD4 T-cells, CD8 T-cells, and NK-cells. D) Resident liver cells, including Hep1–5, Liver Sinusoidal Endothelial Cells (LSECS1 and 2), Cholangiocytes (Chol), and Plasma cells.
Bulk RNA-seq data was obtained from Argemi, et al. that included data from patients with early AH (EAH, n=12), sAH with liver failure (AHL, n=18), explant tissue from patients with sAH with emergency liver transplants (ExAH, n=10), non-alcoholic fatty liver disease (NAFLD, n=8), Hepatitis C (HCV, n=9), HCV with cirrhosis (HCV_Cirr, n=9), and healthy controls (HC, n=10)31. Using Cibersortx, we performed gene deconvolution of this data to determine the contribution of different cell types to the bulk RNA-seq data (Figure 2B–D).
In general, patients with sAH (AHL and ExAH samples) had the greatest change in proportions of cell types in the liver. Hepatic zonation was most clearly disrupted in sAH, as periportal hepatocytes were expanded while central vein hepatocytes were depleted (Figure 2D). In contrast, periportal LSECs were diminished while central vein LSECs were expanded. Intriguingly, cholangiocytes were also significantly expanded in sAH.
The different disease groups also varied significantly in immune cell populations, especially myeloid-derived cells (Figure 2B). While sAH had decreased non-inflammatory macrophages in the liver, almost all pro-inflammatory macrophage subsets were higher, indicative of increased monocyte infiltration. Interestingly, monocyte infiltration was also apparent in HCV, but the type of macrophage differed, with HCV having an increase in cluster Mp3 while sAH having an increase in Mp1, Mp4 and Mp5. sAH also had a significant increase in CD4+ T-cells (Figure 2C). The immune composition of the NAFLD samples was very similar to healthy controls, likely due to the lower severity of disease in these patients.
Prominent effect on liver progenitor cell activation and immune cell infiltration in severe AH
The increase in cholangiocytes and periportal hepatocytes in patients with sAH suggests increased activation of liver progenitor cells, which are bipotential cells capable of differentiating into either cell type1. Our results are consistent with previous work in AH patients and rodent models of ALD showing liver progenitor cell activation13,15,25,26. Differential expression analyses confirmed upregulation of KRT19 and KRT7 in sAH, markers of cholangiocytes and activated LPCs (Figure 3A and B). Consistent with liver progenitor cell activation, the transcription factor SOX9, required for activation, was also upregulated (Figure 3C). Because KRT19 and KRT7 may also be expressed by LPC and periportal hepatocytes in diseased livers, we included three additional cholangiocyte markers, identified from scRNA-seq data of human livers8. These additional markers, the gamma subunit of the sodium/potassium transporting ATPase (FXYD2), lipocalin-2 (LCN2), and E74 Like ETS Transcription Factor 3 (ELF3), were all upregulated in sAH (Figure 3D–F). Further, FN14 (TNFSF12A), the receptor for TNF family member TNF-like weak inducer of apoptosis (TWEAK, TNFSF12), was also upregulated in sAH (Figure 3G and H). FN14 is highly expressed on cholangiocytes and is reported to contribute to inflammatory liver diseases in mouse models and sAH patients38,39.
Figure 3: Gene expression from different chronic liver diseases of markers of cholangiocytes and liver progenitor cells.
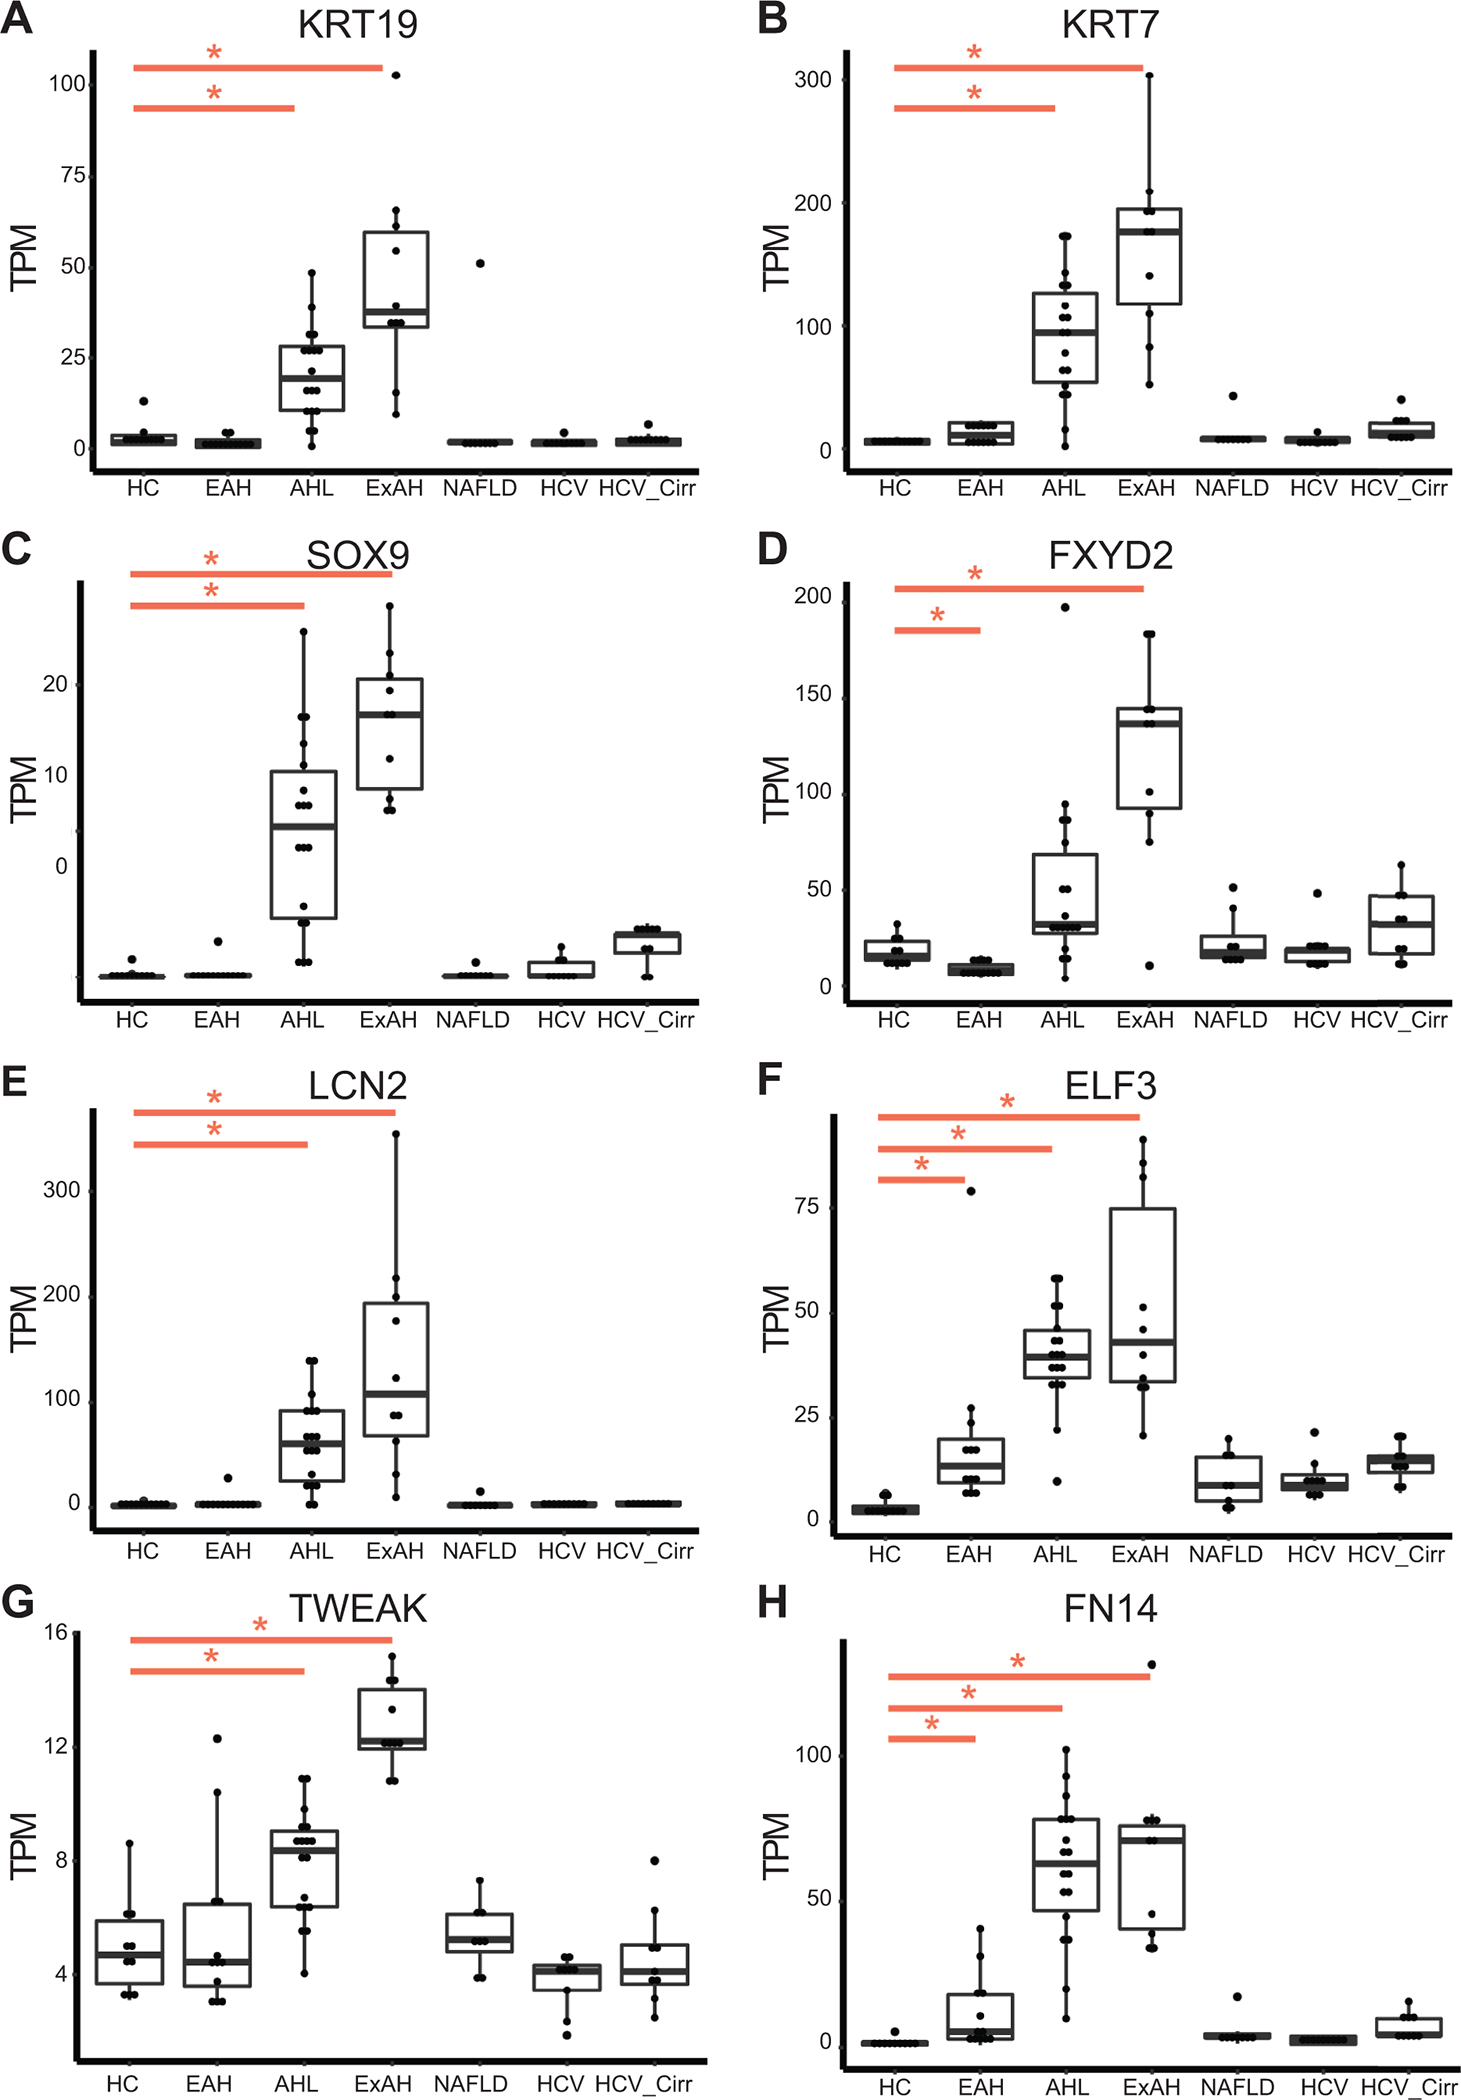
Boxplot of normalized gene expression levels from bulk RNA-seq data as measured by TPM (transcripts per million) for chronic liver diseases: healthy controls (HC, n=10), early AH (EAH, n=12), sAH with liver failure (AHL, n=18), explant tissue from sAH patients with emergency liver transplants (ExAH, n=10), non-alcoholic fatty liver disease (NAFLD, n=8), Hepatitis C (HCV, n=9), HCV with cirrhosis (HCV_Cirr, n=9). Significance was measured using Sleuth with (*) indicating FDR<0.05. A and B) Liver progenitor cell markers KRT7 and KRT9. C) Liver progenitor cell activation marker Sox9. D-F) Cholangiocyte specific markers FXYD2, lipocalin-2 (LCN2), E74 Like ETS Transcription Factor 3 (ELF3). G and H) TNFSF12 (TWEAK) and TNFRSF12A (TWEAK Receptor FN14).
LSECs and macrophages are known to regulate liver regeneration through the expression of WNTs, specifically WNT2 and WNT9b. Interestingly, many WNTs and the Frizzled (FZD) receptors were dysregulated in AH, for example WNT2 was downregulated while a WNT receptor, FZD6, was upregulated (Figure 4A and B). Dysregulated WNT signaling has been suggested to play a significant role in many liver diseases, with canonical WNT signaling having a significant role in fibrosis and noncanonical WNT involved in inflammation and metabolic disorders40. From the transcriptomic data, WNTs involved in noncanonical WNT signaling (WNT4, WNT5A, WNT7A, WNT7B, and WNT11) were upregulated in sAH (Figure 4 C, Table 2). Additionally, noncanonical WNT genes, Vangl1, Vangl2 and CELSR1 as well as almost all Frizzled (FZD) receptors (except FZD4) were upregulated in AH. FZD6, a noncanonical WNT receptor associated with hepatocellular carcinoma41,42, was upregulated in sAH (Figure 4B and C, Table 2). Using immunohistochemistry, we found robust staining of FZD6 in hepatocytes in sAH livers (Figure 4D and E). Interestingly, while FZD6 expression was detected in livers from patients with HCC, expression was higher in adjacent tumor tissue compared to hepatocytes (Supplemental Figure 3). While an upregulation of noncanonical WNT signaling is observed in patients with NASH43, we did not observe expression or staining of FZD6 in NAFLD livers, suggesting this pathway may be a feature of liver inflammation rather than steatosis.
Figure 4: Expression of WNT signaling genes in different chronic liver diseases.
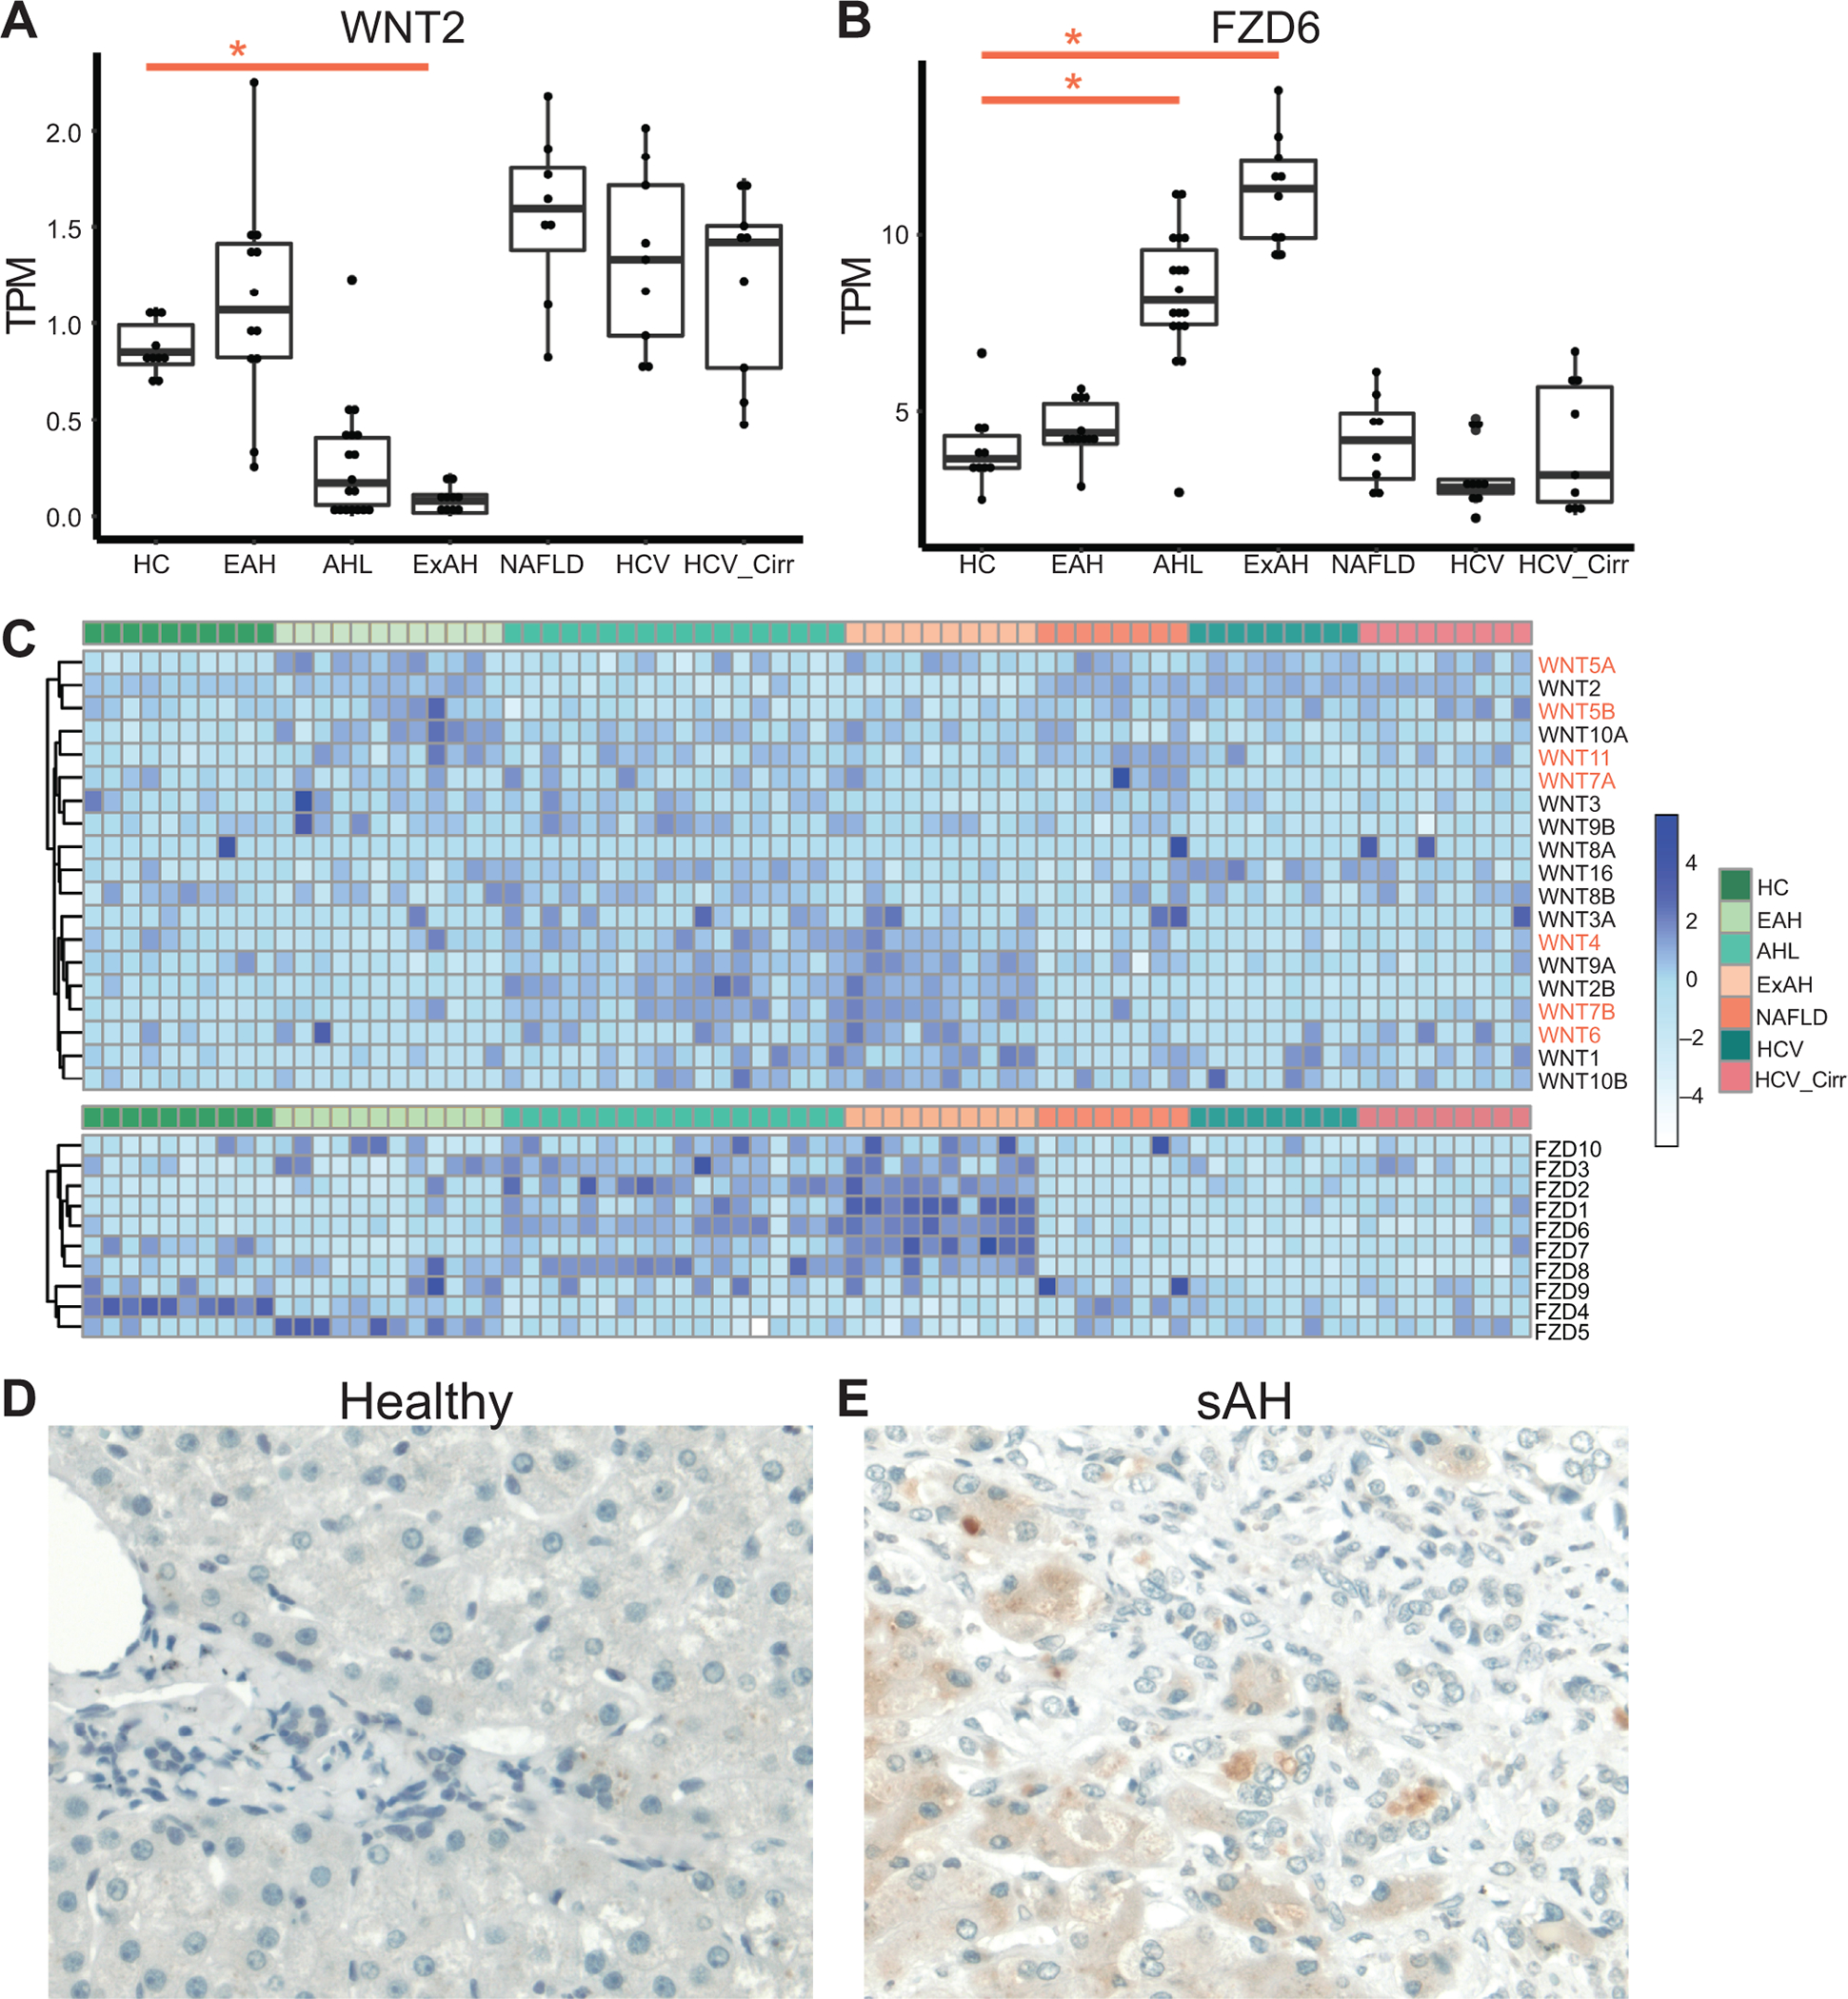
Boxplot of normalized gene expression levels from bulk RNA-seq data as measured by TPM (transcripts per million) for chronic liver diseases. Significance was measured using Sleuth with (*) indicating FDR<0.05. A) WNT2 expression B) FZD6 expression C) Heatmap of all WNT and FZD expression in all liver samples grouped by disease category. D and E) Immunohistochemistry using antibodies against FZD6 in paraffin-embedded sections of tissue isolated from D) healthy controls and E) patients with severe AH. Representative images are shown, n=5 per patient group.
Table 2.
WNT and FZD gene expression compared to healthy livers
| EAH | AHL | ExAH | NAFLD | HCV | HCV_Cirr | |
|---|---|---|---|---|---|---|
| WNT1 | ||||||
| WNT2 | Down*** | Up** | Up* | |||
| WNT2B | Up*** | Up*** | Down** | Down* | ||
| WNT3 | Down* | |||||
| WNT3A | ||||||
| WNT4 | Up* | Down** | ||||
| WNT5A | Up*** | Up*** | Up** | Up*** | Up** | |
| WNT5B | ||||||
| WNT6 | ||||||
| WNT7A | Up* | |||||
| WNT7B | Up*** | Up*** | ||||
| WNT8A | ||||||
| WNT8B | ||||||
| WNT9A | Up*** | |||||
| WNT9B | Up* | Up* | ||||
| WNT10A | Up** | Up*** | ||||
| WNT10B | ||||||
| WNT11 | Up** | Up** | Up*** | Up** | ||
| WNT16 | Up** | |||||
| FZD1 | Up** | Up*** | Up*** | Up*** | ||
| FZD2 | Up*** | Up*** | Up** | Up* | ||
| FZD3 | Up** | Up** | ||||
| FZD4 | Down** | Down*** | Down*** | Down* | Down*** | Down*** |
| FZD5 | Up** | Down** | Down* | Up* | ||
| FZD6 | Up*** | Up*** | Down* | |||
| FZD7 | Down*** | Down*** | Up*** | Down** | Down*** | Down* |
| FZD8 | Up* | Up** | Down** | |||
| FZD9 | ||||||
| FZD10 | ||||||
| Vangl1 | Up*** | |||||
| Vangl2 | Up*** | Up*** | ||||
| CELSR1 | Up*** | Up* | Up** | Up** |
A few WNTs also play an important role in liver regeneration. Wnt5a inhibits liver regeneration after partial hepatectomy by inhibiting hepatocyte proliferation44. From the RNA-seq data, WNT5a was only upregulated in early AH, but was downregulated in sAH (Figure 4C). Early AH samples did not have increased cholangiocytes or hepatocyte zonation defects, implicating dysregulated liver regeneration as a feature of sAH. WNT2 and WNT9b are secreted primarily by central vein LSECs and secondarily infiltrating monocytes to establish the central vein hepatocytes and zonation in a paracrine manner10,45. Here we observe increased central vein LSECs and infiltrating monocytes but less WNT2 expression and no change in WNT9B expression in sAH (Figure 4A). These results may explain why central vein associated hepatocytes are specifically lost in sAH.
Clinical phenotypes correlate to specific changes in liver cell types and gene expression
We hypothesized that changes in liver cell types might correlate with standard clinical measures of liver disease. To do this, we performed Weighted Gene Correlation Network Analysis (WGCNA) using the bulk-RNA-seq data from patient livers and included clinical parameters and cell type percentages in the analysis (Figure 4A). From these analyses, we find markers of sAH (MELD, bilirubin, AST, ALP) to be highly correlated with number of cholangiocytes, periportal hepatocytes, and infiltrating monocytes (Figure 4B). Pathway analysis of the gene modules found to be correlated with these phenotypes reveal extracellular matrix, integrin, and cell adhesion genes to highly correlated as well as LEF1-TEF transcription factor binding sites, indicative of active WNT signaling. Additionally, many pro-inflammatory genes were also highly correlated, including cytokines, chemokines, such as MIF, C-type lectin genes, complement receptors, and interferon genes. In particular, TNF superfamily member TNFSF12, or TWEAK, was found in the turquoise module, and its receptor FN14 was found in the blue module and both were significantly associated with sAH, similar to previous reports24.
HCV highly correlated with ALT, myeloid-cluster 3 (Mp3) as well as genes involved in dsRNA binding, interferon signaling, anti-viral response and immunoglobulin genes (Figure 4C). Among the immune genes correlated with HCV include TLR1, 4 and 8, C1Q, and HLA genes, which are notably upregulated in the Mp3 cluster (Figure 1C). NAFLD was highly correlated with circulating platelet counts, serum albumin, central vein hepatocytes and non-inflammatory macrophages, as well as genes involved in mitochondrial functions, fatty liver, and albumin expression (Figure 4D).
Discussion
By creating a model using single-cell RNA-seq from healthy livers and peripheral immune cells to analyze bulk RNA-seq data from patients with various chronic liver disease, we were able to study disease-dependent changes in cell composition and how these changes effect pathology and clinical diagnostic measures. From our analysis, we observe loss of organization in the hepatic lobule in patients with sAH due to dysfunctional liver regeneration and hepatocyte zonation; bipotential liver progenitor cells are activated resulting in increased cholangiocytes and periportal hepatocytes as well as extensive infiltration of pro-inflammatory peripheral immune cells. We also find these cell type changes correlated with MELD, serum AST, and bilirubin levels. In contrast, chronic HCV infection correlated with anti-viral gene expression in the liver and serum ALT; NAFLD correlated with platelet counts and increased non-inflammatory macrophages in the liver.
Utilizing scRNA-seq in combination with bulk RNA-seq allows us to complement the advantages of both techniques while limiting the disadvantages. scRNA-seq reveals extensive diversity in gene expression between individual cells; this is especially useful in complex tissues, such as the liver, where there are numerous liver cell types that express different genes, depending on their spatial localization, as well as resident and infiltrating immune cells. scRNA-seq can be challenging to perform due to prohibitive costs and the requirement for tissue dissociation prior to sequencing. Bulk RNA-seq of whole tissues has become inexpensive in recent years and thus can be performed on a large number of samples. Additionally, bulk RNA-seq can be sequenced to much higher depths, which can reveal changes in gene expression that are difficult to observe in scRNA-seq. One difficulty in studying human disease is the extensive variation observed in patient phenotypes and outcomes; a problem that can only be solved by studying large sample sizes, which makes scRNA-seq impractical. Here, we create a model by combining scRNA-seq data from 5 healthy livers with data from PBMCs isolated from 4 healthy controls and 4 patients with sAH. We use this model to analyze bulk-RNA-seq data from a total of 76 patients with 3 chronic liver diseases with differing levels of severity: AH, NAFLD, and HCV.
Our model confirmed previous reports that in sAH, liver progenitor cells are activated in order to replace damaged hepatocytes during chronic injury, also called the ductular response13,14. LPCs, located in the periportal zone, are bipotential cells capable of differentiating into new hepatocytes and cholangiocytes. A previous study found that LPC activation in sAH results in overaccumulation of biliary cholangiocytes but not hepatocytes, suggesting that hepatocyte regeneration from LPCs is impaired in sAH26. In fact, hepatocytes are able to trans-differentiate into either bipotential precursor cells or cholangiocytes in chronic liver disease19. As a result, it is possible that in sAH, hepatocytes trans-differentiate into LPCs or cholangiocytes, contributing to both loss of hepatocyte populations and gain of cholangiocytes.
Interestingly, we also observe higher proportions of periportal hepatocytes compared to central vein hepatocytes. We hypothesize that this may be due to loss of central vein hepatocyte identity, related to a dysregulation of WNT and FZD family members in sAH. WNT signaling is important in liver regeneration40, Notably, WNT2, which signals central vein hepatocyte gene expression45, was downregulated, consistent with a loss of central vein hepatocytes in sAH and increases in periportal hepatocytes. Together, these results suggest a model in which loss of WNT2 leads to loss of central vein hepatocytes, thus increasing the proportion of periportal hepatocytes, trans-differentiation to cholangiocytes, and the ductular response. Additionally, inflammation is likely a major contributor to this transformation, as molecules such as TNFa46 and TWEAK38,47 can drive hepatocyte proliferation and the ductular response and disease progression. The receptor for TWEAK, FN14, is expressed on cholangiocytes in healthy liver but can be induced in LPCs, periportal hepatocytes and even hepatic stellate cells in livers with inflammatory disease47. Mouse models have revealed FN14 and TWEAK signaling to play a significant causative role in liver disease progression38,39,47.
Many WNTs and WNT receptors involved in noncanonical WNT signaling are upregulated in sAH, though little is known how these other WNTs regulate liver development and regeneration40. Specifically, the noncanonical WNT receptor FZD6 was upregulated in sAH, and expressed predominantly by hepatocytes. The function of FZD6 is controversial; while it is considered a noncanonical WNT receptor, data indicate that it can signal through all major WNT pathways, including canonical WNT and the two noncanonical WNT pathways: planar cell polarity and the WNT/calcium pathways48. Upregulation of other planar cell polarity genes, such as Vangl1, Vangl2, and Celsr1, suggest planar cell polarity in sAH. FZD6 is also upregulated in HCC and other cancers, though our data suggest FZD6 expression is higher in hepatocytes adjacent to the tumor. These data together, along with increased noncanonical WNT in NASH43, suggest a correlation between liver inflammation and upregulation of noncanonical WNT signaling in hepatocytes.
Hypoxia, a common feature of liver disease, has been shown to shift livers toward non-canonical WNT signaling49. In early AH, we observed less LPC activation, as cholangiocyte and hepatocyte populations were intermediate between healthy controls and sAH. Interestingly, WNT expression was similar between early AH and healthy controls, with the exception of WNT5A, which was only upregulated in early AH and not in sAH. WNT5A is upregulated in later stages of liver regeneration to inhibit hepatocyte proliferation10, thus loss of WNT5A expression in sAH might lead to uncontrolled periportal hepatocyte division and loss of WNT2 would result in fewer central vein associated hepatocytes. Interestingly, WNT2 is thought to be expressed in a paracrine manner from central vein associated LSECs and infiltrating monocytes45 to differentiate hepatocytes, but we found central vein LSECs to be expanded in sAH, so the LSECs are likely also dysfunctional.
In a clinical setting, chronic liver diseases are assessed using standard liver function tests for enzymes, proteins, and cells in the blood. For example AH has a much higher AST and AST/ALT ratio, while HCV infections tend to have much higher ALT levels in the blood50. WGCNA is a technique that calculates gene expression networks by finding which genes have the highest correlation in expression throughout all samples, as well as, which sets of these genes (gene modules) correlate the best with different clinical characteristics. Using this method, we found the highest correlation to be between bilirubin, AST, the expansion of cholangiocytes and the infiltration of pro-inflammatory monocytes. MELD also correlates well with these parameters because MELD score was largely determined by high bilirubin levels in these patients. Among the genes that correlated with the clinical data were many genes regulated by WNT signaling (via the LEF1/TEF transcription factor), as well as extracellular matrix and cell adhesion genes. These results implicate both infiltrating immune cells and liver progenitor cells to the severity of disease in AH. Additionally, our data included patients with chronic HCV, including more severe patients with cirrhosis. The HCV patients had higher ALT and notably increased monocyte infiltration, but a different type of monocyte than those that infiltrated in sAH. Finally, HCV infection correlated highly with anti-viral responses in the liver.
Our goal was to establish a model to better understand the causes of gene expression changes in bulk RNA-seq data. Future work will focus on refining this model as more data become available. For example, we chose to use scRNA-seq data from PBMCs isolated from healthy controls and patients with sAH. Basal gene expression in patients with sAH differs greatly from healthy controls, so we sought to create a model that captures this diversity in gene expression observed in PBMCs. When scRNA-seq data become available from PBMCs and livers of different chronic liver disease patients, these models will improve as it accounts for greater cell diversity and differences in gene expression. Additionally, our data are missing a few critical cell types, such as hepatic stellate cells since the liver scRNA-seq data contained very few, and neutrophils, which would not be included in isolated PBMCs. Other datasets exist which include these cell types, but for simplicity we decided to combine as few datasets as possible.
This work establishes the usefulness of approaching gene expression studies of different diseases by applying different RNA-seq techniques, thus leveraging the advantages while minimizing costs. While our data focused on the gene expression and pathological changes that occur in AH, our model can easily be applied to other liver diseases. Human diseases are difficult to study due to the high genetic variation and environmental factors, making massive scRNA-seq studies impractical. We can apply our model to bulk RNA-data from a greater number of HCV, NAFLD, and other chronic liver diseases with a greater variation in severity and progression to better understand the liver and immune contributions to these diseases.
Supplementary Material
Figure 5: Network analyses show correlation between specific cell types, gene expression, and clinical liver functional tests.
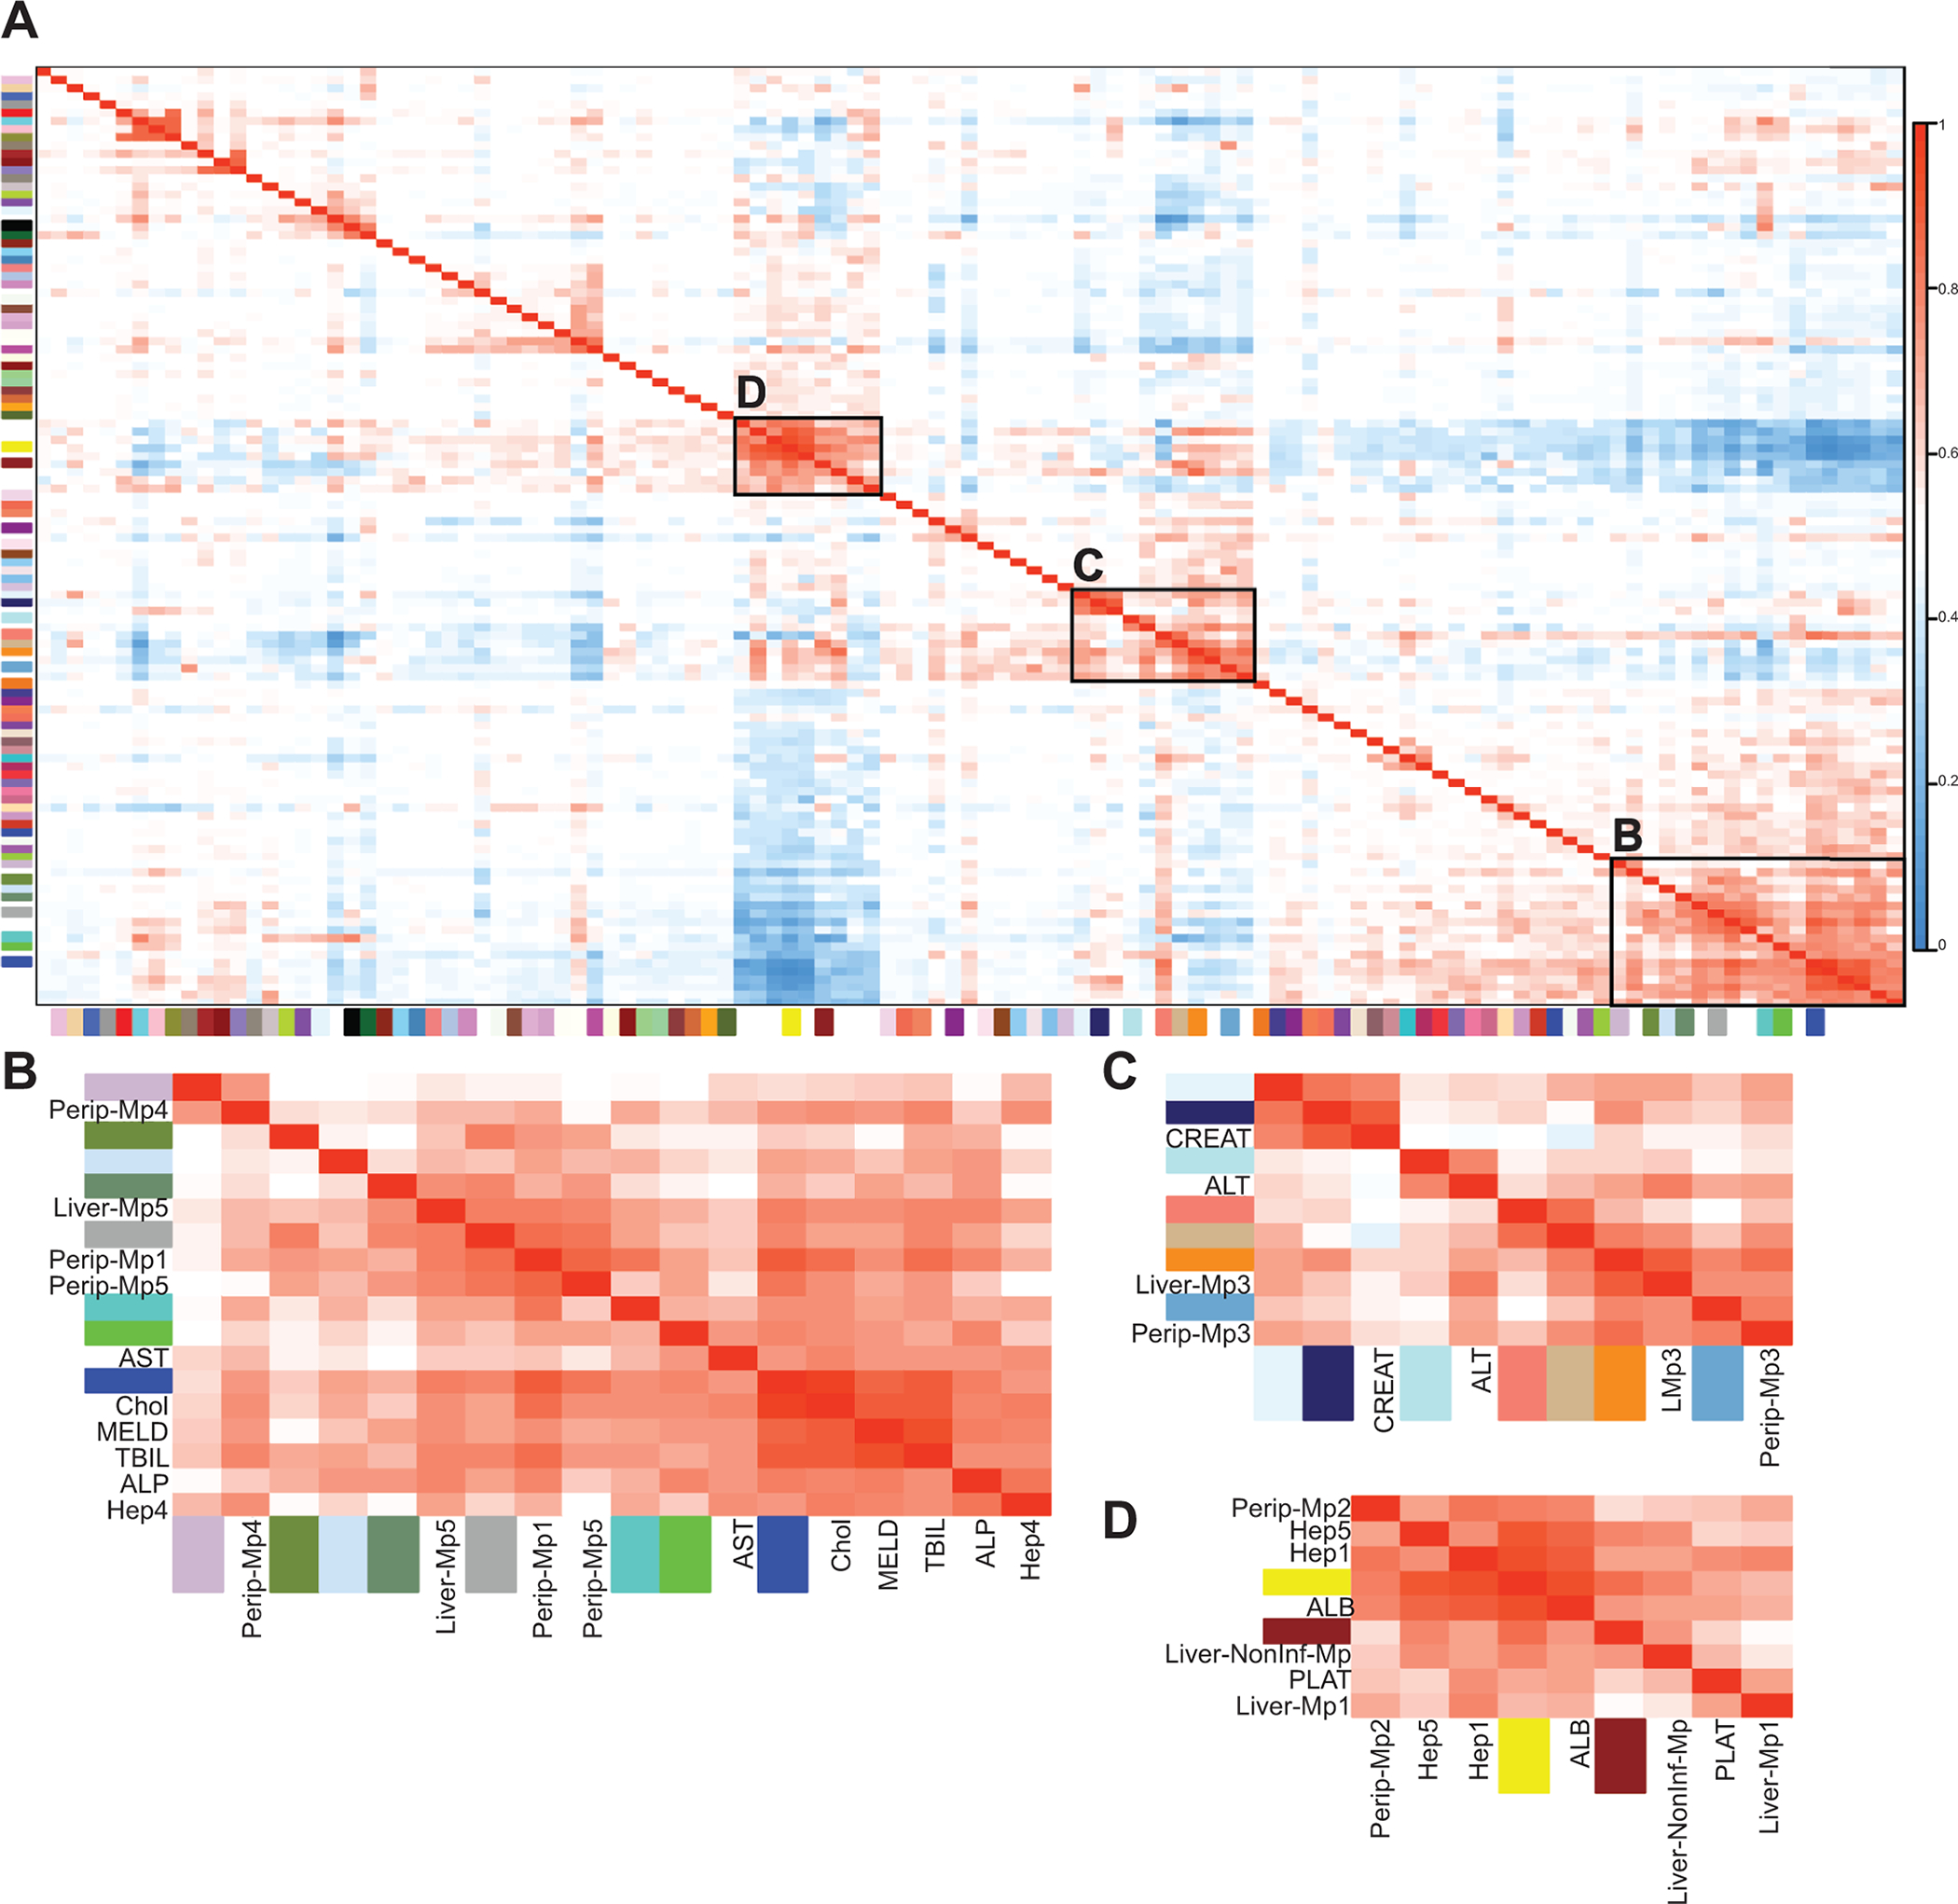
WGCNA was performed to find modules of genes with highly correlated expression in the liver. These modules were then correlated to cell type proportions and clinical diagnostic measures. A) Representative heatmap of all gene modules, cell types, and different clinical measurements after hierarchical clustering. Boxed are groups of modules and clinical parameters with high correlation. B) NAFLD-associated, including modules yellow, brown, serum albumin, platelet count, peripheral Mp2, liver Mp1 and Non-Inf-Mp, Hep1 and Hep5. C) HCV-associated, including modules lightcyan1, midnightblue, paleturquoise, salmon, tan, darkorange, skyblue3, ALT, serum creatinine, and peripheral and resident Mp3. D) AH-associated, including modules thistle3, darkolivegreen4, lightsteelblue1, darkseagreen4, darkgrey, turquoise, green, blue, MELD, AST, ALP, serum bilirubin, cholangiocytes, Hep4, peripheral Mp1, 4, 5 and liver Mp5.
Acknowledgements
We thank the Clinical Research Unit at the Cleveland Clinic especially Dr. Srinivasan Dasarathy, Annette Bellar, and Teresa Markle. We thank the Flow Cytometry Core and Computing Services at the Cleveland Clinic and the Genomics Core at Case Western Reserve University. Additionally, we thank Megan McMullen for reading over the manuscript.
Funding Sources
This work was funded by the following NIH-NIAAA grants: P50AA024333 and R01AA023722 (LEN) and K99AA028048 (AK).
Abbreviations
- AH
Alcohol-associated Hepatitis
- ALD
Alcohol-associated Liver Disease
- EAH
Early AH
- HCV
Hepatitis C Virus
- LPC
Liver Progenitor Cell
- NAFLD
Non-alcohol-associated Fatty Liver Disease
- NASH
Non-alcohol-associated Steatohepatitis
- PBMC
Peripheral Blood Mononuclear Cell
- sAH
Severe AH
- scRNA-seq
Single Cell RNA-sequencing
- WGCNA
Weighted Gene Correlation Network Analysis
Footnotes
Declaration Competing of Interest
The authors declare that they have no competing of interest.
Data Availability: Single-cell RNA sequencing data from PBMCs can be found at NCBI GEO under accession number PRJNA596980. scRNA-seq data from liver can be found at NCBI GEO under GSE115469. Bulk RNA-seq data from livers can be found at dbGAP (phs001807.v1.p1). All scripts used for analyses can be found at author’s github (github/atomadam2). WGCNA results for all gene modules are also available at author’s github.
References
- 1.Gilgenkrantz H & Collin de l’Hortet A Understanding Liver Regeneration: From Mechanisms to Regenerative Medicine. Am J Pathol 188, 1316–1327, doi: 10.1016/j.ajpath.2018.03.008 (2018). [DOI] [PubMed] [Google Scholar]
- 2.Kubes P & Jenne C Immune Responses in the Liver. Annu Rev Immunol 36, 247–277, doi: 10.1146/annurev-immunol-051116-052415 (2018). [DOI] [PubMed] [Google Scholar]
- 3.Ben-Moshe S & Itzkovitz S Spatial heterogeneity in the mammalian liver. Nat Rev Gastroenterol Hepatol 16, 395–410, doi: 10.1038/s41575-019-0134-x (2019). [DOI] [PubMed] [Google Scholar]
- 4.Morales-Navarrete H et al. Liquid-crystal organization of liver tissue. Elife 8, doi: 10.7554/eLife.44860 (2019). [DOI] [PMC free article] [PubMed] [Google Scholar]
- 5.Halpern KB et al. Single-cell spatial reconstruction reveals global division of labour in the mammalian liver. Nature 542, 352–356, doi: 10.1038/nature21065 (2017). [DOI] [PMC free article] [PubMed] [Google Scholar]
- 6.Halpern KB et al. Paired-cell sequencing enables spatial gene expression mapping of liver endothelial cells. Nat Biotechnol 36, 962–970, doi: 10.1038/nbt.4231 (2018). [DOI] [PMC free article] [PubMed] [Google Scholar]
- 7.Aizarani N et al. A human liver cell atlas reveals heterogeneity and epithelial progenitors. Nature 572, 199–204, doi: 10.1038/s41586-019-1373-2 (2019). [DOI] [PMC free article] [PubMed] [Google Scholar]
- 8.MacParland SA et al. Single cell RNA sequencing of human liver reveals distinct intrahepatic macrophage populations. Nat Commun 9, 4383, doi: 10.1038/s41467-018-06318-7 (2018). [DOI] [PMC free article] [PubMed] [Google Scholar]
- 9.Ramachandran P et al. Resolving the fibrotic niche of human liver cirrhosis at single-cell level. Nature 575, 512–518, doi: 10.1038/s41586-019-1631-3 (2019). [DOI] [PMC free article] [PubMed] [Google Scholar]
- 10.Wang B, Zhao L, Fish M, Logan CY & Nusse R Self-renewing diploid Axin2(+) cells fuel homeostatic renewal of the liver. Nature 524, 180–185, doi: 10.1038/nature14863 (2015). [DOI] [PMC free article] [PubMed] [Google Scholar]
- 11.Sun T et al. AXIN2(+) Pericentral Hepatocytes Have Limited Contributions to Liver Homeostasis and Regeneration. Cell Stem Cell 26, 97–107 e106, doi: 10.1016/j.stem.2019.10.011 (2020). [DOI] [PubMed] [Google Scholar]
- 12.Font-Burgada J et al. Hybrid Periportal Hepatocytes Regenerate the Injured Liver without Giving Rise to Cancer. Cell 162, 766–779, doi: 10.1016/j.cell.2015.07.026 (2015). [DOI] [PMC free article] [PubMed] [Google Scholar]
- 13.Sancho-Bru P et al. Liver progenitor cell markers correlate with liver damage and predict short-term mortality in patients with alcoholic hepatitis. Hepatology 55, 1931–1941, doi: 10.1002/hep.25614 (2012). [DOI] [PubMed] [Google Scholar]
- 14.Lowes KN, Brennan BA, Yeoh GC & Olynyk JK Oval cell numbers in human chronic liver diseases are directly related to disease severity. Am J Pathol 154, 537–541, doi: 10.1016/S0002-9440(10)65299-6 (1999). [DOI] [PMC free article] [PubMed] [Google Scholar]
- 15.Aguilar-Bravo B et al. Ductular Reaction Cells Display an Inflammatory Profile and Recruit Neutrophils in Alcoholic Hepatitis. Hepatology 69, 2180–2195, doi: 10.1002/hep.30472 (2019). [DOI] [PMC free article] [PubMed] [Google Scholar]
- 16.Delladetsima J et al. Hepatic progenitor cells in chronic hepatitis C: a phenomenon of older age and advanced liver disease. Virchows Arch 457, 457–466, doi: 10.1007/s00428-010-0957-x (2010). [DOI] [PubMed] [Google Scholar]
- 17.Richardson MM et al. Progressive fibrosis in nonalcoholic steatohepatitis: association with altered regeneration and a ductular reaction. Gastroenterology 133, 80–90, doi: 10.1053/j.gastro.2007.05.012 (2007). [DOI] [PubMed] [Google Scholar]
- 18.Kohn-Gaone J, Gogoi-Tiwari J, Ramm GA, Olynyk JK & Tirnitz-Parker JE The role of liver progenitor cells during liver regeneration, fibrogenesis, and carcinogenesis. Am J Physiol Gastrointest Liver Physiol 310, G143–154, doi: 10.1152/ajpgi.00215.2015 (2016). [DOI] [PubMed] [Google Scholar]
- 19.Tarlow BD et al. Bipotential adult liver progenitors are derived from chronically injured mature hepatocytes. Cell Stem Cell 15, 605–618, doi: 10.1016/j.stem.2014.09.008 (2014). [DOI] [PMC free article] [PubMed] [Google Scholar]
- 20.Michalopoulos GK, Barua L & Bowen WC Transdifferentiation of rat hepatocytes into biliary cells after bile duct ligation and toxic biliary injury. Hepatology 41, 535–544, doi: 10.1002/hep.20600 (2005). [DOI] [PMC free article] [PubMed] [Google Scholar]
- 21.Sekiya S & Suzuki A Hepatocytes, rather than cholangiocytes, can be the major source of primitive ductules in the chronically injured mouse liver. Am J Pathol 184, 1468–1478, doi: 10.1016/j.ajpath.2014.01.005 (2014). [DOI] [PubMed] [Google Scholar]
- 22.Yanger K et al. Robust cellular reprogramming occurs spontaneously during liver regeneration. Genes Dev 27, 719–724, doi: 10.1101/gad.207803.112 (2013). [DOI] [PMC free article] [PubMed] [Google Scholar]
- 23.Gao B & Bataller R Alcoholic liver disease: pathogenesis and new therapeutic targets. Gastroenterology 141, 1572–1585, doi: 10.1053/j.gastro.2011.09.002 (2011). [DOI] [PMC free article] [PubMed] [Google Scholar]
- 24.Affo S et al. Transcriptome analysis identifies TNF superfamily receptors as potential therapeutic targets in alcoholic hepatitis. Gut 62, 452–460, doi: 10.1136/gutjnl-2011-301146 (2013). [DOI] [PMC free article] [PubMed] [Google Scholar]
- 25.Smith PG, Tee LB & Yeoh GC Appearance of oval cells in the liver of rats after long-term exposure to ethanol. Hepatology 23, 145–154, doi: 10.1002/hep.510230120 (1996). [DOI] [PubMed] [Google Scholar]
- 26.Dubuquoy L et al. Progenitor cell expansion and impaired hepatocyte regeneration in explanted livers from alcoholic hepatitis. Gut 64, 1949–1960, doi: 10.1136/gutjnl-2014-308410 (2015). [DOI] [PMC free article] [PubMed] [Google Scholar]
- 27.Roskams T et al. Oxidative stress and oval cell accumulation in mice and humans with alcoholic and nonalcoholic fatty liver disease. Am J Pathol 163, 1301–1311, doi: 10.1016/S0002-9440(10)63489-X (2003). [DOI] [PMC free article] [PubMed] [Google Scholar]
- 28.Hyun J et al. Epithelial splicing regulatory protein 2-mediated alternative splicing reprograms hepatocytes in severe alcoholic hepatitis. J Clin Invest 130, 2129–2145, doi: 10.1172/JCI132691 (2020). [DOI] [PMC free article] [PubMed] [Google Scholar]
- 29.Jung Y et al. Accumulation of hedgehog-responsive progenitors parallels alcoholic liver disease severity in mice and humans. Gastroenterology 134, 1532–1543, doi: 10.1053/j.gastro.2008.02.022 (2008). [DOI] [PMC free article] [PubMed] [Google Scholar]
- 30.Achanta S et al. Single-Cell Gene Expression Analysis Identifies Chronic Alcohol-Mediated Shift in Hepatocyte Molecular States After Partial Hepatectomy. Gene Expr 19, 97–119, doi: 10.3727/105221618X15361728786767 (2019). [DOI] [PMC free article] [PubMed] [Google Scholar]
- 31.Argemi J et al. Defective HNF4alpha-dependent gene expression as a driver of hepatocellular failure in alcoholic hepatitis. Nat Commun 10, 3126, doi: 10.1038/s41467-019-11004-3 (2019). [DOI] [PMC free article] [PubMed] [Google Scholar]
- 32.Stuart T et al. Comprehensive Integration of Single-Cell Data. Cell 177, 1888–1902 e1821, doi: 10.1016/j.cell.2019.05.031 (2019). [DOI] [PMC free article] [PubMed] [Google Scholar]
- 33.Hafemeister C & Satija R Normalization and variance stabilization of single-cell RNA-seq data using regularized negative binomial regression. Genome Biol 20, 296, doi: 10.1186/s13059-019-1874-1 (2019). [DOI] [PMC free article] [PubMed] [Google Scholar]
- 34.Bray NL, Pimentel H, Melsted P & Pachter L Near-optimal probabilistic RNA-seq quantification. Nat Biotechnol 34, 525–527, doi: 10.1038/nbt.3519 (2016). [DOI] [PubMed] [Google Scholar]
- 35.Newman AM et al. Determining cell type abundance and expression from bulk tissues with digital cytometry. Nat Biotechnol 37, 773–782, doi: 10.1038/s41587-019-0114-2 (2019). [DOI] [PMC free article] [PubMed] [Google Scholar]
- 36.Langfelder P & Horvath S WGCNA: an R package for weighted correlation network analysis. BMC Bioinformatics 9, 559, doi: 10.1186/1471-2105-9-559 (2008). [DOI] [PMC free article] [PubMed] [Google Scholar]
- 37.Kim A, Bellar A, McMullen MR, Li X & Nagy L Functionally Diverse Inflammatory Responses in Peripheral and Liver Monocytes in Alcohol‐Associated Hepatitis. Hepatology Communications (2020). [DOI] [PMC free article] [PubMed] [Google Scholar]
- 38.Karaca G et al. TWEAK/Fn14 signaling is required for liver regeneration after partial hepatectomy in mice. PLoS One 9, e83987, doi: 10.1371/journal.pone.0083987 (2014). [DOI] [PMC free article] [PubMed] [Google Scholar]
- 39.Karaca G et al. Role of Fn14 in acute alcoholic steatohepatitis in mice. Am J Physiol Gastrointest Liver Physiol 308, G325–334, doi: 10.1152/ajpgi.00429.2013 (2015). [DOI] [PMC free article] [PubMed] [Google Scholar]
- 40.Russell JO & Monga SP Wnt/beta-Catenin Signaling in Liver Development, Homeostasis, and Pathobiology. Annu Rev Pathol 13, 351–378, doi: 10.1146/annurev-pathol-020117-044010 (2018). [DOI] [PMC free article] [PubMed] [Google Scholar]
- 41.Bengochea A et al. Common dysregulation of Wnt/Frizzled receptor elements in human hepatocellular carcinoma. Br J Cancer 99, 143–150, doi: 10.1038/sj.bjc.6604422 (2008). [DOI] [PMC free article] [PubMed] [Google Scholar]
- 42.Corda G & Sala A Non-canonical WNT/PCP signalling in cancer: Fzd6 takes centre stage. Oncogenesis 6, e364, doi: 10.1038/oncsis.2017.69 (2017). [DOI] [PMC free article] [PubMed] [Google Scholar]
- 43.Ackers I & Malgor R Interrelationship of canonical and non-canonical Wnt signalling pathways in chronic metabolic diseases. Diab Vasc Dis Res 15, 3–13, doi: 10.1177/1479164117738442 (2018). [DOI] [PMC free article] [PubMed] [Google Scholar]
- 44.Yang J et al. WNT5A inhibits hepatocyte proliferation and concludes beta-catenin signaling in liver regeneration. Am J Pathol 185, 2194–2205, doi: 10.1016/j.ajpath.2015.04.021 (2015). [DOI] [PMC free article] [PubMed] [Google Scholar]
- 45.Preziosi M, Okabe H, Poddar M, Singh S & Monga SP Endothelial Wnts regulate beta-catenin signaling in murine liver zonation and regeneration: A sequel to the Wnt-Wnt situation. Hepatol Commun 2, 845–860, doi: 10.1002/hep4.1196 (2018). [DOI] [PMC free article] [PubMed] [Google Scholar]
- 46.Peng WC et al. Inflammatory Cytokine TNFalpha Promotes the Long-Term Expansion of Primary Hepatocytes in 3D Culture. Cell 175, 1607–1619 e1615, doi: 10.1016/j.cell.2018.11.012 (2018). [DOI] [PMC free article] [PubMed] [Google Scholar]
- 47.Wilhelm A et al. Interaction of TWEAK with Fn14 leads to the progression of fibrotic liver disease by directly modulating hepatic stellate cell proliferation. J Pathol 239, 109–121, doi: 10.1002/path.4707 (2016). [DOI] [PMC free article] [PubMed] [Google Scholar]
- 48.Chen S, Schnabl L, Muller HJ & Conci M Amodal Completion of a Target Template Enhances Attentional Guidance in Visual Search. Iperception 9, 2041669518796240, doi: 10.1177/2041669518796240 (2018). [DOI] [PMC free article] [PubMed] [Google Scholar]
- 49.McEnerney L et al. Dual modulation of human hepatic zonation via canonical and non-canonical Wnt pathways. Exp Mol Med 49, e413, doi: 10.1038/emm.2017.226 (2017). [DOI] [PMC free article] [PubMed] [Google Scholar]
- 50.Botros M & Sikaris KA The de ritis ratio: the test of time. Clin Biochem Rev 34, 117–130 (2013). [PMC free article] [PubMed] [Google Scholar]
Associated Data
This section collects any data citations, data availability statements, or supplementary materials included in this article.