Supplemental Digital Content is available in the text.
Background.
Early prediction of whether a liver allograft will be utilized for transplantation may allow better resource deployment during donor management and improve organ allocation. The national donor management goals (DMG) registry contains critical care data collected during donor management. We developed a machine learning model to predict transplantation of a liver graft based on data from the DMG registry.
Methods.
Several machine learning classifiers were trained to predict transplantation of a liver graft. We utilized 127 variables available in the DMG dataset. We included data from potential deceased organ donors between April 2012 and January 2019. The outcome was defined as liver recovery for transplantation in the operating room. The prediction was made based on data available 12–18 h after the time of authorization for transplantation. The data were randomly separated into training (60%), validation (20%), and test sets (20%). We compared the performance of our models to the Liver Discard Risk Index.
Results.
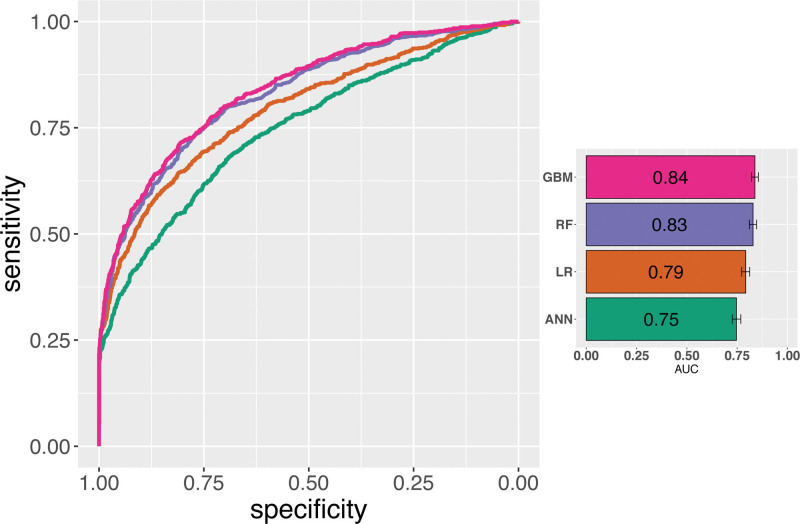
Of 13 629 donors in the dataset, 9255 (68%) livers were recovered and transplanted, 1519 recovered but used for research or discarded, 2855 were not recovered. The optimized gradient boosting machine classifier achieved an area under the curve of the receiver operator characteristic of 0.84 on the test set, outperforming all other classifiers.
Conclusions.
This model predicts successful liver recovery for transplantation in the operating room, using data available early during donor management. It performs favorably when compared to existing models. It may provide real-time decision support during organ donor management and transplant logistics.
INTRODUCTION
A total of 7841 adult liver transplants were performed in 2016 in the United States; 7496 (96%) livers were recovered from deceased donors. Of those livers recovered for transplant, 9.0% were not transplanted (nonutilization rate).1 Many factors, both extrahepatic and hepatic, can preclude transplantation of a deceased donor liver. Extrahepatic causes include technical reasons, malignant tumor, and infection of the donor. Hepatic causes include cirrhosis or chronic disease, septic or ischemic liver, and steatosis.2 Several interventions to improve organ quality and organ yield have been investigated. The use of machine perfusion has been recently introduced to help with organ preservation, assessment of organ function ex vivo, supply of nutrients, and removal of cellular waste products from the donor organ environment. Allocation strategies and surgical approach have also been identified as important in decreasing allograft dysfunction by decreasing cold ischemia time and warm ischemia time.3 Recent findings also suggest that even livers refused by ≥5 surgical teams could be transplanted successfully via a rescue allocation processes.4
Methods to accurately predict transplantation of a graft could facilitate more timely interventions in the donor, lead to modified allocation processes, and possibly lead to increased liver recovery for transplantation in the operating room. The best and most widely used tool to date to predict successful transplantation of donor liver is the Discard Risk Index (DSRI). It uses the last available laboratory values before organ recovery, donor demographic information, and donor medical history. The risk score was derived from the standard data set of 109 540 donors, submitted by organ procurement organizations (OPOs) to the Organ Procurement and Transplantation Network (OPTN). The DSRI achieved an area under the curve of the receiver operating characteristic (ROC-AUC) of 0.8 on its test set. It identifies a useful set of variables and predicts liver allograft utilization.5,6 The Scientific Registry of Transplant Recipients yield calculator, another model to predict liver graft utilization, has a ROC-AUC of 0.78.7 Its coefficients are updated regularly.8 Both models utilize donor data and laboratory values collected immediately prior to organ procurement.
Donor Management Goals (DMG) are specific physiologic targets that guide the bedside management of organ donors after brain death (DBDs) and include mean arterial blood pressure, urine output, and serum sodium levels9 (Table 1). Data on donor physiology are collected during donor management and uploaded in the DMG web portal.9
TABLE 1.
Categorical variables included in the machine learning models
| Demographic | Medical history | Transplant logistical information | DMGs met |
|---|---|---|---|
| Gender | History of cancer | Donor type | DMGs met at each of the following time points |
| Female | History of diabetes | Donation after circulatory death | Authorization |
| Male | History of myocardial infarction | Extended criteria donor | h |
| Ethnicity a | History of hypertension | Extended criteria donor with donation after circulatory death | DMG definitions below |
| Latino | Infectious disease | Standard criteria donor | Mean arterial pressure between 60–110 mm Hg |
| Non-Latino | Hepatitis B surface antibody status | Unknown | Central venous pressure between 4–12 mm Hg |
| Unknown | Hepatitis B surface antigen status | Blood type | Ejection fraction ≥50% |
| Race | Hepatitis B core antibody status | A | One or fewer low-dose vasopressorsb |
| Asian | HCV antibody | B | Arterial blood gas pH between 7.3–7.5 |
| Black | CDC high risk for HIV | AB | Pao2:FIO2 ratio ≥300 |
| Native American | HIV status | O | Serum sodium ≤155 mEq/L |
| Pacific Islander | Date info | Cause of death | Urine output ≥0.5 mL/kg/h over 4 h |
| White | Referral on which day of week? | Anoxia | Glucose ≤180 mg/dLMiscellaneousBiopsy performedDocumented intention of donation |
| Multiracial | Referral on which day of year? | Cerebrovascular/stroke | |
| Referral on last day of month? | Head trauma | ||
| Referral on first day of month? | CNS tumor | ||
| Referral on last day of quarter? | Other, specify | ||
| Referral on first day of quarter? | OPO ID | ||
| Referral on last day of year? | Hospital ID | ||
| Referral on first day of year? | Region ID |
aValues are Latino vs non-Latino.
bDefined as dopamine at ≤10 µg/kg/min, neo synephrine at ≤60 µg/min, and norepinephrine at ≤10 µg/min.
Donor management goals were defined according to the United Network for Organ Sharing Region 5 donor management goals10 and modified glucose goal.11
CDC, Centers for Disease Control and Prevention; CNS, central nervous system; DMG, donor management goal; FIO2, fraction of inspired oxygen; HCV, hepatitis C virus; OPO, organ procurement organization; Pao2, Po2 in arterial blood.
We sought to improve on prior attempts to predict utilization of liver grafts for transplantation and to do this at an earlier time point during donor management/organ allocation based on the DMG dataset. Our goal was to develop a machine learning model based on the DMG dataset and to accurately predict liver recovery for transplantation in the operating room at an early time point during donor management. Such a model could help with early identification of livers at risk for discard, allow timely medical intervention to improve organ quality, reallocation to reduce ischemia times, and guide appropriate deployment of expensive recovery teams.
MATERIALS AND METHODS
Approval was obtained by the Institutional Review Board of the University of California, San Francisco (Institutional Review Board no. 10-03188). This study used data from the OPTN. The OPTN data system includes data on all donor, wait-listed candidates, and transplant recipients in the United States, submitted by the members of the (OPTN. The Health Resources and Services Administration, US Department of Health and Human Services provides oversight to the activities of the OPTN contractor. The DMG database is managed by United Network for Organ Sharing. The dataset was requested by the authors and provided in a deidentified manner by United Network for Organ Sharing.
Study Population
The DMG dataset contains demographic information, past medical history, and physiologic measures at multiple time points during donor management and reports whether the DMGs have been met at each time point.10 The dataset consists of donor data from 18 individual OPOs from 9 OPTN Regions between April 2012 and January 2019. DMG physiologic variables are collected at 4 time points: the referral to the OPO (after a potentially nonsurvivable neurologic injury has been identified); the time of authorization for organ donation; 12–18 h after authorization (when organ allocation is taking place10); and the time point immediately before the donor enters the operating room (prior to organ recovery). For DBDs, the time period from authorization until organ recovery represents the OPO donor management phase of care. For donor/donation after circulatory death (DCD), all of the time points represent the donor hospital phase of care, when critical care unit teams are managing the patient. The registry does not contain data of potential DBDs who are never taken to the operating room for organ recovery or potential DCDs who took longer than the requisite time to expire after withdrawal of life-sustaining treatment.
Data Collection
The following donor-related variables were obtained from the OPTN: age, gender, body mass index (BMI), height, weight, race (Asian, Black, Native American, Pacific Islander, White, multiracial), ethnicity (Latino, non-Latino, or unknown), cause of death, donor type, donor intent documented (yes, no, or unknown), ABO blood type, and admission date. Only variables collected at time of authorization and 12–18 h after authorization (the time of organ allocation), were used in the model. Variables collected after 12–18 h after authorization (eg, variables collected at the time point prior to organ recovery) were excluded. Tables 2 and 3 show the variables used at different time points. DMGs were defined according to the OPTN Region 5 DMGs10 and modified glucose goal11 (Table 1).
TABLE 2.
Donor characteristics
| Liver not transplanted | Liver transplanted | P a | |
|---|---|---|---|
| Total number of donors | 4374 | 9255 | |
| Age, y | 38.0 (25.0–52.0) | 44.0 (29.0–55.0) | <0.001 |
| Gender | |||
| Male | 5753 (62.2) | 2671 (61.1) | 0.226 |
| Female | 3502 (37.8) | 1703 (38.9) | |
| Body mass index, kg/m2 | 26.5 (22.9–30.9) | 27.2 (23.2–32.3) | <0.001 |
| Weight, kg | 78.9 (24.0) | 80.4 (28.7) | 0.004 |
| Height, cm | 170.2 (163.0–178.0) | 170.0 (162.6–178.0) | <0.001 |
| Race | |||
| Asian | 430 (4.6) | 208 (4.8) | <0.001 |
| Black | 1232 (13.3) | 302 (6.9) | |
| Multiracial | 71 (0.8) | 37 (0.8) | |
| Native American | 33 (0.4) | 40 (0.9) | |
| Pacific Islander | 46 (0.5) | 17 (0.4) | |
| White | 7443 (80.4) | 3770 (86.2) | |
| Cause of death | |||
| Anoxia | 3185 (34.4) | 1579 (36.1) | <0.001 |
| Cerebrovascular/stroke | 2718 (29.4) | 1424 (32.6) | |
| Head trauma | 3111 (33.6) | 1220 (27.9) | |
| Other, specify | 198 (2.1) | 137 (3.1) | |
| CNS tumor | 43 (0.5) | 12 (0.3) | |
| Unknown | 0 (0.0) | 2 (0.0) | |
| Donor type | |||
| SCD | 6993 (75.6) | 2175 (49.7) | <0.001 |
| ECD | 1767 (19.1) | 844 (19.3) | |
| ECD/DCD | 31 (0.3) | 167 (3.8) | |
| DCD | 462 (5.0) | 1186 (27.1) | |
| Unknown | 1 (0.0) | 2 (0.0) | |
| History of diabetes | |||
| No | 8180 (88.4) | 2950 (67.4) | <0.001 |
| Unknown | 77 (0.8) | 949 (21.7) | |
| Yes, 0–5 y | 337 (3.6) | 192 (4.4) | |
| Yes, 6–10 y | 187 (2.0) | 84 (1.9) | |
| Yes, >10 y | 377 (4.1) | 155 (3.5) | |
| Yes, duration unknown | 97 (1.0) | 44 (1.0) | |
| History of hypertension | |||
| No | 6372 (68.8) | 2597 (59.4) | <0.001 |
| Yes | 2874 (31.1) | 875 (20.0) | |
| Unknown | 9 (0.1) | 902 (20.6) | |
| Hepatitis B | |||
| Negative | 8830 (95.4) | 3264 (74.6) | <0.001 |
| Unknown | 0 (0.0) | 898 (20.5) | |
| Positive | 419 (4.5) | 205 (4.7) | |
| Test not done | 6 (0.1) | 7 (0.2) | |
| Hepatitis C | |||
| Negative | 8909 (96.3) | 3288 (75.2) | <0.001 |
| Unknown | 0 (0.0) | 898 (20.5) | |
| Positive | 345 (3.7) | 183 (4.2) | |
| Test not done | 1 (0.0) | 5 (0.1) | |
| CDC risk HIV | |||
| No | 7118 (76.9) | 2833 (64.8) | <0.001 |
| Yes | 2132 (23.0) | 641 (14.7) | |
| Unknown | 5 (0.1) | 900 (20.6) | |
| AST at 12–18 h after authorization, units/L | 49.0 (28.0–98.0) | 59.0 (31.0–123.8) | <0.001 |
| ALT at 12–18 h after authorization, units/L | 41.0 (23.0–87.0) | 44.0 (25.0–96.0) | 0.001 |
| Total bilirubin at h after authorization, mg/dL | 0.7 (0.5–1.1) | 0.8 (0.5–1.4) | <0.001 |
| Sodium at h after authorization, mEq/L | 148.0 (142.0–154.0) | 147.0 (142.0–154.0) | 0.002 |
| Biopsy performed | |||
| No | 6794 (73.4) | 3443 (78.7) | <0.001 |
| Yes | 2461 (26.6) | 931 (21.3) | |
aThe 2 groups were compared and P calculated using χ2 test for categorical variables, the Kruskal-Wallis test for variables not normally distributed, and the Student t-test for variables normally distributed.
Continuous variables are summarized by median (interquartile range), and categorical variables are summarized by n (%). CDC high-risk criteria means that donors were at higher risk of blood-borne diseases, such as HIV.
ALT, alanine aminotransferase; AST, aspartate aminotransferase; CDC, Centers for Disease Control and Prevention, CNS, central nervous system; DCD, donor/donation after circulatory death; ECD, expanded-criteria donor; SCD, standard criteria donor.
TABLE 3.
Continuous variables included in the machine learning models
| Demographic | Medication information | Laboratory values | Respiratory values | Miscellaneous physiologic |
|---|---|---|---|---|
| Age, y | At time of authorization | |||
| Weight, kg | Dopamine infusion dose, µg/kg/min | Creatinine, mg/dL | Arterial blood gas, pH | Mean arterial pressure, mm Hg |
| Height, cm | Neosynephrine infusion dose, µg/kg/min | Serum lactate levels, mmol/L | Pao2/FIO2 ratio | Central venous pressure, mm Hg |
| Body mass index, kg/m2 | Norepinephrine infusion dose, µg/kg/min | Serum sodium, mEq/L | Pao2, mm Hg | Urine output, mL/4 h |
| Epinephrine infusion dose, µg/kg/min | Serum glucose, mmol/L | FIO2 | Temperature, °C | |
| Date info | Vasopressin infusion dose, units/h | Serum direct bilirubin, mg/dL | Peak inspiratory pressure, cm H2O | |
| Referral d | Dobutamine infusion dose, µg/kg/min | Serum insulin, mIU/L | ||
| Referral wk | Number of total vasopressors | |||
| Referral mo | Medication information | Laboratory values | Respiratory values | Miscellaneous physiologic |
| Referral y | 12–18 h after authorization | |||
| Dopamine infusion dose, µg/kg/min | Creatinine, mg/dL | Arterial blood gas, pH | Mean arterial pressure, mm Hg | |
| Neosynephrine infusion dose, µg/kg/min | Serum lactate levels, mmol/L | Pao2/FIO2 ratio | Urine output, mL/4 h | |
| Norepinephrine infusion dose, µg/kg/min | Serum sodium, mEq/L | Pao2, mm Hg | Temperature, °C | |
| Epinephrine infusion dose, µg/kg/min | Serum glucose, mmol/L | FIO2 | ||
| Vasopressin infusion dose, units/h | ||||
| Dobutamine infusion dose, µg/kg/min | ||||
| Insulin infusion dose, units/h | ||||
| Number of total vasopressors | ||||
C, Celcius; FIO2, fraction of inspired oxygen; Pao2, partial pressure of oxygen in arterial blood.
Data Preprocessing
Data was prepared using the open-source Python package pandas. Variables whose missingness co-occurred with those cases in which no organs were recovered with a Fisher coefficient >0.1 were removed from the model. This was done to prevent that the absence of variables might identify donors whose organs were unlikely to be recovered, and therefore not transplanted. Biopsy findings were excluded, but information on whether a biopsy was performed was retained as a binary variable. We excluded data collected at the time of referral to the OPO. We did not exclude variables with a high rate of missing data from our model. This was done with the goal to improve the utility of the model in the use of real-world data, which often includes missing data. Also, missingness is an important value that the model can use for prediction; for example, a donor might be missing data for brain natriuretic peptide because the donor heart is not considered for transplantation. Absent vasopressor dose values were coded as 0. All other missing values were coded as −1.
A total of 127 variables were used. Forty-nine categorical variables were converted into 1 variable per categorical value with a 1 or 0 if present or not (one-hot-encoding). This effectively resulted in 1387 binary variables in place of the initial 49 categorical variables. For some continuous variables, we used the same binning scheme as the donor discard risk.6 The binned variables included age, BMI, sodium (for sodium >160), aspartate aminotransferase, alanine transaminase, and total bilirubin. The total number of variables used in the final model was 1469. We chose to use values from the 12–18 h after authorization time point, as this was the closest to a realistic decision-making point if translated to a real-world scenario. The outcome was defined as liver recovery for transplantation in the operating room. The data were randomly separated into training (60%), validation (20%), and test sets (20%).
Statistical Methods and Modeling
Donor characteristics displayed in Table 2 were grouped by whether the liver was transplanted or not. The 2 groups were compared using chi-squared test for categorical variables, the Kruskal-Wallis Test for variables not normally distributed, and the Student t-test for variables normally distributed.
We chose to compare complex machine learning techniques to traditional statistical techniques (eg, binary logistic regression) because we hypothesized that there are many nonlinear relationships between the demographic, physiologic, and logistical variables that affect whether a donor liver is used for transplantation or not. We hypothesized that machine learning techniques would perform better than previously reported risk scores based on logistic regression models.
A gradient boosting machine (GBM) model was trained using the python package XGBoost with the default package parameters for binary classification.12 When the algorithm hyperparameters were optimized using GridSearchCV for highest validation set accuracy, the model was evaluated on the test set. The optimal hyperparameters were decision tree booster, learning rate of 0.01, maximum depth of a tree of 4, learning task of binary: logistic, no L1 regularization term, L2 regularization term on weights of 1.0, and subsample ratio of 0.8.
A fully connected artificial neural network, with 2 layers containing 16 384 and 1028 neurons, respectively, was developed. The model was trained using stochastic gradient descent implemented in PyTorch package running on a local central processing unit. We used early-stopping technique that optimizes for highest validation ROC-AUC.
Logistic regression was applied using Python Scikit-Learn package. The newton-cg logistic regression solver was used. Scikit-Learn default parameters were used for the random forest algorithm.
Partial dependence plots were created using the pdp.pdpbox module within python.
The DSRI model with original coefficients was also applied to our test set. In addition, we retrained the DSRI coefficients on the same DMG training set as used to train our machine learning models.
RESULTS
There were 13 629 donors in the DMG dataset from April 2012 to January 2019 and 9255 (68%) livers were transplanted. Out of the 4374 (32%) livers not used for transplantation, 2855 livers were not recovered, 707 were recovered and used for research, and 812 were recovered but discarded. Table 2 outlines donor characteristics grouped by whether the liver was transplanted or not.
The median intervals between important time points in the donor management process were median of 33.84 h (interquartile range [IQR], 17.74–62.40 h) between referral and authorization, median of 17.04 h (IQR, 12.96–24.00 h) between authorization, and 12–18 h after authorization, median of 21.12 h (IQR, 11.76–33.12 h]) between 12–18 h after authorization and prior to organ recovery.
The optimized GBM (ROC-AUC = 0.84; 95% confidence interval [CI], 0.82-0.86) performed better than random forest (ROC-AUC = 0.83; 95% CI, 0.81-0.86), logistic regression (ROC-AUC = 0.80; 95% CI, 0.77-0.81) and artificial neural network (ROC-AUC = 0.77; 95% CI, 0.73-0.77) on the test set (Figure 1, Table S1, SDC, http://links.lww.com/TXD/A354), as well as DSRI models (Figure 1). The DSRI with the native coefficients as reported in6 had a ROC-AUC of 0.68; 95% CI, 0.65-0.69. The performance of the DSRI model improved after retraining the model the DMG training set (retrained DSRI model, ROC-AUC = 0.72 [95% CI, 0.70-0.75).
FIGURE 1.
Receiver operator characteristic curves for 4 different models. Models developed in this paper include GBMs, RF, LR, and ANN. Bar plot on the right of the figure shows the numerical AUC of the receiver operator characteristic with a visual representation of the 95% confidence interval. AUC, area under the curve; ANN, artificial neural network; GBM, gradient boosting machine; LR, logistic regression; RF, random forest.
The ROC-AUCs were compared using de Long method and were significantly different (P < 0.01) for most pairs except the neural network and retrained DSRI pair (Figure S1, SDC, http://links.lww.com/TXD/A354).
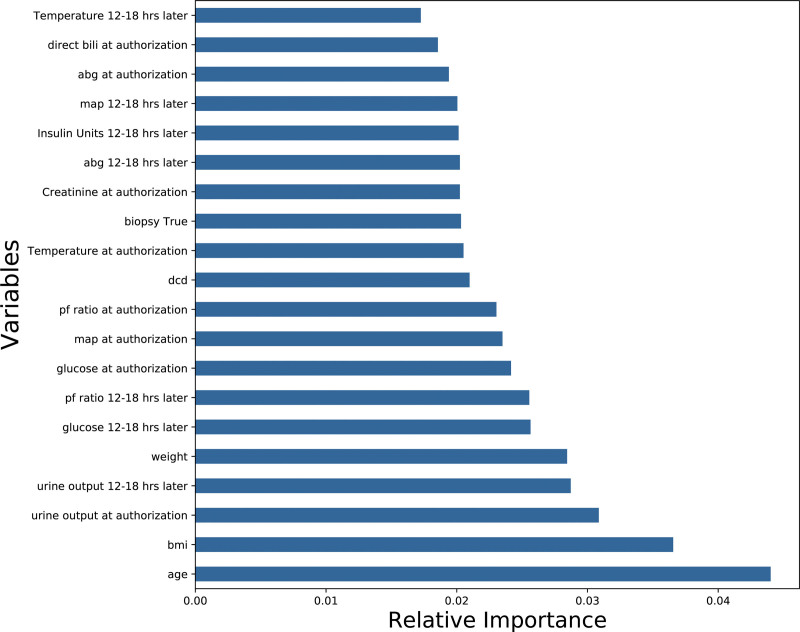
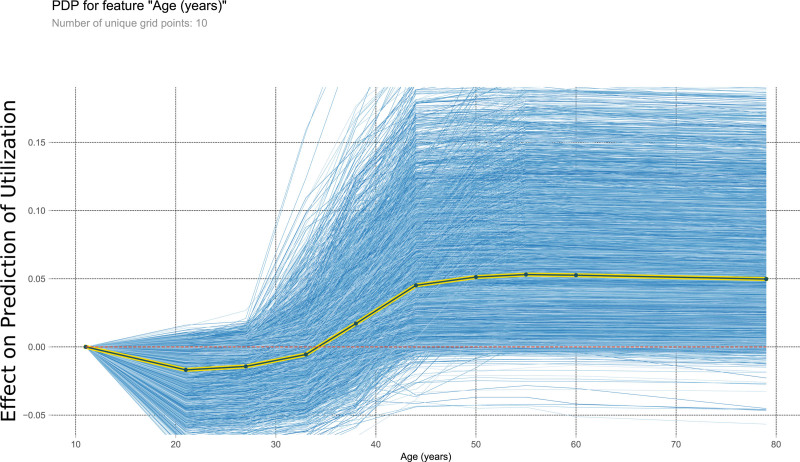
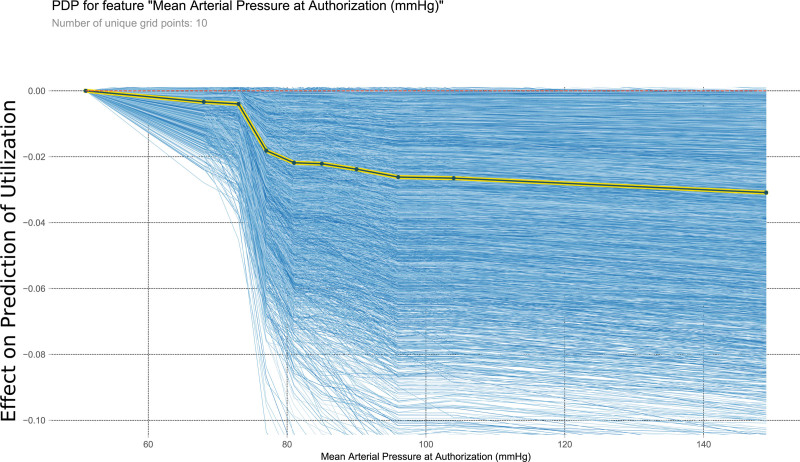
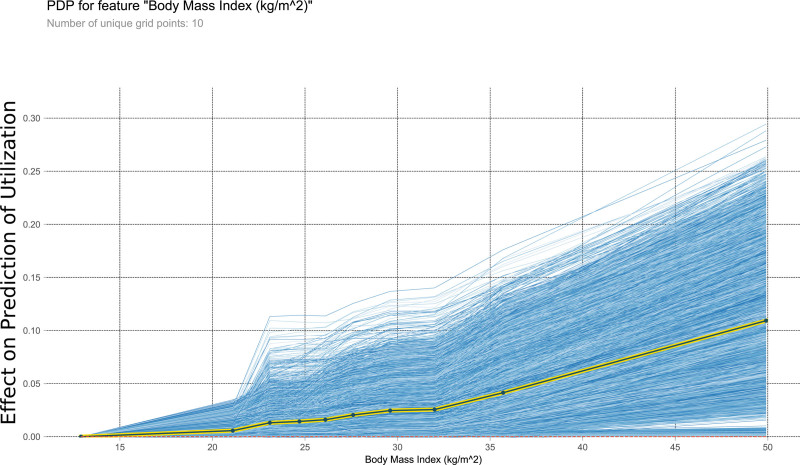
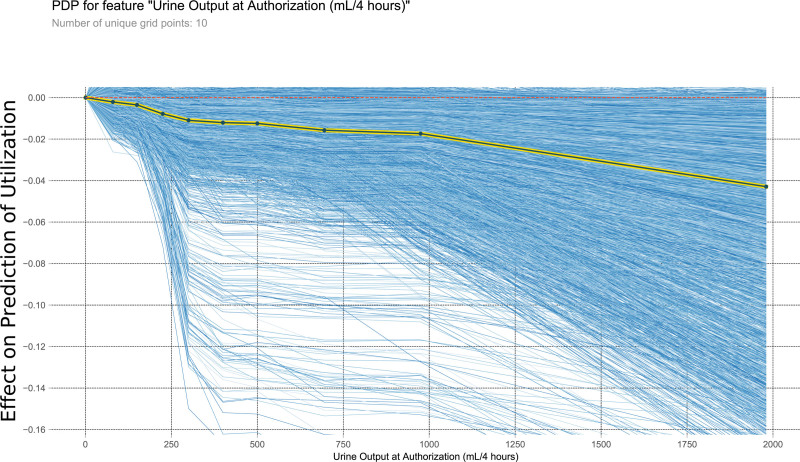
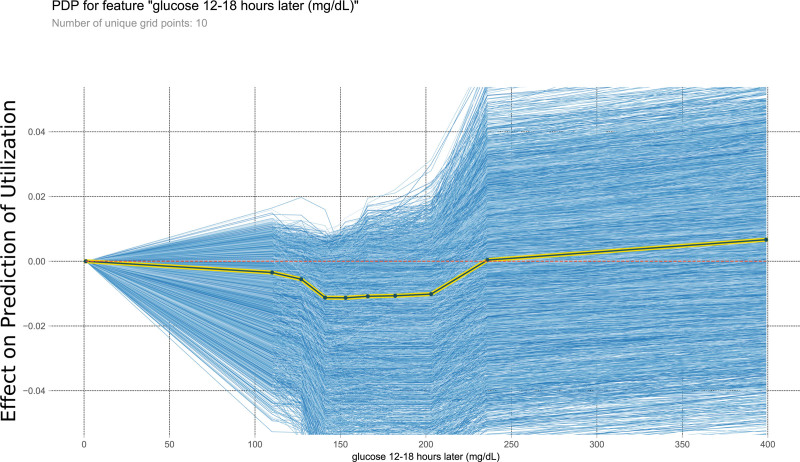
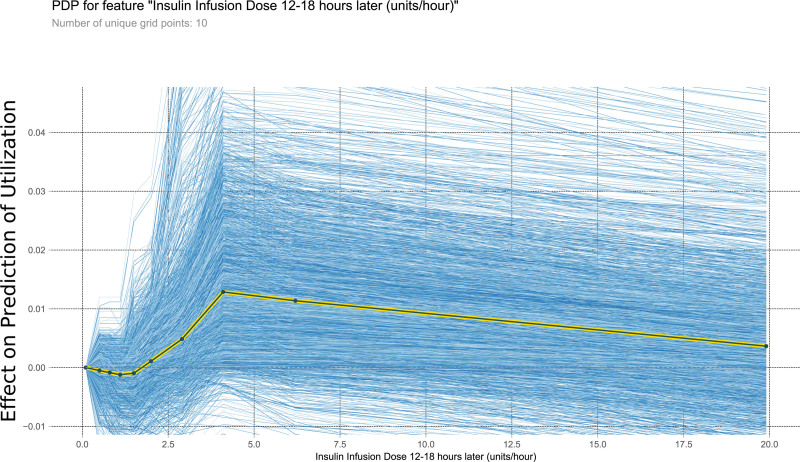
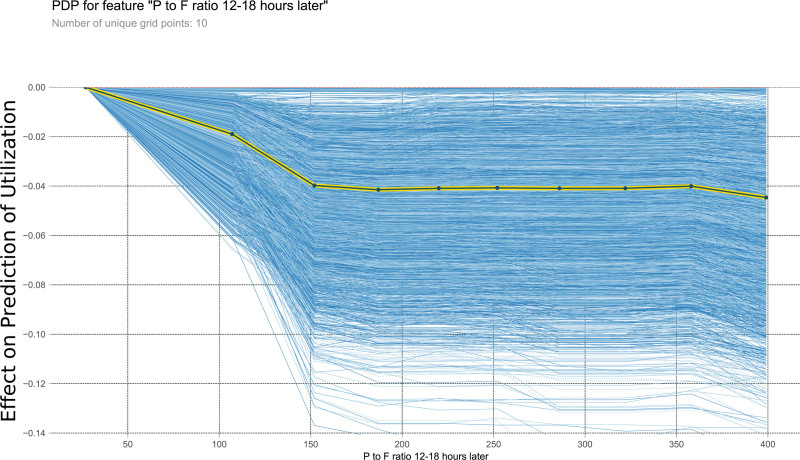
Next, we analyzed the best model (GBM) to elucidate factors predictive of liver utilization. The feature importance of the different variables is shown in Figure 2. The most predictive factors in order of importance were age, BMI, weight, and urine output at time of authorization. The continuous variables with the most predictive value are further examined by partial dependence plots in Figures 3–9. Negative values on the plot suggest correlation with prediction of utilization for transplantation, positive values suggest the variable is correlated with a prediction of nonutilization for transplantation.
FIGURE 2.
Feature importance of each variable in the best (gradient boosting machine) model. The x-axis is the relative importance of each variable measured as the relative quantity the prediction accuracy decreases when only the variable of interest is randomly permuted in the training set. These values are calculated by randomly permuting 1 variable at a time and measuring the decrease in accuracy of the model. Note that, in this case, the models do not explicitly divulge a positive or negative relationship of these variables to the outcome (eg, does increasing or decreasing age make liver transplantation more likely). ABG = pH. ABG, arterial blood gas; bili, bilirubin; BMI, body mass index; DCD, donor after circulatory death; MAP, mean arterial pressure; PF ratio, ratio of arterial blood concentration of oxygen over fraction of inspired oxygen.
FIGURE 3.
This PDP shows the relationship within the model between age and the outcome of interest. It measures the variation in prediction for every row of the training set as the age is iteratively changed to every possible value seen in the training set for that variable (blue lines). The yellow and black line shows the average of the trend of the relationship of the many individual blue lines. Values above 0 on these plots suggest the variable is positively correlated with a prediction of nontransplantation, whereas negative values suggest correlation with prediction of transplantation. PDP, partial dependency plot.
FIGURE 9.
This PDP shows the relationship within the model between mean arterial pressure at authorization and the outcome of interest. It measures the variation in prediction for every row of the training set as the mean arterial pressure at authorization is iteratively changed to every possible value seen in the training set for that variable (blue lines). The yellow and black line shows the average of the trend of the relationship of the many individual blue lines. Values above 0 on these plots suggest the variable is positively correlated with a prediction of nontransplantation, whereas negative values suggest correlation with prediction of transplantation. PDP, partial dependency plot.
FIGURE 4.
This PDP shows the relationship within the model between body mass index and the outcome of interest. It measures the variation in prediction for every row of the training set as the body mass index is iteratively changed to every possible value seen in the training set for that variable (blue lines). The yellow and black line shows the average of the trend of the relationship of the many individual blue lines. Values above 0 on these plots suggest the variable is positively correlated with a prediction of nontransplantation, whereas negative values suggest correlation with prediction of transplantation. PDP, partial dependency plot.
FIGURE 5.
This PDP shows the relationship within the model between urine output at authorization and the outcome of interest. It measures the variation in prediction for every row of the training set as the urine output at authorization is iteratively changed to every possible value seen in the training set for that variable (blue lines). The yellow and black line shows the average of the trend of the relationship of the many individual blue lines. Values above 0 on these plots suggest the variable is positively correlated with a prediction of nontransplantation, whereas negative values suggest correlation with prediction of transplantation. PDP, partial dependency plot.
FIGURE 6.
This PDP shows the relationship within the model between glucose 12–18 h later and the outcome of interest. It measures the variation in prediction for every row of the training set as the glucose 12–18 h later is iteratively changed to every possible value seen in the training set for that variable (blue lines). The yellow and black line shows the average of the trend of the relationship of the many individual blue lines. Values above 0 on these plots suggest the variable is positively correlated with a prediction of nontransplantation, whereas negative values suggest correlation with prediction of transplantation. PDP, partial dependency plot.
FIGURE 7.
This PDP shows the relationship within the model between insulin infusion dose 12–18 h later and the outcome of interest. It measures the variation in prediction for every row of the training set as the insulin infusion dose 12–18 h later is iteratively changed to every possible value seen in the training set for that variable (blue lines). The yellow and black line shows the average of the trend of the relationship of the many individual blue lines. Values above 0 on these plots suggest the variable is positively correlated with a prediction of nontransplantation, whereas negative values suggest correlation with prediction of transplantation. PDP, partial dependency plot.
FIGURE 8.
This PDP shows the relationship within the model between P to F ratio 12–18 h later and the outcome of interest. It measures the variation in prediction for every row of the training set as the P to F ratio 12–18 h later is iteratively changed to every possible value seen in the training set for that variable (blue lines). The yellow and black line shows the average of the trend of the relationship of the many individual blue lines. Values above 0 on these plots suggest the variable is positively correlated with a prediction of nontransplantation, whereas negative values suggest correlation with prediction of transplantation. PDP, partial dependency plot; P to F ratio, ratio of arterial blood concentration of oxygen over fraction of inspired oxygen.
DISCUSSION
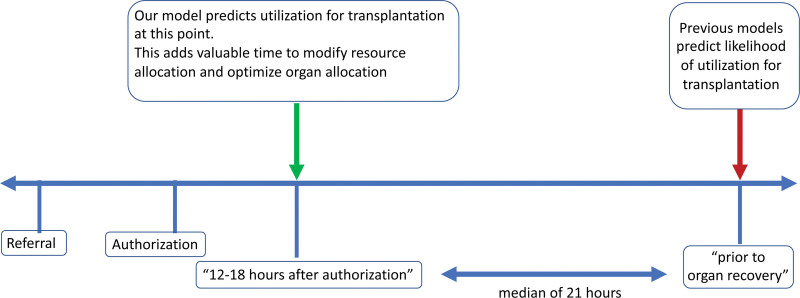
We developed a machine learning model that can accurately predict liver recovery for transplantation in the operating room from a deceased donor 12–18 h after the OPO had begun management of the organ donor. Our study marks the first use of machine learning on detailed data on donor physiology to predict utilization of a donor liver for transplantation. In addition to physiologic and demographic data of the donor, our model also takes into account OPO, region, and hospital information for each prediction. Our GBM model with a ROC-AUC of 0.84 compares favorably when compared to the recently published DSRI,6 and as well the most recently available result of the Scientific Registry of Transplant Recipients yield calculator.7 Our model predicts utilization of a donor liver for transplantation at an early time point during donor management (Figure 10) and is independent of OPO allocation/organ offer protocols and their postings on DonorNet. Because of the granularity of the DMG dataset, we achieved a favorable AUC when compared to the DSRI model but with only 12.4 % of donors and based on data available earlier during the donor management process.
FIGURE 10.
This figure shows a timeline of the events occurring during the donor management process and highlights that our model predicts the outcome much earlier than other published models.
Criteria to determine if a liver is suitable for transplantation are imprecisely defined, and several scoring systems have been developed.13-17 Many of the existing scoring systems are based on unmodifiable, donor demographic data. One study revealed that donor factors associated with delayed or primary nonfunction included increasing age, hypernatremia (sodium levels >155 mEq/L), macrovesicular steatosis (greater than 40%), cold ischemia time longer than 12 h, partial-liver allografts, donor race, extended criteria donor status, and DCD-grafts.18
Meeting DMGs in brain dead organ donors has been associated with improved organ utilization and outcomes for multiple organs. Achieving these critical care endpoints has been associated with an increased number of organs transplanted per donor10,19-21 as well as graft survival rates for specific organs.22-24
The relationship between DBD-donor demographics, meeting DMGs, utilization of a donor liver for transplantation, and graft survival rates of livers has been studied by Bloom et al.22 The authors used prospectively collected data from 8 OPOs and after controlling for known predictors, donor BMI, male sex, normal glucose levels, the use of dopamine at the time of authorization for donation, and the use of vasopressin at time of allocation were associated with improved liver utilization. However, at follow-up, only donor BMI and serum sodium level at the time of allocation of organs were associated with improved graft survival.22 This finding is consistent with several published reports of hypernatremia contributing to graft loss.25-27
We identified several modifiable risk factors to be important (Figure 2) predicting liver utilization, such as urine output, glucose levels, insulin dose, ratio of arterial blood concentration of oxygen over fraction of inspired oxygen, and mean arterial pressure. These risk factors may allow for additional interventions beyond the generally accepted DMG guideline.
Our model also identified nonmodifiable risk factors such as BMI and age. Overall, our model might allow to improve resource allocation during the donor management process. A recent study demonstrated that even livers refused by 5 or more surgical teams can be transplanted successfully via a rescue allocation processes.4 Our model allows timely identification of whether a liver will be used for transplantation, or conversely is at high risk for discard. Two potential interventions aimed at improving an organ’s probability of utilization for transplantation are a reduction of cold ischemia time through local allocation and machine perfusion. Behavioral changes regarding organ acceptance by OPOs and individual transplant centers as well as efficiencies gained in transportation can all affect cold ischemia times. Finally, newer technologies, such as normothermic perfusion, may be able to ameliorate the effects of ischemia time and rehabilitate organs to render them more useable for transplantation. It can facilitate the development and refinement of organ allocation policies to most efficiently manage organ donors and place these organs to maximize recipient utility.
In our GBM model, total number of DMGs met at authorization was one of the findings highly associated with utilization of a donor liver for transplantation. The following DMG’s were among the top fifty most important variables in the GBM model: target CVP (4–12 mm Hg) met at 12–18 h after authorization, target for number of vasopressors (≤1) met at authorization and target pH (7.3–7.5) met at 12–18 h after authorization.
The association between the achievement of DMGs and organ donation outcomes in DCDs has not been previously examined, mainly because DMGs are used by OPO staff to guide the bedside management of DBDs after declaration of death and authorization for organ donation. In contrast, OPO staff are not primarily responsible for the critical care of DCDs, as that remains under the purview of donor hospital staff until the withdrawal of life-sustaining treatment. However, the critical care parameters of a potential DCD can still be evaluated and considered during the allocation process, when OPOs decide which donation opportunities to pursue and transplant programs make organ acceptance decisions.
This study is an example of how machine learning can be utilized to examine a large data set. Machine learning may be useful in identifying important variables among several hundred candidates to help identify donors and donor organs that could benefit from improved donor management.
Given simplicity of the tabular data, GBM and other methods perform better than the neural network. Neural networks excel at analyzing and learning nonlinear associations and patterns within the data that interrelate and form multi-layered groupings of findings that combine to help the model make a prediction.28 The current dataset likely does not hold enough data and not enough dimensions to benefit from a neural network and may even cause overfitting by the neural network. A GBM on the other hand uses residual trees to attempt to capture the left-over components of the data that ascribes itself well to tabular data without overfitting.
The registry does not contain data of potential DBDs who are never taken to the operating room for organ recovery and therefore our model has not been validated in this group of donors. As a result, our model is most useful early during donor management and allows optimized resource allocation well before the donor is taken to the operating room for procurement. Also, we chose not to include any recipient-related factors or outcomes such as findings suggesting graft failure as this allows our model to predict earlier in the donation process but limits the insights into which donor-recipient matches are optimal. Our model does not address recipient outcomes or whether discarded livers should have been used for transplant. Our model cannot address differences between countries as it only includes data from the United States.
Like many other machine learning models, our model provides the probability for each prediction, which can be used as the confidence of the model in the prediction it has just made. These values are used to draw the receiver operator characteristic curves as seen in Figure 1. Also, as our model is a GBM, it can provide the variable importance for each prediction made. These 2 components will allow ease of use and interpretability of the model by providers and allow providers additional information in instances when the model makes a different prediction than their own clinical expertise. Although these interpretability tools can be helpful in making decisions, they do not describe a causation relationship between these important input variables and the outcome, they only provide explanation of the model’s prediction.
In summary, a GBM machine learning model was used to accurately classify donor livers as likely to be utilized for transplantation or not. Our model was able to predict utilization earlier in the donor management process than previously published models. Such a model will be crucial in efforts to define and improve a rescue allocation system for liver transplantation.
ACKNOWLEDGMENTS
We would like to thank Atul Butte for his support during the submission and the DMG Registry/United Network for Organ Sharing (UNOS)/OPTN staff, donors, and families from each of the OPOs (listed below) who contributed to the dataset. OPO—Name: AZOB—Donor Network of Arizona, CADN—California Transplant Donor Network, CAGS—Golden State Donor Services, CAOP—OneLegacy, NMOP—New Mexico Donor Services, NVLV—Nevada Donor Network, UTOP—DonorConnect, CASD—Lifesharing—A Donate Life Organization, TXGC—LifeGift, ORUO—Pacific Northwest Transplant Bank, MIOP—Gift of Life Michigan, GALL—LifeLink of Georgia, ILIP—Gift of Hope, MAOB—New England Organ Bank, TXSB—Southwest Transplant Alliance, TNDS—Tennessee Donor Services, CORS—Donor Alliance, and FLFH—TransLife.
Supplementary Material
Footnotes
Published online 27 September, 2021.
This study was supported in part by departmental funds (Department of Anesthesia and Perioperative Care San Francisco, University of California, San Francisco, CA).
T32 NIH funding 5T32GM008440 PI: Judith Hellman (A.M.B.) and Arnold Ventures, Houston, TX (C.U.N. and D.J.M.), Department of Health and Human Services R38OT22183 (C.U.N.).
The data reported here have been supplied by United Network for Organ Sharing (UNOS) as the contractor for the Organ Procurement and Transplantation Network (OPTN). The interpretation and reporting of these data are the responsibility of the author(s) and in no way should be seen as an official policy of or interpretation by the OPTN or the US Government.
A.M.B. and J.D.N. are cofounders of Bezel Health, a company building software to measure and improve healthcare quality interventions. The other authors declare no conflicts of interest.
The data that support the findings of this study are available from donor management goal (DMG) Registry Web Portal. Restrictions apply to the availability of these data, which were used under license for this study. Data may be requested through https://dmginfo.nationaldmg.org/ with the permission of the Organ Procurement and Transplantation Network (OPTN) and the DMG Registry Advisory Group.
A.M.B., D.A., C.U.N., and D.J.M drafted the study protocol. C.U.N. and D.A obtained Institutional Review Board approval. C.U.N., D.A., and D.J.M data request and collection. A.M.B., D.S.L., D.D.H., J.D.N., D.A., C.U.N., and R.P.K performed the statistical analysis. A.M.B., D.S.L., D.A., J.D.N., C.U.N., and D.J.M prepared the article. A.M.B., D.S.L., D.A., J.D.N., R.H., C.U.N., M.B.S., R.P.K., D.J.M., and D.D.H reviewed and edited the article.
Supplemental digital content (SDC) is available for this article. Direct URL citations appear in the printed text, and links to the digital files are provided in the HTML text of this article on the journal’s Web site (www.transplantationdirect.com).
References
- 1.Kim WR, Lake JR, Smith JM, et al. OPTN/SRTR 2017 annual data report: liver. Am J Transplant. 2019;19(suppl 2):184–283. [DOI] [PubMed] [Google Scholar]
- 2.Escartín A, Castro E, Dopazo C, et al. Analysis of discarded livers for transplantation. Transplant Proc. 2005;37:3859–3860. [DOI] [PubMed] [Google Scholar]
- 3.Pezzati D, Ghinolfi D, De Simone P, et al. Strategies to optimize the use of marginal donors in liver transplantation. World J Hepatol. 2015;7:2636–2647. [DOI] [PMC free article] [PubMed] [Google Scholar]
- 4.Giretti G, Barbier L, Bucur P, et al. Recipient selection for optimal utilization of discarded grafts in liver transplantation. Transplantation. 2018;102:775–782. [DOI] [PubMed] [Google Scholar]
- 5.Arjona-Sánchez A, Sánchez-Hidalgo JM, Ciria-Bru R, et al. Prediction model to discard a priori liver allografts. Transplant Proc. 2014;46:3076–3078. [DOI] [PubMed] [Google Scholar]
- 6.Rana A, Sigireddi RR, Halazun KJ, et al. Predicting liver allograft discard: the discard risk index. Transplantation. 2018;102:1520–1529. [DOI] [PubMed] [Google Scholar]
- 7.Messersmith EE, Arrington C, Alexander C, et al. Development of donor yield models. Am J Transplant. 2011;11:2075–2084. [DOI] [PubMed] [Google Scholar]
- 8.Scientific Registry of Transplant Recipients. SRTR risk adjustment model documentation: deceased donor yield models. Available at https://www.srtr.org/reports-tools/opos/. Accessed September 19, 2019.
- 9.Donor Management Goals. Donor Management Goals. Available at https://dmginfo.nationaldmg.org/. Accessed August 5, 2019.
- 10.Patel MS, Zatarain J, De La Cruz S, et al. The impact of meeting donor management goals on the number of organs transplanted per expanded criteria donor: a prospective study from the UNOS Region 5 Donor Management Goals Workgroup. jama Surg. 2014;149:969–975. [DOI] [PubMed] [Google Scholar]
- 11.Sally MB, Ewing T, Crutchfield M, et al.; United Network for Organ Sharing (UNOS) Region 5 Donor Management Goals (DMG) Workgroup. Determining optimal threshold for glucose control in organ donors after neurologic determination of death: a United Network for Organ Sharing Region 5 Donor Management Goals Workgroup prospective analysis. j Trauma Acute Care Surg. 2014;76:62–69. [DOI] [PubMed] [Google Scholar]
- 12.Chen T, Guestrin C. XGBoost: a scalable tree boosting system. In: KDD ’16: Proceedings of the 22nd ACM SIGKDD International Conference on Knowledge Discovery and Data Mining. Association for Computing Machinery; 2016:785–794. [Google Scholar]
- 13.Feng S, Goodrich NP, Bragg-Gresham JL, et al. Characteristics associated with liver graft failure: the concept of a donor risk index. Am j Transplant. 2006;6:783–790. [DOI] [PubMed] [Google Scholar]
- 14.Ferraz-Neto BH, Zurstrassen MPVC, Hidalgo R, et al. Donor liver dysfunction: application of a new scoring system to identify the marginal donor. Transplant Proc. 2007;39:2516–2518. [DOI] [PubMed] [Google Scholar]
- 15.Bonney GK, Aldersley MA, Asthana S, et al. Donor risk index and MELD interactions in predicting long-term graft survival: a single-centre experience. Transplantation. 2009;87:1858–1863. [DOI] [PubMed] [Google Scholar]
- 16.Merion RM, Goodrich NP, Feng S. How can we define expanded criteria for liver donors? J Hepatol. 2006;45:484–488. [DOI] [PubMed] [Google Scholar]
- 17.Briceño J, Ciria R, de la Mata M, et al. Prediction of graft dysfunction based on extended criteria donors in the model for end-stage liver disease score era. Transplantation. 2010;90:530–539. [DOI] [PubMed] [Google Scholar]
- 18.Alkofer B, Samstein B, Guarrera JV, et al. Extended-donor criteria liver allografts. Semin Liver Dis. 2006;26:221–233. [DOI] [PubMed] [Google Scholar]
- 19.Franklin GA, Santos AP, Smith JW, et al. Optimization of donor management goals yields increased organ use. Am Surg. 2010;76:587–594. [DOI] [PubMed] [Google Scholar]
- 20.Hagan ME, McClean D, Falcone CA, et al. Attaining specific donor management goals increases number of organs transplanted per donor: a quality improvement project. Prog Transplant. 2009;19:227–231. [DOI] [PubMed] [Google Scholar]
- 21.Malinoski DJ, Patel MS, Daly MC, et al.; UNOS Region 5 DMG Workgroup. The impact of meeting donor management goals on the number of organs transplanted per donor: results from the United Network for Organ Sharing Region 5 prospective donor management goals study. Crit Care Med. 2012;40:2773–2780. [DOI] [PubMed] [Google Scholar]
- 22.Bloom MB, Raza S, Bhakta A, et al. Impact of deceased organ donor demographics and critical care end points on liver transplantation and graft survival rates. j Am Coll Surg. 2015;220:38–47. [DOI] [PubMed] [Google Scholar]
- 23.Sally MB, Ellis MK, Hutchens M, et al. Deceased organ donor factors influencing pancreatic graft transplantation and survival. Clin Transplant. 2019;33:e13571. [DOI] [PMC free article] [PubMed] [Google Scholar]
- 24.Malinoski DJ, Patel MS, Ahmed O, et al.; United Network for Organ Sharing (UNOS) Region 5 Donor Management Goals (DMG) Workgroup. The impact of meeting donor management goals on the development of delayed graft function in kidney transplant recipients. Am j Transplant. 2013;13:993–1000. [DOI] [PubMed] [Google Scholar]
- 25.González FX, Rimola A, Grande L, et al. Predictive factors of early postoperative graft function in human liver transplantation. Hepatology. 1994;20:565–573. [DOI] [PubMed] [Google Scholar]
- 26.Avolio AW, Agnes S, Magalini SC, et al. Importance of donor blood chemistry data (AST, serum sodium) in predicting liver transplant outcome. Transplant Proc. 1991;23:2451–2452. [PubMed] [Google Scholar]
- 27.Figueras J, Busquets J, Grande L, et al. The deleterious effect of donor high plasma sodium and extended preservation in liver transplantation. A multivariate analysis. Transplantation. 1996;61:410–413. [DOI] [PubMed] [Google Scholar]
- 28.LeCun Y, Bengio Y, Hinton G. Deep learning. Nature. 2015;521:436–444. [DOI] [PubMed] [Google Scholar]
Associated Data
This section collects any data citations, data availability statements, or supplementary materials included in this article.


