

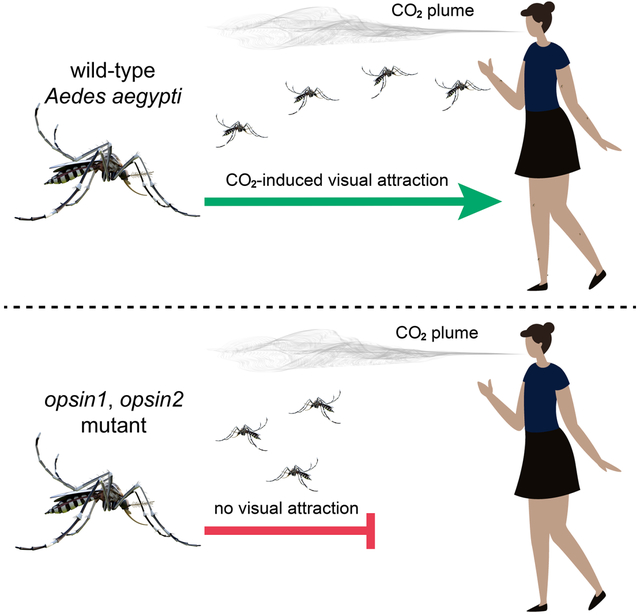
Summary
Blood-feeding insects, such as the mosquito, Aedes (Ae.) aegypti, use multiple senses to seek out and bite humans. 1,2 Upon exposure to the odor of CO2, the attention of female mosquitoes to potential targets is greatly increased. Female mosquitoes are attracted to high contrast visual cues and use skin olfactory cues to assist them in homing in on targets several meters away. 3-9 Within close range, convective heat from skin and additional skin odors further assist the mosquitoes evaluation as to whether the object of interest might be a host. 10,11 Here, using CRISPR/Cas9 we mutated the gene encoding Op1, which is the most abundant of the five rhodopsins expressed in the eyes of Ae. aegypti. Using cage and wind tunnel assays, we found that elimination of op1 did not impair CO2-induced target seeking. We then mutated op2, which encodes the rhodopsin most similar to Op1, and also found that there was no impact on this behavior. Rather, mutation of both op1 and op2 was required to abolish vision-guided target attraction. In contrast, the double mutants exhibited normal phototaxis and odor-tracking responses. By measuring the walking optomotor response, we found that the double mutants still perceived optic flow. In further support of the conclusion that the double mutant is not blind, the animals retained an electrophysiological response to light, although it was diminished. This represents the first genetic perturbation of vision in mosquitoes and indicates that vision-guided target attraction by Ae. aegypti depends on two highly related rhodopsins.
Keywords: Target recognition, mosquito, wind tunnel, vision, rhodopsin, optomotor
Graphical Abstract
eTOC blurb
When female Aedes aegypti sense CO2 from human breadth, their attention to other human-derived stimuli, including visual cues, greatly increases. Using CRISPR, Zhan et al. knockout two of the five opsins in the eyes and show that this eliminates attraction to visual targets after CO2 stimulation, while other vision-dependent behaviors remain.
Results and Discussion
The mosquito, Aedes (Ae.) aegypti, infects many millions of people each year with flaviviruses that cause diseases ranging from dengue to yellow fever, chikungunya, and Zika. 12 Only females bite, and they do so because they require nutrients from blood meals for egg development. 13 Unlike Anopheline malaria vectors, which bite primarily at night, Ae. aegypti seek out humans during daylight, particularly around dawn and dusk. 14,15 Upon detecting CO2 plumes from human breath at a distance of up to many meters 16, anthropophilic female mosquitoes such as Ae. aegypti become much more responsive to visual cues and other host stimuli that signal potential humans such as skin odors. 3-7,9 Ae. aegypti are especially attracted to people wearing dark clothing. 17-19 Even in the absence of humans, CO2 stimulates mosquitoes to seek out darker over lighter images. 18,19 As a consequence of their poor visual acuity 20-22, a dark spot is sufficient to attract them. 3 Once the animals are guided to within a few centimeters of targets using visual and olfactory cues, then thermal and additional skin olfactory stimuli allow female mosquitoes to determine whether it is a potential host. 1,23 The effectiveness of CO2 in enhancing the responses to visual cues and other host stimuli appears to be due to CO2-induced increases in the propensity to turn and fly upwind, and by very rapid sensitization to host stimuli through unknown mechanisms. 3,6,24
Despite the importance of the integration of CO2 and visual stimuli for long- and mid-range target detection in diurnal mosquitoes, there are no studies dissecting the roles of rhodopsins or other signaling proteins required for vision in any insect disease vector. The Aedes genome encodes 10 opsins, although only 5 are expressed in the compound eyes. 25-29 To uncover the molecular mechanisms of vision-guided target recognition, we explored the potential role of GPROp1 (Op1), since this visual pigment is the most widely-expressed rhodopsin in the eyes. There are eight photoreceptor cells (R1-R8) in each repeat unit (ommatidium) in the compound eye, and Op1 is expressed in the six outer photoreceptor cells (R1-6) and many R8 cells.28
We used CRISPR/Cas9 to generate two independent op1 alleles via homology-directed repair. The op1R allele includes a 10 base-pair deletion and an insertion of the DsRed gene after the sequence encoding residue 72 (Figure 1A). The op1G mutation is characterized by an 8 base pair deletion and an insertion of the GFP gene after residue 82 (Figure 1A). We generated homozygous lines, which we confirmed by PCR (Figure S1A) and DNA sequencing. Based on real-time quantitative PCR, the op1 RNA was dramatically reduced in both alleles (Figure 1B). We generated Op1 antibodies, and confirmed that the Op1 protein was undetectable (Figure 1C).
Figure 1. Generation of op1 and op2 mutants, cage assay for CO2-induced target selection and transmission electron microscopy.

(A) Structures of the op1 gene and illustration of op1R and op1G alleles.
(B) Normalized mRNA expression of op1 alleles compared to the wild-type control determined by quantitative real-time PCR (n=6).
(C) Western blot containing extracts from the indicated heads probed with anti-Op1 and anti-actin. Protein size markers (kilodaltons) are shown to the left.
(D) Schematic of the cage for vision-guided host-seeking assay. The orange squares around the black and white circles represent the regions used to document the trajectories.
(E) Vision-guided target selection cage assay showing the preference indexes of the indicated females for the black versus the white spot under clean air conditions at 1000 lux. n=6 (50 females/assay). Total trajectories: control, n=23—51; op1R, n=35—64; op1G, n=17—86; op2R, n=29—51; op2G, n=30—64; op1R,op2G, n=24—48; op1G,op2R, n=19—42.
(F) Vision-guided target selection cage assay showing the preference indexes of the indicated females for the black versus the white spot exposed to 5% CO2 at 1000 lux. n=6 (50 females/assay). Total trajectories: control, n=87—146; op1R, n=52—183; op1G, n=45—167; op2R, n=63—129; op2G, n=76—204; op1R,op2G, n=34—51; op1G,op2R, n=26—60.
(G) Structures of the op2 gene and illustration of the op2R and op2G alleles.
(H) Normalized mRNA expression level of op2 alleles compared to the wild-type control determined by quantitative real-time PCR (n=6).
(I) Locomotor activities monitored over 14-hours in a LAM system. Counts are the number of times the mosquitoes broke the infrared beam. n=15.
(J and K) Transmission EM images of single ommatidia at the surface distal layer. Scale bars, 2 μm. The rhabdomeres corresponding to photoreceptor cells 1—7 are indicated. J, Wild-type. K, op1R,op2G.
(L and M) Transmission EM images of single ommatidia at the distal layer. The rhabdomeres corresponding to photoreceptor cells 1—6 and 8 are indicated. Scale bars, 2 μm. L, Wild-type. M, op1R,op2G.
One-way ANOVA with Tukey’s multiple comparisons test for (B) and (H), and Kruskal-Wallis test with Dunn’s multiple comparison test for (E, F, and I). Means ± SEMs. n.s., not significant. **P<0.01, ***P<0.001. See also Figure S1, Tables S1-S4.
To test whether mutation of op1 impairs CO2-stimulated host target attraction, we devised an assay in a 30 x 30 x 30 cm insect cage that is based conceptually on work using wind tunnels. 3 A previous wind tunnel study showed that in the presence of a stream of CO2, but in the absence of a human, female mosquitoes are attracted to a black feature, which they then investigate. 3 To create a simplified assay for measuring CO2-stimulated guidance to a visual feature, we placed two small black and white circles at one end of a cage (Figure 1D). We inserted 50 non-blood-fed females into the cage and recorded their trajectories for 30 minutes (no added CO2). We then introduced 5% CO2, which increased their activity, and recorded their trajectories for 3 minutes. We quantified the total number of times the mosquitoes explored a small fictive area (6 cm x 6 cm) around the black and white circles and calculated a preference index.
We found that under standard air conditions (i.e. no additional CO2) control females had no preference for the black or white spot (Figure 1E), or for the black spot versus another random area in the cage (Figures S1C and S1D). In contrast, upon exposure to CO2 the control females exhibited a strong preference for the black spot (Figure 1F), reminiscent of previous wind tunnel experiments. 3 The preference for the black spot was similar at 1000 lux, 100 lux and 25 lux (Figures 1F, S1E and S1F). However, at 5 lux the preference for the black spot was significantly (Figure S1G) reduced relative to the responses at 100 lux and 1000 (p<0.01 for both; Mann-Whitney U test). The mean differences between 5 lux and 25 lux was similar, but fell below the threshold for significance (p=0.18; Mann-Whitney U test) due the more variable data under the 25 lux conditions. We then analyzed the op1R and op1G mutants. In the absence of CO2 stimulation, they had no bias for either the black or white spots (Figure 1E). Upon addition of CO2, the op1 mutant females were as attracted to the dark feature as control animals under all light intensities tested (Figures 1F and S1E-S1G). Thus, Op1 is either irrelevant for recognition of the visual feature or is functionally redundant with another rhodopsin.
The rhodopsin most related to Op1 is GPROp2 (Op2), which is 89.8% identical to Op1 and is expressed in a subset of R7 photoreceptor cells. 25,30 The next most related visual rhodopsins, Op3 and Op7, are 79.9 and 64.3% identical, respectively. We used CRISPR/Cas9 to generate two op2 alleles. op2R has a 14 base pair deletion and an insertion of the DsRed gene at the start codon, and op2G has an 11 base pair deletion beginning after the sequence encoding residue 75 and an insertion of the GFP gene (Figure 1G). We verified the mutations by PCR (Figure S1B) and DNA sequencing and confirmed that expression was eliminated by real-time quantitative PCR (Figure 1H). Using the cage assays, we tested CO2-stimulated visual target attraction and found that the op2 mutants behaved similarly to the controls under all light intensities (Figure 1F and S1E-G).
Due to the lack of impairment resulting from mutation of either op1 or op2 alone, we generated and tested the effects of two double mutants: op1R,op2G and op1G,op2R. The double mutant females exhibited normal body sizes (Figure S1H) and locomotor activities using a TriKinetics LAM assay system, which counted the number of times animals cross an infrared beam over 24 hours (Figure 1I). To determine whether the double mutation impacted retinal morphology, we performed transmission electron microscopy using eyes from females in the same age range used for the behavioral assays (4 days). Each ommatidium contains eight photoreceptors, each of which includes a microvillar portion, the rhabdomeres, which contain the rhodopsins. 30-32 In Ae. aegypti, the rhabdomeres are fused. 31,32 Six photoreceptor cells (R1—R6) have rhabdomeres that extend the full depth of the retina (Figures 1J and 1L). The R7 rhabdomere is evident in the surface distal layer (Figure 1J), while the R8 rhabdomere is in a distal layer that is slightly more proximal (Figure 1L). The morphology of the op1R,op2G rhabdomeres was indistinguishable from the controls (Figures 1K and 1M).
We then tested the attraction of the op1,op2 double mutants to the black feature. Under standard air conditions, the double mutant females had no preference for the black versus the white circles (Figure 1E). However, both op1,op2 double mutants exhibited a dramatic deficit in CO2-stimulated visual target attraction, which was nearly eliminated even under the highest light intensities of 1000 lux and 100 lux (Figure 1F and S1E). Under lower light (25 lux and 5 lux), the attraction to the dark spot was abolished (Figures S1F and S1G). In contrast, the double mutants exhibited normal CO2-induced attraction to human skin odors (Figures S1I and S2J).
In a natural environment, detection of a CO2 plume induces female Ae. aegypti to surge upwind and use vision to find a human host. 3-6 This behavior has been modeled using a wind tunnel. 3 To determine whether the phenotypes exhibited using the cage assay reflected their behavior in the presence of wind, we used a wind tunnel that spans 450-body lengths of the mosquito, which contained black and white spots (Figure 2A). We recorded flight trajectories of 50 non-blood-fed female mosquitoes in the presence of 100 lux. When control females are exposed to air with normal, atmospheric levels of CO2 (~400 ppm) they fly randomly and there is no preference for the black over the white spot or in comparison to elsewhere in the tunnel (Figures 2B, 2L and S2A). As previously described 3, after exposing control females to a 5% CO2 plume, they greatly increase their exploration of the black object (Figures 2C and S2B). The percent of trajectories in a 14 x 14 x 4 cm (width/length/height) vicinity of the black spot increased >5-fold in the presence of CO2 versus standard air (11.7% vs. 2.3%; Figures 2L and 2M). The mosquitoes did not exhibit any CO2-induced attractive behavior to one spot over the other if both spots were white (Figures S2C and S2D). In the presence of CO2 but in the absence of a distinct visual feature, we often observed preferred trajectories in other locations, such as near the top of the wind tunnel, or near the center during exposure to CO2 (Figures S2C and S2D). Air alone (no CO2) in the presence of a black spot also causes trajectories near the top of the tunnel (Figure S2A). The CO2-induced attraction to the black feature was not due to differences in temperature between the black and white spots, as assessed using a thermal camera (Figures S2E and S2F). We tested control mosquitoes at 25 lux and 5 lux (Figures 2M, S3A and S3B) and found that at 5 lux, the percentage of trajectories around the black spot (6.9%) was significantly lower than at either 25 lux or 100 lux (p<0.001. Fisher’s exact test for contingency table comparison).
Figure 2. Wind tunnel assays with op1 and op2 single mutants.

(A) Schematic of the wind tunnel assay.
(B—K) Heat-maps showing the flight trajectories of the indicated females exposed to standard air or 5% CO2 at 100 lux. Shown are the views of the x and y axes. See Figure S2A, S2B, S2G-S2N for the views of the x and z axes. The orange squares define the regions used to document the trajectories near the black and white circles. The squares are shifted slightly toward the downwind sides. The colored scale bars indicate the % residency. Differences in the number of trajectories listed below were due to variations in the numbers of mosquitoes available on different days.
(B) Control (standard air). n=5,597 trajectories. n=400 mosquitoes.
(C) Control (5% CO2). n=14,611 trajectories. n=400 mosquitoes.
(D) op1R (standard air). n=7,680 trajectories. n=350 mosquitoes.
(E) op1G (standard air). n=4,221 trajectories. n=250 mosquitoes.
(F) op1R (5% CO2). n=15,586 trajectories. n=350 mosquitoes.
(G) op1G (5% CO2). n=6,662 trajectories. n=250 mosquitoes.
(H) op2R (standard air). n=986 trajectories. n=150 mosquitoes.
(I) op2G (standard air) n=5,731 trajectories. n=250 mosquitoes.
(J) op2R (5% CO2). n=1,238 trajectories. n=150 mosquitoes.
(K) op2G (5% CO2). n=6,913 trajectories. n=250 mosquitoes.
(L) Percent trajectories near the black spot versus other places under standard air conditions (100 lux). Total trajectories: control, n=2,493; op1R, n=7,680; op1G, n=4,221; op2R, n=1,784; op2G, n=5,731. Total mosquitoes: control, n=200; op1R, n=350; op1G, n=250; op2R, n=150; op2G, n=250.
(M) Percent of trajectories near the black spot versus other places when exposed to 5% CO2 (100 lux). Total trajectories: control, n=6,876; op1R, n=15,586; op1G, n=6,662; op2R, n=2,249; op2G, n=6,913. Total mosquitoes: control, n=200; op1R, n=350; op1G, n=250; op2R, n=150; op2G, n=250.
(N) Percent time that the females spent near the black spot versus other places in the presence of 5% CO2 (100 lux). Total trajectories: control, n=803; op1R, n=1,822; op1G, n=795; op2R, n=234; op2G, n=885. Total mosquitoes: control, n=200; op1R, n=350; op1G, n=250; op2R, n=150; op2G, n=250.
Fisher’s exact test for (L) and (M). Bootstrapped 95% confidence interval of the mean, and Mann-Whitney U test with Bonferroni correction for (N). n.s., not significant. See also Figure S2.
We found that the op1 and the op2 single mutant females exhibited behaviors indistinguishable from the controls. Under standard air they were indifferent to the black spot (Figures 2D, 2E, 2H, 2I, 2L, S2G, S2H, S2K and S2L), and upon exposure to 5% CO2 they showed the same attraction to the black feature as control females at different light intensities (Figures 2F, 2G, 2J, 2K, 2M, 2N, S2I, S2J, S2M, S2N and S3A-S3D).
Odor-gated optomotor anemotaxis is a strategy used by insects, including mosquitoes, to navigate to odor sources. Upon encountering a CO2 plume, the navigating mosquito orients to the wind direction and surges upwind. Visual feedback, in the form of optic flow, provides information on wind direction and wind speed, allowing the mosquito to track the plume before landing on the host. 33 We examined whether the mutants had deficits in their odor-tracking behavior by quantifying their orientation to the upwind odor source and in investigating the visual objects over time. The opsin single mutants were indistinguishable from the wild-type controls. All lines exhibited semi-random orientation during the clean air treatment before orienting to the odor source during the CO2 exposure (Figures S3E-S3G and S3I-S3K). Similarly, few of the control and single mutants investigated the visual objects over the time that they were exposed to ambient air (Figures S3M-S3O), whereas during the 1 hour exposure to CO2, the mosquitoes constantly investigated the visual objects without a significant change in this behavior (Figures S3M-S3O). The opsin single mutants' flight times per trajectory, flight velocities, and overall distances flown were indistinguishable from the controls (Figures S2I-S2K, S3Q and S3R).
We then tested the double opsin mutants in the wind tunnel. In the absence of added CO2, the op1R,op2G and op1G,op2R females were not attracted to the black spot, similar to the controls (Figures 3A, 3B, 3E, 3F and 3I). However, upon exposure to CO2, the double mutants did not exhibit any increase in trajectories in the vicinity of the black feature (Figures 3C, 3D, 3G, 3H, 3J, S3A and S3B). In addition, the percentage of time that they spent near the black spot was greatly reduced compared to control females (Figure 3K, S3C, S3D and S3P). However, in the presence of CO2, the double mutants often displayed biases in favor of zones other than the black spots, including the top of the wind tunnel, or in front of the CO2 source (Figures 3C, 3D, 3G and 3H). The bias near the CO2 source was reflected in their optomotor anemotactic response, as the double mutants oriented in the upwind direction similar to the controls and the single mutants (Figure S3I-S3L). The opsin double mutants' flight times per trajectory, flight velocities, and overall distances flown were similar to controls (Figure 3L, S3Q and S3R), indicating that the defect in guidance to the object were not attributable to loss of sustained flight or defects in flight control. Overall, these data indicate that the cage assay provides a simplified alternative to a wind tunnel assay for laboratories that do not have access to wind tunnels. Moreover, the cage and wind tunnel findings support that mutation of both op1 and op2 greatly impairs CO2-induced vision-guided target attraction.
Figure 3. Wind tunnel assays with op1,op2 double mutants.

(A—H) Heat-maps showing flight trajectories of op1,op2 double mutant females exposed to standard air or 5% CO2 (100 lux). The orange squares define the regions used to document the trajectories near the black or white objects. The colored scales bar indicate the % residency.
(A and B) op1R,op2G (standard air). A, View of x, y axes. B, View of x, z axes. n=3,326 trajectories. n=350 mosquitoes.
(C and D) op1R,op2G (5% CO2). C, View of x, y axes. D, View of x, z axes. n=10,615 trajectories. n=350 mosquitoes.
(E and F) op1G,op2R (standard air). E, View of x, y axes. F, View of x, z axes. n=556 trajectories. n=200 mosquitoes.
(G and H) op1G,op2R (5% CO2). G, View of x, y axes. H, View of x, z axes. n=2,893 trajectories. n=200 mosquitoes.
(I) Percent of trajectories near the black spot versus other places under standard air conditions (100 lux). Total trajectories: control, n=3,104; op1R,op2G, n=3,326; op1G,op2R, n=556. Total mosquitoes: control, n=200; op1R,op2G, n=350; op1G,op2R, n=200.
(J) Percent of trajectories near the black spot versus other places when exposed to 5% CO2 (100 lux). Total trajectories: control, n=7,735; op1R,op2G, n=10,615; op1G,op2R, n=2,893. Total mosquitoes: control, n=200; op1R,op2G, n=350; op1G,op2R, n=200.
(K) Percent of time mosquitoes spent near the black spot versus other places in the presence of 5% CO2 (100 lux). Total trajectories: control, n=900; op1R,op2G, n=142; op1G,op2R, n=71. Total mosquitoes: control, n=200; op1R,op2G, n=350; op1G,op2R, n=200.
(L) Flight time per trajectory exhibited by the indicated mosquitoes in the presence of 5% CO2 condition (100 lux). Total trajectories: control, n=7,735; op1R,op2G, n=10,615; op1G,op2R, n=2,893. Total mosquitoes: control, n=200; op1R,op2G, n=350; op1G,op2R, n=200.
Fisher’s exact test for (I) and (J). Bootstrapped 95% confidence interval of the mean, and Mann-Whitney U test with Bonferroni correction for (K) and (L). n.s., not significant. **P<0.01, ***P<0.001. See also Figure S3.
The inability of the op1,op2 double mutants to recognize the visual target raised the possibility that the animals were unable to detect visual stimuli or even light. To determine if the mutant mosquitoes respond behaviorally to light, we tested whether they exhibited positive phototaxis upon stimulation with CO2. We found that the single and double mutants exhibited phototaxis indexes similar to the controls (Figure 4A), and therefore sense ambient light.
Figure 4. Phototaxis, optomotor responses and ERG responses exhibited by opsin mutants.
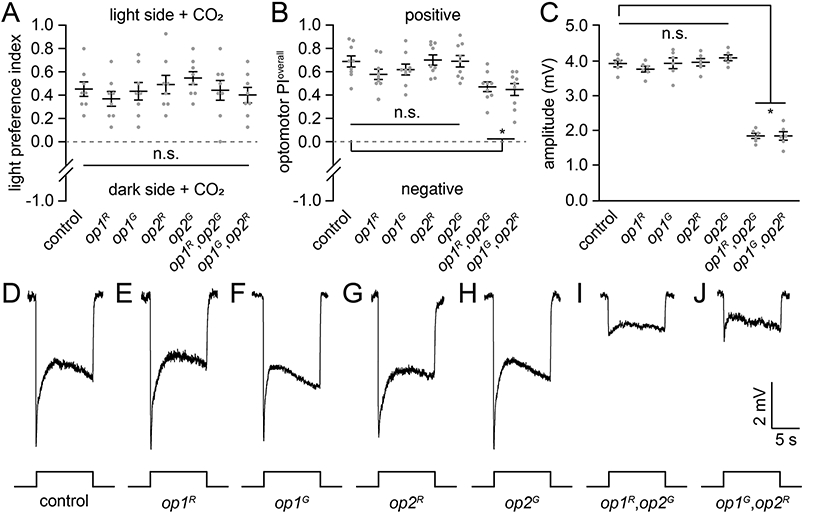
Assays were performed using females.
(A) Phototaxis assays (500 lux). n=8 (30 females/assay).
(B) Optomotor responses (500 lux). n=9.
(C) ERG amplitudes in response to ~1000 lux white light. n=6.
(D—H) ERG recordings in response to a 10 sec ~1000 lux white light pulse. D, Control. E, op1R. F, op1G. G, op2R. H, op2G. I, op1R,op2G. J, op1G,op2R.
Statistics performed using the Kruskal-Wallis test with the Dunn’s multiple comparisons test for (A) and (B). ANOVA with Tukey’s multiple comparisons test for (C). Means ±SEMs. n.s., not significant. *P<0.05. See also Figure S4.
To ascertain whether the mutants respond to optic flow, we examined the walking optomotor response, which is a wide-field motion-driven reflex. 34 This is distinct from voluntary small-field object selection that mosquitoes use to move in the vicinity of small features in the wind tunnel and cage assays. To perform the walking optomotor test, we placed a single female mosquito in the center of a rotating drum with alternating black and white vertical stripes. This causes wild-type mosquitoes to walk in the same direction as the moving stripes. 35 We then calculated the optomotor preference index (PI; see Methods). Control mosquitoes exposed to 500 lux exhibited an optomotor PI=0.69 ±0.05 (Figure 4B). We examined the optomotor PI over lower light intensities ranging from 5 to 100 lux (Figures S4A-S4C). The optomotor PI was not significantly reduced at 5 lux versus the higher light intensities (versus: 25 lux, p=0.71; 100 lux, p=0.75; 500 lux, p=0.68; Mann-Whitney U test). This was in contrast to CO2-stimulated guidance to a visual feature using the wind tunnel or cage assays, which showed significant reductions at 5 lux relative to the higher light intensities. Thus, the walking optomotor behavior is still highly effective at lower light levels than needed for detection of stationary visual features.
We then tested the walking optomotor responses of the opsin mutants. The optomotor PIs of the op1 and op2 single mutants were indistinguishable from the controls at all light intensities tested (5 lux to 500 lux; Figures 4B and S4A-S4C). At 500 lux, both op1,op2 double mutants exhibited strong walking optomotor responses, although they were reduced relative to the control (Figure 4B). The optomotor response was reduced further at 100 lux (Figure S4A), although the remaining PI was significantly different from zero (p<0.001. Mann-Whitney U test). At the two lowest light intensities tested (25 and 5 lux), the walking optomotor response was eliminated (Figure S4B and S4C). These findings indicate that the op1,op2 double mutants still exhibited a wide-field motion reflex, even though their capacities to recognize and then orient towards small-field objects in the cage and wind tunnel assays were virtually eliminated. Thus, on the basis of the phototaxis and walking optomotor responses, we conclude that the double mutants are not blind.
To assess the visual response further, we performed electroretinogram (ERG) recordings, which are extracellular recordings that measure the summed light responses of all retinal cells within the conduction field near the recording electrode. Upon initiation of the light, control mosquitoes exhibit a response, which quickly declines to the baseline upon cessation of the stimulus (Figure 4D). The ERG responses of the op1 and op2 single mutants were indistinguishable from the control using white light at all light intensities (5 lux to 1000 lux; Figures 4C-4H and S4D-S4F). Based on ectopic expression in Drosophila eyes, Op2 has a wide spectral sensitivity (350—600 nm). 26 Due to the high homology of Op1 with Op2 (89.8% identical), it is possible that Op1 has a similar spectral sensitivity, although this has not been clarified experimentally. We compared the control and the op1 and op2 mutants using blue (470 nm), green (530 nm) and yellow (590 nm) light and found that there were no discernible differences (Figures S4G-S4I). The double mutant mosquitoes showed ERG responses to white, blue, green and yellow light at 1000 lux and white light at 100 lux; however, their responses were reduced (Figures 4C, 4I, J, S4D and S4G-I). Thus, the double mutants but not the single mutants, exhibit reduced light sensitivity. At the dimmest levels tested (25 and 5 lux), the double mutants did not show ERG responses (Figure S4E and S4F). This indicates at these low light intensities the ERG is insufficiently sensitive to elicit responses with only the remaining three opsins (Op8, Op9 and Op10) in the eye.
An issue concerns an explanation to account for the lack of deficits in the single mutants. In Ae. aegypti, all of the rhabdomeres in a single ommatidium are fused.,32 resulting in electrical coupling between different photoreceptor cells within an ommatidium. 31 Moreover, the fused rhabdom functions as a single light guide. 31 This contrasts with the open rhabdom in Drosophila melanogaster in which each rhabdomere is not in contact and is electrically separated. In Drosophila there are photoreceptor cells from neighboring ommatidia that receive light from the same point in space and extend axons that converge on the same neurons in the optic lobes. 36,37 This neural superimposition increases visual acuity. An advantage of the fused rhabdom in Ae. aegypti is that it increases light sensitivity, but it comes at the expense of high visual acuity. 22,31 Due to the fused rhabdom, activation of one photoreceptor cell influences activities in other photoreceptor cells in a single ommatidium. This electrical coupling may account for the lack of ERG defects resulting from mutation of either op1 or op2.
Similar to Op1, which is the major rhodopsin in Aedes 28, the main rhodopsin in Drosophila is Rh1. 38,39 However, in contrast to mutation of Aedes op1, mutation of Drosophila rh1 impacts on vision. 40 Thus, an additional advantage of a fused rhabdom and the consequent electrical coupling it affords is that it appears to minimize the deleterious effects on vision-dependent behaviors due to a mutation affecting a single visual pigment.
A question raised by our data is why vision-guided host-seeking behavior is eliminated in the double mutant, while walking optomotor behavior remains? We suggest that elimination of both op1 and op2 decreases light sensitivity below a threshold required for vision-guided target recognition. We propose that the walking optomotor impairment in the double mutants is less pronounced since it is effective with lower levels of light required for vision-guided target-seeking. Consistent with this idea, we found that the optomotor PI in controls was not significantly different at the dimmest intensity tested (5 lux) relative to all of the higher intensities examined, including 500 lux. However, at 5 lux, vision-guided target recognition was reduced. In the nocturnal mosquito, Anopheles gambiae, the optomotor response is so light sensitive that levels as low as starlight are sufficient for this behavior. 41 In the cockroach, single photons at a rate of just one per 10 seconds are effective in eliciting optomotor behavior. 42 While the optomotor response may not be as sensitive in Ae. aegypti, which is a diurnal mosquito, a strong response occurs in controls at light level levels (5 lux) that produce very small ERG responses. In conclusion, our data demonstrate that loss of Op1 and Op2 causes a more profound impairment on vision-guided target-seeking behavior than the optomotor response, and supports a model that this difference is due to a greater light requirement for CO2-induced target seeking than for perceiving optic flow.
STAR METHODS
RESOURCE AVAILABILITY
Lead Contact
The lead contact is Craig Montell (cmontell@ucsb.edu).
Materials Availability
All unique/stable reagents generated in this study are available from the Lead Contact without restriction. Further information and requests for resources and reagents should be directed to and will be fulfilled by the Lead Contact.
Data and Code Availability
The wind tunnel behavioral data generated during this study are available at Mendeley Data (DOI: 10.17632/m8zmyndzsb.1; DOI: 10.17632/y2sbpv3zby.1; DOI: 10.17632/djbpsmxcj6.1; DOI: 10.17632/5fdv4bs29r.1; and DOI: 10.17632/yv6xs3h3rn.1). Th code is available upon request.
EXPERIMENTAL MODEL AND SUBJECT DETAILS
Mosquito rearing
The control mosquitoes used were Ae. aegypti (sequenced Liverpool strain, gift from O.S. Akbari), which were reared at 28°C, 80% relative humidity under a 14 hr:10 hr light:dark regime in walk-in chambers, located in an ACL-2 facility. Mosquito eggs were hatched in deionized water and fed fish food (TetraMin tropical granules, Tetra) until the emergence of pupae. Male and female mosquitoes were sorted at the pupal stages based on their sizes and then transferred into an insect collection cage (17.5 x 17.5 x 17.5 cm, BugDorms) for mating and maintaining. Adult mosquitoes were fed 10% sucrose placed on cotton balls. To promote egg production, adult females (5—10 days old) were fed blood using an artificial feeder (Hemotek) heated with fresh defibrinated sheep blood (Hemostat). All mutant mosquitoes were generated using the Liverpool line of Ae. aegypti and outcrossed to this background for eight generations.
METHOD DETAILS
Generation of transgenic strains
To generate the op1 and op2 alleles, we selected short-guide RNAs (sgRNAs) that targeted the GPROp1 (LOC5568060) and GPROp2 (LOC5567680) loci using the CRISPR Optimal Target Finder (https://flycrispr.org/target-finder/). The target sequences of the sgRNAs used for generating the op1 and op2 alleles are presented in Table S1.
To generate the op1R, op1G and op2G alleles, we created the op1R-3xP3-DsRed-HDR, op1G-3xP3-GFP-HDR and op2G-3xP3-GFP-HDR DNA constructs for microinjections. To do so, we used the In-Fusion cloning kit (Clontech) to introduce the sgRNAs, and the upstream and downstream homology arms (~1 kb each) into the pAeU6-LgRNA-3xP3-DsRed vector (J. Chen, J. Luo, and C.M., unpublished) or the pAeU6-LgRNA-3xP3-GFP vector 43, which includes the sequences encoding the 3xP3-driven fluorescent marker, SV40 transcription terminator, the U6 promoter for directing expression of the sgRNA, and the gRNA scaffold. In addition to the insertion of the genes encoding either DsRed or GFP, op1R has a 10 base pair deletion, which begins after the sequence encoding residue 72, op1G has an 8 base pair deletion, which begins after the sequence encoding residue 83, and op2G has an 11 base pair deletion, which begins after the sequence encoding residue 75.
The op2R allele includes a 14 base pair deletion, which removes the ATG and the following 11 base pairs. To create this allele, we first generated the pU6-gRNA1 plasmid (Figure S4J), which includes the sequences encoding QF2, the 3xP3-driven fluorescent marker, SV40 transcription terminator, the U6 promoter for directing expression of the sgRNA, and a gRNA scaffold. QF2 was cloned from pBAC-DsRed-QF2-hsp70 (Addgene #104876). We then used pU6-gRNA1 to introduce the sgRNAs, and the upstream, and downstream homology arms (~1 kb each). The primers used for cloning the homology arms are presented in Table S2.
All transgenic strains were generated by microinjecting the plasmids into embryos of the transgenic Ae. aegypti line that expresses Cas9 under control of the ubiquitin L40 promotor (gift from O.S. Akbari). 44 Briefly, we collected freshly laid embryos, and microinjected the plasmid DNA (~500 ng/μL) into the posterior ends of ~2000 embryos using a micro-injector (Eppendorf) and a Zeiss Axioplan 2 microscope. G0 embryos hatched four days post-injection, and the adult G0 animals (~100 per injection) were crossed to the opposite sex. The females were blood-fed to generate G1 progeny. The eyes of the G1 larvae were screened for expression of the DsRed or GPF fluorescent markers under a Zeiss SteREO Discovery.V8 stereomicroscope. Positive G1 animals were genotyped by PCR and out-crossed to the wild-type control strain for eight generations. We genotyped the homozygous lines before performing experiments, using the primers listed in Table S3.
Generation of Op1 antibodies and Western Blots
Rat anti-Op1 was generated (Pocono Rabbit Farm & Laboratory, Inc.) to a peptide that spanned amino acid residues 338 to 356 (CTQKFPALSSTDAPAASNSD). To perform the protein blots, 20 heads from 5—7 day-old female mosquitoes were homogenized, fractioned by SDS-PAGE (Bio-Rad Mini-Protean TGX Gels, 4-15%, cat. # 456-1086), transferred to nitrocellulose membranes (Bio-Rad, cat. # 162-0112), probed with anti-Op1 (1:20 dilution) and rabbit anti-actin (Abcam, cat. # ab1801) as the loading control. The blots were then incubated with IRDye-conjugated goat anti-rat secondary antibodies (1:5000 dilution; LI-COR Biosciences, cat. #926-32219), and goat anti-rabbit secondary antibodies (1:5000 dilution; LI-COR Biosciences, cat. # 926-68071), and visualized using a LI-COR imager system (Odyssey® CLx).
Quantitative PCR (RT-qPCR)
To detect the expression of op1 and op2 RNAs in the control and mutant mosquitoes, we extracted total RNA from 10 heads with Trizol reagent (Thermo Fisher Scientific). 1 μg RNA was reverse transcribed using Reverse Transcription Kit (Promega) with oligo(dT) primers. RT-qPCR was carried out using a LightCycler 480 SYBR Green I Master Mix (Roche). Rpl32 (LOC5577996) was used as the normalization reference. The qPCR primers are listed in Table S4.
Vision-guided target-attraction using a cage assay
The cages used in this assay were modified by N. DeBeaubien from a standard 30 x 30 x 30 cm cage (BugDorms). The mesh material on one vertical side of the cage was replaced with a 12” x 12” x 1/16” clear cast acrylic sheet (McMaster-Carr; cat. # 8560K171) to allow for clear video recording and tracking. To conduct the vision-guided target-attraction assays, we glued a 3 cm black circle (generated by an HP, LaserJet Pro MFP M426fdn), and a 3 cm white circle to the interior wall of the cage so that they were separated by 18 cm. We moved the cage into a walk-in chamber held at 28°C and 80% humidity. A CO2 Flypad (Genesee Scientific; cat. # 59-119) was placed below the cage near the front of the wall that had the visual cues. Before initiation of the test, the CO2 was kept in the off position.
To perform the assays, we used 4—10 day-old, non-blood-fed, mated females that were sucrose deprived for 48 hr but had access to water. This length of starvation increased foraging behavior, and resulted in sufficient trajectories to generate optimal preference indexes. The animals were maintained under 14-hr light:12-hr dark cycles. We inserted 50 females into the cage and the assays were initiated 2 hr before lights off (ZT12). We then recorded their trajectories on the wall that had the visual cues for 30 min (standard air condition) with a webcam (Logitech C922) at 30 frames/sec. We then introduced 5% CO2 through the Flypad and recorded the mosquitoes’ trajectories on the wall with the visual cues for 3 min (CO2 condition). The preference index (PI) was calculated as follows: PI = (NB − NW)/(NB + NW). NB = total number of times that the mosquitoes explored the black spot within the fictive area (6 x 6 cm). NW = total number of times that mosquitoes explored the white spot within the fictive area (6 x 6 cm), or a random area with the same size as the white area (Figure S1C). A PI = 0 indicates no preference between the two spots. A positive PI (>0—1) indicates that the mosquitoes prefer the black spot, and a negative PI (−1—<0) indicates that the mosquitoes prefer the white spot or the random area.
Assaying CO2-induced attraction to human skin odors
CO2-induced attraction to human skin odors was assayed in the same type of cages used to monitor CO2-induced vision-guided target-attraction behavior (30 x 30 x 30 cm cage BugDorms). A glove (Genesee Scientific, cat. # 43-101S) worn for 3 hr was used to collect human skin odors, and a fresh glove was used as a control. We cut 3 cm circles from the glove with human odors and from the control glove and glued them 18 cm apart to the interior wall of the cage. The behavioral test was conducted in a walk-in chamber held at 28°C and 80% humidity. A CO2 Flypad (Genesee Scientific) was placed below the cage near the front of the wall that with the circles cut from the gloves.
To perform the behavioral assay, we used 4—10 day-old, non-blood-fed, mated females that were sucrose-deprived for 48 hr, but have the access to water. We inserted 50 females into the cage 2 hr before lights off and allowed the mosquitoes to adapt to the environment for 30 min. We then introduced 5% CO2 through the Flypad and recorded the mosquitoes’ trajectories on the wall with the two circles for 3 min with a webcam (Logitech C922) at 30 frames/sec. The preference index (PI) was calculated as follows: PI = (NH − NC)/(NH + NC). NH=total number of times that the mosquitoes explored the area (6 x 6 cm) around the circle with the human skin odors. NC=total number of times that the mosquitoes explored the area (6 x 6 cm) around the control circle without human skin odors. A PI=0 indicates no preference between the two circles. A positive PI (>0—1) indicates that the mosquitoes prefer the circle with the human skin odors, and a negative PI (−1—<0) indicates that the mosquitoes prefer the control circle.
Vision-guided target-seeking using a wind tunnel assay
All experiments were performed in a low-speed wind tunnel (ELD Inc., Lake City, MN), with a working section of 210 x 61 x 61 cm and a constant laminar airflow of 0.4 m/sec. A low contrast checkerboard was projected on the arena floor, and a low contrast grey horizon was projected on each side of the arena. 45 We used three rear projection screens (SpyeDark, Spye, LLC, Minneapolis, MN) and three short-throw projectors (LG PH450U, Englewood Cliffs, NJ) to project background images. A 3D real-time tracking system was used to track the mosquitoes’ trajectories. 45 16 cameras (Basler AC640gm, Exton, PA) were mounted on top of the wind tunnel and recorded mosquito trajectories at 60 fps, and calibrated using a small LED light source through the working section of the tunnel and using the software’s calibration toolbox that generates hundreds of two- and three-dimensional points that provide a solution for the best scaling. 45 Projection of the trajectories recorded by the camera into x, y and z values presented a sampling error due to the camera calibration that resulted in the displacement of x and y values for some of the trajectories. Over the course of the experiments, this bias corresponded to less than a third of the distance between the cues and the odor source in the x dimension (error: 0.39 to 9.97 cm ±0.55, distance cue-odor source: 33 cm) and less than 1/25th of the distance between cues in the y dimension (error: 0.16 to 0.67 ±0.08, distance between cues: 18 cm), and thus did not interfere with the resolution of animal transit between the two objects. The dimensions of the fictive volumes that were used to quantify mosquito attraction to the visual objects (detailed below) encompassed any displacement due to the calibration error. All cameras had an opaque Infrared (IR) Optical Wratten Filter (Kodak 89B, Kodak, Rochester, NY) to mitigate the effect of light in the tracking. IR backlights (HK-F3528IR30-X, LedLightsWorld, Bellevue, WA) were installed below and to the sides of the wind tunnel to provide constant lighting. The temperature within the wind tunnel, as measured using ibuttons (DS1921G, iButtonLink, LLC, Whitewater, WI) and a FLIR camera (FLIR One Pro, FLIR Systems Inc., Goleta, CA USA), was at a constant 22.5°C and did not show any variability including the region that contained the black spot (Figures S2E and S2F). Ambient CO2 was constantly measured outside of the tunnel and was approximately 410 ppm. We used two 4-cm diameter circles (one black and one white; Color-Aid, Hudson Falls, NY) as visual cues for the vast majority of experiments. These visual cues were placed perpendicular to the airflow and 15 cm downwind from the odor source and were separated by 25 cm. To control for position bias, we performed experiments using two white circles. The mosquitoes in these trials showed no behavioral preference (Figures S2C and S2D).
The CO2 and purified air were automatically delivered using two mass flow controllers MC-200SCCM-D (Alicat Scientific, Tucson, AZ) that were controlled by a python script that allowed synchronizing odor and air delivery. In the acclimation and post-CO2 periods of the experiment, only purified air was released from the odor nozzle, whereas during CO2 delivery we injected 90% air and 10% CO2 into the airstream before the air was released from the nozzle, thereby reducing the CO2 further by 50% (5% final CO2). The CO2 plume was calibrated using a CO2 analyzer (LI-COR Biosciences). The data matched an analytical model for particle diffusion in turbulent flow 3 with levels of 1400 ppm, 30 cm downwind from the source.
50 non-blood-fed, mated female mosquitoes, starved for at least 12 hr, were released inside the wind tunnel. Across all experiments and mosquito lines, more than 135,000 trajectories were analyzed. The circadian rhythm of all mosquitoes was calibrated so that the experiment started 3 hr before sunset. For a single trial, mosquito flight behaviors were recorded for a total duration of 5 hr. This included 1 hr of clean air (an acclimation phase), 2 hr of a CO2 plume (5%), followed by 2 hr of clean air. 99.6% of the mosquitoes flew within the working section where the real-time tracking system captured their flight paths. In later trials, experiments were performed for a total duration of 3 hr, with 1 hr clean air, 1 hr CO2 (5%), and 1 hr clean air. The 3 hr experimental duration allowed multiple experiments to be performed daily. There were no significant differences between 3 hr and 5 hr experiments in behaviors to the exposure of CO2 and filtered air (ambient CO2) (Student’s unpaired t-test: P>0.05). The tracking system is unable to maintain the identities of individual mosquitoes for extended periods. We considered individual trajectories as independent for the statistical analysis. Analyses were restricted to trajectories that were at least 90 frames (1.5 sec) long. The average length of trajectories was approximately 3 sec, although some trajectories reached 60 sec.
To examine the mosquito behaviors and preferences to the two visual stimuli in the tunnel, a fictive volume was created around the visual cues (area: 14 x 14 cm, height: 4 cm) similar to previous work. 3 The volume was centered over the object in the crosswind direction, and shifted slightly downwind in the wind direction since there is a propensity for the animals to prefer trajectories slightly downwind from the visual feature. 3 This is because when a mosquito investigates an attractive, high contrast attractive object, it hovers downwind of the visual object at a distance of ~3—5 cm and exhibits brief excursions before returning to the visual object. The 14 x 14 x 4 cm volume best captures the mosquitoes navigating to the plume. When we did a sensitivity analysis, the approximate preference index of this volume (784 cm3) is 0.41 [(#mosquitoes to black - #white)/total]. Increasing the volume to 1578 cm3 (14 x 14 x 8 cm) or 3136 cm3 (14 x 14 x 16 cm) decreased the preference indices to 0.24 and 0.14, respectively. Examining their trajectories also verified this analysis. Mosquitoes in these larger volumes often did not investigate the visual objects. When we decreased the volume (14 x 14 x 2 cm; 392 cm3), the preference index went down to 0.18 since this smaller volume failed to capture the mosquitoes that investigated the object.
~25% of the mosquitoes approached either object. The percent residencies were calculated by dividing the wind tunnel into 1-cm2 squares. For each replicate experiment, the number of mosquito occurrences within each square was summed and divided by the total number of occurrences in all squares to yield a percentage of residency. We did not quantify landings on the spots due to limitations of the camera angles needed to identify landings. During the filtered “air” treatment, mosquitoes often investigated certain areas of the working section, causing hot spots in the residency maps. 3 This is typical for mosquito activity without a stimulus. 3 By contrast, when CO2 is released, these hot spots are no longer apparent, and instead, the mosquitoes investigate the visual objects. For each mosquito line, the replicate trials were pooled to create a residency map for each line.
We tested each mosquito line (control, op1R, op1G, op2R, op2G, op1R,op2G, and op1G,op2R lines) and once the lines were demonstrated to exhibit the identical phenotypes (e.g., op1R versus op1G), we focused on using one line per gene target for additional experiments, such as for testing responses at different light intensities. One data trial was excluded from the generation of residency heat map due to contamination in the wind tunnel working section (for the op2R allele, Figure 2H, J, S2K and S2M). To examine the odor-conditioned anemotactic responses of the different mosquito lines, the trajectories were analyzed for their flight velocities and orientations (track angle) to the odor source (defined as the 0° origin) during exposure to filtered air (ambient CO2 = 410 ppm) and added CO2 (5%). Mean flight velocities were calculated from the 3D tracks of each mosquito. To further examine whether mosquito responses to the visual objects changed throughout the experiment, the percent of time (per each minute interval) the mosquitoes investigated the visual objects was calculated for the wild-type control, op1R, op2G, and op1G,op2R lines.
Walking optomotor response
Mosquito walking optomotor responses were conducted as previously described with modifications using 4—6 day-old, non-blood-fed, mated female mosquitoes. 35 The mosquitoes were anesthetized on ice, the wings were removed, and the animals were allowed to recover for 3 hr before performing the behavioral experiments at Zeitgeber time 12—14, which is the last two hr of the light cycle since the animals were maintained under a 14 hr light:10 hr dark regime. Individual, wingless mosquitoes were placed in a 30 mm diameter 28°C chamber in the middle of a rotating drum (diameter, 10 cm; height, 22.5 cm), which had alternating black and white vertical stripes. The angular width of each stripe was 18°, so that the full spatial wavelength was 36°, and the drum was rotated at 30 RPM (temporal frequency of 5 Hz). White LED lights (~500 lux) were illuminated surrounding the drum during the experiment. To conduct each trial, the mosquito was tested for the optomotor response with the drum rotating in the clockwise direction for 120 sec. The drum then stopped rotating for 30 sec, after which time it started rotating in the counterclockwise direction for another 120 sec. We documented the turning and walking response to the rotating visual field by videotaping with a webcam (Logitech C922) at 30 frames/sec.
To calculate the overall optomotor performance index (PI), we first calculated the individual PIs when the drum rotated either in the clockwise direction (PIclockwise) and counterclockwise direction (PIcounterclockwise). The performance index (PI) was calculated according to the following equation: PI=(Nsame − Ndifferent)/(Nsame + Ndifferent). Nsame = number of times the mosquito walked across a quadrant line in the same direction as the rotating stripe, and Ndifferent = number of times the mosquito walked against the direction as the rotating stripe. PI=0 means that the mosquito does not track the stimulus. A positive PI (>0—1) indicates that the mosquito exhibits a positive response, which is turning and walking in the same direction as the visual stimulus. A negative PI (−1—<0) indicates that the mosquito turns against the visual stimulus. The overall optomotor PI of each trial is defined as PIoverall=(PIclockwise + PIcounterclockwise)/2.
Phototaxis assay
To measure phototaxis, we performed the assays at Zeitgeber time 12—14, using 4—6 day-old, non-blood-fed, mated females. We anesthetized 30 females on ice, introduced them into a transparent plastic tube (length, 15.2 cm; diameter, 3.8 cm; Uline, cat. # S-12642), plugged the open end with a cotton ball, and kept the animals in the dark for 30 min so that they become dark-adapted and their locomotor activity recovered. We then used transparent tape to connect the tube with the mosquitoes and the cotton plug to another tube covered with black paper. We then gently removed the cotton ball between the two test tubes, exposing a 1 cm hole between the two tubes. To stimulate the animals with CO2, we quickly placed the tubes containing the mosquitoes on a CO2 Flypad (Genesee Scientific; cat. # 59-119), so that the hole was directly pressed up against the pad.
To initiate the assay, we gently shook the tube for 3 sec to distribute the mosquitoes on both sides, then simultaneously turned on a ~500 lux LED light (exposing the side of the set up that was not covered with black paper). After 1 min, the apparatus was photographed, and the number of mosquitoes on the light side were counted. The light preference index (PI) was calculated as follows: PI = (NL − ND)/(NL + ND). NL=number of mosquitoes located on the side with the light. ND=number of mosquitoes situated on the dark side. A PI=0 indicates no preference between the two sides. A PI (>0—1) and (−1—<0) indicates preference for the light and dark sides, respectively.
ERG recordings
ERG recordings were performed by fixing 4—6 day-old, non-blood-fed, mated female mosquitoes to a coverslip with beeswax. The reference and recording glass electrodes (thin-wall glass capillaries; OD, 1.0 mm; length, 76 mm; World Precision Instruments, cat. # TW100F-3) were pulled using a micropipette puller (Sutter Instrument, p-97), and filled with Ringer’s solution (3 mM CaCl2, 182 mM KCl, 46 mM NaCl, 10 mM Tris pH 7.2). The reference electrode was placed on the thorax in a small drop of electrode cream (Parker, cat. # 17-05), and the recording electrode was placed in electrode cream on the surface of the compound eye. Mosquitoes were exposed to a 10-sec pulse of white light from a light source (Apex illuminator, Newport), through a light guide. Three narrow band filters were used to test ERG responses at 1000 lux at 470 nm, 530 nm, and 590 nm (Newport, cat. # 20BPF10-470, cat. # 20BPF10-530, and cat. # 20BPF10-590). The light-induced responses were amplified using an IE-210 amplifier (Warner Instruments) and digitalized using a Powerlab 4/30 device (AD Instruments). Data were visualized and analyzed with LabChart 6 software (AD Instruments).
Transmission electron microscopy
To perform the transmission EM, the mosquitoes were reared at 28°C, 80% relative humidity under a 14 hr:10 hr light:dark regime. We fixed hemisected heads from 4 day-old non-blood-fed, mated female mosquitoes at ZT2 using 2% glutaraldehyde (Sigma, cat. # G5882, Grade I, specially used as a fixative for EM) and 2% paraformaldehyde (Avantor, cat. # 15710, EM Grade). After post-fixation with 1% osmium tetroxide (Electron Microscopy Sciences, cat. # 19150) and dehydration through a graded series of ethanol (25%, 50%, 75%, 100%) (Thermo Fisher Scientific, cat. # BP28184), the samples were embedded using LR White resin (Avantor, cat. # 14381). The ultra-thin sections (90 nm) were prepared at a depth of ~20 μm for the surface distal layer and ~30 μm for the distal layer. We examined the sections by transmission EM (JEOL JEM-1230, NRI-MCDB Microscopy Facility, UC Santa Barbara), and the images were acquired using a Hamamatsu ORCA digital camera (Model C4742-95, Advanced Microscopy Techniques).
Locomotor activity
Measurements of total locomotor activity over a 24-hr period were conducted at 28°C using the Locomotor Activity Monitoring (LAM) System (TriKinetics, LAM25). Individual 3—5 day-old, non-blood-fed, mated female mosquitoes were inserted into monitoring tubes (TriKinetics, PGT 25 x 125 mm Pyrex Glass), which contained 10% sucrose as a food source. Locomotor activity was determined automatically over the course of 14 hr (ZT0—ZT14; 14 hr:10 hr light:dark regime) by automatic tabulation of the number of times the animals broke the infrared beam. Data acquisition and analyses were performed using the LAMSystem (TriKinetics) and MATLAB.
Measurement of body size
50 mosquito larvae of each genotype were reared in a 12 x 11 x 4 cm plastic box. 5 day-old, non-blood-fed, mated adult female mosquitoes were photographed using a Zeiss Axio Zoom.V16 stereomicroscope with a Zeiss Axiocam 506 color digital camera, and the body lengths of the mosquitoes were measured as the distance between the top of thorax to the tip of abdomen using Photoshop (Adobe).
QUANTIFICATION AND STATISTICAL ANALYSIS
Statistical analyses were performed using Prism 8 (GraphPad Software), MATLAB and SPSS Statistics 26 (IBM). For wind tunnel experiments, we calculated the mean and performed bootstrapping of the 95% confidence interval of the mean by re-sampling random trajectories 1000 times. We performed a non-parametric Mann-Whitney U test with Bonferroni correction to determine the statistically significant of two groups. We conducted Fisher’s exact test or Chi-square test for determining statistical significance of the contingency tables. We performed Watson's two-sample test of homogeneity for comparing circular statistics. To determine statistical significance with multiple comparisons, we either conducted parametric tests using one-way ANOVA with Tukey’s multiple comparisons test, or non-parametric tests using the Kruskal-Wallis test with Dunn’s multiple comparison test. The data are displayed as means with 95% CI or SEMs as indicated in each legend.
Supplementary Material
KEY RESOURCES TABLE
| REAGENT or RESOURCE | SOURCE | IDENTIFIER |
|---|---|---|
| Antibodies | ||
| anti-Op1 antibody (Rat) | This paper | N/A |
| anti-actin antibody (Rabbit) | Abcam | Cat#ab1801 |
| Goat anti-rat secondary antibody | LI-COR Biosciences | Cat#926-32219 |
| Goat anti-rabbit secondary antibody | LI-COR Biosciences | Cat#926-68071 |
| Chemicals, Peptides, and Recombinant Proteins | ||
| Trizol | Thermo Fisher Scientific | Cat#15596-018 |
| Sucrose | Sigma-Aldrich | Cat#S0389 |
| Glutaraldehyde | Sigma-Aldrich | Cat#G5882 |
| Paraformaldehyde | Avantor | Cat#15710 |
| LR white Resin | Avantor | Cat#14381 |
| Ethanol | Thermo Fisher Scientific | Cat#BP28184 |
| Osmium tetroxide | Electron Microscopy Sciences | Cat#19150 |
| Critical Commercial Assays | ||
| Reverse Transcription System | Promega | Cat#A3500 |
| Infusion HD cloning kit | Clontech | Cat#638909 |
| Plasmid DNA Mini-Prep Kit | Epoch Life Science | Cat#2160250 |
| ZymoPURE II Plasmid Midiprep | Zymo | Cat#D4200 |
| Deposited Data | ||
| Experimental Models: Organisms/Strains | ||
| Ae. aegypti: wild type (Liverpool strain) | [44] | N/A |
| Ae. aegypti: ubiquitin L40 promotor Cas9 | [44] | N/A |
| Ae. aegypti: op1R | This paper | N/A |
| Ae. aegypti: op1G | This paper | N/A |
| Ae. aegypti: op2R | This paper | N/A |
| Ae. aegypti: op2G | This paper | N/A |
| Oligonucleotides | ||
| PCR primers used for cloning homology arms (See Table S2) | This paper | N/A |
| PCR primers used for genotyping (See Table S3) | This paper | N/A |
| PCR primers used for RT-qPCR (See Table S4) | This paper | N/A |
| Recombinant DNA | ||
| Op1R-3xP3-DsRed-HDR | This paper | N/A |
| op1G-3xP3-GFP-HDR | This paper | N/A |
| op2R-3xP3-DsRed-QF2-HDR | This paper | N/A |
| op2G-3xP3-GFP-HDR | This paper | N/A |
| Software and Algorithms | ||
| SnapGene | SnapGene | V5.2 |
| GraphPad Prism | GraphPad Software | Prism 8 |
| SPSS Statistics | IBM | SPSS Statistics 26 |
| LabChart | AD Instruments | V6 |
| MATLAB | MathWorks | 2019b |
| Python | Python Software Foundation | https://www.python.org/ |
| Other | ||
| TetraMin tropical granules | Tetra | Cat#16121 |
| Insect collection cage | BugDorms | |
| Membrane blood feeder system | Hemotek | Cat#SP6W1-3 |
| Defibrinated sheep blood | Hemostat | Cat#DSB1 |
| SDS-PAGE gel | Bio-Rad | Cat#456-1086 |
| Nitrocellulose membranes | Bio-Rad | Cat#162-0112 |
| LI-COR imager system | LI-COR | Odyssey® CLx |
| Micro-injector | Eppendorf | |
| CO2 Flypad | Genesee Scientific | Cat#59-119 |
| Webcam | Logitech | Cat#C922 |
| Clear cast acrylic sheet | McMaster-Carr | Cat#8560K171 |
| Locomotor activity monitor system (DAMSystem) | Trikinetics Inc. | Cat#LAM 25 |
| Wind tunnel | ELD Inc. | |
| Rear projection screens | Spye | SpyeDark |
| Short-throw projectors | LG | PH450U |
| Wind tunnel cameras | Basler | AC640gm |
| IR backlights | LedLightsWorld | HK-F3528IR30-X |
| ibuttons | iButtonLink | DS1921G |
| FLIR cameras | FLIR Systems Inc. | FLIR OnePro |
| Transparent plastic tube | Uline | Cat#S-12642 |
| Thin-wall glass capillaries | World Precision Instruments | Cat#TW100F-3 |
| Electrode cream | Parker | Cat#17-05 |
| Real time PCR system | ||
Highlights.
Genetic disruption of CO2-induced vision-guided target attraction in Aedes aegypti
Vision-guided target attraction eliminated by mutation of Op1 and Op2 opsins
Distinct requirements for Op1 and Op2 for different light-dependent behaviors
Development of simplified test for assaying vision-guided target attraction
Acknowledgments
This work was supported by a grant (EY008117) from the NEI to C.M., a Director’s Pioneer Award supported by the NIAID (DP1AI124453) to C.M., support from the U.S. Army Research Office and accomplished under cooperative agreement W911NF-19-2-0026 for the Institute for Collaborative Biotechnologies to C.M. and by a grant (R21AI137947) to J.A.R from the NIAID. We thank D. Thakur for comments on this manuscript and help with the figures, and technical advice from all members in the C.M. lab who work on mosquitoes. We thank N. DeBeaubien for preparation of the cage for performing the target attraction assay and for help with figures. We thank B. Lopez (UCSB NRI-MCDB Microscopy Facility) for preparing the ultra-thin sections of mosquito eyes and G. Lewis (UCSB NRI-MCDB Microscopy Facility) for help with the transmission electron microscopy. We thank O.S. Akbari for the Ae. aegypti (Liverpool strain) and for the AAEL006511-Cas9 transgenic Ae. aegypti line.
Footnotes
Declaration of Interests
The authors declare no competing interests.
Publisher's Disclaimer: This is a PDF file of an unedited manuscript that has been accepted for publication. As a service to our customers we are providing this early version of the manuscript. The manuscript will undergo copyediting, typesetting, and review of the resulting proof before it is published in its final form. Please note that during the production process errors may be discovered which could affect the content, and all legal disclaimers that apply to the journal pertain.
References
- 1.McMeniman CJ, Corfas RA, Matthews BJ, Ritchie SA, and Vosshall LB (2014). Multimodal integration of carbon dioxide and other sensory cues drives mosquito attraction to humans. Cell 156, 1060–1071. [DOI] [PMC free article] [PubMed] [Google Scholar]
- 2.Montell C, and Zwiebel LJ (2016). Mosquito Sensory Systems. In Advances in Insect Physiology, Volume 51, Raikhel AS, ed. (Oxford: Academic Press; ), pp. 294–328. [Google Scholar]
- 3.van Breugel F, Riffell J, Fairhall A, and Dickinson MH (2015). Mosquitoes use vision to associate odor plumes with thermal targets. Curr. Biol 25, 2123–2129. [DOI] [PMC free article] [PubMed] [Google Scholar]
- 4.Day JF (2005). Host-seeking strategies of mosquito disease vectors. J. Am. Mosq. Control Assoc 21, 17–22. [DOI] [PubMed] [Google Scholar]
- 5.Kawada H, Takemura SY, Arikawa K, and Takagi M (2005). Comparative study on nocturnal behavior of Aedes aegypti and Aedes albopictus. J. Med. Entomol 42, 312–318. [DOI] [PubMed] [Google Scholar]
- 6.Dekker T, and Cardé RT (2011). Moment-to-moment flight manoeuvres of the female yellow fever mosquito (Aedes aegypti L.) in response to plumes of carbon dioxide and human skin odour. J. Exp. Biol 214, 3480–3494. [DOI] [PubMed] [Google Scholar]
- 7.Vinauger C, Van Breugel F, Locke LT, Tobin KKS, Dickinson MH, Fairhall AL, Akbari OS, and Riffell JA (2019). Visual-olfactory integration in the human disease vector mosquito Aedes aegypti. Curr. Biol 29, 2509–2516 e2505. [DOI] [PMC free article] [PubMed] [Google Scholar]
- 8.Liu MZ, and Vosshall LB (2019). General visual and contingent thermal cues interact to elicit attraction in female Aedes aegypti mosquitoes. Curr. Biol 29, 2250–2257 e2254. [DOI] [PubMed] [Google Scholar]
- 9.Bidlingmayer WL, and Hem DG (1980). The range of visual attraction and the effect of competitive visual attractants upon mosquito (Diptera: Culicidae) flight. Bull. Entomol. Res 70, 321–342. [Google Scholar]
- 10.Khan AA, and Maibach HI (1971). A study of the probing response of Aedes aegypti. 4. Effect of dry and moist heat on probing. J. Econ. Entomol 64, 442–443. [DOI] [PubMed] [Google Scholar]
- 11.Acree F Jr., Turner RB, Gouck HK, Beroza M, and Smith N (1968). L-Lactic acid: a mosquito attractant isolated from humans. Science 161, 1346–1347. [DOI] [PubMed] [Google Scholar]
- 12.Shaw WR, and Catteruccia F (2019). Vector biology meets disease control: using basic research to fight vector-borne diseases. Nature microbiology 4, 20–34. [DOI] [PMC free article] [PubMed] [Google Scholar]
- 13.Briegel H (2003). Physiological bases of mosquito ecology. J. Vector Ecol 28, 1–11. [PubMed] [Google Scholar]
- 14.Githeko AK, Adungo NI, Karanja DM, Hawley WA, Vulule JM, Seroney IK, Ofulla AV, Atieli FK, Ondijo SO, Genga IO, et al. (1996). Some observations on the biting behavior of Anopheles gambiae s.s., Anopheles arabiensis, and Anopheles funestus and their implications for malaria control. Exp. Parasitol 82, 306–315. [DOI] [PubMed] [Google Scholar]
- 15.Trpis M, McClelland GA, Gillett JD, Teesdale C, and Rao TR (1973). Diel periodicity in the landing of Aedes aegypti on man. Bull. World Health Organ 48, 623–629. [PMC free article] [PubMed] [Google Scholar]
- 16.Zöllner GE, Torr SJ, Ammann C, and Meixner FX (2004). Dispersion of carbon dioxide plumes in African woodland: implications for host-finding by tsetse flies. Physiol. Entomol 29, 381–394. [Google Scholar]
- 17.Headlee TJ (1937). Some facts underlying the attraction of mosquitoes to sources of radiant energy. J. Econ. Ent 30, 309–312. [Google Scholar]
- 18.Brett GA (1938). On the relative attractiveness to Aedes aegypti of certain coloured cloths. Trans. R. Soc. Trop Med Hyg 32, 113–124. [Google Scholar]
- 19.Gjullin CM (1947). Effect of clothing color on the rate of attack on Aedes mosquitoes. J. Econ. Entomol 40, 326. [DOI] [PubMed] [Google Scholar]
- 20.Land MF, Gibson G, Horwood J, and Zeil J (1999). Fundamental differences in the optical structure of the eyes of nocturnal and diurnal mosquitoes. J. Comp. Physiol. A 185, 91–103. [Google Scholar]
- 21.Wolken JJ (1975). Photoprocesses, photoreceptors, and evolution, (New York: Academic Press; ). [Google Scholar]
- 22.Muir LE, Thorne MJ, and Kay BH (1992). Aedes aegypti (Diptera: Culicidae) vision: spectral sensitivity and other perceptual parameters of the female eye. J. Med. Entomol 29, 278–281. [DOI] [PubMed] [Google Scholar]
- 23.Lacey ES, Ray A, and Carde RT (2014). Close encounters: contributions of carbon dioxide and human skin odour to finding and landing on a host in Aedes aegypti. Physiol. Entomol 39, 60–68. [DOI] [PMC free article] [PubMed] [Google Scholar]
- 24.Dekker T, Geier M, and Cardé RT (2005). Carbon dioxide instantly sensitizes female yellow fever mosquitoes to human skin odours. J. Exp. Biol 208, 2963–2972. [DOI] [PubMed] [Google Scholar]
- 25.Giraldo-Calderon GI, Zanis MJ, and Hill CA (2017). Retention of duplicated long-wavelength opsins in mosquito lineages by positive selection and differential expression. BMC Evol. Biol 17, 84. [DOI] [PMC free article] [PubMed] [Google Scholar]
- 26.Hu X, Whaley MA, Stein MM, Mitchell BE, and O'Tousa JE (2011). Coexpression of spectrally distinct rhodopsins in Aedes aegypti R7 photoreceptors. PLoS One 6, e23121. [DOI] [PMC free article] [PubMed] [Google Scholar]
- 27.Nene V, Wortman JR, Lawson D, Haas B, Kodira C, Tu ZJ, Loftus B, Xi Z, Megy K, Grabherr M, et al. (2007). Genome sequence of Aedes aegypti, a major arbovirus vector. Science 316, 1718–1723. [DOI] [PMC free article] [PubMed] [Google Scholar]
- 28.Hu X, Leming MT, Metoxen AJ, Whaley MA, and O'Tousa JE (2012). Light-mediated control of rhodopsin movement in mosquito photoreceptors. J. Neurosci 32, 13661–13667. [DOI] [PMC free article] [PubMed] [Google Scholar]
- 29.Hu X, Leming MT, Whaley MA, and O'Tousa JE (2014). Rhodopsin coexpression in UV photoreceptors of Aedes aegypti and Anopheles gambiae mosquitoes. J. Exp. Biol 217, 1003–1008. [DOI] [PMC free article] [PubMed] [Google Scholar]
- 30.Hu X, England JH, Lani AC, Tung JJ, Ward NJ, Adams SM, Barber KA, Whaley MA, and O'Tousa JE (2009). Patterned rhodopsin expression in R7 photoreceptors of mosquito retina: Implications for species-specific behavior. J. Comp. Neurol 516, 334–342. [DOI] [PMC free article] [PubMed] [Google Scholar]
- 31.Snyder AW, Menzel R, and Laughlin SB (1973). Structure and Function of Fused Rhabdom. J Comp Physiol 87, 99–135. [Google Scholar]
- 32.Brammer JD (1970). The ultrastructure of the compound eye of a mosquito Aedes aegypti L. J. Exp. Zool 175, 181–196. [Google Scholar]
- 33.Kennedy JS (1940). The visual responses of flying mosquitoes. Proc. Zool. Soc A109, 221–242. [Google Scholar]
- 34.Borst A, Haag J, and Reiff DF (2010). Fly motion vision. Annu. Rev. Neurosci 33, 49–70. [DOI] [PubMed] [Google Scholar]
- 35.Bernath B, and Meyer-Rochow VB (2016). Optomotor reactions reveal polarization sensitvity in the zika virus transmitting yellow fever mosquito Aedes (Stegomyia) aegypti (Diptera; Nematocera). Zoolog. Sci 33, 643–649. [DOI] [PubMed] [Google Scholar]
- 36.Clandinin TR, and Zipursky SL (2002). Making connections in the fly visual system. Neuron 35, 827–841. [DOI] [PubMed] [Google Scholar]
- 37.Kirschfeld K (1967). The projection of the optical environment on the screen of the rhabdomere in the compound eye of the Musca. Exp.Brain Res 3, 248–270. [DOI] [PubMed] [Google Scholar]
- 38.Zuker CS, Cowman AF, and Rubin GM (1985). Isolation and structure of a rhodopsin gene from D. melanogaster. Cell 40, 851–858. [DOI] [PubMed] [Google Scholar]
- 39.O'Tousa JE, Baehr W, Martin RL, Hirsh J, Pak WL, and Applebury ML (1985). The Drosophila ninaE gene encodes an opsin. Cell 40, 839–850. [DOI] [PubMed] [Google Scholar]
- 40.Pak WL, Shino S, and Leung HT (2012). PDA (Prolonged Depolarizing Afterpotential)-defective mutants: the story of nina's and ina's-pinta and santa maria, too. J. Neurogenet 26, 216–237. [DOI] [PMC free article] [PubMed] [Google Scholar]
- 41.Gibson G (1995). A behavioural test of the sensitivity of a nocturnal mosquito, Anopheles gambiae, to dim white, red and infra-red light. Physiol. Entomol 20, 224–228. [Google Scholar]
- 42.Honkanen A, Takalo J, Heimonen K, Vahasoyrinki M, and Weckstrom M (2014). Cockroach optomotor responses below single photon level. J. Exp. Biol 217, 4262–4268. [DOI] [PubMed] [Google Scholar]
- 43.Chen J, Luo J, Wang Y, Gurav AS, Li M, Akbari OS, and Montell C (2021). Suppression of female fertility in Aedes aegypti with a CRISPR-targeted male-sterile mutation. Proc. Natl. Acad. Sci. USA 118, e2105075118. [DOI] [PMC free article] [PubMed] [Google Scholar]
- 44.Li M, Bui M, Yang T, Bowman CS, White BJ, and Akbari OS (2017). Germline Cas9 expression yields highly efficient genome engineering in a major worldwide disease vector, Aedes aegypti. Proc. Natl. Acad. Sci. USA 114, E10540–E10549. [DOI] [PMC free article] [PubMed] [Google Scholar]
- 45.Straw AD, Branson K, Neumann TR, and Dickinson MH (2011). Multi-camera real-time three-dimensional tracking of multiple flying animals. J R Soc Interface 8, 395–409. [DOI] [PMC free article] [PubMed] [Google Scholar]
Associated Data
This section collects any data citations, data availability statements, or supplementary materials included in this article.
Supplementary Materials
Data Availability Statement
The wind tunnel behavioral data generated during this study are available at Mendeley Data (DOI: 10.17632/m8zmyndzsb.1; DOI: 10.17632/y2sbpv3zby.1; DOI: 10.17632/djbpsmxcj6.1; DOI: 10.17632/5fdv4bs29r.1; and DOI: 10.17632/yv6xs3h3rn.1). Th code is available upon request.