

Summary
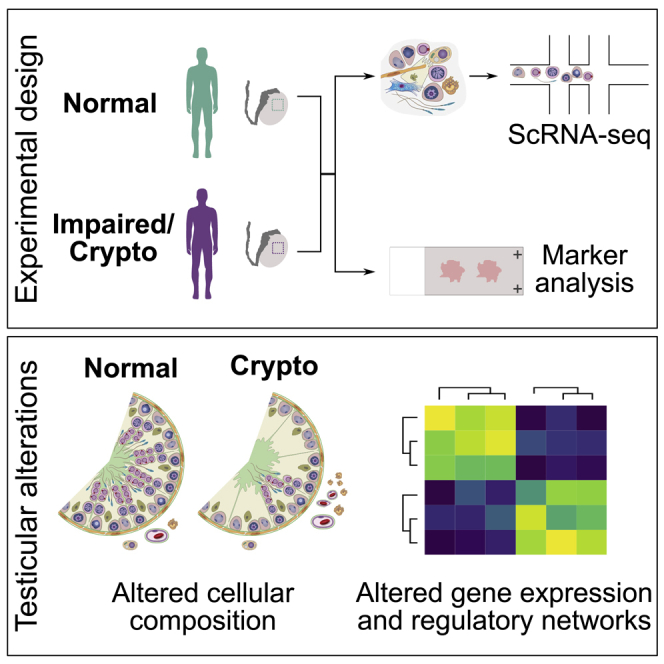
Despite the high incidence of male infertility, only 30% of infertile men receive a causative diagnosis. To explore the regulatory mechanisms governing human germ cell function in normal and impaired spermatogenesis (crypto), we performed single-cell RNA sequencing (>30,000 cells). We find major alterations in the crypto spermatogonial compartment with increased numbers of the most undifferentiated spermatogonia (PIWIL4+). We also observe a transcriptional switch within the spermatogonial compartment driven by increased and prolonged expression of the transcription factor EGR4. Intriguingly, the EGR4-regulated chromatin-associated transcriptional repressor UTF1 is downregulated at transcriptional and protein levels. This is associated with changes in spermatogonial chromatin structure and fewer Adark spermatogonia, characterized by tightly compacted chromatin and serving as reserve stem cells. These findings suggest that crypto patients are disadvantaged, as fewer cells safeguard their germline’s genetic integrity. These identified spermatogonial regulators will be highly interesting targets to uncover genetic causes of male infertility.
Keywords: male germline stem cells, spermatogonial stem cells, male infertility, impaired spermatogenesis, single-cell RNA sequencing, human spermatogenesis, stem cell differentiation, testis, spermatogonia
Graphical abstract
Highlights
Crypto(zoospermic) men show increased number of PIWIL4+/EGR4+ spermatogonia
Crypto undifferentiated spermatogonia over-activate the EGR4 regulatory network
The predicted EGR4 target UTF1 is downregulated in crypto spermatogonia
Crypto testes show reduced numbers of UTF1+ Adark reserve spermatogonia
Di Persio et al., apply single-cell RNA sequencing to testicular tissues from men with normal and impaired spermatogenesis. They find major alterations in the spermatogonial stem cell compartment with increased numbers of the most undifferentiated spermatogonia (PIWIL4+/EGR4+) and reduced numbers of the reserve spermatogonia (Adark) in impaired spermatogenesis.
Introduction
Infertility affects 10%–15% of couples worldwide, due to the male factor in half of the cases.2 Despite this high incidence of male infertility, about 70% of men do not receive a causative diagnosis.3 This knowledge gap hinders clinicians in their counseling of infertile men with regard to causal treatments, transmission of infertility to offspring, and potential health risks to offspring and the men themselves. This latter aspect is of particular interest, as male infertility and low sperm counts are associated with an increased risk for cancer, cardio-metabolic disease, and even premature mortality.4
Of infertile men, 7% are diagnosed with a severe form of oligoasthenoteratozoospermia termed “cryptozoospermia” (from the Greek kryptós, hidden), as they have fewer than 0.1 million sperm in the ejaculate, rendering natural conception almost impossible.3 The surgical approach of testicular sperm extraction (TESE) often represents the only route to retrieve viable sperm for use in intracytoplasmic sperm injection (ICSI). Lower fertilization and implantation rates of transferred embryos5 strongly indicate alterations not only in sperm production but also in the quality of the germ cells themselves. The underlying etiological factors for this severely impaired sperm production often remain unknown at the cellular and molecular levels but urgently need to be unveiled.
The highly complex process of spermatogenesis is regulated by a delicate interplay between the somatic environment and the germline. Spermatogonial stem cells (SSCs), a subpopulation of diploid spermatogonia, constitute the basis of spermatogenesis. SSCs are defined on the basis of their functional properties, their ability to self-renew, and their ability to give rise to differentiating germ cells. The human SSC system, according to the most accepted model, is classified as a progenitor-buffered system, containing quiescent reserve spermatogonia (Adark) in addition to self-renewing spermatogonia (Apale), the latter generating differentiating spermatogonia (B).6, 7, 8 These three different cell populations are classified on the basis of their morphological appearance and the chromatin structure of their nuclei. More recently, single-cell RNA sequencing (scRNA-seq) analyses of normal human testicular tissues enabled the identification of multiple spermatogonial states on the basis of transcriptional profiles,9, 10, 11, 12 indicative of a SSC compartment that is more heterogeneous than anticipated on the basis of morphological properties. Furthermore, these studies indicated PIWIL4 and EGR4 as marker genes of the most undifferentiated spermatogonia.9,11 However, whether the PIWIL4+ undifferentiated spermatogonia display an Adark or Apale morphology remains to be elucidated. In an attempt to identify the transcriptional profile of morphologically defined spermatogonia, Jan et al.13 performed RNA sequencing of Adark and Apale spermatogonia collected by laser capture microdissection. They observed no significant differences between the transcriptomes of these two spermatogonial populations.13 In line with these results, qualitative immunohistochemical analyses showed that Adark and Apale spermatogonia share expression of many marker genes, including UTF1, GFRA1, and FGFR3,14 which have been used in recent scRNA-seq studies to identify distinct spermatogonial states.9, 10, 11, 12,15 Therefore, the morphological phenotype of the transcriptionally defined spermatogonial states remains unknown. Importantly, the cellular and molecular alterations of the SSC compartment in stressful conditions, such as male infertility, remain to be discovered. This will provide not only valuable information about human SSC biology but might also reveal the mechanisms behind the reported association of male infertility and cancer.4 These insights will pave the way to understand the connection between male infertility and general health.
Results
Alterations of the spermatogonial compartment in cryptozoospermic men
To study cellular and molecular changes associated with male infertility, particularly in the spermatogonial compartment, we selected testicular biopsies from cryptozoospermic men (crypto; n = 18) and normal controls (normal; n = 20) on the basis of clinical parameters (Table S1). We used a multi-layered approach including quantitative histomorphometrical, scRNA-seq, and proteome analysis (Figure 1A). Histological quantifications revealed a reduced proportion of tubules containing elongated spermatids as the most advanced germ cell type in the crypto group, while the percentage of tubules with round spermatids, spermatocytes, and spermatogonia remained unchanged (Figure 1B). To assess the cellular composition of the spermatogonial compartment, we analyzed the pan-spermatogonial marker MAGEA4 and the undifferentiated spermatogonial marker UTF1 (Figure 1C). We found a similar number of spermatogonia (MAGEA4+) per tubule in tissues from normal and crypto individuals (n = 6 each). In contrast, tissues from the crypto group showed a reduction in UTF1+ spermatogonia (Figure 1D; Table S2).
Figure 1.

Crypto tissues show stable numbers of MAGEA4+ spermatogonia but reduced numbers of UTF1+ spermatogonia
(A) Experimental outline.
(B) Top: representative periodic acid-Schiff stained micrographs of testicular tissue of one normal (left) and one crypto (right) sample. Scale bars, 100 μm. Lower panel: boxplots showing the percentages of tubules containing germ cells (most advanced germ cell type), only Sertoli cells, or tubular shadows in the patient cohort. Values per patient can be found in Table S1. ∗p < 0.05 and ∗∗∗p < 0.001.
(C) Micrographs showing the MAGEA4 and UTF1 staining in normal and crypto testicular tissue. Inlays show examples of positive and negative cells for each staining. IgG controls show no staining. Scale bars, 100 μm.
(D) Quantification of MAGEA4+ (top) and UTF1+ (lower) spermatogonia per tubule in normal (n = 6) and crypto (n = 6) samples. No statistical difference was found in the number of MAGEA4+ spermatogonia per tubule between normal and crypto. A significant reduction was found in the number of UTF1+ spermatogonia per tubule in the crypto samples (∗p < 0.05; statistical details are available in Table S2).
(E) Stacked bar plots showing the ploidy of the single-cell suspensions used for scRNA-seq analysis of each patient sample.
(F) Top: uniform manifold approximation and projection (UMAP) plot of the integrated normal dataset. Clusters were assigned on the basis of the expression of 55 marker genes (Figure S1B). Lower panel: scRNA-seq data from the three normal samples. Each color represents a different cell type.
(G) Top: UMAP plot of the integrated crypto dataset. The clusters were assigned by anchoring integration using the normal dataset as reference. Lower panel: scRNA-seq data from the three crypto samples.
In-depth characterization of the molecular changes was performed using scRNA-seq analysis of normal and crypto testicular biopsies (n = 3 each). Suitable samples were selected on the basis of ploidy analysis, ensuring presence of haploid spermatids in all samples (Figure 1E). Using exome sequencing data of the three crypto men, we screened for rare, possibly, and likely pathogenic variants in 170 candidate genes previously described as being associated with impaired spermatogenesis,16 as well as in the recently published genes ADAD2, M1AP, MSH4, RAD21L1, RNF212, SHOC1, STAG3, and SYCP2. No genetic cause for infertility could be identified in any of the three analyzed crypto men. Following scRNA-seq and quality control, data from 15,546 and 13,144 cells were ultimately included in the analysis for normal and crypto samples, respectively (Table S1). Unsupervised clustering resulted in a comparable number of clusters (30 versus 29) between the two groups (Figures S1A and S1B). To assign identities to the clusters while still considering eventual biological differences between the groups, we used a two-step approach. First, we used 55 published marker genes to identify 15 cell types in the normal dataset (Figure S1B).9, 10, 11, 12 Notably, the latent space replicated the known differentiation process from spermatogonia to late spermatids (Figure 1F, spiral-like shape). Using this as a reference, we projected the same labels17 onto the crypto dataset and found the expected cell types represented (Figure 1G). Correct cluster assignment was confirmed by evaluating the expression of specific marker genes in the crypto dataset (Figure S1C). Importantly, all samples contributed to all cell type clusters in each dataset (Figures 1F and 1G). Additionally, using marker gene expression, we identified two additional clusters in the crypto group without equivalence in the normal dataset, namely, perivascular cells (cluster 7) and immune cells (cluster 24; Figure 1G).
Cellular and transcriptional changes in germ and somatic cell compartments
To explore the similarities and differences between the two groups, we combined all normal and crypto datasets (Figure 2A). Consistent with the histomorphometrical analysis (Figure 1D), evaluation of the scRNA-seq dataset showed comparable percentages of spermatogonia in both groups (Figure 2B). In fact, percentages were similar from spermatogonia up to zygotene spermatocytes (Figure 2B). However, from the pachytene spermatocyte stage onward, the crypto group displayed a striking reduction in germ cells (Figure 2B). This was corroborated by parallel quantitative proteomic analysis, showing comparable levels of spermatogonial marker MAGEA4 and reduced expression of markers for leptotene/pachytene spermatocytes (DPH7, PIWIL1) as well as spermatids (PRM2; Figure 2C). To assess the changes at the transcriptional level between all the identified cell types, we performed differential gene expression (DGE) analysis (Table S3) between normal and crypto and identified genes uniquely differentially expressed in each germ cell stage (Figure S2; Table S4). Interestingly, UTF1 and EGR4 were down- and upregulated, respectively, in the crypto undifferentiated spermatogonia (Figure S2A). Differentially expressed genes in differentiating spermatogonia, leptotene, zygotene, and pachytene spermatocytes were associated with Gene Ontology (GO) terms such as “cell cycle,” “chromosome organization,” “DNA repair,” and “telomere organization” (e.g., BRCA2, CENPA, SMC1A, SYCP3, MEIOB, CETN2; Figures S2B–S2E).
Figure 2.

Exploration of cellular and transcriptional changes in crypto testicular tissues
(A) Left panel: UMAP plot of the all integrated dataset. Right panel: contribution of the normal (15,546 cells) and crypto (13,144 cells) datasets to the all integrated dataset. The cells are color coded according to the respective cell types.
(B) Boxplot comparing the germ and somatic cell proportions in normal and crypto scRNA-seq datasets.
(C) Panel of boxplots representing the protein expression of 12 marker genes used in the cluster assignment (MAGEA4: spermatogonia; DPH7: leptotene spermatocytes; LY6K: zygotene spermatocytes; PIWIL1: pachytene spermatocytes; TEX29: early spermatids; PRM2: elongated spermatids; ACTA2: peritubular myoid cells [PMCs]; FATE1: Sertoli cells; HSD17B3: Leydig cells; VWF: endothelial cells; LYZ: macrophages; MUSTN1: perivascular cells). Protein expression was measured performing bottom-up mass spectrometry analysis on single-cell suspensions (normal n = 5 patients, crypto n = 4 patients) and shows a reduction of germ cells, starting from the leptotene spermatocytes, and an increase of macrophages in crypto patients. ∗p < 0.05 and ∗∗p < 0.01.
(D) Feature plots highlighting the expression of MUSTN1 in normal and crypto datasets.
(E) Representative micrographs showing blood vessels in consecutive sections of normal and crypto testicular tissues stained for MUSTN1 (magenta)/ACTA2 (green) and for VWF (magenta)/ACTA2 (green). The tissue sections were counterstained with DAPI (blue). Double-positive MUSTN1/ACTA2 cells were found surrounding the endothelial layer of the blood vessels. The IgG control showed no immunological staining. Scale bars, 100 μm (main) and 20 μm (inlays).
(F) Boxplots representing the number of ACTA2+ (top) and MUSTN1+ (lower) blood vessels per square millimeter of tissue in normal (n = 12) and crypto samples (n = 13). A significant increase of ACTA2+ and MUSTN1+ blood vessels was found between the two cohorts (∗p < 0.05 and ∗∗p < 0.01; statistical details are available in Table S2).
(G) Feature plots highlighting the expression of CD3E (immune cell marker gene) in normal and crypto datasets.
(H) Representative micrographs showing CD3+ immune cells (red) and ACTA2+ blood vessels (green) in normal and crypto testicular tissues. The tissue sections were counterstained with DAPI (blue). CD3+ immune cells were found solely in the crypto group in close proximity to blood vessels. The IgG control showed no immunological staining. Scale bars, 50 μm (main) and 20 μm (inlays).
In the somatic cell compartment, the most striking difference was the increase in the proportions of peritubular myoid cells (PMCs), fibrotic PMCs, and macrophages (Figure 2B); the latter finding in particular was supported by proteomic data, which revealed significantly increased macrophage marker LYZ expression (Figure 2C). Among somatic cells, PMCs showed the most profound changes in DGE analysis, with 83 down- and 149 upregulated genes, respectively, in the crypto group. GO analysis revealed an enrichment of genes involved in “extracellular matrix components and organization” (Figure S3A; Table S4). Because perivascular and immune cells did not have equivalents in the normal dataset, no direct comparison was conducted between normal and crypto samples (Figure S3B). DGE analysis between perivascular cells and PMCs in the crypto dataset revealed 48 genes (Figure S3C; Table S5) regulating muscle contraction (Figure S3D). To localize perivascular cells at the tissue level, we selected the musculoskeletal marker MUSTN1 from the upregulated genes, which was exclusively expressed in this cluster at RNA level (Figure 2D). MUSTN1 was specifically expressed in blood vessels, where it co-localized with ACTA2. Indeed, these ACTA2+/MUSTN1+ cells surrounded VWF+ endothelial cells (Figure 2E). Quantification of the total number of blood vessels per square millimeter revealed a significantly larger number of blood vessels in crypto samples (Figure 2F; Table S2). Similar results were obtained for the number of MUSTN1+ blood vessels per square millimeter (Figure 2F; Table S2). We therefore concluded that MUSTN1 is a specific perivascular cell marker and that an increased proportion of MUSTN1+ blood vessels is a specific feature of crypto samples. DGE analysis comparing immune cells with all other crypto cells resulted in 195 differentially expressed genes, including T cell marker CD3E (Figure 2G; Figure S3E; Table S5). To evaluate which types of immune cells were present in crypto testes, we performed pathway analysis and found involvement of cytotoxic T lymphocyte pathways (Figure S3F). Immunofluorescence analysis localized CD3+ T cells in the vicinity of blood vessels in crypto but not in normal samples (Figure 2H). To investigate the crosstalk between spermatogonia and their microenvironment, we used CellphoneDB.18 We found 50 significant ligand-receptor interactions considering both datasets (Figure 3). A significant interaction was detected between the spermatogonial-based receptors FGFR1 and FGFR3 and the ligand FGF2 produced by pachytene and diplotene spermatocytes in the crypto group. Moreover, spermatogonial-located ACKR2 showed significant interaction with its ligands secreted by endothelial cells, perivascular cells, macrophages, and immune cells (CCL2, CCL3, CCL4, CCL5, CCL3L1, and CCL14) in the crypto datasets but not in the normal.
Figure 3.

Ligand-receptor interaction analysis
Summary of ligand-receptor interactions between the normal and crypto undifferentiated spermatogonia and the other cell types in the tissues. p values are represented by the size of each circle. The color gradient indicates the level of interaction. Black squares indicate selected interactions that show a different significance in the normal and crypto datasets.
Crypto undifferentiated spermatogonia activate the EGR4 regulatory network
SCENIC was used to identify the gene regulatory network changes in the crypto somatic and germ cell populations.19 This pipeline identifies groups of genes, named regulons, co-regulated by a transcription factor. In total, we identified 403 regulons in the two datasets, each containing up to 2,450 genes (Table S6). To identify differentially activated regulons between the normal and the crypto dataset, we selected the 15 regulons with the highest specificity score for each cluster in the normal dataset. We then focused on those regulons in the crypto dataset that showed at least 20% change in the proportion of cells per cluster in which that specific regulon was active (Figure 4A; Table S6). Comparative evaluation of the binarized AUC (area under the curve) score of each regulon revealed 13 regulatory networks that were differentially activated between the two datasets (Figure 4A, bold). As perivascular and immune cells were uniquely represented in the crypto dataset, they were not included in this analysis. In the somatic compartment, although PMC and fibrotic PMC clusters presented the most striking differences in cell proportions, no regulon was differentially activated in these cells. Similarly, we could not find differentially activated regulons for Leydig cells. However, one differentially activated regulon was found in the macrophages in the crypto dataset (activation of RUNX3, 75 genes; Figure S4).
Figure 4.

Undifferentiated spermatogonia activate EGR4 regulatory network in the crypto group
(A) Binarized double heatmap showing the AUC score (area under the recovery curve, scoring the activity of regulons) of the identified regulons plotted separately for the normal (teal, left) and crypto (purple, right) datasets. For each cellular cluster, the first 15 regulons showing the highest regulon specificity score (RSS) in the normal dataset were plotted. The regulons in bold are those showing a difference of at least 20% in the proportion of cells with the active regulon in the crypto dataset and a significant difference in the regulon-specific AUC score between normal and crypto datasets.
(B–E) Top: stacked bar plots comparing the proportion of undifferentiated spermatogonia with active (B) ASCL2, (C) EGR4, (D) HOXC9, and (E) DLX5 regulons. Bottom: violin plots comparing the AUC score of the (B) ASCL2, (C) EGR4, (D) HOXC9, and (E) DLX5 regulons in the normal and crypto undifferentiated spermatogonia. A significant increase was found for all four regulons in the crypto dataset (Benjamini-Hochberg corrected p value of Mann-Whitney U test). A complete list of the regulons and their RSS and AUC scores is available in Table S6.
(F) Overlap among the 61 genes uniquely differentially expressed in undifferentiated spermatogonia and the genes putatively regulated by ASCL2, EGR4, HOXC9, and DLX5.
(G) Heatmap showing the expression in the normal and crypto undifferentiated spermatogonia of the 23 differentially expressed genes putatively regulated by EGR4.
(H) Top: micrographs showing the expression of MAGEA4 (purple) and EGR4 (green) in spermatogonia of normal testicular tissues. The tissue sections were counterstained with DAPI (blue). Scale bars, 40 μm (main and inlay). Lower panel: percentage of EGR4+ spermatogonia per MAGEA4+ spermatogonia in normal (n = 6) and crypto samples (n = 5). A significant increase was found in the percentage of EGR4+ spermatogonia per MAGEA4+ spermatogonia in the crypto samples (∗p < 0.05). Statistical details are available in Table S2.
Contrary to these minor changes in somatic cells, germ cells showed deeper alterations in their gene regulatory networks. Undifferentiated spermatogonia displayed four regulons with significantly enhanced activation in the crypto samples: ASCL2 (88 genes), EGR4 (594 genes), HOXC9 (139 genes), and DLX5 (104 genes) (Figures 4B–4E). Intriguingly, among the genes regulated by EGR4, we identified ASCL2, HOXC9, and DLX5, whereas none of the other transcription factors seemed to regulate the expression of EGR4. Comparison between the regulon and the DGE analysis of the undifferentiated spermatogonia showed that 23 of the differentially expressed genes were predicted to be regulated by EGR4 (Figures 4F and 4G). Follow-up histological analysis showed specific expression of EGR4 in spermatogonia and an increased percentage of EGR4+ cells within the MAGEA4+ spermatogonia (Figure 4H). Moreover, the E2F1 regulon (685 genes) showed a significant activation in differentiating spermatogonia (Figure S4A). Although no regulons in the crypto dataset were differentially active specifically in spermatocytes, early spermatids showed activation of RORA (Figure S4B), and late spermatids showed deactivation of STAT3, TBX4, ATF2, and RFX2 and activation of ETV2 (Figures S4C–S4G).
Crypto spermatogonial compartment shows an increased number of PIWIL4+ spermatogonia
To further scrutinize the changes in the spermatogonial compartment, we identified specific spermatogonial subtypes on the basis of marker genes reported in existing single-cell studies.9,11 For this, we subset and re-clustered undifferentiated and differentiating spermatogonial clusters from both datasets (Figure S5A). Upon analyzing the expression of the different published markers in the normal dataset, we could assign the clusters and identify six spermatogonial states: state 0 (PIWIL4, PHDGH, and EGR4), state 0A (UTF1, SERPINE2, and FGFR3), state 0B (NANOS2), state 1 (GFRA1, GFRA2, NANOS3, and ID4), state 2 (KIT, MKI67, DMRT1, and DNMT1), and state 3 (STRA8 and SYCP3) (Figure S5B; Figure 5A). Using the data from normal spermatogenesis as reference, these labels were projected onto the crypto dataset (Figure 5B). For further analyses, both datasets were integrated (Figure 5C). To compare our assignment with those published by Guo et al.9 and Sohni et al.,11 we performed correlation analysis among the three datasets. States 0, 0A, and 0B in our assignment showed the highest correlation with state 0 in Guo et al.9 (Figure S5C) and with SSC1-B, SSC1-A, and SSC1-C, respectively, in Sohni et al.11 (Figure S5D).
Figure 5.

The crypto SSC compartment shows altered composition with an increased number of PIWIL4+ spermatogonia
(A) UMAP plot showing the cluster assignment of the normal dataset. Six clusters were assigned on the basis of the expression of markers shown in Figure S5B: states 0, 0A, 0B, 1, 2, and 3. Each color represents a different cluster.
(B) UMAP plot showing the cluster assignment of the crypto dataset. The clusters were assigned by the anchoring integration method using the normal dataset as reference. Each color represents a different cluster.
(C) UMAP plot showing the integrated normal and crypto spermatogonial datasets. Each color represents a different cluster.
(D) Boxplots representing the different cell proportions in the normal and crypto spermatogonial datasets. The proportion of state 0A spermatogonia was significantly reduced in the crypto dataset (∗p < 0.05).
(E) Feature plots showing the expression level of PIWIL4, FGFR3, GFRA1, and NANOS3 in all integrated datasets
(F) Micrographs showing PIWIL4, FGFR3, GFRA1, and NANOS3 staining in testicular tissue. Inlays show examples of positive and negative cells for each staining. IgG controls show no staining. Scale bars, 50 μm (main), 20 μm (inlay), and 100 μm (IgG).
(G) Quantification of PIWIL4+, FGFR3+, GFRA1+, and NANOS3+ spermatogonia per tubule in normal (n = 6) and crypto (n = 6) samples. A significant increase was found in the number of PIWIL4+ spermatogonia per tubule in the crypto samples (∗p < 0.05). No statistical difference was found in the total number of GFRA1+, FGFR3+, and NANOS3+ spermatogonia between normal and crypto samples. Statistical details are available in Table S2.
(H) RNA velocities, derived from the scVelo dynamical model for the normal and crypto spermatogonial dataset, are visualized as streamlines in UMAP plots. A change in the arrow directionality can be observed in the crypto dataset.
We assessed the cellular composition of the spermatogonial compartment and found an increased number of cells in state 0 and a significantly decreased proportion of cells in state 0A in the crypto dataset but no differences in cell numbers in any other states (Figure 5D). It is of note that the state 0 cells are considered to be the most undifferentiated spermatogonia.9,11
To reveal whether this increase in the most undifferentiated spermatogonial state was also represented at the cellular level, and considering that the number of UTF1+ spermatogonia is significantly decreased (Figures 1C and 1D), we selected marker genes showing the highest expression in the following spermatogonial states: state 0 (PIWIL4), states 0 and 0A (FGFR3), and state 1 (GFRA1 and NANOS3) (Figure 5E). We then evaluated their expression using quantitative histomorphometrical analyses (Figure 5F). The altered proportions of the spermatogonial states identified on the basis of scRNA-seq data were largely corroborated by cell quantification. We found a significant increase in PIWIL4+ spermatogonia (state 0) per seminiferous tubule and no significant changes in FGFR3+, GFRA1+, and NANOS3+ spermatogonia (Figure 5G; Table S2).
To further unravel the alterations of the spermatogonial compartment, RNA velocity analysis20 was performed setting state 0 as the origin of the spermatogenic differentiation process.9 The velocity streamlines (which depend on the mRNA maturation in each cell) indicate that states 0 and 0A in the normal samples are transcriptionally not directed toward state 1, unlike state 0B (Figure 5H). In contrast, in the crypto samples the velocity streamlines in states 0, 0A, and 0B appear to be preferentially oriented toward state 1 (Figure 5H). This was evident in all three crypto samples (Figure S5E).
The crypto spermatogonial compartment shows reduced numbers of Adark spermatogonia
To evaluate the expression profile of the morphologically defined Adark spermatogonia, we assessed how many Adark spermatogonia were PIWIL4+, UTF1+, FGFR3+, GFRA1+, or NANOS3+. Semiquantitative evaluation in tissues showed the majority of Adark spermatogonia in the control group were UTF1+ (78.4%), whereas only 5.8% were PIWIL4+, 5.7% were FGFR3+, 18.1% were GFRA1+, and no Adark cells were NANOS3+ (Figures 6A–6D).
Figure 6.

The crypto group shows altered numbers of Adark spermatogonia
(A–D) Right panel: micrographs showing (A) UTF1+, (B) PIWIL4+, (C) FGFR3+, and (D) GFRA1+ Adark spermatogonia. Green arrowheads indicate Adark spermatogonia. Scale bars, 20 μm. Left panel: boxplots showing the percentage of UTF1+ (A), PIWIL4+ (B), FGFR3+ (C), and GFRA1+ (D) spermatogonia among the Adark population in normal (n = 6) and crypto (n = 6) samples. A mean of 78.4% of the Adark spermatogonia were UTF1+, 5.8% were PIWIL4+, 5.7% were FGFR3+, and 18.1% were GFRA1+ in the normal dataset. No significant difference was found in the crypto samples.
(E–I) Quantification of the percentage of Adark spermatogonia among MAGEA4+ (E), UTF1+ (F), PIWIL4+ (G), FGFR3+ (H), and GFRA1+ (I) spermatogonial populations in normal (n = 6) and crypto (n = 6) samples. A significant reduction of Adark spermatogonia was found among all the cell types (∗p < 0.05 and ∗∗p < 0.01).
(J) Quantification of the proportion of Adark spermatogonia per tubule according to the most advanced germ cell type present. Left: representative micrographs showing in the order one tubule from a normal sample containing spermatids as the most differentiated germ cell and three tubules from a crypto sample containing either spermatogonia (SPG), spermatocytes (SPC), or spermatids (SPT) as the most differentiated germ cell. Scale bar, 100 μm. Right panel: boxplot showing the quantification of Adark spermatogonia per tubule in normal (n = 6) and crypto (n = 6) samples. ∗p < 0.05. The asterisks refer to the comparison with the normal samples. Statistical details are available in Table S2.
See also Table S2.
We then asked whether the percentage of Adark spermatogonia is altered in the crypto samples. Indeed, assessment of the Adark spermatogonia among all spermatogonia (MAGEA4+) unveiled a significant reduction of this cell type in crypto samples (Figure 6E). Specifically, we found a general reduction in Adark cells among the PIWIL4+, UTF1+, FGFR3+, as well as GFRA1+ spermatogonia (Figures 6F–6I). Finally, we questioned whether the Adark reduction was dependent on the most advanced germ cell stage present in the respective tubules. Quantifications revealed that the number of Adark spermatogonia in the crypto samples was reduced independently of the spermatogenic state of the tubules (Figure 6J), suggesting that the loss of this cell type is a general process in crypto tissues. In sum, we found a general reduction of Adark spermatogonia and an increase of state 0 /PIWIL4+ spermatogonia in the crypto group. The state 0/PIWIL4+ cells are considered to be at the origin of the differentiation process,9,11 but just 3.5% of them show an Adark morphology.
Altered EGR4 and HOXC9 expression in crypto state 0 and 0A spermatogonia
To assess potential changes in gene expression observed in the undifferentiated spermatogonia of crypto samples, we used trajectory-based differential expression analysis (tradeSeq).21 For this, cells were aligned along the latent time (Figure S6A) and then subdivided into six groups containing equal cell numbers (knotgroups) using seven knots (Figure S6B). We focused our attention on the most undifferentiated spermatogonia, states 0 and 0A, which are mostly represented by knotgroups 1 and 2.
Comparing knotgroup 1, which includes 78.2% of state 0 spermatogonia, between the normal and crypto datasets revealed 21 up- and 12 downregulated genes (Figure 7A) involved in regulating cellular development and differentiation (Figure 7B); among those genes, we found EGR4 itself and 16 genes belonging to the EGR4 regulon (ANXA11, CEP131, CRIP2, EGR4, IDH2, NUDT14, PDLIM4, PLPP2, PODXL2, PSIP1, RAC3, SH2B2, SMARCD3, SPINT1, ST3GAL4, and importantly UTF1) (Figure 7C; Figure S6D). We had already identified an enhanced activation of the EGR4 regulon in undifferentiated spermatogonia of the crypto samples (Figure 4C), highlighting this regulon and gene as important regulators of spermatogonia. We then analyzed its expression in the spermatogonial states and found that although expression of EGR4 was restricted to state 0 in the normal situation, in the crypto dataset it showed a prolonged expression, being present also in states 0A and 0B (Figure 7D). Afterward, the expression of all EGR4-regulated genes was examined according to the spermatogonial states, confirming their modulation (Figure S6D). Interestingly, in the crypto group, we found reduced expression of UTF1 in state 0, 0A, and 0B spermatogonia (Figure 7D).
Figure 7.

Crypto state 0 and 0A spermatogonia show enhanced expression of EGR4 and HOXC9
(A) Double heatmap showing the normalized expression of the 33 genes identified by tradeSeq analysis as differentially expressed in the knotgroup 1 of the crypto dataset. The cells are plotted along the latent time with the normal cells on the left side (teal) and crypto cells on the right side (purple).
(B) The bar plot shows GO analysis of the 33 differentially expressed genes (DEGs) in the knotgroup 1. The results showed an enrichment in GO terms related to cellular differentiation and development. The red line on the bar plot represents p = 0.05.
(C) Line plots showing the expression of EGR4 and UTF1 in the normal (teal) and crypto (purple) cells along the latent time. The gray area highlights the cells belonging to the knotgroup 1. The plots show enhanced expression of EGR4 and reduced expression of UTF1 in the crypto knotgroup 1.
(D) Double violin plots comparing the expression level of EGR4 and UTF1 in the spermatogonial states in the normal (teal, left) and crypto (purple, right) datasets.
(E) Double heatmap showing the normalized expression of the 82 genes identified by the tradeSeq analysis as differentially expressed in the knotgroup 2 of the crypto dataset. The cells are plotted along the latent time with the normal cells on the left side (teal) and crypto cells on the right side (purple).
(F) The bar plot shows the GO analysis of the 82 DEG in the knotgroup 2. The results showed an enrichment in GO terms related to cellular differentiation and development. The red line on the bar plot represents the p = 0.05.
(G–I) Line plots showing the expression along the latent time of HDAC5 (G; regulated by EGR4 only), PVALB (H; regulated by HOXC9 only), and SERPINE2 and HOXC9 (I; regulated by EGR4 and HOXC9) in normal (teal) and crypto (purple) cells. The gray area highlights cells belonging to the knotgroup 2. The plots show enhanced expression of all genes in the crypto knotgroup 2.
(J–L) Double violin plots comparing the expression level of HDAC5 (J; present in EGR4 regulon only), PVALB (K; present in HOXC9 regulon only), and SERPINE2 and HOXC9 (L; present in both EGR4 and HOXC9 regulons) in normal (teal) and crypto (purple) cells along the latent time. The plots show enhanced expression of all the genes in crypto state 0, 0A, and 0B spermatogonia.
See also Figures S6 and S7.
For knotgroup 2, representing mostly state 0A cells, we identified 82 upregulated genes in the crypto cells (Figure 7E), most of which are involved in cell differentiation (Figure 7F). Again, EGR4 was one of the differentially expressed genes, together with HOXC9, which we had already identified in the crypto samples as an activated regulon in undifferentiated spermatogonia (Figure 4D). Among the differentially expressed genes in knotgroup 2, we found 25 genes that are regulated only by EGR4 (Figure 7G; Figures S6C and S7A), 1 gene that is regulated only by HOXC9 (Figure 7H), and 5 genes that are regulated by both transcription factors, including HOXC9 itself (Figure 7I; Figure S7C). Among the 25 EGR4-regulated genes in knotgroup 2, 12 were also upregulated in knotgroup 1 (Figure S6C).
Assessing the expression of these genes according to the spermatogonial states, we observed that, similar to EGR4, HOXC9 also displayed a prolonged expression in the crypto samples compared with the normal situation, in which it is expressed exclusively in state 0 (Figure 7L). This altered expression pattern was also observed for additional genes regulated by one or both of these transcription factors (Figures 7J–7L; Figures S7B–S7D), indicating that crypto samples show persistent expression of state 0 genes in undifferentiated spermatogonia (states 0–1).
Discussion
In this work we pioneered the study of human male germ cell defects using state-of-the-art approaches. These led us to identify target genes and mechanisms for explaining the etiology of infertility. At cellular level we unveiled major alterations of the spermatogonial compartment with an increase in the number of the most undifferentiated (PIWIL4+) spermatogonia but a reduction in the morphologically defined Adark reserve stem cells. Interestingly, these alterations are associated with prolonged expression of EGR4 in crypto samples. Also, we identified receptor-ligand interactions modulating the interplay between spermatogonia and their microenvironment.
ScRNA-seq analyses revealed six spermatogonial states on the basis of transcriptional profile, in line with published data.11 Interestingly, we found a representation of the same states in both normal and crypto groups. Although the total number of spermatogonia remained unchanged, the states were represented in different proportions in the two groups. The most prominent finding was an increase, in the crypto group, of PIWIL4+ state 0 cells, which have been suggested as the origin of the spermatogonial differentiation process.9,11,15 The increase of PIWIL4+ cells occurred concomitantly with a reduction of the UTF1+ cells, which we observed both at transcriptional and protein level. Moreover, we identified changes in transcriptional dynamics of crypto spermatogonia, as visualized by cells in state 0, uniformly pointing toward the direction of states 0A and 0B in the RNA velocity analysis. As, PIWIL4+ and UTF1+ spermatogonia are mostly quiescent,9,11,22,23 we hypothesize that these altered cell proportions are a consequence of a change in transcriptional profiles of spermatogonial subpopulations and not due to changes in cell proliferation (Figure S8A). We speculate that this increase in PIWIL4+ spermatogonia is the consequence of the reduced spermatogenic efficiency in cryptozoospermic men, but we cannot exclude that the failure to progress to more differentiated states might be the cause.
We identified the transcription factor EGR4 as one of the gatekeepers regulating the change in transcriptional profiles of spermatogonia in the crypto group. Supporting this hypothesis, we found EGR4 exclusively expressed in spermatogonia at protein level and in the most undifferentiated spermatogonial state (state 0) at transcriptional level, in accordance with recent studies.9,11 Importantly, trajectory-based differential expression analysis showed prolonged expression of EGR4 in spermatogonial states 0, 0A, and 0B in crypto samples. Moreover, we found enhanced activation of the EGR4, ASCL2, HOXC9, and DLX5 regulons in undifferentiated spermatogonia of crypto tissues. These four genes, including EGR4 itself, contain a putative binding site for EGR4 in their promoter region, suggesting EGR4 as an upstream regulator. The crucial role of EGR4 in the germline is corroborated by data demonstrating that it controls multiple differentiation steps during mouse spermatogenesis.24 Furthermore, EGR4 gene sequence variations, as well as altered gene expression profiles, have been identified in men with impaired spermatogenesis.25,26 Importantly, EGR4, ASCL2, HOXC9, and DLX5 have also been assigned pivotal roles in other cell systems. Interestingly, in small cell lung cancer EGR4 regulates proliferation through induction of DLX5 expression among other genes.27 ASCL2 activation is involved in restoring the intestinal stem cell system following damage,28 while HOXC9 and DLX5 are involved in neuronal and osteogenic cell differentiation processes, respectively.29,30 As these genes are highly relevant for cell proliferation and differentiation processes in multiple stem cell systems, dysfunction in these pathways may present a link between the germline and other cell systems crucial for general health.
One of the genes presenting a putative binding site for EGR4 is UTF1, whose expression negatively correlates with that of EGR4. UTF1 is a chromatin-associated protein expressed in human undifferentiated, quiescent spermatogonia.22,23 It is involved in embryonic stem cell (ESC) differentiation31 and acts as transcriptional repressor.32 Knockdown of UTF1 in ESCs results in extensive chromatin decondensation.33 Remarkably, we found a general reduction of the Adark spermatogonia, characterized by highly condensed chromatin,6,7 in the crypto group. Marker profiling of Adark spermatogonia shows that almost 80% are UTF1+. We therefore hypothesize that the reduction in UTF1 expression leads to a change in chromatin condensation resulting in the transition from an Adark to an Apale morphology (Figure S8B). Thereby at the cellular level, these cells with a more open chromatin are maintained in a “ready to react” status. The price of this change in operating status is the reduction of the reserve stem cells (Adark), which under normal conditions ensure the recovery of sperm production following a gonadotoxic insult, by their ability to transform into mitotically active Apale spermatogonia.34 Moreover, the over-recruitment of the reserve spermatogonia into mitotically active spermatogonia may not be sustainable in the long term and is likely to lead to further quantitative and qualitative deterioration of germ cells.
The Adark morphology is shared by spermatogonial subpopulations characterized by the expression of PIWIL4, FGFR3, and GFRA1, which define distinct states at the transcriptional level. Intriguingly, only 3.5% of the PIWIL4+ cells showed Adark morphology. These findings indicate that although multiple spermatogonial states are able to display morphology of Adark spermatogonia, which is in line with previous data,13 the state 0/PIWIL4+ spermatogonia, which have been recently suggested to be at the origin of the differentiation process,9,11 largely do not present this morphological phenotype. This led us to the conclusion that Adark spermatogonia may not be the most undifferentiated spermatogonia in the human testis, as previously suggested,7 and that the cells in spermatogonial states 0–1 share the capacity of originating Adark spermatogonia, although at different proportions. This presents a paradigm shift in the field.
Limitations of the study
The fact that the stem cell potential of the Adark spermatogonia will remain untested until it is possible to purify these cells for use in transplantation assays in primates (including the human) constitutes a limitation of this study. Unfortunately, because of profound species differences, including the lack of Adark reserve stem cells in rodents, these cannot be used as a model for mechanistic studies. The reduction of Adark spermatogonia may potentially lead in the long term to exhaustion of the stem cell pool in crypto patients, and therefore, these patients may prospectively benefit from cryopreservation of sperm prior to active family planning. Analysis of multiple biopsies and evaluation of the number of spermatozoa in the ejaculate of cryptozoospermic and /or oligozoospermic patients over time will be necessary to confirm the progressive nature of this condition.
The revelation of regulators of the human SSC compartment and its properties provides enticing possibilities. The screening of the genes highlighted in this report for pathogenic variants may help decipher genetic defects affecting spermatogonia and thus help resolve additional cases of male infertility. This will help avoid unnecessary surgical interventions, identify potential health risks for these men’s offspring, and establish preventive measures regarding their own general health risks. The lack of these genetic analyses constitutes a limitation of this study, and therefore the clinical relevance for genetic screenings cannot be determined yet.
STAR★Methods
Key resources table
| REAGENT or RESOURCE | SOURCE | IDENTIFIER |
|---|---|---|
| Antibodies | ||
| Mouse monoclonal anti-MAGEA4 - Dilution 1:20 | Prof. G.C. Spagnoli, University Hospital of Basel, CH | N/A |
| Rabbit polyclonal anti-PIWIL4 - Dilution 1:50 | Atlas Antibodies | Cat# HPA036588, RRID:AB_10673502 |
| Mouse monoclonal anti-UTF1 - Dilution 1:20 | Millipore | Cat# MAB4337; RRID:AB_827541 |
| Goat polyclonal anti-GFRA1 - Dilution 1:20 | R&D | Cat# AF714; RRID: AB_355541 |
| Rabbit monoclonal anti-FGFR3 - Dilution 1:5 | Cell signaling | Cat# 4574; RRID: AB_2246903 |
| Rabbit polyclonal anti-NANOS3 - Dilution 1:50 | Sigma-Aldrich | Cat# HPA062989; RRID: AB_2684916 |
| Rabbit polyclonal anti-EGR4 - Dilution 1:50 | LifeSpan BioSciences | Cat# LS-C405549-120 |
| Mouse monoclonal anti-ACTA2 - Dilution 1:1000 | Sigma-Aldrich | Cat# A2547; RRID: AB_476701 |
| Rabbit polyclonal anti-VWF - Dilution 1:100 | Atlas Antibodies | Cat# HPA001815; RRID: AB_611880 |
| Rabbit polyclonal anti-MUSTN1 - Dilution 1:100 | Sigma-Aldrich | Cat# ABD115 |
| Mouse IgG Control Antibody, Unconjugated | Sigma-Aldrich | Cat# I5381, RRID:AB_1163670 |
| Rabbit IgG Control Antibody, Unconjugated | Sigma-Aldrich | Cat# I5006, RRID:AB_1163659 |
| Goat F(ab’)2 Anti-Mouse IgG - (Fab’)2 (Biotin) - Dilution 1:100 | Abcam | Cat# ab5886; RRID:AB_954791 |
| Goat F(ab’)2 Anti-Rabbit IgG - H&L (Biotin) - Dilution 1:100 | Abcam | Cat# ab6012; RRID:AB_954766 |
| Streptavidin−Peroxidase from Streptomyces avidinii | Sigma-Aldrich | Cat# S5512 |
| Donkey Alexa Fluor 488 anti-mouse IgG - Dilution 1:100 | Thermo Fisher Scientific | Cat# A-11001; RRID: AB_2534069 |
| Donkey Alexa Fluor 647 anti-rabbit IgG - Dilution 1:100 | Molecular Probes | Cat# A-31573; RRID: AB_2536183 |
| Biological samples | ||
| Human testis samples | Centre of Reproductive Medicine and Andrology, University Hospital of Münster, Münster, Germany. | N/A |
| Critical commercial assays | ||
| 10x Chromium Single Cell A Chip Kit | 10x genomics | Cat# 1000009 |
| Deposited data | ||
| Raw sequencing data, Alevin counts, integrated counts and metadata | This paper | GEO: GSE153947 |
| Mass spectrometry proteomics data | This paper | PRIDE: PXD023979 |
| Original custom SCENIC computer code | This paper | https://zenodo.org/record/5145449 |
| Adult Human Single-cell RNA-seq dataset | Guo et al., 2018 | GEO: GSE120508 |
| Adult Human Single-cell RNA-seq dataset | Sohni et al., 2019 | GEO: GSE124263 |
| Software and algorithms | ||
| Alevin / Salmon - Version 0.13.1 | Srivastava et al., 2019; Patro et al., 2017 | https://combine-lab.github.io/salmon/ |
| anndata - Version 0.6.22.post1 | Theis Lab | https://github.com/theislab/anndata |
| anndata2ri - Version 0.1.dev67+9f3d451 | 1 Theis Lab | https://github.com/theislab/anndata2ri |
| arboreto - Version 0.15.1 | Moerman et al., 2019 | https://arboreto.readthedocs.io/en/latest/ |
| CellphoneDB – Version 2.1.2 | Efremova et al., 2020 | https://www.cellphonedb.org/ |
| Cell Ranger - Version 3.0.2 | 10x genomics | https://support.10xgenomics.com/single-cell-gene-expression/software/overview/welcome |
| clusterExperiment - Version 2.4.4 | Purdom E, Risso D | http://bioconductor.org/packages/release/bioc/html/clusterExperiment.html |
| Gencode - human reference v30 | Frankish et al., 2019 | https://www.gencodegenes.org/ |
| loompy - Version 2.0.17 | Linnarsson Lab. | https://loompy.org/ |
| Python - Version 3.7.3 | Python Software Foundation. | https://www.python.org/ |
| R - Version 3.6.0 | R Core Team (2019) | https://www.r-project.org/ |
| Scanpy / PAGA - Version 1.4.4 | Wolf et al., 2018; Wolf et al., 2019 | https://scanpy.readthedocs.io/en/stable/ |
| SCENIC (pySCENIC) - Version 0.9.19 | Aibar et al., 2017 | https://github.com/aertslab/SCENIC |
| Sctransform - Version 0.2.0 | Hafemeister and Satija, 2019 | https://github.com/ChristophH/sctransform |
| scVelo - Version 0.1.25.dev40+gd9ff2ad | Bergen et al., 2019 | https://scvelo.readthedocs.io/ |
| Seurat - Version 3.0.2 | Butler et al., 2018; Stuart et al., 2019 | https://satijalab.org/seurat/ |
| stageR - Version 1.6.0 | Van den Berge et al., 2017 | https://bioconductor.org/packages/release/bioc/html/stageR.html |
| tradeSeq - Version 1.1.18 | Van den Berge et al., 2020 | https://github.com/statOmics/tradeSeq |
| UMAP (Python) - Version 0.3.9 | McInnes et al., 2018 | https://umap-learn.readthedocs.io/en/latest/ |
| velocyto - Version 0.17.17 | La Manno et al., 2018 | https://velocyto.org/ |
Resource availability
Lead contact
Further information and requests for resources and reagents should be directed to and will be fulfilled by the Lead Contact, Nina Neuhaus (Nina.Neuhaus@ukmuenster.de).
Materials availability
This study did not generate new unique reagents.
Experimental model and subject details
Human testicular biopsies
Adult human testis samples (n = 34) were obtained from patients undergoing surgery for microdissection testicular sperm extraction (mTESE) or histological evaluation at the Department of Clinical and Surgical Andrology (University Hospital in Münster, Germany). One additional testicular sample was excised from each patient for this study after written informed consent. Ethical approval was obtained for this study (Ethics Committee of the Medical Faculty of Münster and State Medical Board no. 2008-090-f-S).
Selection of the patient cohort
For this study we selected patient samples with qualitatively and quantitatively normal spermatogenesis (normal, n = 20) and patients diagnosed with severe oligoasthenoteratozoospermia/cryptozoospermia (crypto, n = 18). Clinical workup prior to surgery included full physical evaluation, hormonal analysis (including luteinizing hormone (LH), follicle stimulating hormone (FSH) and testosterone (T)),35 semen analysis,36 and genetic analyses (including karyotype and screening for azoospermia factor (AZF) deletions). Exclusion criteria were known genetic causes of infertility, acute infections, testicular tumors, and a history of cryptorchidism. Normal patients were selected from those diagnosed with obstructive azoospermia due to previous vasectomy, a congenital bilateral absence of the vas deferens (CBAVD), or physical obstruction of the vas deferens. The absence or the obstruction of the vas deferens prevents sperm from entering the urethra. Therefore, no sperm is found in the ejaculate of these men. To father a biological child, these patients need to undergo surgery to retrieve sperm directly from the testis for use in intracytoplasmic sperm injection (ICSI). These patients have normal testicular volume, normal FSH levels and qualitatively and quantitatively normal spermatogenesis. Age-matched cryptozoospermic patients had a sperm concentration < 0.1 million/ml (cryptozoospermia) in the ejaculate, a reduced testicular size, and, in most cases, elevated FSH levels due to a severe impairment of spermatogenesis itself. All patients had spermatozoa in their TESE samples, regardless of histological results. Detailed clinical information about all the patients is available in Table S1. We subjected six testicular tissues (normal = 3; crypto = 3) to scRNA-seq. Moreover, we added independent samples for proteome and histological analyses to further expand the sample cohort. Due to sample limitation, only 2 of the 3 crypto samples could be included in the proteome analysis.
Patients selected for scRNA-seq
Among the six patients selected for scRNA-seq, the three normal patients had no sperm in the ejaculate due to: physical obstruction of the vas deferens (N1), absence of the vas deferens due to CBAVD condition (N2), and vasectomy (N3). All of them underwent TESE in order to retrieve sperm for ICSI. The three crypto patients all had few immotile sperm in the ejaculate, which were insufficient for ICSI procedures and therefore also underwent TESE for sperm retrieval. Compared to the normal patients, all the crypto patients showed lower testicular volume (N1: 17.5 ml; N2: 21 ml; N3: 21.5 ml; Cr1: 8.5 ml; Cr2: 14 ml; Cr3: 7.5 ml), higher FSH level (N1: 2 U/l; N2: 3.3 U/l; N3: 8.2 U/l; Cr1: 8.5 U/l; Cr2: 19.9 U/l; Cr3: 11.6 U/l) and lower Bergmann-Kliesch scores (N1: 9; N2: 8; N3: 8; Cr1: 1; Cr2: 0; Cr3: 4). These latter values indicate impaired spermatogenesis in the crypto group. The levels of luteinizing hormone (LH), testosterone, free testosterone, sex hormone-binding globulin (SHBG), prolactin, estradiol and dihydrotestosterone (DHT) were within the normal range, in both groups. Detailed information about all patients is available in Table S1.
Method details
Exome sequencing
The exomes of the three cryptozoospermic men were sequenced. Briefly, target enrichment was performed by SureSelect QXT Target Enrichment Kit according to the manufacturer’s protocol using the capture libraries Agilent SureSelect Human All Exon Kit V6. Sequencing was performed on the Illumina NextSeq 500 system. The data was evaluated for rare (minor allele frequency [MAF] in gnomAD < 0.01), possibly and likely pathogenic variants (stop-, frameshift- and splice site-variants) in 170 candidate genes previously reported to be associated with impaired spermatogenesis according to Oud et al.16 Additionally, the recently published genes ADAD2, M1AP, MSH4, RAD21L1, RNF212, SHOC1, STAG3, SYCP2, associated with non-obstructive azoospermia, were screened. Only variants with a coverage > 10 and detected in genes that quantitatively impair spermatogenesis were considered for further analyses. Variants in recessive genes were only evaluated if at least two were identified in the same individual. For putative dominant and X-linked genes, variants that were also found in fertile controls were not considered for further analyses.
Preparation of single cell suspensions
Single cell suspensions were obtained using a two-step enzymatic digestion as previously described.37,38 A total of 20 000 cells were used for ploidy analysis, 12 000 cells were prepared for scRNA-seq and 50 000 cells were stored at −80°C for proteomic analysis.
Ploidy analysis
Ploidy analysis was performed on 20 000 cells of each sample prior to scRNA-seq. After centrifugation, the cells were incubated in the dark for 30 minutes with a solution containing 50 μg/ml Propidium Iodide (Sigma- Aldrich, Cat# P4170), 1 mg/ml bovine serum albumin (Sigma-Aldrich, Cat# A9647), 0.1% Triton X-100 (Sigma-Aldrich, Cat# 93443), and 10 μg/ml RNase A (Sigma-Aldrich, Cat# R6513) in phosphate-buffered saline (PBS). After incubation, approximately 10 000 cells were analyzed for each sample using a Beckman Coulter CytExpert QC Flow Cytometer. Debris was defined based on forward and side scatter and excluded from the analysis. The cells analyzed for DNA content were measured at 617 nm and assigned to the following categories according to staining intensity: 1) haploid cells (1C: spermatids), 2) diploid cells (2C: spermatogonia, somatic cells (e.g., Leydig peritubular and Sertoli cells)), 3) “double diploid” cells (4C: spermatocytes).
ScRNA-seq library preparation and sequencing
12 000 cells per sample (normal = 3; crypto = 3) were suspended in MEMα at a concentration of 500 cells/μl and loaded onto the Chromium Single Cell A Chip. Library preparation was performed following the kit instructions (Chromium Single Cell Kit [v2 chemistry]). Briefly ∼6 000 cells per sample were captured by the 10x Genomics Chromium controller, after cDNA synthesis, 12-14 cycles were used for library amplification. The resulting libraries were quantified using the Lab901 TapeStation system (Agilent) before shallow sequencing (NextSeq 550 sequencer, Illumina) for quality control. The final, deep sequencing was performed on a NovaSeq 6000 sequencer (Illumina), using 2 × 150 bp paired-end sequencing.
ScRNA quantification and UMI/CB correction
Alevin39,40 was used to deduplicate and quantify the single-cell sequencing data and to discern the valid cellular barcodes (CB) from the background noise. The Gencode41 human reference v30 was used as transcriptomic reference, together with the flags–useCorrelation and–chromium in the quantification. Additionally, the–expectCells parameter was set to 6 000 (50% of the initial loading of 12 000 cells) to help the CB knee finding method. This approach resulted in a mean of 4 783 cells (SD: 587) per sample and a mean/median number of 2 460 (SD: 799) expressed genes per cell.
Normalization, sample integration, dimensional reduction and label transfer
Alevin counts were processed with Seurat.17,42 To reduce initial noise, genes expressed in less than 0.1% of the cells were excluded, together with cells containing fewer than 200 counts. In total, only 9 cells were removed by this filter. The analysis of mitochondrial content in regard to the total measured expression revealed 471 cells (1.6%) with a strong mitochondrial effect (> 25% of mitochondrial counts), 306 of them (65%) later identified as Sertoli cells. It is unknown at the moment if this high mitochondrial content is a sign of cell death or a normal feature of Sertoli cells, therefore these cells were not excluded from the analysis. Mitochondrial content and total RNA counts were used as a regression variable in the normalization procedure sctransform,43 with the number of variable features set to 5 000. Anchor-based sample integration was performed on the normalized counts, setting the number of features in the anchor finding process to 5 000. We integrated normal and crypto samples (n = 3, each) in three ways, resulting in an integrated dataset of all normal samples, an integrated dataset of all crypto samples and an integrated dataset consisting of all six samples. As proposed by the Seurat developers, scaling was disabled in the FindIntegrationAnchors() method, due to the prior normalization by sctransform. All available genes were kept in the integrated dataset, irrespective of their usage as anchors or not. Integrated counts were scaled and centered for principal component (PC) analysis and dimensional reduction. For each scaled dataset, 100 PCs were calculated using the most variable genes. Elbow-Plots of the PCs were generated to determine the inflection point, confirming 25 PCs for further analysis. A shared nearest neighbor graph was constructed based on the PCs. Cell clusters were identified via the smart local moving algorithm44 with a resolution parameter of 1 100 random starts and a maximum of 100 iterations. For data visualization, the non-linear dimensional reduction method UMAP45 was used based on the specified 25 PCs.
To enable an unbiased verification of the cluster identities, the top marker genes per cluster were computationally determined with the FindAllMarkers() function, testing with MAST46 only for positive marker genes with a minimal expressed-in fraction of 30% (p < 0.001). These computational markers were used with known cell type markers from the literature9, 10, 11, 12 to carefully assign cluster identities. Following the marker-based cluster identity assignment in the normal dataset, identity labels were transferred to the crypto dataset utilizing the Seurat label transfer functionality. Imputed cell identity labels were carefully inspected and again confirmed by marker expression. The same clustering and dimensional reduction approach was performed on the subgroup of spermatogonial cells of the normal and crypto dataset.
Differential gene expression analysis
Intra- and inter-dataset differential gene expression analysis was performed using MAST.46 The original Alevin expression counts (after default Seurat normalization) were used to avoid bias by the scaling effect of sample-wise sctransform normalization or sample integration. Filter criteria for differentially expressed genes (DEG) were: default log fold change threshold of 0.25, FDR-corrected p value below 0.01 and expression in at least 10% of the cells of one comparison group.
PAGA trajectory inference
Partition based graph abstraction (PAGA)47 from the Scanpy package48 was used for trajectory inference. The neighborhood graph was based on the top 25 PCs from Seurat with the number of nearest neighbors set to 20. Cell identity labels were used as partition categorical for the PAGA construction. Based on the PAGA, a new UMAP embedding was computed to better reflect the global topology, using 100 optimization iterations (epochs).
RNA velocity estimation and embedding
RNA velocity is the time derivative of the measured mRNA abundance (mature spliced/ nascent unspliced transcripts) and allows to estimate the future developmental directionality of each cell. As the abundance estimation relies on genomically aligned nascent reads, it is not possible to use the transcriptomic pseudo-alignment of Alevin. Therefore, we used the 10x Genomics Cell Ranger pipeline to create a genomic BAM file for each sample. Subsequently, aligned reads were used separately as input for velocyto,20 as well as the 10x Genomics genomic annotation file and UCSC expressed repeats annotation file. Velocyto analysis of each sample was limited to cell barcodes validated by Alevin. Due to differences in the barcode correction methods of Alevin and Cell Ranger, RNA velocity could not be estimated for a total of 24 cells (0.08% of total cells). Per sample abundance estimates were combined with the loompy package, analogous to the scheme in the Seurat integration step. Combined abundance data was merged with the PAGA anndata object using scVelo.49 Abundance estimates were normalized and filtered, requiring a minimal abundance of 5 per gene, simultaneously in the spliced and unspliced counts. First and second order moments were calculated utilizing the first 30 PCs and 30 neighboring cells from the neighbor graph. The likelihood-based dynamical model from scVelo was applied, recovering full splicing kinetics before estimating the velocities. In addition to the velocity graph and the projection of the velocities into the UMAP embedding, a gene-shared latent time was calculated. The latent time is solely based on the transcriptional dynamics and represents the internal clock of a cell. For the latent time calculation, a cell from the most undifferentiated cell type was used as a root cell, if applicable.
Gene regulatory network inference
The python version of the SCENIC19 pipeline was used for gene regulatory network inference. Briefly, SCENIC links cis-regulatory sequences to single-cell gene expression data to predict interactions between transcription factors (TFs) and target genes. Pairs of genes and co-expressed TFs were identified with the GRNBoost2 algorithm from Arboreto,50 using the standard normalized Alevin counts. Additionally, a list of 1390 curated human TFs was used, provided in the SCENIC repository. Co-expression modules derived from this analysis were pruned to remove indirect targets and false positives (using human motifs v9 and hg38 databases from cisTargetDB). In accordance with the SCENIC publication we refer to modules with significant motif enrichment of the correct upstream regulator as ‘regulons’. Cells with enriched expression for genes in a regulon were marked as active for this specific regulon. Additionally, a Jensen-Shannon divergence based regulon specificity score51 (RSS) was used for ranking purposes.
As we experienced highly variable results for different SCENIC runs on the same data, we choose a strategy to increase the stability of the adjacency calculation, i.e., the target gene and transcription factor co-expression measurement and weighting. Because of its nondeterministic nature, we decided to perform this calculation 10 times and only carry over gene–TF links that appeared in each of the runs. This “meta-adjacency” Table, consisting of the median weight per link, was used in subsequent SCENIC steps.
Differential expression analysis along latent time
We utilized the R package tradeSeq21 to perform differential expression analysis along the common gene-shared latent time between the spermatogonial cells of the normal and crypto datasets. Standard normalized Alevin counts were filtered, excluding genes with a total expression below 10 (excluding 28% of 33 679 genes). For each gene, a negative binomial generalized additive model was fitted to seven knots along the latent time, in accordance to the results of evaluateK(). The knots are equally distributed among the cell density along the trajectory, with the first and last knot representing the minimal and maximal trajectory value, respectively. Knots were comprised to knot groups, where all cells between adjacent knots are included. We focused on identifying genes differentially expressed exclusively in a single knot group. For this, we adopted the stageR52 two-staged testing scheme, performing a whole-trajectory patternTest() for the screening stage and a earlyDETest() for each knot group in the confirmation stage. All tests were performed against a foldchange of log2 (1.2) with an overall false discovery rate of 0.05. The fitted distributions of the significant genes of each earlyDETest() were clustered, using 100 cluster points and a minimal cluster size of 20, except for knotgroup 1, where a minimal cluster size of 10 was used.53
Correlation analysis of spermatogonial cell types
Cell types of the subset of spermatogonial cells were assigned based on the conjunction of markers of spermatogonial states, as described by Guo et al.9 and Sohni et al.11 To asses that the cell type assignment worked as expected, correlation analysis of spermatogonial states between our dataset and the datasets of Guo and Sohni was performed. Spearman correlation of common genes was based on an “average” cell, consisting of the gene-wise mean of all cells of the specific state.
Cell-cell communication analysis
Analysis of cell-cell communication was performed with CellphoneDB18 (Version 2.1.2), using the “statistical_analysis” method. Ligands and receptors were required to be expressed in at least 50% of the cells (–threshold) and the number of iterations was set to 10 000. Significant interactions (p < 0.05) were subsequently visualized.
Gene ontology and pathway analysis
Gene ontology analysis was performed using the Gene Set Enrichment Analysis (GSEA) (https://www.gsea-msigdb.org/gsea/index.jsp). Pathway analysis was performed using Ingenuity Pathway Analysis (QIAGEN).
Sample preparation and LC-MS/MS analysis
Single cell suspensions obtained by digestion of a biopsy (see “Single cell suspension preparation” section) from either normal (n = 5) or crypto patients (n = 4) were prepared for bottom-up mass spectrometry analysis, combining a one-pot sample preparation method (iST-NHS; Preomics) with isobaric tandem mass tags (TMT) labeling and subsequent stepwise reversed-phase fractionation at high pH (Thermo Fisher Scientific, Pierce, Cat# 84868). Cell lysis, digestion and labeling were performed according to the manufacturer’s protocol, except for the two samples containing 1.0x10⁶ cells (assuming a protein content of 200 μg), where volumes of buffers and reagents were adjusted accordingly (N1, N2). In addition, to support complete degradation of released chromatin, 1 μl of Benzonase was added to each sample after the initial lysis/denaturation step and incubated for 10 minutes at room temperature (RT). TMT labeling was performed following digestion by directly adding the TMT labeling reagent resuspended in 41 μl dry acetonitrile to the corresponding digest (RT, 500 rpm, 1hr). Prior to quenching the labeling reaction with 5% hydroxylamine, a “label check” was performed by analyzing 1 μl of each sample by mass spectrometry. A second mass spectrometry analysis was performed by mixing 1 μl of each sample to obtain normalization factors for the correct 1:1 ratio across all channels. Following desalting and lyophilization of the mixture, labeled peptides were resuspended in 300 μl of 0.1% TFA and submitted to a reversed-phase fractionation procedure at high pH on spin columns according to the manufacturer’s instructions (5% - 50% acetonitrile, 0.1% triethylamine). This resulted in 8 fractions (plus desalted flowthrough and 2 wash fractions) that were dried down in an Eppendorf concentrator before being resuspended in 0.1% formic acid for mass spectrometry analysis. All samples were measured twice as technical replicates. Samples were measured on an Easy nLC 1200 system coupled to a Q Exactive HF MS via a Nanospray Flex ion source (ThermoFisher Scientific). Peptides were dissolved in buffer A (0.1% formic acid) and separated on a 25 cm column, in-house packed with 1.9 μm C18 beads (Reprosil -Pur C18 AQ, Dr. Maisch) using a multi-linear gradient from 5%–18% buffer B (80% acetonitrile; 0.1% formic acid) and from 18%–40% B in 55 min each, followed by an increase to 60% B in 10 min, a final washout for 7 min at 90% B and re-equilibration at starting conditions (100% buffer A; flow rate 250 nl/min). The Q-Exactive HF mass spectrometer was operated in data-dependent acquisition mode (spray voltage 2.1 kV; column temperature maintained at 45°C using a PRSO-V1 column oven (Sonation, Biberach)). MS1 scan resolution was set to 120 000 at m/z 200 and the mass range to m/z 350-1 600. AGC target value was 3E6 with a maximum fill time of 50 ms. Fragmentation of peptides was achieved by higher-energy collisional dissociation (HCD) using a top15 method (MS2 scan resolution 60 000 at 200 m/z; AGC Target value 1E6; maximum fill time 108 ms; isolation width 1.3 m/z; normalized collision energy 32). Dynamic exclusion of previously identified peptides was allowed and set to 30 s, singly charged peptides and peptides assigned with a charge > 8 were excluded from the analysis. Data were recorded using Xcalibur software (ThermoFisher Scientific).
MS data analysis and quantification
Raw MS files were processed using MaxQuant (version 1.6.6.0).54 Identification of peptides and proteins was enabled by the built-in Andromeda search engine by querying the concatenated forward and reverse human Uniprot database (UP000005640_9606.fasta; version from 04/2019) including common lab contaminants. Allowed initial mass deviations were set to 7 ppm and 20 ppm, respectively, in the search for precursor and fragment ions. Trypsin with full enzyme specificity and only peptides with a minimum length of 7 amino acids was selected. A maximum of two missed cleavages was allowed; the ‘match between runs’ option was turned on. Carbamidomethylation (Cys) was set as fixed modification, while Oxidation (Met) and N - acetylation at the protein N terminus were defined as variable modifications. For peptide and protein identifications, a minimum false discovery rate (FDR) of 1% was required. First, the list of identified proteins was filtered and potential contaminants, reverse hits derived from the target-decoy search as well as proteins that were identified only by a single modified peptide were removed. Only proteins identified by at least one unique peptide were retained for further analysis. Next, a sample loading normalization step was performed using an R script (https://pwilmart.github.io/TMT_analysis_examples/CarbonSources_MQ.html), which was adapted to our own experimental setup. The list of proteins containing the normalized reporter ion intensities was imported into the Perseus bioinformatics tool. Proteins that did not show reporter ion intensities in all 10 TMT channels were removed, and reporter ion intensities were log2 transformed. To screen for differentially expressed proteins, a two-sided Student’s t test was performed using permutation-based FDR calculation as truncation (FDR = 0.05), also taking into account the contribution of the difference of the means (s0 = 0.1).55
PAS, immunohistochemical and immunofluorescence staining
Testicular biopsies were fixed in Bouin’s solution overnight and then washed in 70% ethanol. The tissues were paraffin-embedded and sectioned at 5 μm. Tissue sections were dewaxed with AppiClear (Applichem, Cat# A4632.2500), rehydrated through decreasing ethanol concentrations, and washed in distilled water. For periodic acid-Schiff/hematoxylin (PAS) staining, the slides were first incubated in 1% PA (Sigma-Aldrich, Cat# 1.005.240.100) and then in Schiff’s reagent (Sigma-Aldrich, Cat# 1.090.330.500). Cell nuclei were counterstained with Mayer’s hematoxylin solution (Sigma-Aldrich, Cat# 1.092.490.500). After rinsing in tap water, the slides were dehydrated through increasing ethanol concentrations, incubated in AppiClear solution, and closed with Merckoglas (Sigma-Aldrich, Cat# 1.039.730.001).
Immunohistochemical staining was performed as previously described.38 Briefly, after rehydration, the sections underwent heat-induced antigen retrieval using sodium citrate buffer pH 6.0. The endogenous peroxidase activity and the unspecific antibody binding were blocked using hydrogen peroxide (Hedinger, Cat# GH06201) and a solution containing goat serum (Sigma-Aldrich, Cat# G6767-100ML) and BSA, respectively. The sections were incubated overnight at 4°C with the primary antibodies diluted in the blocking solution. The following day, sections were incubated with a biotin-labeled secondary antibody and then with streptavidin-horseradish peroxidase. The peroxidase activity was detected using 3,30-diaminobenzidine tetrahydrochloride solution (Applichem, Cat# A0596.0001). The reaction was stopped with distilled water and nuclei were counterstained with Mayer’s hematoxylin. Finally, the slides were rehydrated with increasing ethanol concentrations, washed with AppiClear, and closed with Merckoglas. The sections were scanned with Precipoint M8 Microscope and Scanner (Precipoint, Freising, Germany).56
The immunofluorescent staining was performed as previously described.23 After rehydration, the sections underwent heat-induced antigen retrieval using sodium citrate buffer pH 6.0. After cooling to room temperature the tissues were permeabilized with Triton X-100, incubated with 1M glycine (Sigma-Aldrich, Cat# G7126-500G) and then covered with a blocking solution of tween (Sigma-Aldrich, Cat# 655205), BSA, and donkey serum (Sigma-Aldrich, Cat# S30-100 ml). The incubation of the primary antibodies was performed overnight at 4°C in blocking solution. The following day the sections were washed and incubated for 1 hour with species specific secondary antibodies diluted in blocking solution. Slides were finally mounted with Vectashield Mounting Media with 4,6-diamidino-2-phenylindole as nuclear counterstain (Vector Laboratories, Cat# H-1200). Stainings were digitalized employing the Olympus BX61VS microscope and scanner software VS-ASW-S6 (Olympus, Hamburg, Germany).
Evaluation of the testicular histology
To score the spermatogenic status of each patient two PAS-stained sections from two independent biopsies per testis were evaluated using the Bergmann and Kliesch method.57 A score from 0 to 10 was assigned to each patient according to the percentage of tubules containing elongated spermatids. In the same sections, the percentage of seminiferous tubules containing spermatocytes or spermatogonia as the most advanced germ cell type was assessed, as well as Sertoli cell only and hyalinized tubules (tubular shadows).
Adark, Apale, B spermatogonia identification
The Adark, Apale and B spermatogonia were defined according to morphological criteria as previously published.6,7 Briefly, the Adark spermatogonia presented a spherical or slightly ovoid nucleus containing uniformly dark stained chromatin with an unstained central rarefaction zone. Apale spermatogonia had an ovoid nucleus containing very weakly stained chromatin and 1-3 deeply stained nucleoli attached to the nuclear membrane. Finally, B spermatogonia showed a spherical nucleus with granulated and weakly stained chromatin and intensely stained nucleoli detached from the nuclear membrane.
Quantification and statistical analysis
Histological quantifications and statistics
Quantification of ACTA2, MUSTN1, VWF stained cells following immunofluorescence analyses was performed with Fiji/ImageJ.58 The number of ACTA2+ and MUSTN1+ blood vessels was evaluated in two independent sections of normal (n = 12) and crypto (n = 13) patients and normalized per area (mm2). To discern between the ACTA2+ seminiferous tubules and the ACTA2+ blood vessels for each stained section a consecutive section was stained with the endothelial marker VWF. A blood vessel was defined as such provided that it was positive for VWF in the consecutive section. Quantification of EGR4 and MAGEA4 stained cells following immunofluorescence analyses was performed using QuPath 0.2.2.59 The number of EGR4+ and MAGEA4+ spermatogonia was evaluated in normal (n = 6) and crypto (n = 5) patients. Specifically, 500 MAGEA4+ cells per sample were quantified and the percentage of EGR4+ cells among/within this population was determined. Cells were considered EGR4+ provided that the EGR4 staining was overlapping with the nucleus of the cell and/or was completely surrounding the nucleus of the cell.
Each immunohistochemical quantification was performed on normal (n = 6) and crypto (n = 6) samples using the Precipoint Viewpoint software (Precipoint, Freising, Germany). The number of MAGEA4+, PIWIL4+, FGFR3+, GFRA1+, NANOS3+ and UTF1+ spermatogonia per tubule was assessed per round tubule. Tubules were considered round when the ratio between the two diameters was in the range of 1 - 1.5. The percentage of PIWIL4+, FGFR3+, GFRA1+, NANOS3+ and UTF1+ Adark spermatogonia was evaluated counting 100 Adark spermatogonia per sample and determining the proportion of each marker. In case of the crypto samples it was not always possible to reach 100 Adark spermatogonia. To evaluate how many MAGEA4+, PIWIL4+, FGFR3+, GFRA1+ and UTF1+ spermatogonia were Adark, we counted 100 spermatogonia positive for each marker in each sample and then assessed the proportion of Adark spermatogonia. Tubules of the crypto samples were subdivided into three categories according to the most advanced germ cell type present: spermatogonia, spermatocytes and spermatids. All the quantification results were plotted as boxplots (center line: median; box limits: upper and lower quartiles; whiskers: 1.5 × interquartile range; points: outliers). Normality and homoscedasticity tests were performed for all variables and differences between groups were assessed by parametric (t test) or non-parametric tests (Mann-Whitney U test) as appropriate. Kruskal-Wallis rank sum test was used to compare three or more independent groups, followed by multiple pairwise comparisons. Statistical analysis and graphs were executed using R 4.0.0 and packages stats (v4.0.0) and ggplot2 (v3.3.1). Details regarding the number of samples or cells evaluated and the statistical analysis are provided in Table S2.
Acknowledgments
We thank Klaus Redmann for excellent technical support in PI analyses of testicular samples. We thank Nicole Terwort for excellent technical support in processing of testicular tissues, and we thank Heidi Kersebom and Elke Kößer for histological evaluation of testicular tissues. We also thank Sabine Forsthoff for excellent support in endocrinological measurements and Willi Kramer, Fotozentrale University Hospital of Münster, for the illustration in Figure 1A. This work was supported by the German Research Foundation (CRU326) (grants to N.N. (NE 2190/3-1; NE 2190/3-2), S.L. (LA 4064/3-2), and F.T., as well as a pilot project to S.D.P. and S.L.). We also thank the CeRA for institutional funding.
Author contributions
S.D.P., T.T., S.L., and N.N. designed the study, performed data analysis and data interpretation, and wrote the manuscript. H.C.A.D. performed low-input proteome analyses. M.J.W. and F.T. performed whole-exome sequencing and data analyses. X.L. and G.M.Z.H. provided the infrastructure and expertise for scRNA-seq and prepared sequencing libraries. T.T. and M.D. performed bioinformatic analyses of scRNA-seq datasets. L.M.S.-K. and S.D.P. performed experiments. J.-F.C. and S.K. supervised clinical patient care and documentation in the database, performed surgery, and were responsible for clinical and laboratory testing. J.W. and S.S. provided expertise for histomorphometrical analyses and data interpretation. N.N. coordinated the project. All authors approved the final version of the manuscript.
Declaration of interests
The authors declare no competing interests.
Published: September 9, 2021
Footnotes
Supplemental information can be found online at https://doi.org/10.1016/j.xcrm.2021.100395.
Supplemental information
Data and code availability
Mass spectrometry proteomics data have been deposited at ProteomeXchange Consortium: (http://proteomecentral.proteomexchange.org)1 via the PRIDE partner repository: PXD023979 and are publicly available as of the date of publication. Accession number is listed in the key resources table. Single cell RNA sequencing data as well as Alevin counts, integrated counts and a cell metadata Table have been deposited at NIH Gene Expression Omnibus (GEO): GSE153947 and are publicly available as of the date of publication. Accession number is listed in the key resources table.
All original code has been deposited at Zenodo (https://zenodo.org/record/5145449) and is publicly available as of the date of publication. DOIs are listed in the Key resources table.
Any additional information required to reanalyze the data reported in this paper is available from the lead contact upon request.
References
- 1.Vizcaíno J.A., Deutsch E.W., Wang R., Csordas A., Reisinger F., Ríos D., Dianes J.A., Sun Z., Farrah T., Bandeira N. ProteomeXchange provides globally coordinated proteomics data submission and dissemination. Nat. Biotechnol. 2014;32:223–226. doi: 10.1038/nbt.2839. [DOI] [PMC free article] [PubMed] [Google Scholar]
- 2.World Health Organization Infertility is a global public health issue. 2017. https://www.who.int/reproductivehealth/topics/infertility/perspective/en/
- 3.Tüttelmann F., Ruckert C., Röpke A. Disorders of spermatogenesis: Perspectives for novel genetic diagnostics after 20 years of unchanged routine. Med. Genetik. 2018;30:12–20. doi: 10.1007/s11825-018-0181-7. [DOI] [PMC free article] [PubMed] [Google Scholar]
- 4.Kasman A.M., Del Giudice F., Eisenberg M.L. New insights to guide patient care: the bidirectional relationship between male infertility and male health. Fertil. Steril. 2020;113:469–477. doi: 10.1016/j.fertnstert.2020.01.002. [DOI] [PubMed] [Google Scholar]
- 5.Nordhoff V., Fricke R.K., Schüring A.N., Zitzmann M., Kliesch S. Treatment strategies for severe oligoasthenoteratozoospermia (OAT) (<0.1 million/mL) patients. Andrology. 2015;3:856–863. doi: 10.1111/andr.12077. [DOI] [PubMed] [Google Scholar]
- 6.Clermont Y. The cycle of the seminiferous epithelium in man. Am. J. Anat. 1963;112:35–51. doi: 10.1002/aja.1001120103. [DOI] [PubMed] [Google Scholar]
- 7.Clermont Y. Renewal of spermatogonia in man. Am. J. Anat. 1966;118:509–524. doi: 10.1002/aja.1001180211. [DOI] [PubMed] [Google Scholar]
- 8.Ehmcke J., Wistuba J., Schlatt S. Spermatogonial stem cells: questions, models and perspectives. Hum. Reprod. Update. 2006;12:275–282. doi: 10.1093/humupd/dmk001. [DOI] [PubMed] [Google Scholar]
- 9.Guo J., Grow E.J., Mlcochova H., Maher G.J., Lindskog C., Nie X., Guo Y., Takei Y., Yun J., Cai L. The adult human testis transcriptional cell atlas. Cell Res. 2018;28:1141–1157. doi: 10.1038/s41422-018-0099-2. [DOI] [PMC free article] [PubMed] [Google Scholar]
- 10.Hermann B.P., Cheng K., Singh A., Roa-De La Cruz L., Mutoji K.N., Chen I.-C., Gildersleeve H., Lehle J.D., Mayo M., Westernströer B. The mammalian spermatogenesis single-cell transcriptome, from spermatogonial stem cells to spermatids. Cell Rep. 2018;25:1650–1667.e8. doi: 10.1016/j.celrep.2018.10.026. [DOI] [PMC free article] [PubMed] [Google Scholar]
- 11.Sohni A., Tan K., Song H.-W., Burow D., de Rooij D.G., Laurent L., Hsieh T.C., Rabah R., Hammoud S.S., Vicini E., Wilkinson M.F. The neonatal and adult human testis defined at the single-cell level. Cell Rep. 2019;26:1501–1517.e4. doi: 10.1016/j.celrep.2019.01.045. [DOI] [PMC free article] [PubMed] [Google Scholar]
- 12.Wang M., Liu X., Chang G., Chen Y., An G., Yan L., Gao S., Xu Y., Cui Y., Dong J. Single-cell RNA sequencing analysis reveals sequential cell fate transition during human spermatogenesis. Cell Stem Cell. 2018;23:599–614.e4. doi: 10.1016/j.stem.2018.08.007. [DOI] [PubMed] [Google Scholar]
- 13.Jan S.Z., Vormer T.L., Jongejan A., Röling M.D., Silber S.J., de Rooij D.G., Hamer G., Repping S., van Pelt A.M.M. Unraveling transcriptome dynamics in human spermatogenesis. Development. 2017;144:3659–3673. doi: 10.1242/dev.152413. [DOI] [PMC free article] [PubMed] [Google Scholar]
- 14.von Kopylow K., Staege H., Spiess A.-N., Schulze W., Will H., Primig M., Kirchhoff C. Differential marker protein expression specifies rarefaction zone-containing human Adark spermatogonia. Reproduction. 2012;143:45–57. doi: 10.1530/REP-11-0290. [DOI] [PubMed] [Google Scholar]
- 15.Shami A.N., Zheng X., Munyoki S.K., Ma Q., Manske G.L., Green C.D., Sukhwani M., Orwig K.E., Li J.Z., Hammoud S.S. Single-cell RNA sequencing of human, macaque, and mouse testes uncovers conserved and divergent features of mammalian spermatogenesis. Dev. Cell. 2020;54:529–547.e12. doi: 10.1016/j.devcel.2020.05.010. [DOI] [PMC free article] [PubMed] [Google Scholar]
- 16.Oud M.S., Volozonoka L., Smits R.M., Vissers L.E.L.M., Ramos L., Veltman J.A. A systematic review and standardized clinical validity assessment of male infertility genes. Hum. Reprod. 2019;34:932–941. doi: 10.1093/humrep/dez022. [DOI] [PMC free article] [PubMed] [Google Scholar]
- 17.Stuart T., Butler A., Hoffman P., Hafemeister C., Papalexi E., Mauck W.M., 3rd, Hao Y., Stoeckius M., Smibert P., Satija R. Comprehensive integration of single-cell data. Cell. 2019;177:1888–1902.e21. doi: 10.1016/j.cell.2019.05.031. [DOI] [PMC free article] [PubMed] [Google Scholar]
- 18.Efremova M., Vento-Tormo M., Teichmann S.A., Vento-Tormo R. CellPhoneDB: inferring cell-cell communication from combined expression of multi-subunit ligand-receptor complexes. Nat. Protoc. 2020;15:1484–1506. doi: 10.1038/s41596-020-0292-x. [DOI] [PubMed] [Google Scholar]
- 19.Aibar S., González-Blas C.B., Moerman T., Huynh-Thu V.A., Imrichova H., Hulselmans G., Rambow F., Marine J.C., Geurts P., Aerts J. SCENIC: single-cell regulatory network inference and clustering. Nat. Methods. 2017;14:1083–1086. doi: 10.1038/nmeth.4463. [DOI] [PMC free article] [PubMed] [Google Scholar]
- 20.La Manno G., Soldatov R., Zeisel A., Braun E., Hochgerner H., Petukhov V., Lidschreiber K., Kastriti M.E., Lönnerberg P., Furlan A. RNA velocity of single cells. Nature. 2018;560:494–498. doi: 10.1038/s41586-018-0414-6. [DOI] [PMC free article] [PubMed] [Google Scholar]
- 21.Van den Berge K., Roux de Bézieux H., Street K., Saelens W., Cannoodt R., Saeys Y., Dudoit S., Clement L. Trajectory-based differential expression analysis for single-cell sequencing data. Nat. Commun. 2020;11:1201. doi: 10.1038/s41467-020-14766-3. [DOI] [PMC free article] [PubMed] [Google Scholar]
- 22.von Kopylow K., Staege H., Schulze W., Will H., Kirchhoff C. Fibroblast growth factor receptor 3 is highly expressed in rarely dividing human type A spermatogonia. Histochem. Cell Biol. 2012;138:759–772. doi: 10.1007/s00418-012-0991-7. [DOI] [PubMed] [Google Scholar]
- 23.Di Persio S., Saracino R., Fera S., Muciaccia B., Esposito V., Boitani C., Berloco B.P., Nudo F., Spadetta G., Stefanini M. Spermatogonial kinetics in humans. Development. 2017;144:3430–3439. doi: 10.1242/dev.150284. [DOI] [PubMed] [Google Scholar]
- 24.Hogarth C.A., Mitchell D., Small C., Griswold M. EGR4 displays both a cell- and intracellular-specific localization pattern in the developing murine testis. Dev. Dyn. 2010;239:3106–3114. doi: 10.1002/dvdy.22442. [DOI] [PMC free article] [PubMed] [Google Scholar]
- 25.Sung S.R., Song S.H., Kang K.M., Park J.E., Nam Y.J., Shin Y.J., Cha D.H., Seo J.T., Yoon T.K., Shim S.H. Sequence variations of the EGR4 gene in Korean men with spermatogenesis impairment. BMC Med. Genet. 2017;18:47. doi: 10.1186/s12881-017-0408-5. [DOI] [PMC free article] [PubMed] [Google Scholar]
- 26.Hadziselimovic F., Hadziselimovic N.O., Demougin P., Krey G., Hoecht B., Oakeley E.J. EGR4 is a master gene responsible for fertility in cryptorchidism. Sex Dev. 2009;3:253–263. doi: 10.1159/000249147. [DOI] [PubMed] [Google Scholar]
- 27.Matsuo T., Dat T., Komatsu M., Yoshimaru T., Daizumoto K., Sone S., Nishioka Y., Katagiri T. Early growth response 4 is involved in cell proliferation of small cell lung cancer through transcriptional activation of its downstream genes. PLoS ONE. 2014;9:e113606. doi: 10.1371/journal.pone.0113606. [DOI] [PMC free article] [PubMed] [Google Scholar]
- 28.Murata K., Jadhav U., Madha S., van Es J., Dean J., Cavazza A., Wucherpfennig K., Michor F., Clevers H., Shivdasani R.A. Ascl2-dependent cell dedifferentiation drives regeneration of ablated intestinal stem cells. Cell Stem Cell. 2020;26:377–390.e6. doi: 10.1016/j.stem.2019.12.011. [DOI] [PMC free article] [PubMed] [Google Scholar]
- 29.Wang X., Choi J.-H., Ding J., Yang L., Ngoka L.C., Lee E.J., Zha Y., Mao L., Jin B., Ren M. HOXC9 directly regulates distinct sets of genes to coordinate diverse cellular processes during neuronal differentiation. BMC Genomics. 2013;14:830. doi: 10.1186/1471-2164-14-830. [DOI] [PMC free article] [PubMed] [Google Scholar]
- 30.Holleville N., Matéos S., Bontoux M., Bollerot K., Monsoro-Burq A.H. Dlx5 drives Runx2 expression and osteogenic differentiation in developing cranial suture mesenchyme. Dev. Biol. 2007;304:860–874. doi: 10.1016/j.ydbio.2007.01.003. [DOI] [PubMed] [Google Scholar]
- 31.van den Boom V., Kooistra S.M., Boesjes M., Geverts B., Houtsmuller A.B., Monzen K., Komuro I., Essers J., Drenth-Diephuis L.J., Eggen B.J. UTF1 is a chromatin-associated protein involved in ES cell differentiation. J. Cell Biol. 2007;178:913–924. doi: 10.1083/jcb.200702058. [DOI] [PMC free article] [PubMed] [Google Scholar]
- 32.Kooistra S.M., Thummer R.P., Eggen B.J.L. Characterization of human UTF1, a chromatin-associated protein with repressor activity expressed in pluripotent cells. Stem Cell Res. (Amst.) 2009;2:211–218. doi: 10.1016/j.scr.2009.02.001. [DOI] [PubMed] [Google Scholar]
- 33.Kooistra S.M., van den Boom V., Thummer R.P., Johannes F., Wardenaar R., Tesson B.M., Veenhoff L.M., Fusetti F., O’Neill L.P., Turner B.M. Undifferentiated embryonic cell transcription factor 1 regulates ESC chromatin organization and gene expression. Stem Cells. 2010;28:1703–1714. doi: 10.1002/stem.497. [DOI] [PubMed] [Google Scholar]
- 34.van Alphen M.M., van de Kant H.J., de Rooij D.G. Depletion of the spermatogonia from the seminiferous epithelium of the rhesus monkey after X irradiation. Radiat. Res. 1988;113:473–486. [PubMed] [Google Scholar]
- 35.Leitão E., Di Persio S., Laurentino S., Wöste M., Dugas M., Kliesch S., Neuhaus N., Horsthemke B. The sperm epigenome does not display recurrent epimutations in patients with severely impaired spermatogenesis. Clin. Epigenetics. 2020;12:61. doi: 10.1186/s13148-020-00854-0. [DOI] [PMC free article] [PubMed] [Google Scholar]
- 36.World Health Organization . 5th ed. World Health Organization; 2010. WHO Laboratory Manual for the Examination and Processing of Human Semen. [Google Scholar]
- 37.Kossack N., Terwort N., Wistuba J., Ehmcke J., Schlatt S., Schöler H., Kliesch S., Gromoll J. A combined approach facilitates the reliable detection of human spermatogonia in vitro. Hum. Reprod. 2013;28:3012–3025. doi: 10.1093/humrep/det336. [DOI] [PubMed] [Google Scholar]
- 38.Laurentino S., Heckmann L., Di Persio S., Li X., Meyer Zu Hörste G., Wistuba J., Cremers J.F., Gromoll J., Kliesch S., Schlatt S., Neuhaus N. High-resolution analysis of germ cells from men with sex chromosomal aneuploidies reveals normal transcriptome but impaired imprinting. Clin. Epigenetics. 2019;11:127. doi: 10.1186/s13148-019-0720-3. [DOI] [PMC free article] [PubMed] [Google Scholar]
- 39.Srivastava A., Malik L., Smith T., Sudbery I., Patro R. Alevin efficiently estimates accurate gene abundances from dscRNA-seq data. Genome Biol. 2019;20:65. doi: 10.1186/s13059-019-1670-y. [DOI] [PMC free article] [PubMed] [Google Scholar]
- 40.Patro R., Duggal G., Love M.I., Irizarry R.A., Kingsford C. Salmon provides fast and bias-aware quantification of transcript expression. Nat. Methods. 2017;14:417–419. doi: 10.1038/nmeth.4197. [DOI] [PMC free article] [PubMed] [Google Scholar]
- 41.Frankish A., Diekhans M., Ferreira A.-M., Johnson R., Jungreis I., Loveland J., Mudge J.M., Sisu C., Wright J., Armstrong J. GENCODE reference annotation for the human and mouse genomes. Nucleic Acids Res. 2019;47(D1):D766–D773. doi: 10.1093/nar/gky955. [DOI] [PMC free article] [PubMed] [Google Scholar]
- 42.Butler A., Hoffman P., Smibert P., Papalexi E., Satija R. Integrating single-cell transcriptomic data across different conditions, technologies, and species. Nat. Biotechnol. 2018;36:411–420. doi: 10.1038/nbt.4096. [DOI] [PMC free article] [PubMed] [Google Scholar]
- 43.Hafemeister C., Satija R. Normalization and variance stabilization of single-cell RNA-seq data using regularized negative binomial regression. Genome Biol. 2019;20:296. doi: 10.1186/s13059-019-1874-1. [DOI] [PMC free article] [PubMed] [Google Scholar]
- 44.Waltman L., van Eck N.J. A smart local moving algorithm for large-scale modularity-based community detection. Eur. Phys. J. B. 2013;86:471. [Google Scholar]
- 45.McInnes L., Healy J., Melville J. UMAP: uniform manifold approximation and projection for dimension reduction. arXiv. 2018 https://arxiv.org/abs/1802.03426 arXiv:1802.03426. [Google Scholar]
- 46.Finak G., McDavid A., Yajima M., Deng J., Gersuk V., Shalek A.K., Slichter C.K., Miller H.W., McElrath M.J., Prlic M. MAST: a flexible statistical framework for assessing transcriptional changes and characterizing heterogeneity in single-cell RNA sequencing data. Genome Biol. 2015;16:278. doi: 10.1186/s13059-015-0844-5. [DOI] [PMC free article] [PubMed] [Google Scholar]
- 47.Wolf F.A., Hamey F.K., Plass M., Solana J., Dahlin J.S., Göttgens B., Rajewsky N., Simon L., Theis F.J. PAGA: graph abstraction reconciles clustering with trajectory inference through a topology preserving map of single cells. Genome Biol. 2019;20:59. doi: 10.1186/s13059-019-1663-x. [DOI] [PMC free article] [PubMed] [Google Scholar]
- 48.Wolf F.A., Angerer P., Theis F.J. SCANPY: large-scale single-cell gene expression data analysis. Genome Biol. 2018;19:15. doi: 10.1186/s13059-017-1382-0. [DOI] [PMC free article] [PubMed] [Google Scholar]
- 49.Bergen V., Lange M., Peidli S., Wolf F.A., Theis F.J. Generalizing RNA velocity to transient cell states through dynamical modeling. Nat. Biotechnol. 2020;38:1408–1414. doi: 10.1038/s41587-020-0591-3. [DOI] [PubMed] [Google Scholar]
- 50.Moerman T., Aibar Santos S., Bravo González-Blas C., Simm J., Moreau Y., Aerts J. GRNBoost2 and Arboreto: efficient and scalable inference of gene regulatory networks. Kelso J, editor. Bioinformatics. 2019;35:2159–2161. doi: 10.1093/bioinformatics/bty916. [DOI] [PubMed] [Google Scholar]
- 51.Suo S., Zhu Q., Saadatpour A., Fei L., Guo G., Yuan G.-C. Revealing the critical regulators of cell identity in the mouse cell atlas. Cell Rep. 2018;25:1436–1445.e3. doi: 10.1016/j.celrep.2018.10.045. [DOI] [PMC free article] [PubMed] [Google Scholar]
- 52.Van den Berge K., Soneson C., Robinson M.D., Clement L. stageR: a general stage-wise method for controlling the gene-level false discovery rate in differential expression and differential transcript usage. Genome Biol. 2017;18:151. doi: 10.1186/s13059-017-1277-0. [DOI] [PMC free article] [PubMed] [Google Scholar]
- 53.Purdom E., Risso D. 2021. clusterExperiment: compare clusterings for single-cell sequencing. Version 2.4.4.http://bioconductor.org/packages/release/bioc/html/clusterExperiment.html [Google Scholar]
- 54.Cox J., Mann M. MaxQuant enables high peptide identification rates, individualized p.p.b.-range mass accuracies and proteome-wide protein quantification. Nat. Biotechnol. 2008;26:1367–1372. doi: 10.1038/nbt.1511. [DOI] [PubMed] [Google Scholar]
- 55.Tusher V.G., Tibshirani R., Chu G. Significance analysis of microarrays applied to the ionizing radiation response. Proc. Natl. Acad. Sci. U S A. 2001;98:5116–5121. doi: 10.1073/pnas.091062498. [DOI] [PMC free article] [PubMed] [Google Scholar]
- 56.Albert S., Wistuba J., Eildermann K., Ehmcke J., Schlatt S., Gromoll J., Kossack N. Comparative marker analysis after isolation and culture of testicular cells from the immature marmoset. Cells Tissues Organs. 2012;196:543–554. doi: 10.1159/000339010. [DOI] [PubMed] [Google Scholar]
- 57.Bergmann and Kliesch . In: Andrology. Nieschlag E., Behre H.M., Nieschlag S., editors. Springer; 2010. Testicular biopsy and histology; pp. 155–167. [Google Scholar]
- 58.Schindelin J., Arganda-Carreras I., Frise E., Kaynig V., Longair M., Pietzsch T., Preibisch S., Rueden C., Saalfeld S., Schmid B. Fiji: an open-source platform for biological-image analysis. Nat. Methods. 2012;9:676–682. doi: 10.1038/nmeth.2019. [DOI] [PMC free article] [PubMed] [Google Scholar]
- 59.Bankhead P., Loughrey M.B., Fernández J.A., Dombrowski Y., McArt D.G., Dunne P.D., McQuaid S., Gray R.T., Murray L.J., Coleman H.G. QuPath: open source software for digital pathology image analysis. Sci. Rep. 2017;7:16878. doi: 10.1038/s41598-017-17204-5. [DOI] [PMC free article] [PubMed] [Google Scholar]
Associated Data
This section collects any data citations, data availability statements, or supplementary materials included in this article.
Supplementary Materials
Data Availability Statement
Mass spectrometry proteomics data have been deposited at ProteomeXchange Consortium: (http://proteomecentral.proteomexchange.org)1 via the PRIDE partner repository: PXD023979 and are publicly available as of the date of publication. Accession number is listed in the key resources table. Single cell RNA sequencing data as well as Alevin counts, integrated counts and a cell metadata Table have been deposited at NIH Gene Expression Omnibus (GEO): GSE153947 and are publicly available as of the date of publication. Accession number is listed in the key resources table.
All original code has been deposited at Zenodo (https://zenodo.org/record/5145449) and is publicly available as of the date of publication. DOIs are listed in the Key resources table.
Any additional information required to reanalyze the data reported in this paper is available from the lead contact upon request.