Abstract
Introduction
Curcumin is a promising drug candidate, but its use for dermal application is limited due to its poor aqueous solubility. Thus, formulations that increase the solubility of curcumin are needed to fully exploit the therapeutic potential of curcumin. Various previous studies address this issue, but a comparison of the efficacy between these formulations remains difficult. The reason for this is a missing standard formulation as benchmark control and an easy-to-use skin penetration model that allows for a fast discrimination between different formulations.
Objective
Thus, the aims of this study were the development of a curcumin standard formulation and a screening tool that allows for a fast discrimination between the dermal penetration efficacies of curcumin from different formulations.
Methods
Ethanolic curcumin solutions were selected as simple and easy to produce standard formulations, and the ex vivo porcine ear model, coupled with epifluorescence microscopy and subsequent digital image analysis, was utilized to determine the dermal penetration efficacy of curcumin from the different formulations.
Results
Results show that the utilized skin penetration model is a suitable and versatile tool that enables not only a fast determination of the dermal penetration efficacy of curcumin from different formulations but also a detailed and mechanistic information on the fate of chemical compounds after dermal penetration. Ethanolic solutions containing 0.25% curcumin were found to be the most suitable standard formulation.
Conclusions
Results of the study provide a new, effective screening tool for the development of dermal formulations for improved dermal delivery of curcumin.
Keywords: Curcumin, Image analysis, Dermal penetration, Skin, Penetration profile
Introduction
Curcumin is a poorly water-soluble compound that is well known for its diverse pharmacological properties. Examples include antioxidative, antibacterial, antifungal, antitumour, or anti-inflammatory activities [1, 2]. Besides systemic administration, also the dermal application of curcumin can be very useful [3]. For example, it can be used for the treatment of acne, alopecia, atopic dermatitis, facial photoaging, oral lichen planus, pruritus, psoriasis, radiodermatitis, or vitiligo [4]. Recent studies could further demonstrate the positive effects of curcumin on the wound healing process, the management of wound restoration, and the scar treatment [5, 6, 7].
Unfortunately, the use of curcumin is limited due to its poor absorption, that is, poor bioavailability, which is caused by its low solubility in water [8]. Consequently, innovative formulations that can overcome its poor aqueous solubility are needed to exploit the full potential of curcumin. In this sense, many scientific studies addressed this issue, and many of those could already prove the beneficial effects of innovative drug delivery principles on the dermal penetration efficacy of curcumin [9, 10, 11, 12, 13, 14, 15, 16, 17, 18, 19, 20, 21, 22, 23, 24, 25, 26, 27, 28, 29]. However, a direct comparison of the results from the different studies and a reliable decision on which formulations are most promising in comparison with the others are not possible. Two main reasons are responsible for this. The first reason is a missing internal standard formulation for curcumin, and the second reason is that the dermal penetration efficacy is often determined with different models, methods, and/or measurement setups.
Conducting skin penetration experiments with the currently available methods (e.g., the tests based on the OECD guidelines or the classical tape stripping procedure) is tedious work and requires good skills and highly sensitive analytical equipment to obtain reliable and reproducible data [30, 31, 32, 33]. A comparison between data remains often complicated because many variables − for example, differences in the type of skin, skin thickness, skin integrity, sample preparation, skin preparation, type and amount of acceptor medium, and of course the penetration time − can lead to great variations in the results obtained [33, 34, 35, 36, 37, 38, 39]. In addition, results obtained from these studies, for example, from the classical tape stripping procedure, cannot always provide the full picture of the fate of the chemical substance after dermal application. This means, at present, a skin penetration model that allows for a simple but meaningful comparison of the dermal penetration efficacy of curcumin from different formulations is not yet available.
Therefore, to allow for a better comparison of the penetration efficacy between different curcumin formulations, the aim of this study was to develop a skin penetration model that would enable a fast discrimination between “good” and “bad” penetrating curcumin formulations, still enabling a detailed information on drug penetration and fate of curcumin after dermal application.
Theoretical Aspects for the Development of the Skin Penetration Model
A simple skin model should be easy to use and should not require extensive practical experience to perform such studies. In addition, the model should mimic physiological skin conditions, and thus any manipulation of the skin prior to the experiments should be avoided. Sample preparation and data analysis should be fast and − if possible − should not require any high-price analytical equipment.
Today, in many cases, dermal penetration is determined in vivo or in vitro [30, 31, 32, 40]. Following the 3R strategy, in vivo methods should be avoided whenever possible and thus are not appropriate to be used for early formulation development and optimization. In vitro models, for example, Franz-diffusion cells, are not easy to handle, and experiments require good skills and are tedious work (cf. the section above). Hence, the new model should overcome these disadvantages.
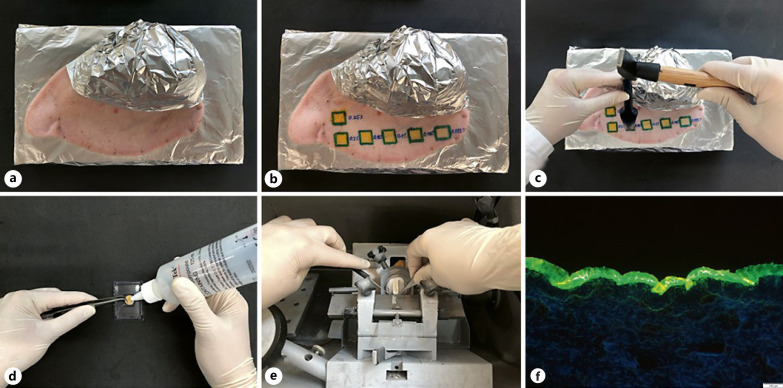
A possible model for this is the ex vivo pig ear model. It uses fresh pig ears on which the formulations are directly applied. Hence, the skin is not manipulated prior to the experiment, that is, cut, squeezed, or stretched, but remains in its original state throughout the whole experiment. The ex vivo pig ear model is typically used for the classical tape stripping procedure [31, 41, 42, 43, 44], but can also be used to evaluate the penetration depth into the stratum corneum by epifluorescence microscopy if the drug substance is fluorescent [26]. For this, punch biopsies of the treated skin areas are taken, cut into thin slices, and analysed via confocal laser scanning microscopy or simply by fluorescence microscopy (Fig. 1).
Fig. 1.
Scheme of the ex vivo skin permeation model. Fresh pig ear (a) with test formulations (b), skin biopsy (c), embedding of the skin biopsy (d), skin sectioning with cryomicrotome (e), and image of the skin section visualizing the fate of an autofluorescent chemical compound (model drug used: curcumin) after dermal application (f).
Curcumin possesses a strong autofluorescence and thus can be simply visualized by means of epifluorescence microscopy (Fig. 1f). However, any quantification of the penetration efficacy cannot be done by simple visual inspection of the images obtained. Hence, the present method would not allow for an objective comparison of the dermal penetration efficacy of curcumin from different formulations.
Of course, the problem that simple visual inspection of images cannot be used for a quantitative analysis of the data is not novel and also very prominent in other disciplines. Hence, the problem is well understood, and solutions to overcome this issue are already exploited in various other disciplines. One method to analyse images and to transfer the data from visual inspection into objective measurable results is the use of image analysis with ImageJ software [45, 46]. ImageJ software enables processing of images and image analysis for various disciplines, for example, in biology, medicine, or biochemistry [47, 48, 49, 50, 51, 52, 53, 54, 55, 56]. The extensive use of the ImageJ tool for image analysis in other disciplines and the broad spectrum of analysis tools being available in ImageJ software encouraged us to investigate if the software tool can also be used to evaluate the dermal penetration efficacy of curcumin.
Theoretical Aspects for a Curcumin Standard Formulation
A skin model investigating the penetration efficacy of curcumin should include the use of an internal standard. The internal curcumin standard should be easy to prepare and should give reproducible dermal penetration results. Ideally, a positive and a negative control standard should be available, that is, curcumin standards mimicking “good” and “bad” dermal penetration, respectively. Hence, curcumin formulations leading to “good” and “bad” dermal penetration need to be identified for this.
Dermal penetration can be described by using Fick's first law of diffusion (formula 1). In this formula, dQ/dt, which is also referred to the flux, is the amount of a chemical substance penetrating out of the vehicle over time; D is the diffusion coefficient of the chemical molecule in the stratum corneum; Vk is the partition coefficient; A is the area of the skin on which the formulation was applied; d is the thickness of the stratum corneum; and cv is the concentration of the dissolved chemical substance in the vehicle, respectively:

Based on this law, the concentration gradient, that is, cv, which is the amount of dissolved active in the formulation, can be defined to be one of the most driving parameters to yield sufficient flux values, that is, good penetration into the skin. As curcumin is poorly soluble in water, but soluble in ethanol, good penetration of curcumin can be expected when using ethanolic solutions of curcumin for dermal drug delivery of curcumin. Ethanolic solutions are simple to prepare and thus represent a good formulation approach that could be used as internal standard.
Based on Fick's law, it can be expected that the amount of penetrated curcumin increases with an increasing concentration of dissolved curcumin. Hence, good penetration can be expected especially from ethanolic solutions that contain high amounts of dissolved curcumin, whereas lower concentrations are expected to lead to poor penetration (total amount penetrated and depth of penetration).
A very recent study investigated the dermal curcumin delivery in vitro for different nanoemulsions and used an ethanolic curcumin solution with 0.5% (w/w) curcumin as reference, which was shown to enable good transdermal penetration of curcumin already after 3 h of penetration [57]. Other studies that systematically investigate the penetration efficacy of curcumin from ethanolic solutions and the effect of the concentration of dissolved curcumin are not available. Consequently, this study also aimed at investigating the dermal penetration efficacy and the influence of the concentration of dissolved curcumin from ethanolic solutions to allow for the selection of appropriate curcumin standards that mimic “bad” and “good” penetrating formulations, respectively.
Materials and Methods
Materials
Curcumin was obtained from Receptura Apotheke (Cornelius-Apothekenbetriebs-OHG, Frankfurt, Germany). Ethanol 99.8% v/v (HPLC grade) was obtained from Fischer Scientific GmbH (Schwerte, Germany).
Methods
Preparation of the Ethanolic Curcumin Solutions
The solubility of curcumin is 10 mg/mL, corresponding to about 1% (m/v). Higher amounts of curcumin cannot be dissolved in ethanol, and some studies even report lower solubility values [58], which was also confirmed by our data (Fig. 2). In this study, solutions containing either 0.025, 0.05, 0.1, 0.15, 0.2, or 0.25% curcumin (m/v) were prepared. Higher concentrations were not prepared because ethanol is highly volatile, and large amounts of the solvent can quickly evaporate upon dermal application. The reduced volume of solvent can lead to an increased concentration of curcumin and might create an oversaturated system, which could then easily lead to re-crystallization of curcumin and the formation of large, undissolved curcumin crystals on the skin. This would lead to a reduced amount of dissolved curcumin molecules and thus − based on Fick's law (cf. formula 1) − to a reduced flux of curcumin into the skin. To minimize this effect, curcumin concentrations below the saturation solubility of curcumin in ethanol were selected. The different ethanolic curcumin solutions were prepared by producing a stock solution containing 2.5 mg/mL curcumin. The stock solution was diluted accordingly to obtain the required test solutions. Solutions were freshly prepared and immediately used for the skin penetration experiments.
Fig. 2.
Ethanolic solutions of curcumin with different concentrations of curcumin. The solubility of 1% curcumin in ethanol − often cited in the literature − could not be obtained in this study. Reason for this might be the use of curcumin with a purity of only 80.87% in this study, which decreased the solubility to <0.5%.
Dermal Penetration of Curcumin
Dermal penetration of curcumin was assessed on the ex vivo pig ear model [59]. Briefly, fresh porcine ears were obtained from a local slaughterhouse and cleaned with lukewarm water (23–25°C). The washed ears were dried with a soft tissue, and the formulations were applied without massage on the dorsal site of the ear. The application area was 1.5 × 1.5 cm2, the amount applicated was 25 μL, and the penetration time was 4 h. During the penetration, ears were kept at a temperature of 32°C to simulate external skin conditions. After the penetration time, non-penetrated formulation was carefully removed from the ear with a soft tissue. Afterwards, skin punch biopsies (Ø 15 mm) were taken, embedded with liquid embedding compound (Tissue-Tek® O.C.T.TM; Sakura Finetek Europe B.V., Netherlands), and frozen until further use. All formulations were tested on 3 different ears and 3 different, independent skin areas, respectively.
Visualization of Dermal Penetration
Dermal penetration of curcumin was visualized via epifluorescence microscopy. For this, 20-μm thick sections of the frozen skin biopsies were prepared using a cryomicrotome (Frigocut-2700; Reichert-Jung, Wetzlar, Germany). The slices were subsequently analysed using the inverted epifluorescence microscope Olympus CKX53 (Olympus Deutschland GmbH, Hamburg, Germany) equipped with an Olympus DP22 colour camera (Olympus Deutschland GmbH, Hamburg, Germany). The samples were analysed using the DAPI HC filter block system (excitation filter: 340–390 nm, dichroic mirror: 410 nm, and emission filter: 420 nm [LP]). All images were taken in the dark room under identical light conditions. The intensity of the fluorescence light source (130 W U-HGLGPS illumination system; Olympus Deutschland GmbH, Hamburg, Germany) was chosen to be 50% for all samples analysed. The fluorescence images were taken at 200-fold magnification with the software Olympus cellSens Entry (Olympus Deutschland GmbH, Hamburg, Germany). The exposure time was 50 ms.
Image Analysis for Semi-Quantitative Evaluation of Penetration Efficacy
Images obtained from epifluorescence microscopy were analysed with ImageJ software [45, 46]. The software was used to analyse the penetration depth of curcumin and to evaluate the total amount of curcumin that was able to penetrate into the skin.
Autoscaling
Prior to analysis, all images were scaled by using the scale function of the software. This was done to synchronize the scale bar from microscopy to a specific number of pixels. The scale was set to 2.84 pixels/µm for the images with 200-fold magnification.
Determination of Penetration Depth
The penetration depth was determined manually by analysing the maximal penetration depth of curcumin from each image. For this, a line, corresponding to the maximum penetration depth of the respective biopsy or skin section, was manually placed in each image, and the length of the line was then automatically analysed by the software.
Determination of the Total Amount of Penetrated Curcumin
The fluorescence intensity, this means the detected light intensity, is a measure for the total amount of curcumin penetrated into the skin. High intensities represent high amounts of penetrated curcumin and vice versa. In ImageJ analysis, the light intensity is expressed in grey values (GV), that is, high GV represent a high light intensity and low values correspond to low light intensity. The grey scale in ImageJ software varies from 0 to 255. Higher or lower values cannot be obtained. This means, when analysing an image with the ImageJ software, a GV ranging from 0 to 255 is assigned to each pixel within the selected area. From all the GV that were analysed within an image or image section, the mean grey value (MGV) can be obtained. Hence, the MGV is the GV average from all pixels in an image or image section, giving an estimate of the total intensity of detected light within the image or image section. Consequently, in our study, the MGV were used as a measure to estimate the total amount of penetrated curcumin into the skin.
Statistical Analysis
From each formulation, 3 samples (biopsies) were obtained, and from each of these biopsies, 60 skin sections were prepared. Thus, covering all treated skin areas. By analysis of the prepared sections via the epifluorescence microscopy, about 30 representative pictures were taken for each biopsy, leading to at least 90 images for each formulation that were subsequently processed via digital image analysis. Descriptive statistics and the comparison of the mean values were performed with JASP software (version 0.13.1) [60]. Normal distribution was determined with the Shapiro-Wilk test, and variance homogeneity was tested with the Levene's test. The mean values of normally distributed data were compared by a one-way ANOVA, and Welch adoption was applied in case of variance heterogeneity. Tukey and Games-Howell post hoc tests were performed to compare the mean values between each other. The non-parametric data were subjected to the Kruskal-Wallis analysis of variance with Dunn's post hoc tests [61]. Bonferroni-Holm adjustment was applied to avoid alpha error accumulation. p values <0.05 were considered statistically significant.
Results and Discussion
The dermal penetration efficacy of curcumin from ethanolic solutions was determined.
Analysis of Original Images
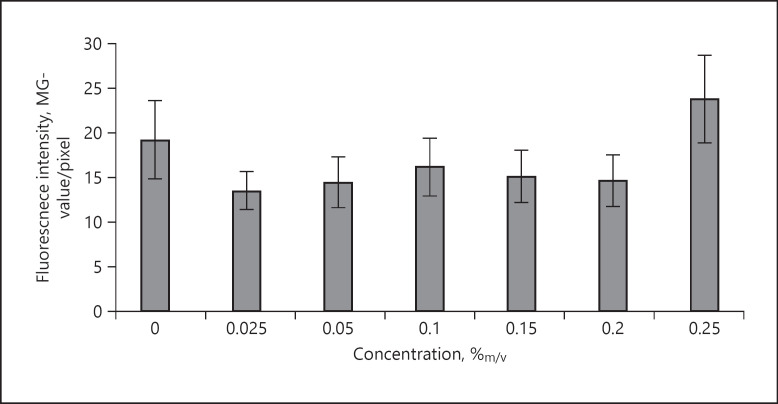
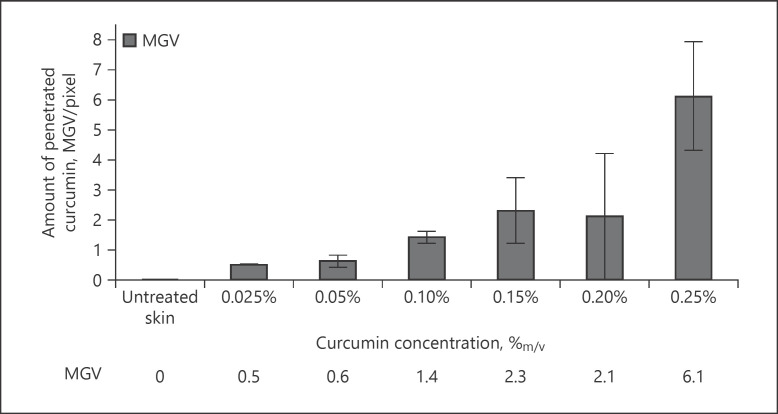
Images obtained from the epifluorescence microscopy indicated − as expected − an increasing fluorescence intensity with an increasing concentration of curcumin (Fig. 3). However, by analysing the data with the ImageJ software, the trend could not be verified (Fig. 4). Instead, no correlation between the concentration of curcumin applied on the skin and the resulting fluorescence intensity (expressed as MGV) was observed. Hence, image analysis of the original images could not be used to evaluate the differences in the dermal penetration efficacy of curcumin from the different ethanolic solutions.
Fig. 3.
Visualization of dermal penetration efficacy of curcumin from ethanolic solutions with different concentrations of dissolved curcumin (0.025–0.25%m/v) by epifluorescence microscopy (magnification, ×200).
Fig. 4.
Influence of concentration on penetration efficacy of curcumin into the skin − determination of fluorescence intensity (MGV/pixel) from original fluorescence images. MGV, mean grey values.
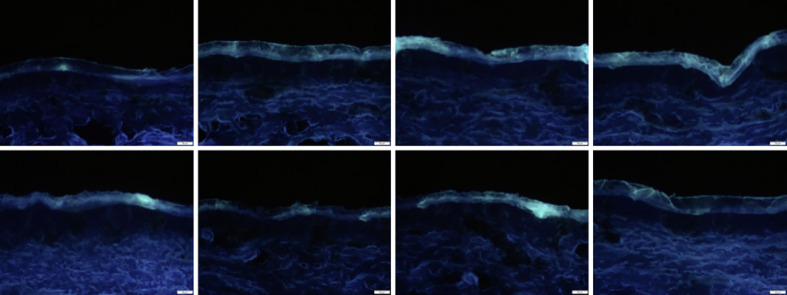
The reason for this was attributed to the relatively high autofluorescence of the untreated skin, which was not only high, but also highly variable (Fig. 5). Hence, in order to allow for a semi-quantitative analysis of the amount of penetrated curcumin, it was necessary to define a threshold method that could be used prior to image analysis to reduce the autofluorescence of the skin to a minimum.
Fig. 5.
Images of non-treated skin obtained from epifluorescence microscopy (magnification, ×200).
Thresholding is an algorithm that can be used to split the original image into 2 classes of pixels. In this study, class I pixel would be the pixels being related to the penetrated curcumin (foreground), and class II pixel would be the pixels being related to the autofluorescence of the skin (background). After image splitting, only class I pixels would be kept for further analysis. Because only these are the pixels of interest, as they represent the amount of penetrated active. In contrast, the background pixels, that is, the pixels being caused by the autofluorescence from the skin, will be discarded.
Determination of Threshold Algorithm
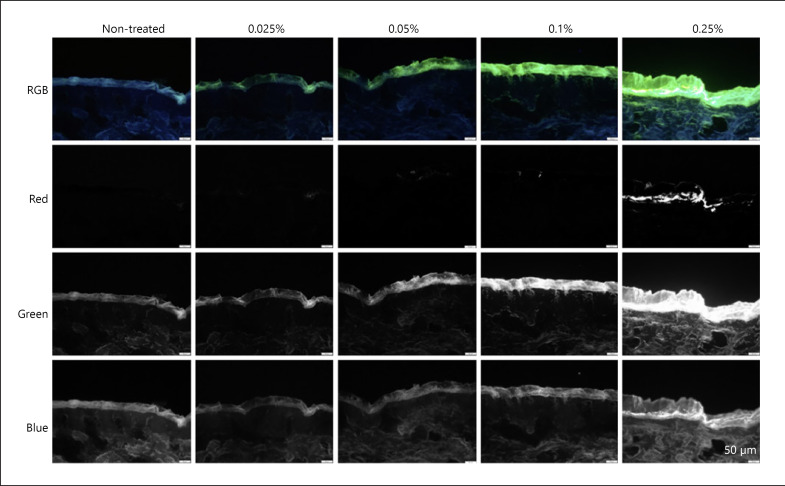
In a first attempt, the images of the skin were analysed for their respective red, green, and blue image components. Hence, based on the RGB colour model, images were split into separate images, each only containing one of the 3 RGB colours, that is, the red, green, or blue component, respectively (Fig. 6). The colour split algorithm revealed that the autofluorescence of the skin is mainly attributed to green and blue components and only very small amounts are contributed from the red channel (Fig. 6, left). In contrast, curcumin was found to contribute from all RGB channels (Fig. 6, right).
Fig. 6.
Images obtained from the colour split of the original RGB images.
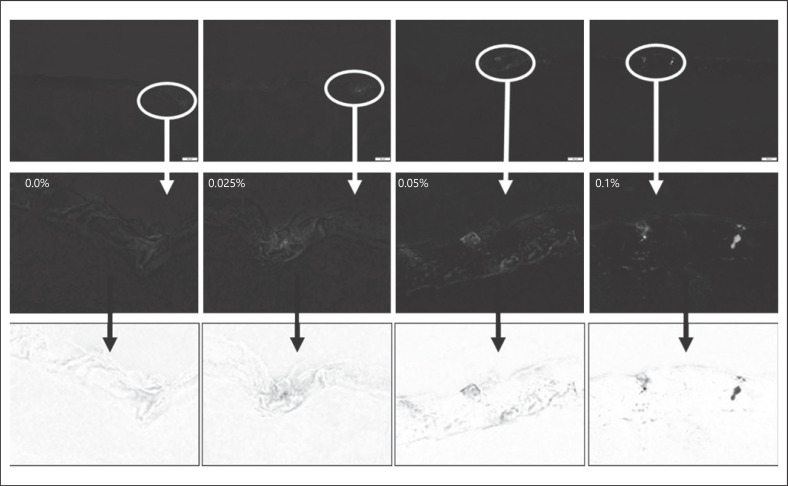
The pixels related to curcumin in the red channel were small for small concentrations, probably because only very small amounts of curcumin were able to penetrate the skin. Hence, bright spots, representing penetrated curcumin, were almost not visible in the images shown in Figure 6. However, they became more visible by digital zooming of the images and by converting the black and white images into white and black images, respectively (Fig. 7). However, digital zooming and black/white inversion also revealed that a simple colour split could not yet fully eliminate the autofluorescence of the skin. Hence, also in the red channel, some minor signals were visible for the untreated skin (Fig. 7, left).
Fig. 7.
Red component images obtained from the original images after colour splitting. Upper: original image; middle: after digital zooming (white circles represent the enlarged area); lower: inverted black/white images to visualize the detected light intensities and the differences between the different images.
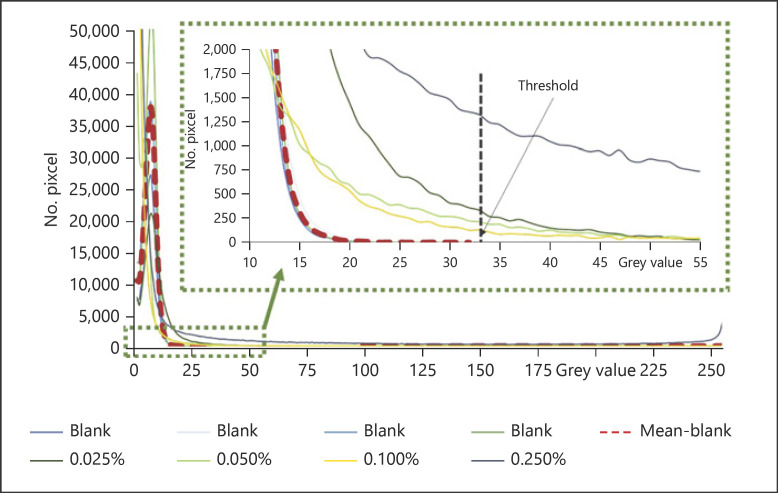
Therefore, to further quench the autofluorescence of the skin, the amount of light intensity of skin in the red component was determined and compared to the intensity derived from curcumin. For this, GV histograms of the red channel split images were created (Fig. 8). The histograms revealed that all images possessed MGV < 10. However, the width of the histograms was different. Curcumin-treated biopsies revealed broad histograms and led to maximum GV between 100 and 255. In contrast, most non-treated skin biopsies did not exceed maximum GV > 33 (Fig. 8). Only some untreated skin biopsies yielded larger values, which were caused by some bright spots on the top of the stratum corneum. These bright spots on top of the skin can be attributed to dirt, sebum, or bacteria, which can also possess high autofluorescence [62]. Remaining dirt, sebum, and bacteria can be discarded by an optimized cleaning procedure and thus were not considered for the setting of the threshold for clean skin.
Fig. 8.
Histograms of GV from the red component images obtained from biopsies of untreated (blank) skin and from biopsies treated with different concentrations of curcumin. Clean skin possesses maximum GV of ≤33, meaning that greater values that are obtained in image analysis can be attributed to curcumin. Based on the results, the threshold of the red-MGV was set to 33. GV, grey values; MGV, mean grey values.
Based on the analysis of the histograms, the red component (red-MGV) contributing to the autofluorescence of clean skin was defined to include all red-MGV ≤ 33. Accordingly, all red-MGV ≤ 33 were defined to belong to class II pixels, and only red-MGV > 33 were used as class I pixels for further analysis. Any pixels from the green and blue RGB components were also not included. Subsequently, the defined threshold algorithm (R > 33, G = 0, and B = 0) was programmed as ImageJ-macro (see online suppl. material 1; for all online suppl. material, see www.karger.com/doi/10.1159/000514498) and was subsequently applied for all images analysed in this study (for images obtained − cf. online suppl. material 2).
Analysis of Thresholded Images
Visual Inspection
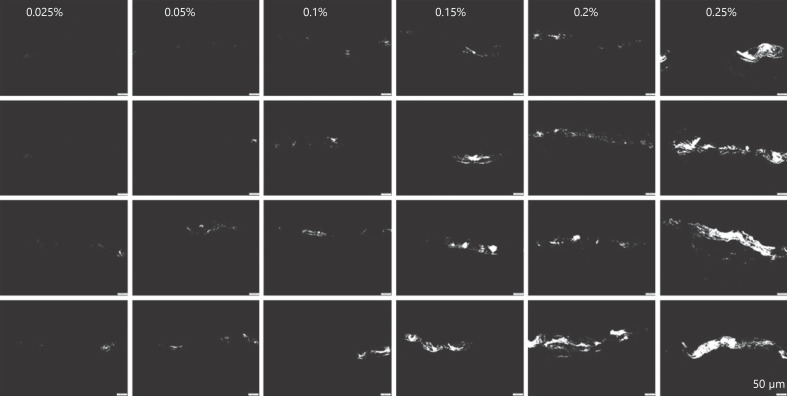
The trend of increasing fluorescence intensity with increasing concentration of curcumin was even more pronounced after the images were thresholded to minimize the influence of the autofluorescence for the skin (Fig. 9 − lower). Moreover, despite the increasing fluorescence intensity with increasing concentration, it could now be observed that the samples that were treated with lower concentrations of curcumin showed high variations in regard to drug distribution within the skin (Fig. 9, 10). Hence, skin biopsies treated with low concentrations of curcumin possessed many blank skin areas, that is, areas without any curcumin. The variability seemed to be concentration dependent and seemed to decrease with increasing drug concentration. Hence, with increasing curcumin concentrations, the number of blank skin areas decreased. The penetration depth was also affected by the concentration of dissolved curcumin and increased − as expected by Fick's law − with increasing amounts of dissolved curcumin. Lower concentrations led to a penetration of curcumin into the SC, concentrations ≥0.15% led to a penetration of the curcumin into the lower epidermis, and only the formulation containing 0.25% curcumin enabled some transdermal penetration of the curcumin (Fig. 9, 10).
Fig. 9.
Visualization of dermal penetration efficacy of curcumin from ethanolic solutions with different concentrations of dissolved curcumin (0.025–0.25%m/v) by epifluorescence microscopy (magnification, ×200). Upper: original images; lower: thresholded images (R > 33, G = 0, and B = 0).
Fig. 10.
Representative images (magnification, ×200) of the thresholded images (R > 33, G = 0, and B = 0) obtained from skin biopsies treated with different ethanolic curcumin solutions (0.025–0.25%m/v). Samples were found to possess strong inter- and intraindividual variations regarding drug distribution within the skin. To visualize this, for each curcumin concentration, 4 images were selected. Two samples represent the average of observed penetration profiles (middle), one represents the poorest penetration profiles (upper), and one represents penetration profiles with the best penetration for each concentration tested.
Image Analysis
Image analysis was used to transfer the results obtained from visual inspection of the images into objective measures. For this, the MGV of the thresholded images were used as a measure for the total amount of penetrated curcumin. In addition, the penetration depth was evaluated. Results obtained could prove the observations from visual inspection, that is, an increasing amount of penetrated curcumin and an increase in penetration depth with increasing concentration of dissolved curcumin in the ethanolic solutions (Fig. 11, 12). Both trends followed a linear progression with Pearson coefficients of about 0.9 (±0.1). Thus, confirming the validity of Fick's law to predict the dermal penetration efficacy of chemicals. However, no statistical differences in MGV and penetration depth were found between the biopsies treated with 0.025 and 0.05% curcumin and between the biopsies treated with 0.15 and 0.2% curcumin. Also, the penetration depth of the sample treated with 0.1% curcumin was not significantly different to the samples treated with 0.15 or 0.2% curcumin, respectively.
Fig. 11.
Influence of concentration of dissolved curcumin on dermal penetration efficacy of curcumin from ethanolic solutions − analysis of MGV as a surrogate for the total amount of penetrated curcumin. MGV, mean grey values.
Fig. 12.
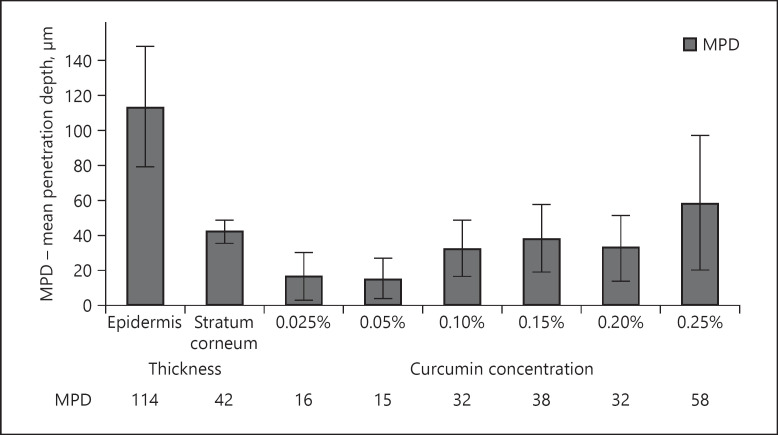
Influence of concentration of dissolved curcumin on dermal penetration efficacy of curcumin from ethanolic solutions − analysis of MPD. In addition to the penetration depth of curcumin, the thickness of the stratum corneum and the epidermis was analysed. In this way, the localization of curcumin in the skin can be estimated. MPD, mean penetration depth.
Based on the results obtained, the different curcumin formulations tested can be divided into 3 groups. Group 1 (curcumin concentrations 0.025 and 0.05%) led to poor penetration of curcumin. This was reflected by low MGV and low penetration depths which only corresponded to about 33% of the thickness of the stratum corneum. Group 2 (curcumin concentrations from 0.1 to 0.2%) led to about 3-fold higher MGV and hence to good penetration of curcumin. In contrast to group 1, group 2 formulations were able to penetrate the whole stratum corneum (cf. Fig. 12). Group 3 (represented by the formulation containing 0.25% curcumin) led to about 10-fold higher MGV when compared to group 1 and to about 3-fold higher MGV, when compared to the group 2 formulations. The penetration depth was about 4 times higher than for the group 1 formulations and about 2-fold higher than for the group 2 formulations. The mean penetration depth (MPD) for the group 3 formulation was 58 μm which is significantly greater than the thickness of the stratum corneum, which was determined to possess a thickness of about 42 μm (Fig. 12). This means the group 3 formulation was able to penetrate through the stratum corneum and could reach the deeper layers of the epidermis. However, the MPD of the group 3 formulation was still lower than the thickness of the whole epidermis (approx. 114 µm), indicating that also group 3 formulations were not able to enable transdermal penetration of curcumin into deeper layers of the viable dermis (cf. Fig. 12). Nonetheless, in comparison with groups 1 and 2, group 3 formulations were defined to lead to a very good dermal penetration of curcumin.
Determination of Variability and Inhomogeneity in Dermal Penetration
The MPD value obtained from image analysis for the group 3 formulation indicated that transdermal penetration could not be achieved. However, this finding was opposite to the findings from the visual inspection of the images (cf. the section Visual Inspection). A possible reason for these mismatching results might be the fact that for visual inspection, representative images were selected, which means images that represented not only the average penetration profiles but also to the poorest and the best penetration profiles for each formulation, respectively. In contrast, image analysis only represents the average of all images analysed. Hence, the high variations that were observed from visual inspection were not represented by the data obtained from image analysis by a sole analysis of the MGV. However, inhomogeneity and variations in skin penetration are of high importance because only if a homogeneous penetration into the skin is obtained, a reliable and reproducible drug penetration and/or permeation can be assured. Therefore, it was interesting to define a method that would allow to estimate the different degrees of variation and inhomogeneity in skin penetration from the different samples.
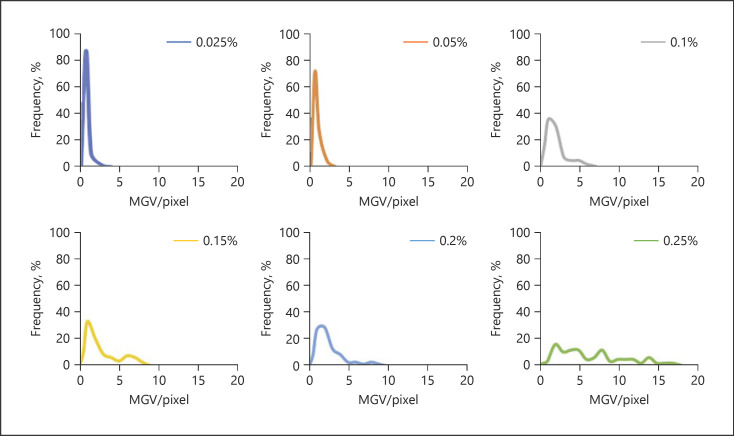
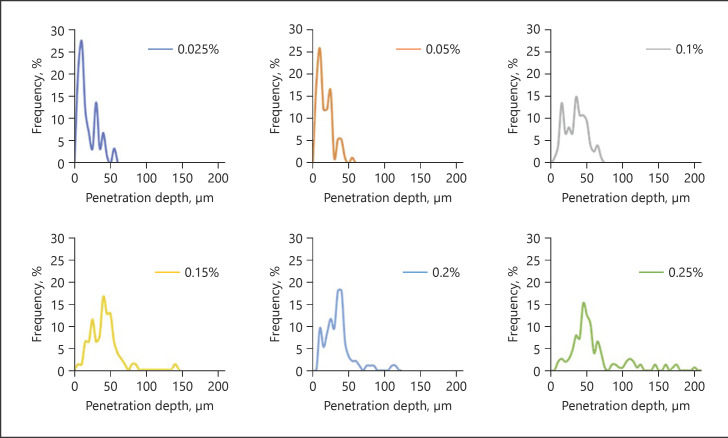
As a first approach, histograms, which mean diagrams plotting the frequency of the measured MGVs and penetration depths from each respective sample, were created for each concentration of curcumin (Fig. 13, 14). Different histograms were obtained for the different biopsies treated with different amounts of curcumin. Histograms for group 1 formulations were narrow, and the peak maxima were high and represented small MGV and penetration depths, respectively.
Fig. 13.
Histograms of MGV representing the variations of the total amount of curcumin that was able to penetrate the skin. The histograms indicate that an increase in curcumin concentration leads to a broadening of the distribution curves and a constant shift of the MGV. MGV, mean grey value.
Fig. 14.
Histograms of MPD, representing the variations in penetration depth. The histograms indicate that an increase in curcumin concentration leads to a broadening of the distribution curves and a constant shift of the penetration depth. MPD, mean penetration depth.
Group 2 formulations showed broader distributions and lower peak maxima and represented higher MGV and penetration depths, respectively. The broadening of the histogram, the decrease in peak maximum, and the increase in MGV and penetration depth were even more pronounced for the group 3 formulation.
The histograms could confirm the variations in skin penetration that were already seen from visual inspection. However, they were also able to provide a much deeper and more mechanistic understanding of the influence of the curcumin concentration on the dermal penetration efficacy of curcumin. For example, it can be seen from the histograms that low concentrations of curcumin lead to many skin biopsies without any curcumin (blank areas). Treating the skin with increasing concentrations of curcumin gradually reduces the number (frequency) of these blank areas and increases the number of biopsies with curcumin. Hence, skin penetration becomes more homogeneous and thus more reproducible with higher amounts of dissolved molecules within the vehicle. Moreover, the constant broadening of the histograms, the decrease in peak maximum, and the constant shift of the peak to higher values nicely visualize that an increasing concentration of curcumin is not causing an abrupt increase in the penetration depth and in the total amount of penetrated active. Instead, it shows that there are not only 2 but 3 different parameters that can influence the dermal penetration efficacy of chemical substances. One parameter is of course the total amount of penetrated active, and the second parameter is of course the respective penetration depth yielded.
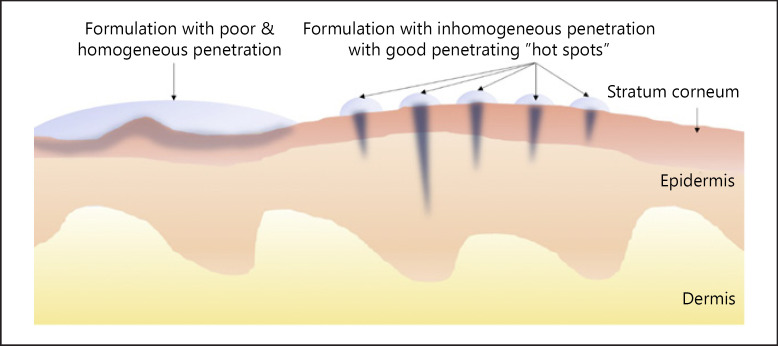
However, the histograms revealed a third aspect, and this is that also the number of skin areas that take up curcumin and the number of biopsies or skin areas without uptake contribute to the all over penetration efficacy of a chemical substance. Hence, it can be assumed that formulations that will lead to similar results regarding the total amount of penetrated active might possess differently distributed penetration patterns, that is, histograms. One example could be a formulation that leads to homogeneous but poor penetration (Fig. 15, left) and another that leads to very inhomogeneous penetration into the skin but creates “bright spots” on the skin that possess very high skin penetration (Fig. 15, right).
Fig. 15.
Scheme of possible penetration profiles of a chemical compound from different dermal formulations leading to similar amounts of total amounts of penetrated active. Left: poor and homogeneous penetration; right: inhomogeneous penetration with “hot spots” that cause high concentrations on some areas of the skin and leave other skin areas non-treated.
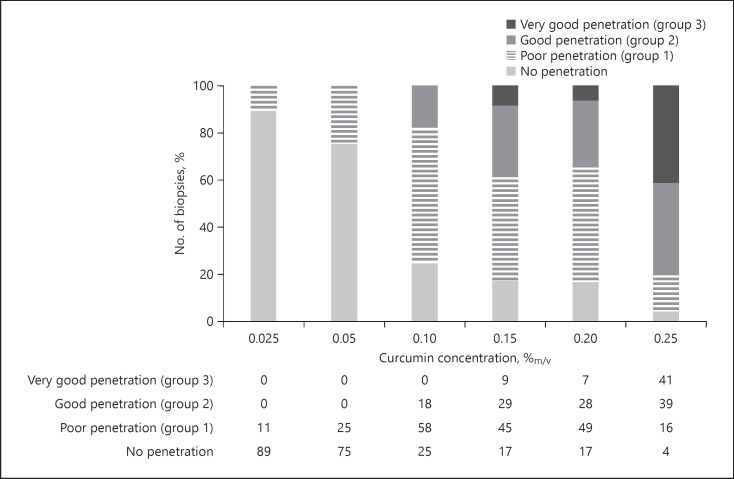
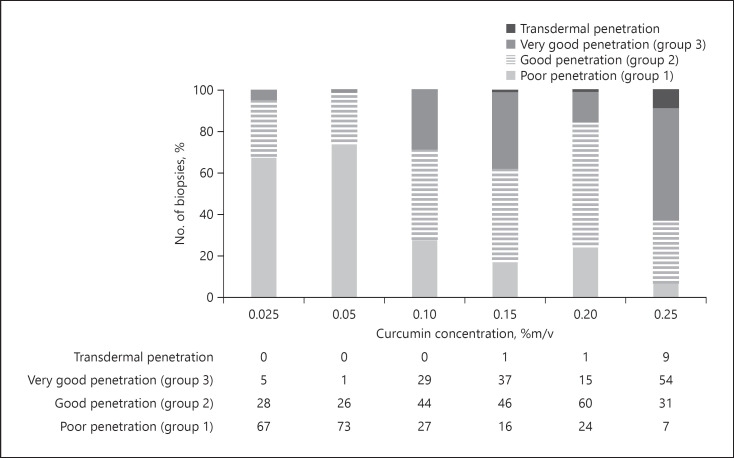
As a reliable and reproducible drug penetration and/or permeation is the base for the development of functionable, effective, and safe dermal drug products, a measure to express the variability in skin penetration might be useful. Therefore, to yield an estimate of the variability of the skin penetration from the different curcumin concentrations, data from the histograms were clustered and divided into 4 groups. Group 1 represented MGV ≤0.61, representing the MGV obtained for the group 1 formulations that represent poor penetration. Accordingly, groups 2 and 3 values were set to be 2 and 6.1, representing good and very good penetration, respectively (cf. Fig. 11). The fourth group represented all blank skin areas, which means biopsies with MGV corresponding to blank, non-treated skin (Fig. 16). In a similar manner, clustered diagrams were also established for the penetration depth (Fig. 17).
Fig. 16.
Stacked column charts for MGV to visualize the no. of biopsies belonging to the group 1, 2, or 3, that is, poor, good, or very good penetration, respectively. MGV, mean grey values.
Fig. 17.
Stacked column charts for MPD to visualize the no. of biopsies belonging to the group 1, 2, or 3, that is, poor, good, or very good penetration, respectively. MPD, mean penetration depth.
Results show that almost 90% of the skin biopsies treated with 0.025% curcumin did not show any uptake of curcumin. The number of blank skin areas (“dark spots”) decreased with increasing concentrations of curcumin and was still 4% for the skin treated with 0.25% curcumin. Group 1 biopsies, representing poor penetration of curcumin, were not only present in the skin biopsies treated with 0.025 and 0.05% curcumin but were also found in biopsies treated with higher amounts of curcumin. The number of biopsies with poor penetration was about 50% for the skin samples treated with 0.1–0.2% curcumin solutions and was 16% for the skin treated with 0.25% curcumin. Good and very good penetration was not found for biopsies treated with low concentrations of curcumin, and higher concentrations resulted in a constant increase in the number of biopsies possessing good or very good penetration. For example, a good penetration of curcumin was found for only 18% of the skin biopsies when the skin was treated with a 0.1% curcumin solution. Treating the skin with 0.15 or 0.2% curcumin doubled the number of biopsies with good and very good penetration, and a treatment with a 0.25% curcumin solution increased the number of biopsies with good and very good penetration to even 80% (Fig. 16).
Similar trends could also be observed for the penetration depth (Fig. 17). Moreover, by defining an additional class, representing all biopsies with a penetration depth >114 μm (value corresponds to the average of the thickness of the epidermis, cf. Fig. 12), it was possible to estimate the number of biopsies possessing transdermal penetration of curcumin. No transdermal penetration was observed for the skin treated with 0.025, 0.05, and 0.1% curcumin. Biopsies treated with 0.15 or 0.2% curcumin revealed transdermal penetration in 1% of the cases, and almost 10% of all biopsies treated with 0.25% were found to show transdermal penetration of the curcumin (Fig. 17).
The data obtained from the clustered and stacked column charts are well in agreement with the visual inspection from the images, which already revealed a transdermal penetration of curcumin for some of the biopsies treated with 0.25% curcumin. However, by analysing the clustered histograms, it became obvious that already lower curcumin concentrations enabled transdermal delivery of curcumin. In addition, with the use of the histograms, it was possible to characterize the penetration profiles and the differences in the penetration profiles between the different formulations accurately, not only in regard to penetration depth and the total amount of penetrated active, but also in regard to penetration variability.
Based on the results from this study, it can be concluded that classification of the penetration parameters and the assessment of the penetration variability are sensitive measures to evaluate the homogeneity of drug penetration. In this study, it enabled a more detailed and mechanistic understanding of the penetration process of curcumin from ethanolic solutions. Of course, the variability in dermal penetration is not analysed so far, but might be a useful parameter for future studies that can be used to quickly discriminate between “good” and “bad” samples, which means between samples that lead to homogeneous or inhomogeneous dermal penetration, respectively.
Besides histograms that represent the variations in penetration efficacy between the different replicates (biopsies), that is, the inter-individual variations, it would also be interesting to have an estimate of the variations within a single biopsy, that is, the intra-individual variations. This value could be of interest because it would exclude all inter-individual variations, for example, biological variations of the skin from different ears, and thus could directly measure if a formulation leads to homogeneous or inhomogeneous penetration of the active.
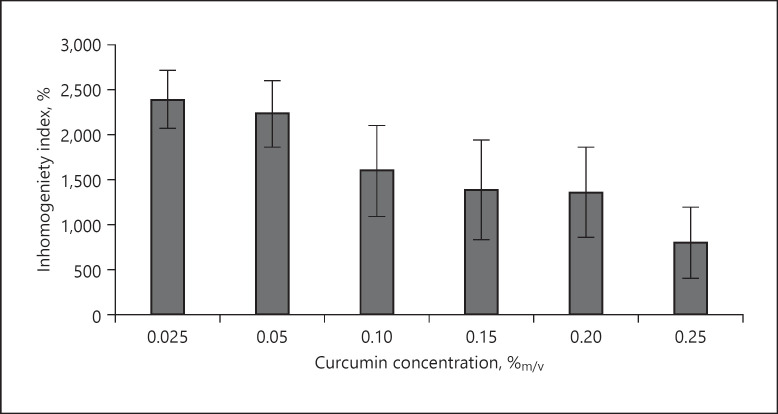
Therefore, to allow for an estimation of the intra-individual variation in dermal penetration, the coefficient of variation (CV) was calculated from the standard deviations of the MGV and the respective MGV from each image (Fig. 18). The CV is also referred to be the relative standard deviation and is a standardized measure of the dispersion of a frequency distribution. The CV is expressed in %, is independent on units, and thus is optimal to estimate the frequency distribution, that is, variation, of MGV. Hence, high CV values would indicate large variations in the penetration profiles, whereas low CV values would represent lower dispersity and hence a more homogenous penetration of the drug substance into the skin.
Fig. 18.
Influence of concentration of curcumin on the penetration homogeneity. The inhomogeneity is expressed as the inhomogeneity index (IHI) and corresponds to the CV of the MGV and their respective standard deviations from each image. High IHI values correspond to a high inhomogeneity and vice versa. MGV, mean grey value; CV, coefficient of variation.
Analysis of the biopsies treated with different concentrations of dissolved curcumin led to statistically different CV values between the 3 different sample groups, and no statistical differences were found between the samples within the groups. Besides, data confirm the results obtained from visual inspection and reveal that the inhomogeneity in penetration is the highest for the samples treated with low curcumin concentrations. With increasing curcumin concentrations, the inhomogeneity decreases and is lowest (about 66%, less when compared to the 10-fold less-concentrated samples) for the biopsies treated with 0.25%.
For the formulations tested in this study, image analysis revealed significant differences in the penetration efficacy for the different concentrations of curcumin and enabled to discriminate quickly between good and bad penetrating samples. Hence, data from this study provide first evidence that image analysis with ImageJ is a suitable and versatile tool that helps to evaluate the dermal penetration efficacy of curcumin from different formulations objectively. In addition, it also revealed that dermal penetration efficacy is not only attributed to the penetration depth and the total amount of penetrated chemical compound, but also influenced by the penetration homogeneity. In this study, 3 groups of formulations were identified. Group 1 led to poor and inhomogeneous penetration, and group 2 led to good penetration but still very inhomogeneous penetration, which was characterized by alternating “bright spots” and “dark spots,” that is, blank skin areas without penetrated active. Due to the high variability in penetration efficacy, both groups are expected to cause poor reproducibility with repeated experiments. Hence, these formulations cannot be recommended to be used as internal standards for future experiments if reproducible MGV or penetration depths are needed. The group 3 formulation resulted in good dermal penetration and a more homogeneous penetration and thus − from this set of data − is the most suitable formulation that can be used as an internal standard for future experiments.
Discussion
Based on the results, it is concluded that image analysis with the use of ImageJ software can give valuable information about the dermal penetration behaviour of curcumin from differently concentrated ethanolic solutions. The total amount of penetrated curcumin could be evaluated by determining the MGV, and the penetration depth was measured directly. In addition to conventional skin penetration models, image analysis enabled also to estimate the homogeneity of the dermal penetration. Thus, giving a much broader and more mechanistic image on the fate of a chemical substance after dermal application. The inhomogeneity of the penetration was assessed with histograms and by calculating the relative standard deviation of the MGV from the different biopsies. The latter value is a simple to assess parameter and an objective number at the same time. Thus, it might also be useful to exploit this value further, for example, as the “inhomogeneity index (IHI),” to express the inhomogeneity of penetration from different formulations in future studies.
In this study, the ex vivo pig ear model was used to investigate the dermal penetration efficacy of curcumin from ethanolic solutions. The penetration efficacy was determined from skin biopsies by visual inspection and by using ImageJ software for further image analysis. However, visual inspection of the images obtained from epifluorescence microscopy could only give a rough hint on the influence of the concentration of dissolved active on the penetration efficacy into the skin, and image analysis revealed clear and statistically significant results. Thus, allowing for a number-based discrimination between “good” and “bad” penetrating curcumin formulations. Based on the data obtained, it is concluded that image analysis with ImageJ software can be used as a sensitive tool to compare the dermal penetration efficacy of curcumin from different formulations.
The ex vivo pig ear skin penetration model with subsequent image analysis of the skin biopsies is simple to perform and has several advantages when compared to other skin penetration models. For example, it does not require any manipulation of the skin prior to the measurements and thus mimics physiological skin conditions, which, for example, cannot not be maintained if Franz-diffusion cells are used for the determination of the dermal penetration efficacy. In contrast to other models, sample preparation is fast, and no expensive analytical equipment, for example, HPLC or LC/MS instruments, is required. The method, however, does not allow for an exact quantification of the amount of penetrated curcumin, but allows for a semi-quantitative analysis. For example, by comparing the results obtained to an internal standard.
Ethanolic curcumin solutions with different concentrations were used in this study, and the influence of the concentration of dissolved active on dermal penetration was evaluated. Data proved the validity of Fick's law and demonstrated − as expected − that both the total amount of penetrated active and the penetration depth increase with increasing concentrations of dissolved curcumin. However, data also showed that dermal penetration efficacy can also be affected by penetration inhomogeneity. Thus, a parameter addressing this, for example, the inhomogeneity index (IHI), should be included in future studies to investigate and express the fate of chemicals after dermal application in more detail.
In this study, high penetration inhomogeneity was found for ethanolic solutions containing only low concentrations of curcumin. As high penetration inhomogeneity can be associated with low reproducibility of the data, these formulations cannot be recommended to be used as an internal standard in future studies. Higher concentrations showed less variations and thus are more suitable as internal standard. Based on the IHI value, the most suitable standard seems to be the formulation containing 0.25% curcumin. The formulation shows low inhomogeneity in dermal penetration and enables an efficient penetration of curcumin into the epidermis and even some transdermal penetration. Thus, allowing a good and reproducible trackability of curcumin after dermal application.
In this study, the ex vivo pig ear skin penetration model with subsequent image analysis of the skin biopsies was demonstrated to be a highly suitable tool for the evaluation of the dermal penetration efficacy of curcumin from different formulations. Data suggest that the method might also be suitable as a fast but efficient screening tool for other dermal formulations. A prerequisite for the exploitation of the method is the use of (model) compounds that possess sufficient autofluorescence which can be traced in the skin by means of epifluorescence microscopy. Another possibility would be the fluorescence labelling of the compounds of interest. Future studies should investigate this in more detail.
Conclusions
From the results obtained in this study, it is concluded that the skin penetration model used and the curcumin standard developed in this study are suitable to evaluate and compare the fate and the penetration efficacy of curcumin from different formulations. The ex vivo skin penetration model and the subsequent image analysis of images obtained from epifluorescence microscopy allow for a simple comparison between “good” and “bad” penetrating curcumin formulations and provide detailed information about the penetration depth, the total amount of penetrated substance, and the homogeneity in penetration. With this, the model provides a detailed picture − not only on drug penetration but also on the fate of curcumin after dermal application − and thus can be the base for an efficient development and comparison of innovative curcumin formulations for dermal application in the future. Future studies should also investigate if the model can also be used for the inspection of the dermal penetration efficacy of other fluorescent chemical substances.
Statement of Ethics
The study complies with internationally accepted standards for research practice and reporting. An ethical approval was not required for the use of the pig ear skin because no experimental procedures were performed on live animals. The porcine ears were obtained from a local slaughterhouse after the animals had already undergone humane slaughtering. Therefore, no ethical considerations apply regarding further procedures [63, 64, 65].
Conflict of Interest Statement
The authors declare no conflicts of interest.
Funding Sources
The project was partly funded by the ZIM project KF ZF4114902SB7.
Author Contributions
O.P. and S.R.P. collected data. O.P., S.R.P., and C.M.K. analysed data. O.P. and C.M.K. wrote the manuscript. All authors reviewed and approved the manuscript.
Supplementary Material
Supplementary data
References
- 1.Noorafshan A, Ashkani-Esfahani S. A review of therapeutic effects of curcumin. Curr Pharm Des. 2013;19((11)):2032–46. [PubMed] [Google Scholar]
- 2.Salehi B, Stojanović-Radić Z, Matejić J, Sharifi-Rad M, Anil Kumar NV, Martins N, et al. The therapeutic potential of curcumin: a review of clinical trials. Eur J Med Chem. 2019;163:527–45. doi: 10.1016/j.ejmech.2018.12.016. [DOI] [PubMed] [Google Scholar]
- 3.Nguyen TA, Friedman AJ. Curcumin: a novel treatment for skin-related disorders. J Drugs Dermatol. 2013;12((10)):1131. [PubMed] [Google Scholar]
- 4.Vaughn AR, Branum A, Sivamani RK. Effects of turmeric (Curcuma longa) on skin health: a systematic review of the clinical evidence. Phytother Res. 2016;30((8)):1243–64. doi: 10.1002/ptr.5640. [DOI] [PubMed] [Google Scholar]
- 5.Tejada S, Manayi A, Daglia M, Nabavi SF, Sureda A, Hajheydari Z, et al. Wound healing effects of curcumin: a short review. Curr Pharm Biotechnol. 2016;17((11)):1002–7. doi: 10.2174/1389201017666160721123109. [DOI] [PubMed] [Google Scholar]
- 6.Nguyen MH, Vu NB, Nguyen TH, Le HS, Le HT, Tran TT, et al. In vivo comparison of wound healing and scar treatment effect between curcumin-oligochitosan nanoparticle complex and oligochitosan-coated curcumin-loaded-liposome. J Microencapsul. 2019;36((2)):156–68. doi: 10.1080/02652048.2019.1612476. [DOI] [PubMed] [Google Scholar]
- 7.Heng CY. Topical curcumin: a review of mechanisms and uses in dermatology. Int J Dermatol Clin Res. 2017;3:10–7. [Google Scholar]
- 8.Kotha RR, Luthria DL. Curcumin: biological, pharmaceutical, nutraceutical, and analytical aspects. Molecules. 2019;24((16)):2930. doi: 10.3390/molecules24162930. [DOI] [PMC free article] [PubMed] [Google Scholar]
- 9.Abdel-Hafez SM, Hathout RM, Sammour OA. Curcumin-loaded ultradeformable nanovesicles as a potential delivery system for breast cancer therapy. Colloids Surf B Biointerfaces. 2018;167:63–72. doi: 10.1016/j.colsurfb.2018.03.051. [DOI] [PubMed] [Google Scholar]
- 10.Abdel-Hafez SM, Hathout RM, Sammour OA. Tracking the transdermal penetration pathways of optimized curcumin-loaded chitosan nanoparticles via confocal laser scanning microscopy. Int J Biol Macromol. 2018;108:753–64. doi: 10.1016/j.ijbiomac.2017.10.170. [DOI] [PubMed] [Google Scholar]
- 11.Altamimi MA, Kazi M, Hadi Albgomi M, Ahad A, Raish M. Development and optimization of self-nanoemulsifying drug delivery systems (SNEDDS) for curcumin transdermal delivery: an anti-inflammatory exposure. Drug Dev Ind Pharm. 2019;45((7)):1073–8. doi: 10.1080/03639045.2019.1593440. [DOI] [PubMed] [Google Scholar]
- 12.Campani V, Scotti L, Silvestri T, Biondi M, De Rosa G. Skin permeation and thermodynamic features of curcumin-loaded liposomes. J Mater Sci Mater Med. 2020;31((2)):18. doi: 10.1007/s10856-019-6351-6. [DOI] [PubMed] [Google Scholar]
- 13.Chen Y, Wu Q, Zhang Z, Yuan L, Liu X, Zhou L. Preparation of curcumin-loaded liposomes and evaluation of their skin permeation and pharmacodynamics. Molecules. 2012;17((5)):5972–87. doi: 10.3390/molecules17055972. [DOI] [PMC free article] [PubMed] [Google Scholar]
- 14.Esposito E, Ravani L, Mariani P, Huang N, Boldrini P, Drechsler M, et al. Effect of nanostructured lipid vehicles on percutaneous absorption of curcumin. Eur J Pharm Biopharm. 2014;86((2)):121–32. doi: 10.1016/j.ejpb.2013.12.011. [DOI] [PubMed] [Google Scholar]
- 15.Ghanghoria R, Kesharwani P, Agashe HB, Jain NK. Transdermal delivery of cyclodextrin-solubilized curcumin. Drug Deliv Transl Res. 2013;3((3)):272–85. doi: 10.1007/s13346-012-0114-y. [DOI] [PubMed] [Google Scholar]
- 16.Jin N, Lin J, Yang C, Wu C, He J, Chen Z, et al. Enhanced penetration and anti-psoriatic efficacy of curcumin by improved smartPearls technology with the addition of glycyrrhizic acid. Int J Pharm. 2020;578:119101. doi: 10.1016/j.ijpharm.2020.119101. [DOI] [PubMed] [Google Scholar]
- 17.Liang J, Wu HC, DU SY, Liu CF, Zhong LY, Zhang Q, et al. In vitro transdermal permeation of main compositions in Baimai ointment] Zhongguo Zhong Yao Za Zhi. 2019;44((12)):2486–92. doi: 10.19540/j.cnki.cjcmm.20190221.008. [DOI] [PubMed] [Google Scholar]
- 18.Madan S, Nehate C, Barman TK, Rathore AS, Koul V. Design, preparation, and evaluation of liposomal gel formulations for treatment of acne: in vitro and in vivo studies. Drug Dev Ind Pharm. 2019;45((3)):395–404. doi: 10.1080/03639045.2018.1546310. [DOI] [PubMed] [Google Scholar]
- 19.Mangalathillam S, Rejinold NS, Nair A, Lakshmanan VK, Nair SV, Jayakumar R. Curcumin loaded chitin nanogels for skin cancer treatment via the transdermal route. Nanoscale. 2012;4((1)):239–50. doi: 10.1039/c1nr11271f. [DOI] [PubMed] [Google Scholar]
- 20.Nikolic I, Mitsou E, Pantelic I, Randjelovic D, Markovic B, Papadimitriou V, et al. Microstructure and biopharmaceutical performances of curcumin-loaded low-energy nanoemulsions containing eucalyptol and pinene: terpenes' role overcome penetration enhancement effect? Eur J Pharm Sci. 2020;142:105135. doi: 10.1016/j.ejps.2019.105135. [DOI] [PubMed] [Google Scholar]
- 21.Peram MR, Jalalpure S, Kumbar V, Patil S, Joshi S, Bhat K, et al. Factorial design based curcumin ethosomal nanocarriers for the skin cancer delivery: in vitro evaluation. J Liposome Res. 2019;29((3)):291–311. doi: 10.1080/08982104.2018.1556292. [DOI] [PubMed] [Google Scholar]
- 22.Sintov AC. Transdermal delivery of curcumin via microemulsion. Int J Pharm. 2015;481((1–2)):97–103. doi: 10.1016/j.ijpharm.2015.02.005. [DOI] [PubMed] [Google Scholar]
- 23.Suhaimi H, Ahmad FB, Friberg SE. Curcumin in a model skin lotion formulation. J Pharm Sci. 1995;84((3)):376–80. doi: 10.1002/jps.2600840321. [DOI] [PubMed] [Google Scholar]
- 24.Suwannateep N, Wanichwecharungruang S, Fluhr J, Patzelt A, Lademann J, Meinke MC. Comparison of two encapsulated curcumin particular systems contained in different formulations with regard to in vitro skin penetration. Skin Res Technol. 2013;19((1)):1–9. doi: 10.1111/j.1600-0846.2011.00600.x. [DOI] [PubMed] [Google Scholar]
- 25.Vater C, Hlawaty V, Werdenits P, Cichoń MA, Klang V, Elbe-Bürger A, et al. Effects of lecithin-based nanoemulsions on skin: short-time cytotoxicity MTT and BrdU studies, skin penetration of surfactants and additives and the delivery of curcumin. Int J Pharm. 2020;580:119209. doi: 10.1016/j.ijpharm.2020.119209. [DOI] [PubMed] [Google Scholar]
- 26.Vidlářová L, Romero GB, Hanuš J, Štěpánek F, Müller RH. Nanocrystals for dermal penetration enhancement: effect of concentration and underlying mechanisms using curcumin as model. Eur J Pharm Biopharm. 2016;104:216–25. doi: 10.1016/j.ejpb.2016.05.004. [DOI] [PubMed] [Google Scholar]
- 27.Wolf M, Klang V, Stojcic T, Fuchs C, Wolzt M, Valenta C. NLC versus nanoemulsions: effect on physiological skin parameters during regular in vivo application and impact on drug penetration. Int J Pharm. 2018;549((1–2)):343–51. doi: 10.1016/j.ijpharm.2018.08.007. [DOI] [PubMed] [Google Scholar]
- 28.Zhou X, Luo Z, Baidya A, Kim HJ, Wang C, Jiang X, et al. Biodegradable β-cyclodextrin conjugated gelatin methacryloyl microneedle for delivery of water-insoluble drug. Adv Healthc Mater. 2020;9((11)):e2000527. doi: 10.1002/adhm.202000527. [DOI] [PMC free article] [PubMed] [Google Scholar]
- 29.Duse L, Pinnapireddy SR, Strehlow B, Jedelská J, Bakowsky U. Low level LED photodynamic therapy using curcumin loaded tetraether liposomes. Eur J Pharm Biopharm. 2018;126:233–41. doi: 10.1016/j.ejpb.2017.10.005. [DOI] [PubMed] [Google Scholar]
- 30.Test no. 427: skin absorption: in vivo method. Paris, France: OECD; 2004. [Google Scholar]
- 31.Lademann J, Jacobi U, Surber C, Weigmann HJ, Fluhr JW. The tape stripping procedure: evaluation of some critical parameters. Eur J Pharm Biopharm. 2009;72((2)):317–23. doi: 10.1016/j.ejpb.2008.08.008. [DOI] [PubMed] [Google Scholar]
- 32.Test no. 428: skin absorption: in vitro method. Paris, France: OECD; 2004. [Google Scholar]
- 33.Abd E, Yousef SA, Pastore MN, Telaprolu K, Mohammed YH, Namjoshi S, et al. Skin models for the testing of transdermal drugs. Clin Pharmacol. 2016;8:163–76. doi: 10.2147/CPAA.S64788. [DOI] [PMC free article] [PubMed] [Google Scholar]
- 34.So J, Ahn J, Lee TH, Park KH, Paik MK, Jeong M, et al. Comparison of international guidelines of dermal absorption tests used in pesticides exposure assessment for operators. Toxicol Res. 2014;30((4)):251–60. doi: 10.5487/TR.2014.30.4.251. [DOI] [PMC free article] [PubMed] [Google Scholar]
- 35.Buist H, Buist H, Craig P, Dewhurst I, Hougaard Bennekou S, Kneuer C, et al. Guidance on dermal absorption. EFSA J. 2017;15((6)):e04873. doi: 10.2903/j.efsa.2017.4873. [DOI] [PMC free article] [PubMed] [Google Scholar]
- 36.Jacques-Jamin C, Duplan H, Rothe H, Vaillant O, Eilstein J, Grégoire S, et al. Comparison of the skin penetration of 3 metabolically stable chemicals using fresh and frozen human skin. Skin Pharmacol Physiol. 2017;30((5)):234–45. doi: 10.1159/000475472. [DOI] [PubMed] [Google Scholar]
- 37.Schwarz JC, Klang V, Hoppel M, Wolzt M, Valenta C. Corneocyte quantification by NIR densitometry and UV/Vis spectroscopy for human and porcine skin and the role of skin cleaning procedures. Skin Pharmacol Physiol. 2012;25((3)):142–9. doi: 10.1159/000336787. [DOI] [PubMed] [Google Scholar]
- 38.Nastiti CMRR, Mohammed Y, Telaprolu KC, Liang X, Grice JE, Roberts MS, et al. Evaluation of quantum dot skin penetration in porcine skin: effect of age and anatomical site of topical application. Skin Pharmacol Physiol. 2019;32((4)):182–91. doi: 10.1159/000499435. [DOI] [PubMed] [Google Scholar]
- 39.Barbero AM, Frasch HF. Effect of frozen human epidermis storage duration and cryoprotectant on barrier function using two model compounds. Skin Pharmacol Physiol. 2016;29((1)):31–40. doi: 10.1159/000441038. [DOI] [PMC free article] [PubMed] [Google Scholar]
- 40.Franz TJ, Lehman PA, Raney SG. Use of excised human skin to assess the bioequivalence of topical products. Skin Pharmacol Physiol. 2009;22((5)):276–86. doi: 10.1159/000235828. [DOI] [PMC free article] [PubMed] [Google Scholar]
- 41.Pany A, Klang V, Brunner M, Ruthofer J, Schwarz E, Valenta C. Effect of physical and chemical hair removal methods on skin barrier function in vitro: consequences for a hydrophilic model permeant. Skin Pharmacol Physiol. 2019;32((1)):8–21. doi: 10.1159/000493168. [DOI] [PubMed] [Google Scholar]
- 42.Lindemann U, Weigmann HJ, Schaefer H, Sterry W, Lademann J. Evaluation of the pseudo-absorption method to quantify human stratum corneum removed by tape stripping using protein absorption. Skin Pharmacol Appl Skin Physiol. 2003;16((4)):228–36. doi: 10.1159/000070845. [DOI] [PubMed] [Google Scholar]
- 43.Dickel H, Goulioumis A, Gambichler T, Fluhr JW, Kamphowe J, Altmeyer P, et al. Standardized tape stripping: a practical and reproducible protocol to uniformly reduce the stratum corneum. Skin Pharmacol Physiol. 2010;23((5)):259–65. doi: 10.1159/000314700. [DOI] [PubMed] [Google Scholar]
- 44.Klang V, Schwarz JC, Hartl A, Valenta C. Facilitating in vitro tape stripping: application of infrared densitometry for quantification of porcine stratum corneum proteins. Skin Pharmacol Physiol. 2011;24((5)):256–68. doi: 10.1159/000326072. [DOI] [PubMed] [Google Scholar]
- 45.Schneider CA, Rasband WS, Eliceiri KW. NIH image to ImageJ: 25 years of image analysis. Nat Methods. 2012;9((7)):671–5. doi: 10.1038/nmeth.2089. [DOI] [PMC free article] [PubMed] [Google Scholar]
- 46.Rasband WS. ImageJ: image processing and analysis in Java. 2012 [Google Scholar]
- 47.Encarnacion-Rivera L, Foltz S, Hartzell HC, Choo H, Myosoft Myosoft: an automated muscle histology analysis tool using machine learning algorithm utilizing FIJI/ImageJ software. PLoS One. 2020;15((3)):e0229041. doi: 10.1371/journal.pone.0229041. [DOI] [PMC free article] [PubMed] [Google Scholar]
- 48.Garcez AS, Barros LC, Fernandes MRU, Fujii DN, Suzuki SS, Nepomuceno R. Fluorescence image and microbiological analysis of biofilm retained around healthy and inflamed orthodontic miniscrews. Photodiagn Photodyn Ther. 2020;30:101707. doi: 10.1016/j.pdpdt.2020.101707. [DOI] [PubMed] [Google Scholar]
- 49.Guiet R, Burri O, Seitz A. Open source tools for biological image analysis. Methods Mol Biol. 2019;2040:23–37. doi: 10.1007/978-1-4939-9686-5_2. [DOI] [PubMed] [Google Scholar]
- 50.Harikumar PE. Quantification of pancreatic islets: using image analysis tools. Methods Mol Biol. 2020;2076:215–29. doi: 10.1007/978-1-4939-9882-1_12. [DOI] [PubMed] [Google Scholar]
- 51.Martin B, Banner BM, Schäfer E-M, Mayr P, Anthuber M, Schenkirsch G, et al. Tumor proportion in colon cancer: results from a semiautomatic image analysis approach. Virchows Arch. 2020 Aug;477((2)):185–93. doi: 10.1007/s00428-020-02764-1. [DOI] [PMC free article] [PubMed] [Google Scholar]
- 52.Roels J, Vernaillen F, Kremer A, Gonçalves A, Aelterman J, Luong HQ, et al. An interactive ImageJ plugin for semi-automated image denoising in electron microscopy. Nat Commun. 2020;11((1)):771. doi: 10.1038/s41467-020-14529-0. [DOI] [PMC free article] [PubMed] [Google Scholar]
- 53.Seynnes OR, Cronin NJ. Simple muscle architecture analysis (SMA): an ImageJ macro tool to automate measurements in B-mode ultrasound scans. PLoS One. 2020;15((2)):e0229034. doi: 10.1371/journal.pone.0229034. [DOI] [PMC free article] [PubMed] [Google Scholar]
- 54.Terheyden JH, Wintergerst MWM, Falahat P, Berger M, Holz FG, Finger RP. Automated thresholding algorithms outperform manual thresholding in macular optical coherence tomography angiography image analysis. PLoS One. 2020;15((3)):e0230260. doi: 10.1371/journal.pone.0230260. [DOI] [PMC free article] [PubMed] [Google Scholar]
- 55.Wheeler RJ. ImageJ for partially and fully automated analysis of trypanosome micrographs. Methods Mol Biol. 2020;2116:385–408. doi: 10.1007/978-1-0716-0294-2_24. [DOI] [PubMed] [Google Scholar]
- 56.Wölfle U, Elsholz FA, Kersten A, Haarhaus B, Müller WE, Schempp CM. Expression and functional activity of the bitter taste receptors TAS2R1 and TAS2R38 in human keratinocytes. Skin Pharmacol Physiol. 2015;28((3)):137–46. doi: 10.1159/000367631. [DOI] [PubMed] [Google Scholar]
- 57.Yousef SA, Mohammed YH, Namjoshi S, Grice JE, Benson HAE, Sakran W, et al. Mechanistic evaluation of enhanced curcumin delivery through human skin in vitro from optimised nanoemulsion formulations fabricated with different penetration enhancers. Pharmaceutics. 2019;11((12)):639. doi: 10.3390/pharmaceutics11120639. [DOI] [PMC free article] [PubMed] [Google Scholar]
- 58.de Moraes Carvalho D, Takeuchi KP, Geraldine RM, José de, Moura C, Torres MCL. Production, solubility and antioxidant activity of curcumin nanosuspension. Food Sci Technol. 2015;35((1)):115–9. [Google Scholar]
- 59.Pelikh O, Stahr PL, Huang J, Gerst M, Scholz P, Dietrich H, et al. Nanocrystals for improved dermal drug delivery. Eur J Pharm Biopharm. 2018;128:170–8. doi: 10.1016/j.ejpb.2018.04.020. [DOI] [PubMed] [Google Scholar]
- 60.JASP Team JASP (version 0.13.1): computer software. 2020 [Google Scholar]
- 61.Dinno A. Nonparametric pairwise multiple comparisons in independent groups using Dunn's test. Stata J. 2015;15((1)):292–300. [Google Scholar]
- 62.Rost FWD. Fluorescence microscopy. Cambridge: Cambridge University Press; 1995. [Google Scholar]
- 63.Ho FK, Delgado-Charro MB, Bolhuis A. Evaluation of an explanted porcine skin model to investigate infection with the dermatophyte Trichophyton rubrum. Mycopathologia. 2020;185((2)):233–43. doi: 10.1007/s11046-020-00438-9. [DOI] [PubMed] [Google Scholar]
- 64.Heard CM. An ex vivo skin model to probe modulation of local cutaneous arachidonic acid inflammation pathway. J Biol Methods. 2020;7((4)):e138. doi: 10.14440/jbm.2020.319. [DOI] [PMC free article] [PubMed] [Google Scholar]
- 65.Herkenne C, Naik A, Kalia YN, Hadgraft J, Guy RH. Pig ear skin ex vivo as a model for in vivo dermatopharmacokinetic studies in man. Pharm Res. 2006;23((8)):1850–6. doi: 10.1007/s11095-006-9011-8. [DOI] [PubMed] [Google Scholar]
Associated Data
This section collects any data citations, data availability statements, or supplementary materials included in this article.
Supplementary Materials
Supplementary data


