

Abstract
The corpus callosum is the largest white matter tract and critical for interhemispheric connectivity. Unfortunately, neurocognitive deficits after experimental white matter lesions are subtle and variable, limiting their translational utility. We examined resting state functional connectivity (RSFC) as a surrogate after a focal lesion in the lateral corpus callosum induced by stereotaxic injection of L-NIO in mice. RSFC was performed via optical intrinsic signal imaging through intact skull before and on days 1 and 14 after injection, using interhemispheric homotopic and seed-based temporal correlation maps. We measured the lesion volumes at 1 month in the same cohort. L-NIO induced focal lesions in the corpus callosum. Interhemispheric homotopic connectivity decreased by up to 50% 24 h after L-NIO, partially sparing the visual cortex. All seeds showed loss of connectivity to the contralateral hemisphere. Moreover, ipsilesional motor and visual cortices lost connectivity within the same hemisphere. Sham-operated mice did not show any lesion or connectivity changes. RSFC imaging reliably detects acute disruption of long interhemispheric and intrahemispheric connectivity after a corpus callosum lesion in mice. This noninvasive method can be a functional surrogate to complement neurocognitive testing in both therapeutic and recovery studies after white matter injury.
Keywords: animal models, optical imaging, white matter injury
Introduction
The corpus callosum and corona radiata are large white matter tracts critical for the integration of sensorimotor and cognitive information (Mateo et al. 2017a). Corpus callosum is the largest commissure connecting layers II/III and V of mainly homotopic cortices, (Wise 1975; Patel et al. 2013; Zhou et al. 2013; Tanaka-Arakawa et al. 2015) and is commonly affected in traumatic brain injury. Corona radiata is a common site for small, lacunar-like subcortical white matter strokes and diffuse axonal injury after head trauma (DeCarli et al. 2005; Bailey et al. 2012). Diffuse subcortical white matter disease is also highly prevalent, especially in hypertension and diabetes (de Leeuw et al. 2002; Tamura and Araki 2015). Although functional consequences of white matter disruption can be subtle (van der Knaap and van der Ham 2011), cumulative injury can lead to significant disability (Vermeer et al. 2007; Potter et al. 2011; Wardlaw et al. 2015), presumably because of the loss of connectivity between the hemispheres and between the cortex and subcortical nuclei (Leuchter et al. 1994). Mechanisms are poorly understood, and there is no treatment proven to enhance recovery.
Clinically relevant animal models can help overcome these barriers. Several experimental studies have examined the functional impact of small strategically placed infarcts in white matter bundles such as the internal capsule, and more commonly, the lateral corpus callosum analogous to corona radiata (Sozmen et al. 2012; Marin and Carmichael 2018). Unfortunately, these animal models lead to behavioral deficits that are often subtle and variable (Sozmen et al. 2012; Blasi et al. 2014), limiting their value for translational research. Therefore, objective and quantitative metrics of abnormal network connectivity in animal models are needed to facilitate pathophysiological and therapeutic research in white matter injury.
Resting state functional connectivity (RSFC) imaging has recently emerged as one such technique that provides quantitative indices of spatial connectivity. Resting state blood oxygen level-dependent functional magnetic resonance imaging (BOLD fMRI) can be used to measure RSFC and has been applied to focal cerebral ischemia (van Meer et al. 2010). Indeed, the loss of connectivity on resting state fMRI predicts neurocognitive deficits in human brain injury (He et al. 2007; Carter et al. 2010; Corbetta 2012), and early fMRI can be superior to behavioral metrics in predicting functional deficits (Rehme et al. 2015).
However, fMRI is expensive and time-consuming and may not have sufficient spatial resolution to image the mouse brain. Optical imaging tools, such as photoacoustic tomography (Nasiriavanaki et al. 2014), near-infrared spectroscopy (Eggebrecht et al. 2014), fluorescence imaging of calcium indicators (Ma et al. 2016), and intrinsic optical signal (IOS) imaging (White et al. 2011) have recently emerged as viable alternatives to examine RSFC in experimental animals. The IOS imaging relies on physiological principles analogous to BOLD fMRI for clinical translation (Mateo et al. 2017b), provides high spatial resolution over a large dorsal cortical field of view, and is relatively easy to implement (Kura et al. 2018; Xie et al. 2019). It has been used to investigate RSFC after photothrombotic cortical infarction and middle cerebral artery occlusion in mice (Bauer et al. 2014; Hakon et al. 2018). However, the impact of subcortical white matter disruption on RSFC has never been studied using IOS.
We, therefore, designed this study to test the effect of a focal lateral corpus callosum infarct, anatomically corresponding to corona radiata in the human brain where ischemic lesions are exceedingly common, on RSFC using minimally invasive IOS imaging in mice. Our data show an acute and spatially selective loss of RSFC between the 2 hemispheres and suggest that IOS-based RSFC can complement neurological examination as a readout for functional outcomes after subcortical white matter injury.
Materials and Methods
Animals
Experiments were conducted according to protocols approved by the Animal Research Committee of the Massachusetts General Hospital and the National Institutes of Health Guide for the Care and Use of Laboratory Animals. Mice (8-10 weeks old, male, C57BL/6 J, Charles River Laboratories), housed on a 12-hour light/dark cycle and fed ad libitum, were randomly allocated to study arms and coded with tail marks to perform the analysis in a blinded fashion.
Subcortical White Matter Lesion
Subcortical white matter stroke was produced as previously described with modifications (Sozmen et al. 2012; Hinman et al. 2013; Rosenzweig and Carmichael 2013; Sozmen et al. 2016). Briefly, isoflurane-anesthetized mice (4% for induction, 1-1.5% for maintenance, in a 7:3 N2O:O2 mixture) were placed on a stereotactic frame (Stoelting, Wood Dale, IL). Rectal temperature was controlled at 37 °C by a feedback-regulated homeothermic blanket (FHC, Bowdoin, ME). Ointment was applied to prevent corneal drying.
After a midline incision scalp was reflected preserving the periosteum. Lesions were induced in the right hemisphere by stereotactic microinjections of endothelial nitric oxide synthase inhibitor N5-(1-Iminoethyl)-L-ornithine dihydrochloride (L-NIO; 100 mM, Tocris, Bristol, UK; n = 7) or vehicle (saline; n = 8) using a 5 mL syringe (34G, Hamilton, Reno, NV) connected to an infusion pump (310 Syringe Pump, KD Scientific, Holliston, MA). For this, a burr hole (~1 mm diameter) was drilled under saline cooling centered at 1 mm anterior from bregma adjacent to the midline. Two separate injections of 1.2 mL of L-NIO (total 0.24 μmoles) or vehicle were performed at a rate of 0.1 mL/min at 1.5 mm lateral, 1.5 mm anterior, 1.8 mm ventral, and at 1.4 mm lateral, 0.5 mm anterior, and 1.6 mm ventral from bregma. To reach these coordinates, the injection needle was inserted at 0.2 mm lateral, 1.5 and 0.5 mm anterior over the dorsal surface, and advanced for 2.2 and 2.0 mm, respectively for each injection. In order to minimize injury to the cortex overlying the lesion, the injection needle was inserted adjacent to the midline and angled 36° pointing laterally (Fig. 1A) (Paxinos et al. 2001). This approach also preserved the skull directly overlying the lesion for imaging purposes. After each injection, the needle was left in place for 5 min to avoid backflow, the absence of which was visually confirmed. Mice were then placed in a 28 °C incubator for 2 h before returning to their home cage.
Figure 1 .
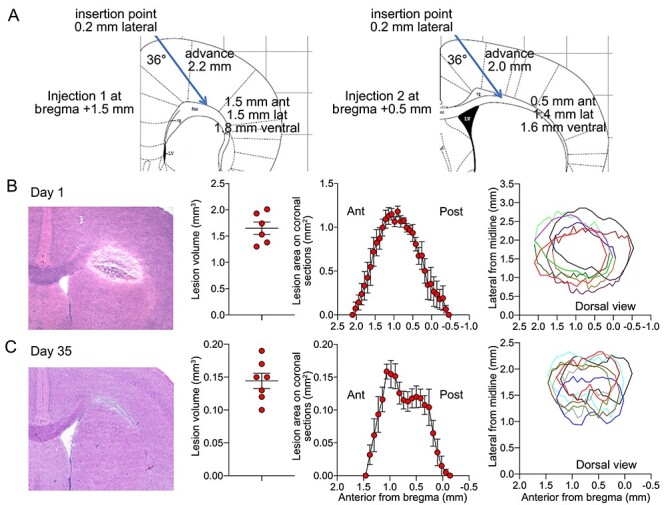
Lesion morphometry. (A) The stereotaxic approach for L-NIO injection. (B,C) Lesion characteristics on days 1 and 35 including (from left to right) a representative lesion on hematoxylin/eosin-stained coronal section, lesion volumes in individual animals, lesion areas on coronal sections along the anteroposterior axis across the cohort, and dorsal view of lesion locations in individual animals reconstituted based on the medial and lateral margins on coronal sections. The dorsal view shows each animal in a different color and the horizontal axis represents the cranial midline. Mean ± standard error.
Optical Imaging
Imaging was performed at baseline (naïve animals prior to burr hole preparation), and 1 and 14 days after L-NIO or vehicle injection. Although we attempted reimaging the same cohort at 1 month, granulation tissue formation significantly degraded the overall image quality and caused a significant drop in correlation coefficients (data not shown). For imaging, animals were anesthetized using ketamine/xylazine (100 and 5 mg/kg in 20 and 1 mg/mL solutions, respectively: Patterson Veterinary Supply, Greeley, CO). We have previously shown this anesthetic regimen to be superior to others for RSFC by IOS imaging (Xie et al. 2019). Animals were then placed on a homeothermic heating pad to maintain the rectal temperature at 37.0 ± 0.1 °C, and head fixed in a stereotaxic frame. The skull was exposed after a midline incision without damaging the periosteum. Mineral oil was applied to the skull surface and reapplied to prevent opacification of the skull as needed. The experimental setup and analysis have been previously described (Xie et al. 2019). Briefly, the skull surface was illuminated by light from a quartz tungsten halogen lamp (Techniquip R150, Capra Optical, Natick, MA) passed through a 570 ± 10 nm filter and directed with a fiberoptic cable to image changes in total hemoglobin concentration (i.e., blood volume). RSFC imaging using a single 570 nm wavelength centered at the isosbestic point between deoxy- and oxyhemoglobin has been validated previously (Kura et al. 2018). Images were acquired with a CCD camera (Cascade 512F, Photometrics, Tucson, Arizona) at 256 × 256 pixel resolution (2 × 2 binning) and 13.6 frames per second for 10 min. μManager software was used for image acquisition (San Francisco CA).
Images were processed and correlation coefficients generated as previously described, with minor modifications (White et al. 2011; Kura et al. 2018; Xie et al. 2019). In brief, acquired images were downsampled to 128 × 128 pixels and spatially coregistered using frontal sinus and lambda as landmarks via custom-written scripts in MATLAB (MathWorks, Natick, MA). The dynamic optical density at each pixel over time was bandpass filtered between 0.008 and 0.09 Hz, downsampled to 1 frame per second, and regressed to remove any global source of signal variance. All Pearson r values were Fisher z-transformed prior to statistical comparisons. Connectivity was analyzed in 2 ways: 1) “Interhemispheric homotopic connectivity” maps were generated by calculating the correlation coefficients between each pixel and its mirror pixel over the contralateral cortex. Global interhemispheric homotopic connectivity was calculated by averaging all correlation coefficients between mirror pixels in the entire image. In addition, average coronal interhemispheric homotopic correlation coefficients were plotted along the anteroposterior axis. 2) “Seeds” were placed over the motor cortex, the whisker barrel cortex, and the visual cortex, as well as the cortex above the corpus callosum lesion, on the ipsilesional hemisphere, and on the homotopic regions in the contralesional hemisphere, guided by an overlaid atlas (Paxinos 2001). We calculated the IOS signal temporal correlation coefficients between manually placed seeds and all other pixels and mapped these throughout the image to create seed-based connectivity maps. The higher the absolute value of the correlation coefficient, the stronger the connection between a seed-pixel pair. Positive correlations indicate that the IOS signal is changing in the same direction and negative correlations in the opposite direction in a seed-pixel pair. After generating seed-based connectivity maps, we calculated a seed-based connectivity index for each seed by averaging the positive correlation coefficients between that seed and all other pixels. In addition, a correlation matrix was generated between each pair of seeds. Lastly, seed-based connectivity area was calculated for each seed by counting all pixels that showed a positive correlation with the seed. All scripts are available from the authors upon reasonable request.
Histology and Infarct Size Measurement
We determined the lesion size and location 1 month after L-NIO injection in the imaged cohort. In addition, a separate group of mice was sacrificed 1 day after L-NIO injection to determine the lesion volume at this early time point. Brains were harvested and fresh frozen using methylbutane, cryosectioned (20-μm-thick slices, 80-μm interval), and stained with hematoxylin and eosin. Images were acquired (Super Coolscan 9000 ED Scanner, Nikon) and lesion area and coordinates at each coronal section were measured (ImageJ, NIH, Bethesda, MD).
Cerebral Blood Flow
In a separate group of mice (n = 11), we performed simultaneous laser Doppler flowmetry (LDF) on both hemispheres in the same animal to examine the effect of topical application of L-NIO on cortical blood flow. Mice were anesthetized with isoflurane (4% induction, 1.5–2% during surgery, 1–1.5% maintenance, in 70%/30% N2O:O2). The femoral artery was catheterized for blood pressure monitoring. Mice were then placed on a homeothermic heating pad in a stereotaxic frame to control the rectal temperature at 37.0 ± 0.1 °C. Burr holes (1 mm) were drilled in the parietal bone under saline cooling on both hemispheres. Cement was applied around the periphery to create a pool and LDF probes placed bilaterally tips submerged in saline solution. After baseline recordings, saline was removed, and L-NIO (100 mM) applied topically onto the cortex on one side and saline on the other. Solutions were replenished as needed.
Neurological Deficits
Neurological examinations were carried out at various time points in separate cohorts with identical vehicle (n = 6–15) and L-NIO (n = 8–16) injections. “Grid walk test” (Blasi et al. 2014) was used to evaluate motor coordination. Mice were placed on a wire grid (1.5 × 1.5 cm grid openings) and allowed to freely walk for 5 min. The total number of foot faults for each limb was expressed as % of the total number of steps taken. “Wire grip test” (Bermpohl et al. 2006) was used to evaluate motor coordination. A single metal wire (diameter 2 mm) was horizontally suspended 30 cm above the bench between 2 wooden bars with a soft cushion underneath to prevent fall injury. Mice were placed in the middle of the wire, and the latency to fall was timed for a maximum of 60 s. Mice that climbed down were given the maximum latency of 60 s. The test was repeated 3 times 1 min apart and latencies were averaged. “Corner test” (Zhang et al. 2002) was used to evaluate sensorimotor deficits. Mice were placed halfway between 2 boards (30 × 20 × 1 cm) that were attached at a 30-degree angle with a small opening along the joint to encourage entry into the corner. The number of times mice turn to the right or left as part of a rearing movement at the corner was counted for 10 trials. “Cylinder test” (Blasi et al. 2014) was used to quantify hemiparesis. Mice were placed in a 9 cm diameter transparent cylinder. The difference between the number of right or left forelimb use as they touched the cylinder during a total of 20 rearing behaviors was calculated. Only rears in which both forelimbs can be clearly seen were counted. “Pole test” (Matsuura et al. 1997) was used to evaluate fine motor coordination. A vertical iron bar (diameter 1 cm, height 60 cm) was wrapped with gauze to prevent slipping. Mice were trained for 3 days by placing them head down and head up at the top of the bar 3 times a day each and allowed to climb down. On test day, mice were placed head up on top of the bar, and the latency to reach the bottom was timed for a maximum of 120 s. The test was repeated 3 times and latencies averaged. “Open field test” (Wu et al. 2019) was used to evaluate locomotor activity. Mice were placed in a cage secured with metal wiring tops and movements were video recorded in minimal lighting overnight for 8 h beginning at 7 pm. The distance traveled was calculated using an automated system (Anymaze, Stoelting Co., Wood Dale, USA). “Novel object recognition test” (Blasi et al. 2014) was used to evaluate nonspatial memory. Each mouse was individually acclimatized 30 min a day for 3 days. On the 4th day, 2 identical objects (plastic objects) were placed at a fixed position in the box. Mice were allowed to explore the objects freely for 5 min. After 60 min, mice were placed in the same box with one original object and one novel object (a wooden block of similar volume) and again allowed to explore both objects freely for 5 min under the camera. Exploring behavior for a given object was defined as nose and mouth within 2 cm of the object, excluding the time spent standing on the object, or when the total exploration time was less than 20 s. After each test, the box and objects were cleaned with 75% alcohol. The time spent exploring the novel and original objects were determined. “Morris water maze” (Wu et al. 2019) was used to evaluate spatial memory. Mice were subjected to 5 hidden platform trials (one to 2 trials per day). Probe trials were performed 24 h after the last hidden platform trial by allowing mice to swim for 60 s and recording the time spent in the target quadrant. “Fear conditioning test” (Dilekoz et al. 2015) was used to evaluate contextual learning. Mice were placed in a glass chamber with a steel grid floor for 3 min, subjected to a 2-second foot shock (0.7 mA), and returned to their home cage 30 s later. The next day mice were re-exposed to the 3-min context for memory retrieval. Shock response (freezing time), defined as lack of any movement besides respiration and heartbeat in 2-second intervals, was calculated as % of total test time (TSE-Systems). Mice that displayed baseline freezing > 20% were considered outliers and were removed from the analysis (n = 1). “Y maze test” (Alawdi et al. 2017) was used to evaluate spatial working memory. Mice were placed in the center of a Y-shaped enclosure and were allowed to explore the 3 arms freely for 5 min under video monitoring. The sequence of arm entries was recorded when all 4 limbs were within an arm. Arm alternations were deemed correct if the animal entered 3 arms sequentially in clockwise or counterclockwise order and calculated as % of total alternations as follows: (number of correct alternations)/(total arm entries −2)] × 100. “Elevated plus maze test” (André et al. 2014) was used to evaluate anxiety behavior. Mice were placed on the central platform of an opaque plexiglass plus-shaped maze 1 m high from the ground with 2 open arms and 2 closed arms (Med Associates, St. Albans, VT) and allowed to explore for 5 min. Time spent in the open arm was quantified as % of the total time by an automated tracking system (Anymaze, Stoelting Co., Wood Dale, USA).
Statistics
Mice were randomly picked from the cages and assigned to sham versus lesion groups, although no specific randomization tool was used. Data analysis was performed blinded. A priori exclusion criteria included surgical complications (n = 0) and technical problems with imaging (n = 1 in each group). Statistical comparisons were made using paired t-test and 2-way ANOVA for repeated measures (Prism 8, GraphPad Software, Inc., CA, USA). Bonferroni correction was applied for multiple comparisons. Normal distribution was confirmed by Shapiro–Wilk test. Data are presented as mean ± standard error of mean.
Results
At 1 day and 1 month after L-NIO injection, callosal lesions measured 1.65 ± 0.12 and 0.14 ± 0.02 mm3, respectively, and centered ~ 1 mm anterior and ~ 1.5 mm lateral from bregma (n = 6 and 7, respectively; Fig. 1B,C). Representative histological sections show substantial edema on day 1 that resolved over 1 month. Vehicle injections did not create any discernible lesion on histological sections (n = 9).
Because the majority of callosal connections are between homotopic cortical regions in the 2 hemispheres (Patel et al. 2013), we first examined the interhemispheric homotopic connectivity. For this, we calculated the correlation coefficient between mirror pixels in opposite hemispheres and generated interhemispheric homotopic connectivity maps (Fig. 2A). Sham-operated animals did not show a consistent change between baseline and day 1 after the procedure, suggesting that burr holes and vehicle injection into the lateral corpus callosum did not affect the connectivity (n = 9; Fig. 2A–C); despite some degradation of image quality, overall interhemispheric homotopic connectivity was largely maintained in sham animals on day 14. In contrast, lesioned animals showed a marked loss of interhemispheric homotopic connectivity on day 1 compared with baseline imaging in the same animal, which further declined on day 14 (n = 7; Fig. 2A–C). When analyzed along the anteroposterior axis, the loss of interhemispheric connectivity after a lesion encompassed both frontal and parietal cortices but relatively spared the occipital cortex (Fig. 2B). The loss of connectivity on day 14 did not show a strong relationship with the lesion volume measured at 1 month (R2 = 0.24; Fig. 2D).
Figure 2 .
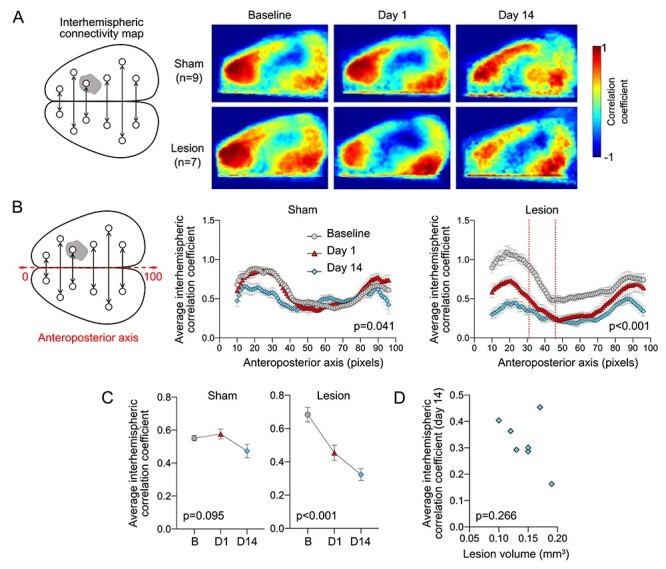
Interhemispheric resting state homotopic connectivity. (A) Left: Diagram showing interhemispheric homotopic connectivity analysis using mirror pixels. Gray shade represents the approximate position of the lesion. Right: Average interhemispheric homotopic connectivity maps generated at baseline and on days 1 and 14 after L-NIO injection. (B) Interhemispheric homotopic correlation coefficients between mirror pixels were averaged across the mediolateral axis (i.e., for each pixel column) and plotted along the anteroposterior axis. All data are Fisher z-transformed. Two-way ANOVA for repeated measures. (C) The average global interhemispheric homotopic correlation coefficient decreased significantly in all animals with a corpus callosum lesion but not in sham controls; the small decline on day 14 was mainly due to partial skull opacification after repeated imaging. All data are Fisher z-transformed. One-way ANOVA for repeated measures. (D) Lesion volumes did not show a consistent relationship to the average global interhemispheric homotopic correlation coefficients in each animal. Correlation coefficients were Fisher z-transformed. Pearson r.
To better display the regional disconnection, we next examined seed-based connectivity maps. Baseline images showed strong connections for each seed mainly to the contralateral homotopic cortical regions (Fig. 3), as previously described (White et al. 2011). Twenty-four hours after the lesion, connectivity was diminished in the motor and whisker barrel cortices and the cortex overlying the white matter lesion, whereas the visual cortex appeared relatively spared. Sham-operated mice did not show a consistent change in seed-based connectivity (Supplementary Fig. 1). Correlation matrices demonstrated the same relationships, which were most prominent between interhemispheric seed pairs (Fig. 3B).
Figure 3 .
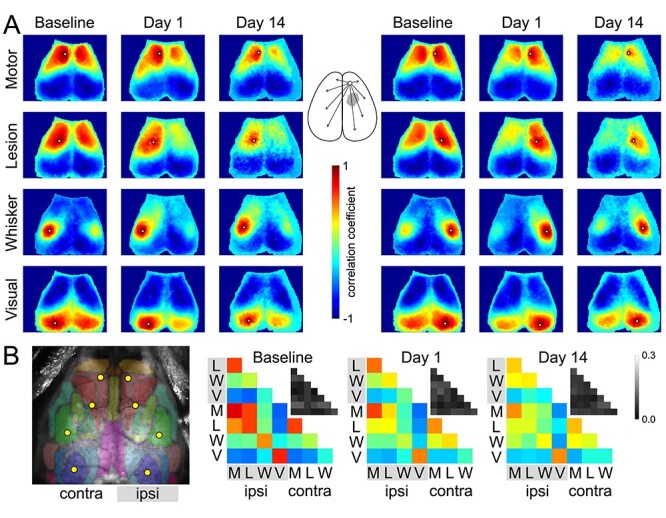
Seed-based connectivity maps. (A) Average RSFC maps generated at baseline and 24 h after L-NIO injection using 4 seeds on each hemisphere as indicated (white dots). The method to calculate the average correlation coefficient between each pixel and all other pixels is shown for a representative seed in the middle inset. (B) Averaged connectivity matrices among the 8 seeds. The absolute value of the standard error of the correlation coefficients for each pair in the matrix is shown in the upper right of each panel in grayscale. Color and grayscale bars are for the connectivity matrix and standard errors, respectively. The sham group is shown in Supplementary Figure 1.
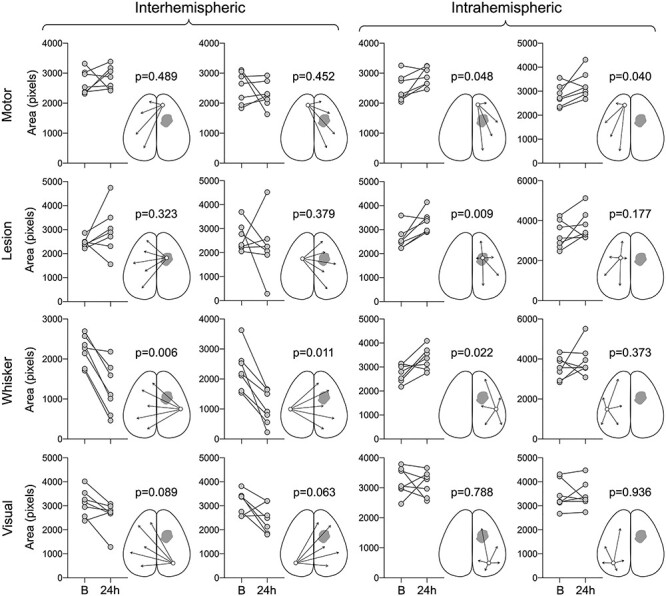
When we quantified the correlation coefficients between a seed and the contralateral hemisphere, ipsilesional seeds showed reduced connectivity to the contralesional hemisphere by ~ 50% after the white matter lesion (Fig. 4, first column). Ipsilesional whisker barrel cortex and the cortex overlying the lesion consistently showed the most severe loss of connectivity to the contralesional hemisphere, followed by the motor cortex. The visual cortex was less affected. Contralesional seeds also displayed the loss of connectivity to the ipsilesional hemisphere (Fig. 4, second column). Intrahemispheric connectivity of ipsilesional motor and visual cortices was also affected (Fig. 4, third column), whereas the intrahemispheric connectivity of contralesional seeds did not show a consistent change (Fig. 4, fourth column).
Figure 4 .
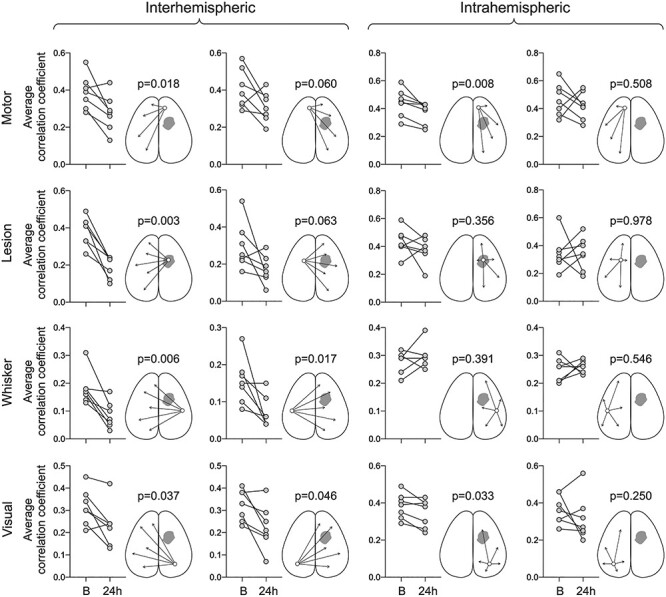
Seed-based correlation coefficients before and after the white matter lesion. Average correlation coefficients between each of the 4 seeds and ipsilateral (intrahemispheric) or contralateral hemisphere (interhemispheric) are shown at baseline (B) and 24 h after L-NIO injection. Each symbol represents one animal. All data are Fisher z-transformed. Paired t-test. The sham group is shown in Supplementary Figure 2.
We also found changes in the spatial extent of connectivity for each seed (Fig. 5). As expected, the number of pixels in the contralesional hemisphere positively correlated with the ipsilesional whisker barrel seed (i.e., area with a correlation coefficient greater than 0), as well as the number of pixels in the ipsilesional hemisphere that were positively correlated with the contralesional whisker barrel seed, were significantly reduced (Fig. 5). In contrast, the number of pixels that showed a positive correlation with the motor, lesion, and whisker seeds was increased within the same hemisphere (Fig. 5).
Figure 5 .
Changes in the area of seed-based connectivity before and after the white matter lesion. Seed-based connectivity area was calculated for each seed by counting all pixels that showed a positive correlation with that seed and expressed as the number of pixels. The area of positive connectivity between each of the 4 seeds and ipsilateral (intrahemispheric) or contralateral hemisphere (interhemispheric) are shown at baseline (B) and 24 h after L-NIO injection. Each symbol represents an animal. Paired t-test. The sham group is shown in Supplementary Figure 3.
Next, we examined the neurological deficits at various time points using a wide array of sensorimotor and cognitive tests in separate cohorts of mice with the identical vehicle and L-NIO injections (Fig. 6). Although there were subtle changes in some tests of sensorimotor function (e.g., grid walk, wire grip), none reached statistical significance between sham and lesion groups. Similarly, tests of learning and memory also failed to show a change.
Figure 6 .
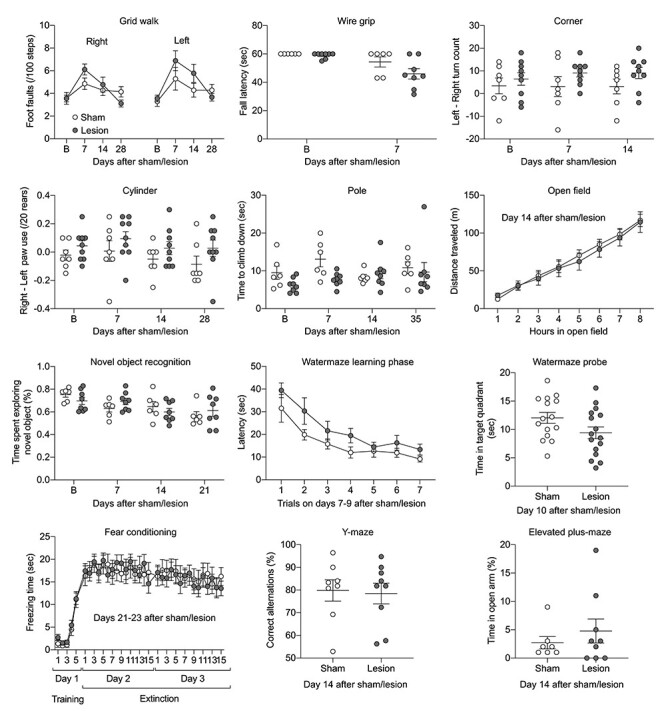
Neurological deficits. Twelve different neurological tests to examine sensorimotor and cognitive function in sham (open circles) and lesion (filled circles) groups. The time points of examination are indicated on each panel. Groups did not differ statistically in any of the tests. Sample sizes were (sham and lesion, respectively): grid walk 7 and 9, wire grip 6 and 8, corner 7 and 9, cylinder 7 and 9, pole 6 and 8, open field 7 and 9, novel object recognition 6 and 8, water maze 15 and 16, fear conditioning 13 and 15, Y maze 8 and 9, and elevated plus maze 7 and 9. Mean ± standard error. Two-way ANOVA for repeated measures and t-test.
Lastly, we examined the effect of L-NIO on cerebral blood flow to confirm its presumed ischemic mechanism of action (Fig. 7). Topical application of L-NIO (100 mM) onto the cortex through an open cranial window induced gradual but potent hypoperfusion; within 60 min, cortical blood flow decreased by more than 60%. Vehicle (saline) application on the other hemisphere did not cause hypoperfusion to a significant degree. Systemic blood pressure did not significantly change during the recordings.
Figure 7 .
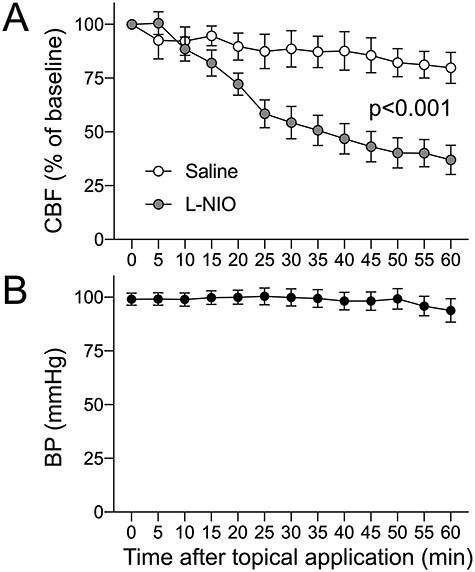
Cortical blood flow changes after topical L-NIO application. Topical application of L-NIO on an open cranial window decreased cortical blood flow by more than 60% as measured by LDF for 60 min. Systemic blood pressure did not change. Mean ± standard error. Two-way ANOVA for repeated measures.
Discussion
Here, we show that a small but strategically placed unilateral lesion in subcortical white matter causes widespread disruption of “interhemispheric” RSFC examined using IOS. The average connectivity in the sensorimotor cortices decreased by 25–50% compared with baseline, while the visual cortex was relatively spared. Data also show impaired “intrahemispheric” connectivity for ipsilesional motor and visual cortices. Importantly, disruption of RSFC lasted at least 2 weeks, when our behavioral tests failed to reveal deficits. Altogether, these data suggest that RSFC using IOS can be a useful functional complement to behavioral tests after a subcortical white matter lesion.
The widespread disruption of interhemispheric connectivity from the motor cortex to the whisker barrel cortex by a focal lesion was congruent with the topology of transcallosal fibers (Zhou et al. 2013). Because the lesion spanned the entire dorsoventral thickness of the lateral corpus callosum, it disrupted the axons connecting not only the cortex overlying the lesion but also more lateral regions. Since the posterior corpus callosum was spared, connectivity between the homotopic visual cortices was relatively preserved. The latter was consistent with previous work using an endovascular middle cerebral artery occlusion model in mice where only the largest infarcts caused a loss of homotopic connectivity in the visual cortex (Bauer et al. 2014). Of note, we did not find a strong correlation between the lesion volume at 1 month and loss of interhemispheric homotopic connectivity at 14 days in our model. We believe the main reason for this was rather consistent lesion volumes in our model (i.e., a lack of spread; Fig. 1). One prior study that found a correlation between lesion volumes and RSFC used middle cerebral artery occlusion where lesion volumes ranged 7-169 mm3 (Bauer et al. 2014). Moreover, corpus callosum lesions, even when small, may have a large impact on interhemispheric homotopic connectivity, possibly creating a floor effect (i.e., larger lesions do not decrease RSFC further).
Interestingly, the “spatial extent” of intrahemispheric connectivity (i.e., the number of pixels with a positive correlation coefficient) appeared to increase for ipsilesional and contralesional motor cortex, ipsilesional whisker barrel cortex, and cortex overlying the white matter lesion. Similar observations have been reported after callosectomy in monkeys (O'Reilly et al. 2013) and humans (Roland et al. 2017) and after stroke in humans (Siegel et al. 2016). Enhanced intrahemispheric connectivity has also been reported in the contralesional hemisphere after large middle cerebral artery infarcts in the rat (van Meer et al. 2010). Although we do not have a neurobiological explanation for our observation, these data implicate interhemispheric disconnection as one mechanism. It should be noted, however, that the differences in the methodology (i.e., fMRI), the lesion (i.e., callosectomy or large hemispheric infarct), and the study design make these comparisons remote at best. Alternatively, increased area of positive intrahemispheric connectivity may simply be an artifact due to smaller IOS transients after L-NIO injection diminishing the negative bias introduced by the global signal regression, as described previously (Desjardins et al. 2001; White et al. 2011; Bauer et al. 2014; Kura et al. 2018; Xie et al. 2019). This, however, is unlikely given the absence of a consistent change in the amplitude of resting state IOS signal fluctuations (Supplementary Fig. 4).
Modeling focal white matter stroke in mice has been challenging. Stereotactic microinjection of vasoconstrictors, such as endothelin-1 (ET-1) and L-NIO, into subcortical white matter tracks, has been commonly used (Sozmen et al. 2012). In our hands, L-NIO appears to yield more consistent lesions than ET-1 in mice (Blasi et al. 2014), in part due to lower ET-1 efficacy in this species (Wang et al. 2007). Here, we also showed that L-NIO reduces CBF by more than 60% upon topical application on the pial surface at the same concentration injected into the corpus callosum, which is likely sufficient to cause infarction. In contrast, striatal injection of ET-1 has been shown to reduce CBF by only ∼40% (Hughes et al. 2003).
In pilot studies, we tested various L-NIO doses and chose 0.24 μmole that yielded reproducible lesion volumes. Although this dose was higher than previous studies (0.05-0.066 μmole) (Rosenzweig and Carmichael 2013; Sozmen et al. 2016), our lesions were strictly limited to the corpus callosum at 1 month (Fig. 1C). When examined at 24 h, lesion volumes were much larger than 1 month and ostensibly encroached into the overlying cortex and underlying striatum, likely reflecting significant edema and swelling in the white matter lesion at this early time point, because 1 month later lesions did not involve either structure. Severe edema may have affected the functional connectivity at 24 h; however, RSFC did not improve at 14 days, when edema is expected to have resolved. On the contrary, RSFC further declined at this late time point, although changes in the optical properties of the skull after the initial imaging may have contributed because sham groups also showed some between 1 and 14 days. A smaller dose (0.04 μmole) yielded much smaller infarcts (0.03 ± 0.004 mm3 at 1 month) and did not consistently disrupt RSFC in our hands (data not shown), suggesting dose-dependency. Differences in the number and location of focal injections and histological stains precluded direct comparison of our lesion volumes with previous work (Rosenzweig and Carmichael 2013).
Our study also has limitations. First, instead of directly measuring neural activity we used hemodynamic IOS as a surrogate. However, RSFC by hemodynamic IOS correlates well with the RSFC imaged by neuronal Ca2+ dynamics using fluorescent indicator GCaMP (Ma et al. 2016; Mateo et al. 2017b). Moreover, the latter requires a transgenic approach making it less widely applicable. Because pial vasculature was not involved in the lesion and the loss of RSFC was not limited to the cortex overlying the lesion, we do not think our corpus callosum lesion induction caused cortical vasomotor dysfunction to confound the RSFC measurements by hemodynamic IOS. In support of this, neither sham nor lesioned cohorts showed a significant change in the average power of regressed global IOS fluctuations during each imaging session (Supplementary Fig. 4). Second, we could only obtain RSFC imaging 1 and 14 days after L-NIO injection because repeated skull exposures for transcranial imaging caused granulation tissue formation with hypervascularity over time, leading to excessive bleeding during scalp reflection deteriorating the field of view in subsequent imaging attempts. Nevertheless, our study achieved its primary goal to provide proof of concept for the utility of RSFC to demonstrate disruption of cortical connectivity upon a focal white matter lesion. Third, we did not examine the neurological deficits at this acute stage as they could be confounded by the surgical procedures and repeated anesthesia for imaging. Future work will address the technical issues with longitudinal RSFC imaging over days and weeks, and correlate the loss of connectivity with lesion localization and neurological function, toward a model in which neurorestorative therapies can be studied. Fourth, cerebral blood flow measurements were obtained from the cortex after topical application rather than the white matter after stereotaxic L-NIO injection for technical reasons. Of course, the effect of topical L-NIO on cortical CBF may not accurately reflect the effect of L-NIO injected into the deep white matter. However, we believe that the cortical hypoperfusion response to L-NIO provides sufficient evidence to support an ischemic mechanism for the lesions.
Despite a substantial loss of RSFC on imaging, a large battery of behavioral tests failed to detect deficits in our hands. Although leukoaraiosis has been associated with decreased functional connectivity on fMRI in humans (Zhu et al. 2020), subcortical white matter strokes often cause subtle neurological deficits that become clinically detectable only as lesion burden increases over time (Marin and Carmichael 2018). Indeed, previous experimental studies using focal callosal lesions also yielded subtle behavioral deficits that were difficult to detect in young adult mice. For example, L-NIO injection into the corpus callosum did not cause any impairment in grid-walk (i.e., foot-fault) test, whereas pasta matrix reach test was only mildly impaired compared with sham in young adult mice (Rosenzweig and Carmichael 2013). Similarly, endothelin-1 injection into the corpus callosum did not affect performance in the cylinder, grid-walk, locomotor activity, Morris water maze, and Y-maze tests compared with sham in mice; only novel object recognition test revealed deficits in that study (Blasi et al. 2014).
In summary, our data show that RSFC imaging can be used to quantify the disruption of interhemispheric and intrahemispheric connectivity after a corpus callosum lesion. The technique provides a simple index of connectivity congruent with known callosal connections and can be an adjunct to behavioral readouts after small callosal lesions.
Supplementary Material
Contributor Information
Sanem A Aykan, Neurovascular Research Unit, Department of Radiology, Massachusetts General Hospital, Harvard Medical School, Boston 02129, USA.
Hongyu Xie, Neurovascular Research Unit, Department of Radiology, Massachusetts General Hospital, Harvard Medical School, Boston 02129, USA; Department of Rehabilitation, Huashan Hospital, Fudan University, Shanghai 200040, China.
James Han Lai, Neurovascular Research Unit, Department of Radiology, Massachusetts General Hospital, Harvard Medical School, Boston 02129, USA.
Yi Zheng, Neurovascular Research Unit, Department of Radiology, Massachusetts General Hospital, Harvard Medical School, Boston 02129, USA.
David Y Chung, Neurovascular Research Unit, Department of Radiology, Massachusetts General Hospital, Harvard Medical School, Boston 02129, USA; Division of Neurocritical Care, Department of Neurology, Massachusetts General Hospital, Boston, MA 02114, USA.
Sreekanth Kura, Neurophotonics Center, Department of Biomedical Engineering, Boston University, Boston, MA 02215, USA.
Maryam Anzabi, Neurovascular Research Unit, Department of Radiology, Massachusetts General Hospital, Harvard Medical School, Boston 02129, USA.
Kazutaka Sugimoto, Neurovascular Research Unit, Department of Radiology, Massachusetts General Hospital, Harvard Medical School, Boston 02129, USA.
Lauren M McAllister, Department of Pediatric Neurology, Yale New Haven Hospital, Connecticut 06510, USA.
M Abbas Yaseen, Athinoula A. Martinos Center for Biomedical Imaging, Department of Radiology, Massachusetts General Hospital, Charlestown, MA, USA.
David A Boas, Neurophotonics Center, Department of Biomedical Engineering, Boston University, Boston, MA 02215, USA; Athinoula A. Martinos Center for Biomedical Imaging, Department of Radiology, Massachusetts General Hospital, Charlestown, MA, USA.
Michael J Whalen, Neuroscience Center, Massachusetts General Hospital, Charlestown, MA 02129, USA.
Sava Sakadzic, Athinoula A. Martinos Center for Biomedical Imaging, Department of Radiology, Massachusetts General Hospital, Charlestown, MA, USA.
Cenk Ayata, Neurovascular Research Unit, Department of Radiology, Massachusetts General Hospital, Harvard Medical School, Boston 02129, USA; Stroke Service, Department of Neurology, Massachusetts General Hospital, Boston, MA 02215, USA.
Notes
Conflict of Interest: None declared.
Funding
National Institutes of Health (P01NS055104 to C.A.)
References
- Alawdi SH, El-Denshary ES, Safar MM, Eidi H, David MO, Abdel-Wahhab MA. 2017. Neuroprotective effect of nanodiamond in Alzheimer's disease rat model: a pivotal role for modulating NF-κB and STAT3 signaling. Mol Neurobiol. 54:1906–1918. [DOI] [PubMed] [Google Scholar]
- André C, Dinel AL, Ferreira G, Layé S, Castanon N. 2014. Diet-induced obesity progressively alters cognition, anxiety-like behavior and lipopolysaccharide-induced depressive-like behavior: focus on brain indoleamine 2,3-dioxygenase activation. Brain Behav Immun. 41:10–21. [DOI] [PubMed] [Google Scholar]
- Bailey EL, Smith C, Sudlow CL, Wardlaw JM. 2012. Pathology of lacunar ischemic stroke in humans--a systematic review. Brain Pathol. 22:583–591. [DOI] [PMC free article] [PubMed] [Google Scholar]
- Bauer AQ, Kraft AW, Wright PW, Snyder AZ, Lee JM, Culver JP. 2014. Optical imaging of disrupted functional connectivity following ischemic stroke in mice. Neuroimage. 99:388–401. [DOI] [PMC free article] [PubMed] [Google Scholar]
- Bermpohl D, You Z, Korsmeyer SJ, Moskowitz MA, Whalen MJ. 2006. Traumatic brain injury in mice deficient in bid: effects on histopathology and functional outcome. J Cereb Blood Flow Metabo. 26:625–633. [DOI] [PubMed] [Google Scholar]
- Blasi F, Wei Y, Balkaya M, Tikka S, Mandeville JB, Waeber C, Ayata C, Moskowitz MA. 2014. Recognition memory impairments after subcortical white matter stroke in mice. Stroke. 45:1468–1473. [DOI] [PubMed] [Google Scholar]
- Carter AR, Astafiev SV, Lang CE, Connor LT, Rengachary J, Strube MJ, Pope DL, Shulman GL, Corbetta M. 2010. Resting interhemispheric functional magnetic resonance imaging connectivity predicts performance after stroke. Ann Neurol. 67:365–375. [DOI] [PMC free article] [PubMed] [Google Scholar]
- Corbetta M. 2012. Functional connectivity and neurological recovery. Dev Psychobiol. 54:239–253. [DOI] [PubMed] [Google Scholar]
- de Leeuw FE, de Groot JC, Oudkerk M, Witteman JC, Hofman A, van Gijn J, Breteler MM. 2002. Hypertension and cerebral white matter lesions in a prospective cohort study. Brain. 125:765–772. [DOI] [PubMed] [Google Scholar]
- DeCarli C, Fletcher E, Ramey V, Harvey D, Jagust WJ. 2005. Anatomical mapping of white matter hyperintensities (WMH): exploring the relationships between periventricular WMH, deep WMH, and total WMH burden. Stroke. 36:50–55. [DOI] [PMC free article] [PubMed] [Google Scholar]
- Desjardins AE, Kiehl KA, Liddle PF. 2001. Removal of confounding effects of global signal in functional MRI analyses. Neuroimage. 13:751–758. [DOI] [PubMed] [Google Scholar]
- Dilekoz E, Houben T, Eikermann-Haerter K, Balkaya M, Lenselink AM, Whalen MJ, Spijker S, Ferrari MD, van den Maagdenberg AM, Ayata C. 2015. Migraine mutations impair hippocampal learning despite enhanced long-term potentiation. J Neurosci. 35:3397–3402. [DOI] [PMC free article] [PubMed] [Google Scholar]
- Eggebrecht AT, Ferradal SL, Robichaux-Viehoever A, Hassanpour MS, Dehghani H, Snyder AZ, Hershey T, Culver JP. 2014. Mapping distributed brain function and networks with diffuse optical tomography. Nat Photonics. 8:448–454. [DOI] [PMC free article] [PubMed] [Google Scholar]
- Hakon J, Quattromani MJ, Sjolund C, Tomasevic G, Carey L, Lee JM, Ruscher K, Wieloch T, Bauer AQ. 2018. Multisensory stimulation improves functional recovery and resting-state functional connectivity in the mouse brain after stroke. Neuroimage Clin. 17:717–730. [DOI] [PMC free article] [PubMed] [Google Scholar]
- He BJ, Snyder AZ, Vincent JL, Epstein A, Shulman GL, Corbetta M. 2007. Breakdown of functional connectivity in frontoparietal networks underlies behavioral deficits in spatial neglect. Neuron. 53:905–918. [DOI] [PubMed] [Google Scholar]
- Hinman JD, Rasband MN, Carmichael ST. 2013. Remodeling of the axon initial segment after focal cortical and white matter stroke. Stroke. 44:182–189. [DOI] [PMC free article] [PubMed] [Google Scholar]
- Hughes PM, Anthony DC, Ruddin M, Botham MS, Rankine EL, Sablone M, Baumann D, Mir AK, Perry VH. 2003. Focal lesions in the rat central nervous system induced by endothelin-1. J Neuropathol Exp Neurol. 62:1276–1286. [DOI] [PubMed] [Google Scholar]
- Kura S, Xie H, Fu B, Ayata C, Boas DA, Sakadzic S. 2018. Intrinsic optical signal imaging of the blood volume changes is sufficient for mapping the resting state functional connectivity in the rodent cortex. J Neural Eng. 15:035003. [DOI] [PMC free article] [PubMed] [Google Scholar]
- Leuchter AF, Dunkin JJ, Lufkin RB, Anzai Y, Cook IA, Newton TF. 1994. Effect of white matter disease on functional connections in the aging brain. J Neurol Neurosurg Psychiatry. 57:1347–1354. [DOI] [PMC free article] [PubMed] [Google Scholar]
- Ma Y, Shaik MA, Kozberg MG, Kim SH, Portes JP, Timerman D, Hillman EM. 2016. Resting-state hemodynamics are spatiotemporally coupled to synchronized and symmetric neural activity in excitatory neurons. Proc Natl Acad Sci U S A. 113:E8463–e8471. [DOI] [PMC free article] [PubMed] [Google Scholar]
- Marin MA, Carmichael ST. 2018. Stroke in CNS white matter: Models and mechanisms. Neurosci Lett. 684:193–199. [DOI] [PMC free article] [PubMed] [Google Scholar]
- Mateo C, Knutsen PM, Tsai PS, Shih AY, Kleinfeld D. 2017a. Entrainment of arteriole vasomotor fluctuations by neural activity is a basis of blood-oxygenation-level-dependent "resting-state" connectivity. Neuron. 96:936, e933–948. [DOI] [PMC free article] [PubMed] [Google Scholar]
- Mateo C, Knutsen PM, Tsai PS, Shih AY, Kleinfeld D. 2017b. Entrainment of arteriole vasomotor fluctuations by neural activity is a basis of blood-oxygenation-level-dependent "resting-state" connectivity. Neuron. 96. e933:936–948. [DOI] [PMC free article] [PubMed] [Google Scholar]
- Matsuura K, Kabuto H, Makino H, Ogawa N. 1997. Pole test is a useful method for evaluating the mouse movement disorder caused by striatal dopamine depletion. J Neurosci Methods. 73:45–48. [DOI] [PubMed] [Google Scholar]
- Nasiriavanaki M, Xia J, Wan H, Bauer AQ, Culver JP, Wang LV. 2014. High-resolution photoacoustic tomography of resting-state functional connectivity in the mouse brain. Proc Natl Acad Sci U S A. 111:21–26. [DOI] [PMC free article] [PubMed] [Google Scholar]
- O'Reilly JX, Croxson PL, Jbabdi S, Sallet J, Noonan MP, Mars RB, Browning PG, Wilson CR, Mitchell AS, Miller KL, et al. 2013. Causal effect of disconnection lesions on interhemispheric functional connectivity in rhesus monkeys. Proc Natl Acad Sci U S A. 110:13982–13987. [DOI] [PMC free article] [PubMed] [Google Scholar]
- Patel R, Moore S, Crawford DK, Hannsun G, Sasidhar MV, Tan K, Molaie D, Tiwari-Woodruff SK. 2013. Attenuation of corpus callosum axon myelination and remyelination in the absence of circulating sex hormones. Brain Pathol. 23:462–475. [DOI] [PMC free article] [PubMed] [Google Scholar]
- Paxinos G. 2001. The mouse brain in stereotaxic coordinates. San Diego, Calif: Academic. [Google Scholar]
- Potter GM, Marlborough FJ, Wardlaw JM. 2011. Wide variation in definition, detection, and description of lacunar lesions on imaging. Stroke. 42:359–366. [DOI] [PubMed] [Google Scholar]
- Rehme AK, Volz LJ, Feis DL, Eickhoff SB, Fink GR, Grefkes C. 2015. Individual prediction of chronic motor outcome in the acute post-stroke stage: Behavioral parameters versus functional imaging. Human Brain Mapp. 36:4553–4565. [DOI] [PMC free article] [PubMed] [Google Scholar]
- Roland JL, Snyder AZ, Hacker CD, Mitra A, Shimony JS, Limbrick DD, Raichle ME, Smyth MD, Leuthardt EC. 2017. On the role of the corpus callosum in interhemispheric functional connectivity in humans. Proc Natl Acad Sci U S A. 114:13278–13283. [DOI] [PMC free article] [PubMed] [Google Scholar]
- Rosenzweig S, Carmichael ST. 2013. Age-dependent exacerbation of white matter stroke outcomes: a role for oxidative damage and inflammatory mediators. Stroke. 44:2579–2586. [DOI] [PMC free article] [PubMed] [Google Scholar]
- Siegel JS, Ramsey LE, Snyder AZ, Metcalf NV, Chacko RV, Weinberger K, Baldassarre A, Hacker CD, Shulman GL, Corbetta M. 2016. Disruptions of network connectivity predict impairment in multiple behavioral domains after stroke. Proc Natl Acad Sci U S A. 113:E4367–E4376. [DOI] [PMC free article] [PubMed] [Google Scholar]
- Sozmen EG, Hinman JD, Carmichael ST. 2012. Models that matter: white matter stroke models. Neurotherapeutics. 9:349–358. [DOI] [PMC free article] [PubMed] [Google Scholar]
- Sozmen EG, Rosenzweig S, Llorente IL, DiTullio DJ, Machnicki M, Vinters HV, Havton LA, Giger RJ, Hinman JD, Carmichael ST. 2016. Nogo receptor blockade overcomes remyelination failure after white matter stroke and stimulates functional recovery in aged mice. Proc Natl Acad Sci U S A. 113:E8453–E8462. [DOI] [PMC free article] [PubMed] [Google Scholar]
- Tamura Y, Araki A. 2015. Diabetes mellitus and white matter hyperintensity. Geriatrics & Gerontology International. 15:34–42. [DOI] [PubMed] [Google Scholar]
- Tanaka-Arakawa MM, Matsui M, Tanaka C, Uematsu A, Uda S, Miura K, Sakai T, Noguchi K. 2015. Developmental changes in the corpus callosum from infancy to early adulthood: a structural magnetic resonance imaging study. PLoS ONE. 10(3):1–13. e0118760. [DOI] [PMC free article] [PubMed] [Google Scholar]
- van der Knaap LJ, van der Ham IJ. 2011. How does the corpus callosum mediate interhemispheric transfer? A review. Behav Brain Res. 223:211–221. [DOI] [PubMed] [Google Scholar]
- van Meer MP, van der Marel K, Wang K, Otte WM, El Bouazati S, Roeling TA, Viergever MA, Berkelbach van der Sprenkel JW, Dijkhuizen RM. 2010. Recovery of sensorimotor function after experimental stroke correlates with restoration of resting-state interhemispheric functional connectivity. J Neurosci. 30:3964–3972. [DOI] [PMC free article] [PubMed] [Google Scholar]
- Vermeer SE, Longstreth WT Jr, Koudstaal PJ. 2007. Silent brain infarcts: a systematic review. Lancet Neurol. 6:611–619. [DOI] [PubMed] [Google Scholar]
- Wang Y, Jin K, Greenberg DA. 2007. Neurogenesis associated with endothelin-induced cortical infarction in the mouse. Brain Res. 1167:118–122. [DOI] [PMC free article] [PubMed] [Google Scholar]
- Wardlaw JM, Valdes Hernandez MC, Munoz-Maniega S. 2015. What are white matter hyperintensities made of? Relevance to vascular cognitive impairment. J Am Heart Associat. 4:001140. [DOI] [PMC free article] [PubMed] [Google Scholar]
- White BR, Bauer AQ, Snyder AZ, Schlaggar BL, Lee JM, Culver JP. 2011. Imaging of functional connectivity in the mouse brain. PLoS ONE. 6:e16322. [DOI] [PMC free article] [PubMed] [Google Scholar]
- Wise SP. 1975. The laminar organization of certain afferent and efferent fiber systems in the rat somatosensory cortex. Brain Res. 90:139–142. [DOI] [PubMed] [Google Scholar]
- Wu L, Chung JY, Saith S, Tozzi L, Buckley EM, Sanders B, Franceschini MA, Lule S, Izzy S, Lok J, et al. 2019. Repetitive head injury in adolescent mice: A role for vascular inflammation. J Cereb Blood Flow Metab. 39:2196–2209. [DOI] [PMC free article] [PubMed] [Google Scholar]
- Xie H, Chung DY, Kura S, Sugimoto K, Aykan SA, Wu Y, Sakadzic S, Yaseen MA, Boas DA, Ayata C. 2019. Differential effects of anesthetics on resting state functional connectivity in the mouse. J Cereb Blood Flow Metab. 40(4):875–884. [DOI] [PMC free article] [PubMed] [Google Scholar]
- Zhang L, Schallert T, Zhang ZG, Jiang Q, Arniego P, Li Q, Lu M, Chopp M. 2002. A test for detecting long-term sensorimotor dysfunction in the mouse after focal cerebral ischemia. J Neurosci Methods. 117:207–214. [DOI] [PubMed] [Google Scholar]
- Zhou J, Wen Y, She L, Sui YN, Liu L, Richards LJ, Poo MM. 2013. Axon position within the corpus callosum determines contralateral cortical projection. Proc Natl Acad Sci U S A. 110:E2714–E2723. [DOI] [PMC free article] [PubMed] [Google Scholar]
- Zhu Y, Lu T, Xie C, Wang Q, Wang Y, Cao X, Su Y, Wang Z, Zhang Z. 2020. Functional disorganization of small-world brain networks in patients with ischemic leukoaraiosis. Front Aging Neurosci. 12:203. [DOI] [PMC free article] [PubMed] [Google Scholar]
Associated Data
This section collects any data citations, data availability statements, or supplementary materials included in this article.