Abstract
Extracellular vesicles (EVs) and cell-derived vesicles (CDVs), generated by fragmenting cellular membranes, have both been explored as therapeutic delivery vehicles. Surface proteins on these vesicles are of great importance as they are characteristic to the cell of origin and modulate vesicle interactions with target cells. Here we introduced a high throughput fluorescence correlation spectroscopy (ht-FCS) approach capable of characterizing vesicle surface proteins across a large number of samples. We used automated screening and acquisition of FCS data to profile surface proteins of cell-derived vesicles with high fidelity based on changes in diffusion time upon antibody-vesicle interactions. We characterized vesicles generated from 4 cell types using antibodies for known exosome biomarkers. The ht-FCS technique presented here offers the capability to screen EVs or cell derived vesicles against a library of surface markers or to screen a library of cell-derived vesicles for a specific identifying marker at a high speed.
Keywords: FCS, cell-derived vesicles, surface protein composition, high throughput screening
Introduction
Extracellular vesicles (EVs) secreted by cells into the extracellular domain, serve as natural nanoscale delivery systems for biological systems to transport cargo (e.g. lipids, proteins, RNA) between cells. For example, these endogenous vesicles have been implicated in cancer progression and metastasis by transferring bioactive molecules [1,2]. EVs also play a role in cell-cell communication by initiating signaling cascades in target cells [3]. Because of these traits, endogenous vesicles along with synthetic vesicles (liposomes and cell-derived vesicles) are being harnessed for the development of new therapeutic delivery vehicles [4,5]. Both natural and artificial vesicles composed of cellular membranes have proven to be stable, biocompatible, and able to deliver a wide range of therapeutic cargo [6,7,5]. One of the primary barriers to identifying and characterizing EVs is that they often exist in complex heterogeneous mixtures derived from a variety of cell types. While many surface proteins are similar across most EVs and cell-derived vesicles (CDVs), others are characteristic for vesicles derived from specific cell types [8-10]. These membrane proteins are believed to provide EVs and CDVs with the capability to recognize recipient target cells from the diverse and heterogeneous mixture of EVs and cell types within a biological system [11]. Characterizing unique surface proteins could be used as a method to screen and identify EV and CDV populations [12].
CDVs, artificially generated from the membranes of organelles within the cell, have shown similar properties (size, targeting, surface proteins) to those seen for EVs [5,13-15]. Current analysis methods to identify vesicle surface proteins are low throughput and struggle to distinguish heterogeneities that could be used to assign the cell of origin. Identification of the composition of surface proteins of EVs and CDVs would provide the capability to identify different vesicle species. Existing technologies utilized for vesicles characterization include e flow cytometry [16], western blotting [17], and mass spectrometry [18]. Each of these methodologies suffer from limitations in measuring heterogenous mixtures of vesicles including low sensitivity, low throughput, and averaging over the entire population of vesicles. A comparison of these techniques for EV studies is shown in the Electronic Supplementary Material (ESM) Table S1.
Fluorescence correlation spectroscopy (FCS) is a well-established technique based on the analysis of the fluctuation of fluorescent signals resulting from the diffusion of labeled molecules moving through a confocal detection volume [19-21]. These fluctuations can be used to determine the number, molecular brightness, and diffusion coefficient of fluorescently labeled biomolecules. Additionally, FCS measurements can be applied to study the dynamics of molecular interactions between biomolecules. Therefore, FCS can be used to not only measure the size, diffusion properties, and absolute concentration of vesicles, but also evaluate the binding of specific antibodies to vesicles [22]. This provides the capability to identify the number of specific exosome populations within a heterogeneous mixture by FCS.
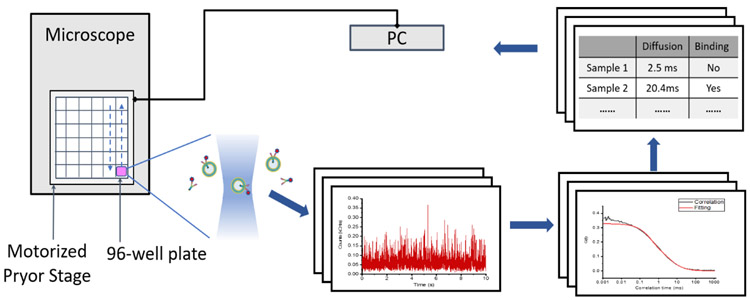
FCS measurements, however, are traditionally based on a manual workflow of data acquisition leading to relatively low throughput analysis due to samples needing to be replaced after each acquisition. Recently, high throughput FCS approach has been used to monitor the diffusion of biomolecules in different subcellular regions [23,24]. Our studies extend high throughput FCS for the characterization of vesicles and for use as a high throughput screening assay. Here, we utilize a high-throughput screening FCS (ht-FCS) approach that allows automatic screening of numerous samples within in a well plate (e.g. 96 wells). This allowed for rapid characterization of vesicle surface components and was used to assign vesicle cellular identity (Figure 1). CDVs were generated from a series of different cell lines and screened against exosome marker antibodies to identify surface protein species. We developed software and hardware platforms to scan multiple wells automatically allowing us to screen several antibodies against each vesicle type. The combination of high-throughput screening and FCS enables fast acquisition times, analysis of the size distribution of cell-derived vesicles from different cell sources, the identification of the cell of origin, and the relative level of surface protein expression.
Figure 1.
Schematic of High-throughput Fluorescence Correlation Spectroscopy workflow.
Methods
Cell Culture
Human lung cancer (A549) cells, human embryonic kidney 293 (HEK293) cells, neuroblastoma 2a (N2A) cells and macrophage-like (RAW264.7) cells were purchased from American Type Culture Collection (ATCC) and cultured using standard tissue culture techniques. A549 cells and HEK293 cells were grown in growth media consisting of Dulbecco’s Modified Eagle Medium (DMEM), supplemented with 10% fetal bovine serum (FBS), 1% penicillin/streptomycin. N2A cells were cultured in DMEM and Opti-MEM growth media supplied with 10% FBS and 1% penicillin/streptomycin. RAW 264.7 cells were cultured in Roswell Park Memorial Institute (RPMI) 1640 medium supplemented with 10% FBS and 1% penicillin/streptomycin. DMEM, Opti-MEM, RPMI, FBS, and penicillin/streptomycin were purchased from VWR (Pennsylvania, USA). All types of cells were maintained in atmosphere of 5% CO2 in a humidified incubator at 37°C. Cells were passaged after reaching 90% confluence, detached with cell scraper to generate vesicles.
Vesicle Isolation
We generated vesicles through nitrogen cavitation[25,26]. Cells were scraped from T75 flasks in 5mL sucrose buffer solution (250 mM sucrose, 10 mM HEPES, pH 7.5, and protease inhibitors (Roche)). All of the cell slurry was collected and centrifuged at 200xg for 5 min to pellet the cells. The cell pellet was resuspended in 5 mL sucrose-HEPES buffer. Then vesicles were generated using nitrogen cavitation with a pressure of 250 psi for 5 minutes. Cell lysate was collected and centrifuged at 4,000xg at 4 °C for 10 minutes to remove the pelleted nuclear fraction. Supernatant was collected and centrifuged at 10,000xg for 20 minutes at 4 °C. The pellet was discarded, and supernatant was subjected to ulta-centrifugation at 100,000x g for 1 hour at 4°C. This yielded a pellet containing vesicles which was resuspended in 1x PBS buffer and stored at −80 °C until use.
Dynamic Light Scattering
For the DLS measurements, a ZetaPALS Potential Analyzer (Brookhaven Instruments, Holtsville, NY) with a 658 nm (29 mW) helium-neon laser was used to determine average hydrodynamic diameters of vesicles from different cell types. Vesicles were prepared as described above and then filtered by a standard syringe filter (0.45 μm). 1 mL of each sample were measured in triplicate in a plastic cuvette at 90°. All measurements were carried out at 25 °C. Results are presented as mean +/− standard deviation.
Vesicle Labeling
To fluorescently label vesicles, 5μM DiI was added to the vesicle resuspension and incubated at 37 °C for 40 minutes. Then vesicles were purified using a 0.45 μm corning sterile syringe filter to remove larger debris. The vesicles were further purified by using a 5000 molecular weight cutoff size exclusion column (PD Minitrap G25, GE Healthcare) to remove spare free dye.
To determine vesicle surface components, 5 different antibodies were- used- anti-CD9 antibody, anti-CD63 antibody, anti-CD81 antibody, anti-Hsp70 antibody, and anti-Alix antibody (BioLegand). Each was labeled with CF543 dye using antibody labeling kits (Mix-n-Stain, Biotium) before being added to the vesicle resuspension. The antibody labeling protocol followed manufacturer instructions. Vesicle samples from the same type of cell were mixed and filtered with a 0.45 μm syringe filter. The filtered sample was then aliquoted. 0.5 μg/mL CF543 labeled antibody was added to each aliquoted sample and then incubated for 1 hour at room temperature. Vesicles were purified by using size exclusion column as described in the previous section.
Western Blot Analysis
Vesicle surface components were verified by western blotting analysis. Denatured vesicle resuspensions were loaded into a pre-packaged NuPAGE 4-12% Bis-Tris gel (Life Technologies). Bands were transferred to a nitrocellulose membrane after electrophoresis. The membrane was then blocked for 1 hour and incubated overnight with selected primary antibody at 4 °C. We used the following antibodies (in 1:1000 dilution): anti-CD9 (cat. 312102), anti-CD63 (cat. 353018), anti-CD81 (cat. 349502), anti-HSP70 (cat. 818101), anti-Alix (cat. 634502). All antibodies were from BioLegend, San Diego, CA. After rinsing and removal of the primary antibody, secondary antibody was added and incubated for 1 hour at room temperature. Then, the membranes were washed again, and bands were visualized by chemiluminescent detection (Clarity, Bio-Rad) using Chemi-Doc system (Bio-Rad).
Fluorescence Correlation Spectroscopy
FCS measurements were performed on a home-built microscope. Approximately, 40μl fresh prepared fluorescently labeled sample was placed onto a coverslip mounted on an Olympus IX83 microscope equipped with a PicoQuant PicoHarp 300 Time-Correlated Single Photon Counting (TCSPC) system. We employed a 532nm laser (45 μW) to excite the fluorescent labels and a 60x water immersion objective was used to focus this laser beam in the sample solution. Two avalanche photodiodes (APDs) were used for photon detection connected to a PicoHarp 300 TCSPC module controller. All FCS results are an average of at least 3 measurements, with sampling times of 40 s. To diminish the background signal from immobilized molecules, we performed all measurements 30μm above the glass surface in the sample solution.
For high-throughput screening application, a customized program was written to generate automatic continuous scanning of the system. A script was written in C++ using Visual Studio 2015 that controlled all hardware (e.g. prior motorized stage and Picoharp 300) within the system. The script can be accessed at https://bitbucket.org/ywsong2/uky_ptu_convert/src/master/. The system can be programmed with an input configuration file to move the stage in specific increments and patterns, to correlate stage dwell time in each well and photon time trace data collection (Picoharp 300) and collect and store photon arrival times for each data trace. This allowed automation of the FCS data collection across the entire well plate. For measurements, a glass bottom 96-well plate with fresh prepared samples (40μl each well) is loaded to the microscope. The motorized prior stage is initialized and moves based on the user defined configuration. An automatic immersion water supply device is equipped to replace the evaporating volume from the objective. All acquisitions of HT-FCS data were packed and processed to the SymPhoTime 64 (PicoQuant) for analysis.
Analysis of Fluorescence Correlation Spectroscopy
All data analysis was performed through SymPhoTime 64. After recording the fluctuations of the time versus fluorescence intensity trace, which recorded the diffusing fluorescent species in the detection volume, the autocorrelation function is applied and defined as following:
| (1) |
Where I(t) represent the intensity time trace with a unit of Hz. The brackets denote averaging over time. The autocorrelation data were further fitted with a triplet kinetics model (eq. 2) comprising one or two components:
| (2) |
Where τDiff is the diffusion time of the ith diffusing species in ms, and τTrip is the lifetime of the dark (triplet) state. nDiff represents number of independently diffusing species. ρ stands for the contribution of the ith diffusing species. κ is the length of diameter ratio of the focal volume. This fitting model allows us to extract the diffusion time and number of molecules (concentration) from FCS curves.
At the start of each acquisition, we used commercial 0.1 μm tetraspeck beads (Invitrogen) to calibrate the FCS focal volume by serial dilution of a known concentration of beads (1.8 x 10¹¹ particles/mL) combined with counting the number of molecules in the focal volume.
Results and Discussion
Verification of FCS for vesicle size measurements
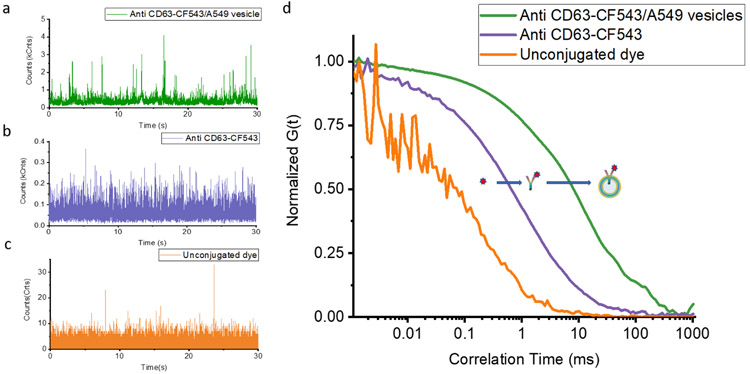
Binding of fluorescently labeled ligands to larger biomolecules can be monitored via FCS[27]. The diffusion time scales with the hydrodynamic radius and can be calculated from the autocorrelation of a fluorescence time trace of molecules freely diffusing in solution. As a ligand binds to a larger biomolecule, a characteristic shift is observed in the measured diffusion time. We compared diffusion times for unconjugated fluorophores, fluorescently labelled antibodies, and immunolabeled vesicles. As shown in the 30 sec segment of a fluorescence time traces in Figure 2, characteristic bursts in fluorescence intensity were observed which correspond to fluorescent molecules diffusing into the laser focal volume. The height of a burst, measured in photon counts, depends on the intensity of the fluorophore and the residence time inside the detection volume. From these fluorescence intensity time traces, auto-correlation functions (ACF) were used to evaluate the diffusion times and the number of molecules in solution. The normalized ACF G(τ) of free dye, labeled antibody, and vesicle bound antibody are shown in Figure 2d. For the unconjugated fluorophore, the fitted ACF yields a diffusion time (τD) of 0.21 ± 0.02 ms. A longer diffusion time of 1.1 ± 0.1 ms was observed for the CF-543 labeled Anti-CD63 antibody. The immunolabeled (anti-CD63-CF543 antibody) vesicles (A549) exhibited a diffusion time of 23 ± 2 ms. The clear shift of diffusion time from these three ACFs illustrates that we can use FCS to distinguish between antibodies freely diffusing and those bound to the surface of the vesicle.
Figure 2.
Demonstration of the ability of FCS to measure fluorescent molecules over a different size range. The recorded fluorescence fluctuations over time from immunofluorescently labeled A549 cell-derived vesicles (a), fluorescent antibody (b), and unconjugated dye(c). d is the corresponding measured normalized ACF curves from a, b, and c.
Size distributions of cell-derived vesicles with different origins
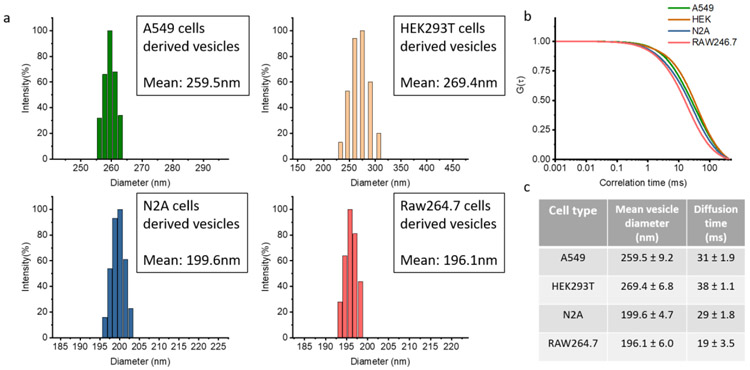
Vesicles derived from different types of cells often have different diameters, carry different cargo, and have differences in surface protein expression. We performed dynamic light scattering (DLS) analysis of four types of CDVs to determine their hydrodynamic diameters and then compared them to the diffusion time observed from FCS. Vesicles derived from cell lines, A549 (lung cancer cells), HEK293T (embryonic kidney cells), N2A (neuroblastoma cells), and Raw264.7 (macrophage-like cells), were generated by nitrogen cavitation and purified from cellular debris through several steps of centrifugation. DLS was used to measure the size distribution of each type of CDVs. Sizes ranged from 190 nm to 310 nm in diameter as shown in Figure 3. The DLS analysis clearly shows a difference in the size distributions across cell type used to generate the vesicles. Vesicles derived from HEK293 exhibited the largest diameter (269 nm) while those generated from Raw 264.7 had the smallest average diameter (196 nm).
Figure 3.
Size variance in different CDVs. a, Plots of size distributions from different cell-derived vesicles obtained by DLS. b, A shift of diffusion time analyzed by normalized autocorrelation functions measured by FCS. c, Table showing the size of cell-derived vesicles.
We next used FCS as a comparison measurement of relative vesicle size based on the observed diffusion time. We used the lipophilic fluorophore DiI to densely label the vesicle membrane. We recorded fluorescence intensity time traces and fit the resulting ACFs for vesicles derived from A549, HEK293, N2A, and Raw 264.7 cells which yielded diffusion times (τD) of 31 ± 2 ms, 38 ± 1 ms, 29 ± 2 ms, 19 ± 4 ms, respectively (Figure 3 b and c). This shift and the magnitude of the observed diffusion times agree with the DLS measurements we performed.
In addition to diffusion time, the average number of molecules within the focal volume can also be extracted. The FCS focal volume was calibrated using commercial 0.1μm tetraspeck beads with a known diffusion constant. This allowed us to determine the concentration of vesicles in solution. Based on the original dilution and the number of molecules in the focal volume we determined that 20 million A549 cells yielded ~0.7 x 10¹¹ vesicles per mL (0.5mL), 20 million HEK293 cells yielded ~1.3 x 10¹¹ vesicles per mL (0.5mL), 20 million N2A cells yielded of ~1.4 x 10¹¹ vesicles per mL, and 20 million RAW 264.7 cells generated 0.5 mL of ~1.1 x 10¹¹ vesicles per mL.
Establishing the high-throughput FCS measurements
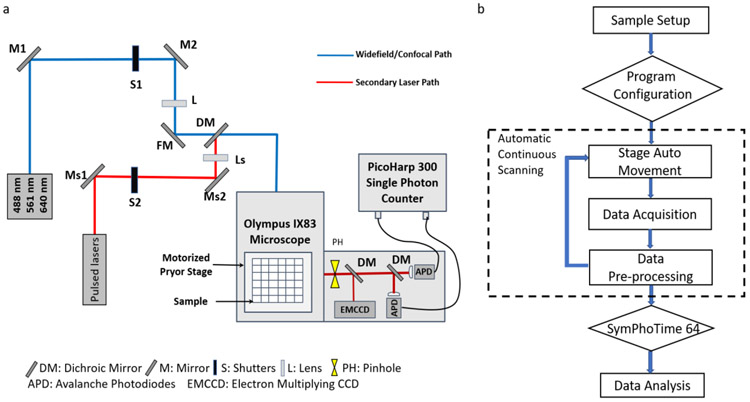
To establish the ht-FCS workflow, we designed and extended a custom FCS capable confocal microscope to enable automatic screening and data collection of multiple wells (Fig. 4a). Two laser pathways were aligned to provide pulsed laser and continuous wave (CW) laser as excitation sources. Laser light is directed through an objective to the sample and emitted fluorescence light is collected through the same objective and directed to two avalanche photodiodes (APD) after it passed through the confocal pinhole. The output from the APDs were directed to a TCSPC module (PicoHarp 300). The experimental workflow of high-throughput screening is shown in figure 4b. The custom designed program consisted of different modalities to perform programmed stage movements, time trace collection, and data storage. Each well of the plate were sequentially exposed to 532 nm CW laser excitation during data acquisition for a duration of 40 sec. Each collected time trace was assigned a unique identifier based on the well location in the plate for each sample.
Figure 4.
Schematic representation of the ht-FCS experiment setup and program workflow. a, The alignment of ht-FCS is based on a confocal microscopy and modified to fit several excitation sources. The single photon counter and high throughput screening devices are mounted on the instrument. b is the customized program workflow for high throughput screening process.
Having developed the pipeline for ht-FCS, we next demonstrated the utility of this technique by screening surface protein compositions of CDVs. Based on the exosome-like properties of cell derived vesicles, we screened for the presence of 5 established exosomal markers, including three transmembrane proteins from the tetraspanin family (CD9, CD63, and CD81), heat shock protein (HSP70), and cytosolic protein (Alix). These proteins are well-known in HEK cells, N2A cells, A549 cells and Raw 264.7 cell released exosomes. Antibodies for these surface proteins were labeled with the fluorescent dye CF-543. All antibodies were measured independently before being added to vesicles. The measured diffusion times from different antibodies give similar results (the diffusion time observed for the CF-543 labeled Anti-CD63 antibody was shown in the figure 2). Vesicle samples were aliquoted and immunolabeled with 500ng/ml for each fluorescently labeled antibody. A 5000 molecular weight cutoff size exclusion column was applied to purify the label vesicles from residual unconjugated fluorophores.
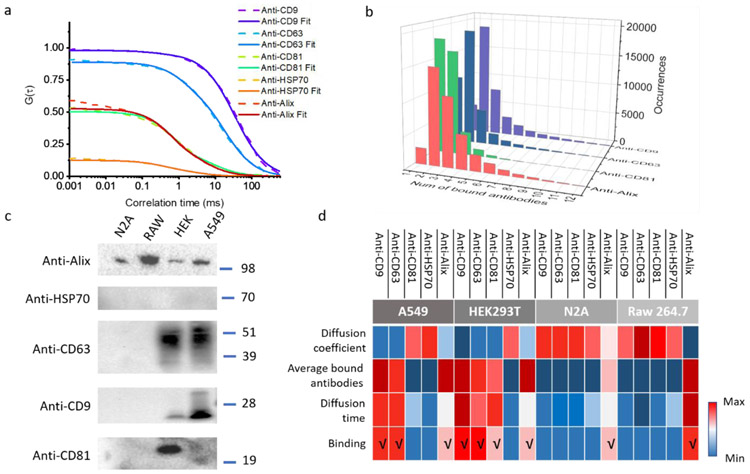
FCS autocorrelation curves from HEK cell-derived vesicles in response to each of the panel of antibodies are shown in figure 5a. The amplitude of the autocorrelation function (G(τ)) is inversely proportional to the number of molecules in the detection volume. The decays are determined by molecular size and diffusion rate. Thus, the variance in diffusion time and average molecular number shown in Figure 5a provides evidence of the capacity of FCS to detect the immunobinding of surface protein. The longer the diffusion time the better the binding efficiency of antibodies to vesicles. The exosomal markers from tetraspanin protein family, anti-CD 9 and anti-CD 63, exhibited similar binding level to vesicle surface components, whereas the expression level of CD 81 and cytosolic protein (Alix) were much lower. Interestingly, in contrast to exosomes shed by HEK 293 cells, there is totally inefficient binding of anti-HSP70 antibody to vesicles.
Figure 5.
ht-FCS studies of immunofluorescently labelled vesicles. a and b are results from 5 different antibodies labeled HEK cell derived vesicles. a, the experimental and fitted autocorrelation functions clearly show a difference in the diffusion time and thus show the expression level of different proteins in the vesicle surface. b, Histogram of the calculated number of bound antibodies per HEK cell derived vesicles. c, validation of selected exosomal marker proteins by immunoblotting. d, color table of antibody binding analysis among 4 different cell-derived vesicles.
To further quantify binding efficiency, the number of bound antibodies each vesicle was determined by calculating the mean fluorescence intensity burst height of free antibodies (see ESM and figure 5b) and then comparing to the value for antibody labeled vesicles. The height of fluorescence bursts scales linearly with the number of antibodies bound to the vesicles. Figure 5b shows a histogram of the number of antibodies observed for each fluorescence intensity burst during the data acquisition for four antibodies with HEK vesicles. These data demonstrate the ability to detect surface proteins present on vesicles and to determine the relative copy number of the surface proteins.
We validate these results by western blot analysis, which agree with the FCS studies showing that HEK cell-derived vesicles express tetraspanin proteins and cytosolic protein (Alix) but not HSP70. We further verified the presence of the selected proteins (CD9, CD 63, CD81, HSP70, and Alix) in the different vesicle population. CDVs from A549 cells were responsive to anti-CD9, anti-CD63, and anti-Alix antibodies, but not anti-CD 81 and anti-HSP70 antibodies. CDVs from N2A and Raw264.7 cells showed no response to anti-tetraspanin and heat shock antibodies. They only responded to anti-alix antibodies. The western blots show the presence of the same surface proteins for each vesicle as determined via FCS (Figure 5c). Lastly, we generated a graphical color-coded table to represent the variant responses between cell-derived vesicles and exosomal marker antibodies (Figure 5d) as determined by ht-FCS. A table containing the details is shown in the ESM (Table S2). The yield expression profile and protein abundance in vesicle membrane were based on the assumption that all antibodies have similar binding affinities to membrane proteins. The calculated diffusion coefficient, average number of bound antibodies per vesicle, and diffusion time are shown in Figure 5d. Lung cancer cells (A549 cells) derived vesicles were enriched with CD9 and CD63 proteins but not CD81 and HSP 70. Vesicles from both N2A cells and Raw264.7 cells did not respond to anti-tetraspanin protein antibodies or heat shock protein antibodies. In addition, antibody against Alix protein presented a limited binding capacity to most types of vesicles except Raw 264.7 cell-derived vesicles. In general, therefore, it seemed that CDVs showed notable difference in membrane protein expression on their surface with exosomes from the same origin.
Conclusion
We developed a high throughput method to screen for vesicle surface proteins using high-throughput FCS technique. This approach enables the fast and accurate characterization of surface protein profiles. The combination of high throughput screening and FCS diminished the limitation of most traditional techniques and provided more detailed information to characterize vesicles. This approach can be used to identify vesicles based on surface proteins and to identify the number of each surface protein on the vesicle. Identification of surface components on vesicles can be used to characterize vesicles and potentially to identify the cell of origin.
Supplementary Material
Acknowledgement
Support for this work was provided by the National Science Foundation under grant no. DBI-1556281.
Footnotes
Conflict of Interest
The authors declare no competing interests.
Publisher's Disclaimer: This Author Accepted Manuscript is a PDF file of a an unedited peer-reviewed manuscript that has been accepted for publication but has not been copyedited or corrected. The official version of record that is published in the journal is kept up to date and so may therefore differ from this version.
Compliance with ethical standards
No human or animal subjects were used in this study. No informed consent was required for this study.
References
- 1.Rajagopal C, Harikumar KB (2018) The Origin and Functions of Exosomes in Cancer. Front Oncol 8:66–66. doi: 10.3389/fonc.2018.00066 [DOI] [PMC free article] [PubMed] [Google Scholar]
- 2.Becker A, Thakur BK, Weiss JM, Kim HS, Peinado H, Lyden D (2016) Extracellular Vesicles in Cancer: Cell-to-Cell Mediators of Metastasis. Cancer Cell 30 (6):836–848. doi: 10.1016/j.ccell.2016.10.009 [DOI] [PMC free article] [PubMed] [Google Scholar]
- 3.McGough IJ, Vincent J-P (2016) Exosomes in developmental signalling. Development 143 (14):2482–2493. doi: 10.1242/dev.126516 [DOI] [PubMed] [Google Scholar]
- 4.Sercombe L, Veerati T, Moheimani F, Wu SY, Sood AK, Hua S (2015) Advances and Challenges of Liposome Assisted Drug Delivery. Front Pharmacol 6:286–286. doi: 10.3389/fphar.2015.00286 [DOI] [PMC free article] [PubMed] [Google Scholar]
- 5.Snell AA, Neupane KR, McCorkle JR, Fu X, Moonschi FH, Caudill EB, Kolesar J, Richards CI (2019) Cell-Derived Vesicles for in Vitro and in Vivo Targeted Therapeutic Delivery. ACS Omega 4 (7):12657–12664. doi: 10.1021/acsomega.9b01353 [DOI] [PMC free article] [PubMed] [Google Scholar]
- 6.Svensson KJ, Christianson HC, Wittrup A, Bourseau-Guilmain E, Lindqvist E, Svensson LM, Morgelin M, Belting M (2013) Exosome uptake depends on ERK1/2-heat shock protein 27 signaling and lipid Raft-mediated endocytosis negatively regulated by caveolin-1. J Biol Chem 288 (24):17713–17724. doi: 10.1074/jbc.M112.445403 [DOI] [PMC free article] [PubMed] [Google Scholar]
- 7.Goh WJ, Zou S, Ong WY, Torta F, Alexandra AF, Schiffelers RM, Storm G, Wang JW, Czarny B, Pastorin G (2017) Bioinspired Cell-Derived Nanovesicles versus Exosomes as Drug Delivery Systems: a Cost-Effective Alternative. Scientific reports 7 (1):14322. doi: 10.1038/s41598-017-14725-x [DOI] [PMC free article] [PubMed] [Google Scholar]
- 8.Choo YW, Kang M, Kim HY, Han J, Kang S, Lee JR, Jeong GJ, Kwon SP, Song SY, Go S, Jung M, Hong J, Kim BS (2018) M1 Macrophage-Derived Nanovesicles Potentiate the Anticancer Efficacy of Immune Checkpoint Inhibitors. ACS Nano 12 (9):8977–8993. doi: 10.1021/acsnano.8b02446 [DOI] [PubMed] [Google Scholar]
- 9.Wu T, Qi Y, Zhang D, Song Q, Yang C, Hu X, Bao Y, Zhao Y, Zhang Z (2017) Bone Marrow Dendritic Cells Derived Microvesicles for Combinational Immunochemotherapy against Tumor. Adv Funct Mater 27 (42):1703191. doi: 10.1002/adfm.201703191 [DOI] [Google Scholar]
- 10.Cheng L, Wang Y, Huang L (2017) Exosomes from M1-Polarized Macrophages Potentiate the Cancer Vaccine by Creating a Pro-inflammatory Microenvironment in the Lymph Node. Mol Ther 25 (7):1665–1675. doi: 10.1016/j.ymthe.2017.02.007 [DOI] [PMC free article] [PubMed] [Google Scholar]
- 11.Gudbergsson JM, Jønsson K, Simonsen JB, Johnsen KB (2019) Systematic review of targeted extracellular vesicles for drug delivery – Considerations on methodological and biological heterogeneity. J Controlled Release 306:108–120. doi: 10.1016/j.jconrel.2019.06.006 [DOI] [PubMed] [Google Scholar]
- 12.Wu D, Yan J, Shen X, Sun Y, Thulin M, Cai Y, Wik L, Shen Q, Oelrich J, Qian X, Dubois KL, Ronquist KG, Nilsson M, Landegren U, Kamali-Moghaddam M (2019) Profiling surface proteins on individual exosomes using a proximity barcoding assay. Nature Communications 10 (1):3854. doi: 10.1038/s41467-019-11486-1 [DOI] [PMC free article] [PubMed] [Google Scholar]
- 13.Jeong D, Jo W, Yoon J, Kim J, Gianchandani S, Gho YS, Park J (2014) Nanovesicles engineered from ES cells for enhanced cell proliferation. Biomaterials 35 (34):9302–9310. doi: 10.1016/j.biomaterials.2014.07.047 [DOI] [PubMed] [Google Scholar]
- 14.Gao J, Chu D, Wang Z (2016) Cell membrane-formed nanovesicles for disease-targeted delivery. J Control Release 224:208–216. doi: 10.1016/j.jconrel.2016.01.024 [DOI] [PMC free article] [PubMed] [Google Scholar]
- 15.Zhai Y, Su J, Ran W, Zhang P, Yin Q, Zhang Z, Yu H, Li Y (2017) Preparation and Application of Cell Membrane-Camouflaged Nanoparticles for Cancer Therapy. Theranostics 7 (10):2575–2592. doi: 10.7150/thno.20118 [DOI] [PMC free article] [PubMed] [Google Scholar]
- 16.Nolte-'t Hoen EN, van der Vlist EJ, Aalberts M, Mertens HC, Bosch BJ, Bartelink W, Mastrobattista E, van Gaal EV, Stoorvogel W, Arkesteijn GJ, Wauben MH (2012) Quantitative and qualitative flow cytometric analysis of nanosized cell-derived membrane vesicles. Nanomedicine 8 (5):712–720. doi: 10.1016/j.nano.2011.09.006 [DOI] [PMC free article] [PubMed] [Google Scholar]
- 17.Kowal J, Arras G, Colombo M, Jouve M, Morath JP, Primdal-Bengtson B, Dingli F, Loew D, Tkach M, Théry C (2016) Proteomic comparison defines novel markers to characterize heterogeneous populations of extracellular vesicle subtypes. Proc Natl Acad Sci U S A 113 (8):E968–E977. doi: 10.1073/pnas.1521230113 [DOI] [PMC free article] [PubMed] [Google Scholar]
- 18.Schey KL, Luther JM, Rose KL (2015) Proteomics characterization of exosome cargo. Methods 87:75–82. doi: 10.1016/j.ymeth.2015.03.018 [DOI] [PMC free article] [PubMed] [Google Scholar]
- 19.Moonschi FH, Effinger AK, Zhang X, Martin WE, Fox AM, Heidary DK, DeRouchey JE, Richards CI (2014) Cell-Derived Vesicles for Single-Molecule Imaging of Membrane Proteins. Angew Chem 31 (10):201408707. [DOI] [PubMed] [Google Scholar]
- 20.Posokhov YO, Rodnin MV, Das SK, Pucci B, Ladokhin AS (2008) FCS study of the thermodynamics of membrane protein insertion into the lipid bilayer chaperoned by fluorinated surfactants. Biophys J 95 (8):L54–L56 [DOI] [PMC free article] [PubMed] [Google Scholar]
- 21.Brock R, Vamosi G, Vereb G, Jovin TM (1999) Rapid characterization of green fluorescent protein fusion proteins on the molecular and cellular level by fluorescence correlation microscopy. Proc Natl Acad Sci U S A 96 (18):10123–10128 [DOI] [PMC free article] [PubMed] [Google Scholar]
- 22.Wyss R, Grasso L, Wolf C, Grosse W, Demurtas D, Vogel H (2014) Molecular and Dimensional Profiling of Highly Purified Extracellular Vesicles by Fluorescence Fluctuation Spectroscopy. Analytical Chemistry 86 (15):7229–7233. doi: 10.1021/ac501801m [DOI] [PubMed] [Google Scholar]
- 23.Wachsmuth M, Conrad C, Bulkescher J, Koch B, Mahen R, Isokane M, Pepperkok R, Ellenberg J (2015) High-throughput fluorescence correlation spectroscopy enables analysis of proteome dynamics in living cells. Nature Biotechnology 33 (4):384–389. doi: 10.1038/nbt.3146 [DOI] [PubMed] [Google Scholar]
- 24.Colyer RA, Scalia G, Rech I, Gulinatti A, Ghioni M, Cova S, Weiss S, Michalet X (2010) High-throughput FCS using an LCOS spatial light modulator and an 8 × 1 SPAD array. Biomed Opt Express 1 (5):1408–1431. doi: 10.1364/BOE.1.001408 [DOI] [PMC free article] [PubMed] [Google Scholar]
- 25.Simpson RJ (2010) Disruption of cultured cells by nitrogen cavitation. Cold Spring Harb Protoc 2010 (11):pdb prot5513. doi: 10.1101/pdb.prot5513 [DOI] [PubMed] [Google Scholar]
- 26.Moonschi FH, Effinger AK, Zhang X, Martin WE, Fox AM, Heidary DK, DeRouchey JE, Richards CI (2015) Cell-derived vesicles for single-molecule imaging of membrane proteins. Angew Chem Int Ed Engl 54 (2):481–484. doi: 10.1002/anie.201408707 [DOI] [PubMed] [Google Scholar]
- 27.Krüger D, Ebenhan J, Werner S, Bacia K (2017) Measuring Protein Binding to Lipid Vesicles by Fluorescence Cross-Correlation Spectroscopy. Biophys J 113 (6):1311–1320. doi: 10.1016/j.bpj.2017.06.023 [DOI] [PMC free article] [PubMed] [Google Scholar]
Associated Data
This section collects any data citations, data availability statements, or supplementary materials included in this article.


