

Abstract
Gastrointestinal stromal tumor (GIST) is commonly driven by oncogenic KIT mutations that are effectively targeted by imatinib, a tyrosine kinase inhibitor (TKI). However, IM does not cure GIST and adjuvant therapy only delays recurrence in high-risk tumors. We hypothesized that GIST contains cells with primary imatinib resistance that may represent a reservoir for disease persistence. Here, we report a subpopulation of CD34+KITlow human GIST cells that have intrinsic imatinib resistance. These cells possess cancer stem cell-like expression profiles and behavior, including self-renewal and differentiation into CD34+KIThigh progeny that are sensitive to imatinib treatment. We also found that TKI treatment of GIST cell lines led to induction of stem-cell associated transcription factors (OCT4 and NANOG) and concomitant enrichment of the CD34+KITlow cell population. Using a data-driven approach, we constructed a transcriptomic-oncogenic map (Onco-GPS) based on the gene expression of 134 GIST samples to define pathway activation during GIST tumorigenesis. Tumors with low KIT expression had overexpression of cancer stem cell gene signatures consistent with our in vitro findings. Additionally, these tumors had activation of the Gas6/AXL pathway and NF-κB signaling gene signatures. We evaluated these targets in vitro and found that primary imatinib-resistant GIST cells were effectively targeted with either single agent bemcentinib (AXL inhibitor) or bardoxolone (NF-κB inhibitor), as well as with either agent in combination with imatinib. Collectively, these findings suggest that CD34+KITlow cells represent a distinct, but targetable, subpopulation in human GIST that may represent a novel mechanism of primary TKI resistance, as well as a target for overcoming disease persistence following TKI therapy.
Keywords: GIST, KIT, c-KIT, cancer stem cells, disease persistence, TKI resistance
Background
Gastrointestinal stromal tumor (GIST) is the most common mesenchymal tumor of the gastrointestinal tract.(1) The treatment of GIST provided proof of principle for precision medicine in solid tumors as oncogenic driver mutations in the KIT gene were identified and targeted with the tyrosine kinase inhibitor (TKI), imatinib (IM). Despite this landmark discovery, clinical trials show that 40% of primary localized GISTs develop recurrence within 5 years.(2) In clinical trials, high-risk patients begin developing recurrences between 8 to 12 months after stopping adjuvant imatinib, leading to near convergence of all survival curves irrespective of the length of imatinib therapy.(3–5) The later lines of FDA-approved anti-GIST TKIs (i.e., sunitinib, regorafenib, and ripretinib) can provide additional survival benefit, but disease control is often short-lived.(6,7) These observations suggest that the paradigm of targeting KIT oncogene addiction is fundamentally limited.
TKI resistance is mediated by acquired and de novo causes. Acquired resistance is the most common mechanism and involves acquisition of secondary KIT mutations following imatinib treatment. These mutations are well characterized and tend to cluster in either the ATP-binding pocket or the activation loop of KIT, impairing the ability of imatinib to bind KIT.(8) Contrastingly, de novo, or primary resistance, is seen in 10-20% of GISTs. In general, this TKI sensitivity is entirely determined by specific alterations within driver mutations.(9–11) While 60-70% of all sporadic GISTs have activating genomic alterations in KIT, certain alterations (i.e., KIT exon 17) confer primary resistance to imatinib. Similarly, 10-15% of GISTs have activating genomic alterations in PDGFRA that are frequently TKI sensitive, with the exception of PDGFRA D842V mutants that are intrinsically imatinib resistant, but respond to the newly FDA-approved agent, avapritinib.(10,12,13) The remainder of GISTs are driven by a heterogenous group of alterations, but are frequently TKI resistant. These include 15% with activation of the RAS pathway (K/H/N-RAS, BRAF, NF1) and 7% arising from mutations or epimutations in SDHx subunits (A, B, C, or D), and kinase fusions (ETV6-NTRK3, FGFR1-TACC1, or FGFR1-HOOK3).(10,13–18) Despite variable genomics, the putative cell of origin – the interstitial cell of Cajal (ICC) (19–21) – appears to be the same for all subgroups of the disease.(10,22)
On the basis that cancer stem cells (CSCs) arise from and resemble their cell of origin,(21,23) genetic subtypes of a cancer may possess similar CSCs that may be responsive to killing by similar therapies. Currently, very little is known about GIST CSCs, and therefore effective agents for targeting them remain undetermined. Studies in a mouse model of GIST suggest that KITlowCD34+ cells may represent IM-resistant murine GIST CSCs.(24) While all anti-KIT TKIs hit the “right” target in mature KIT-mutant GIST cells, they do not target KITlow cells, a possible cellular reservoir for disease persistence and recurrence.
In the present study, we sought to identify KITlowCD34+ GIST cells and to define the molecular properties of these GIST cells isolated from human GISTs bearing heterogenous KIT mutations. We then performed a bioinformatic-driven approach to determine distinct oncogenic states that predominate within the KITlow GIST subpopulation. Lastly, we tested putative candidate therapies for cytotoxicity of KITlow GIST cells. On this basis, we hypothesized that human KITlowCD34+ cells are an intrinsically TKI-resistant subpopulation that exists within primary human GIST, and can mediate tumor recurrence and disease progression.
Methods
Reagents
Cell culture media and reagents were purchased from Mediatech (Manassas, VA). Primary and secondary antibodies for immunoblotting, immunofluorescent staining, and immunohistochemistry (IHC) are described in the Supplementary Table 1. OPAL 4-color manual IHC Kit was purchased from Akoya Biosciences (Marlborough, MA). iScript cDNA synthesis kit and iTaq universal SYBR Green supermix were purchased from Bio-Rad Laboratories (Hercules, CA). Dimethyl sulfoxide (DMSO), poly(2-hydroxyethyl methacrylate) (poly-HEMA), and MTT reagent, 3-(4, 5-dimethylthiazol-2-yl)-2,5-diphenyltetrazolium bromide, were purchased from Sigma-Aldrich (St. Louis, MO). Transwell plates were purchased from Corning (Lowell, MA). CellTiter-Glo (CTG) luminescent cell viability assay was purchased from Promega (Madison, WI). BCA protein assay, the Western Blot stripping buffer, and an enhanced chemiluminescence system for western blot detection were purchased from Thermo Scientific (Waltham, MA). Bemcentinib/BEM, bardoxlone/BARD, and Nocodazole were purchased from Selleckchem (Houston, TX). Imatinib (IM) was provided by Novartis Pharmaceuticals (East Hanover, NJ). Propidium iodide (PI) is from Roche Applied Science (Indianapolis, IN). ALDEFLUOR kit was purchased from STEMCELL Technologies (Cambridge, MA). The RNeasy Kit was purchased from Qiagen (Germantown, MD). The human tumor dissociation kit is from Miltenyi Biotec (Auburn, CA).
Human GIST Source
Tumor acquisition and banking under our IRB-approved protocol (#181755) is routinely performed for all surgical procedures at UC San Diego Moores Cancer Center. Informed consent was obtained from all patients for tissue collection. Resected tumors were first submitted to Moores Pathology for diagnostic workup. The Biorepository and Tissue Technology Shared Resource (BTTSR) at Moores Cancer Center then acquired and distributed excess tumor tissue for research purposes. Table 1 lists demographic information of 4 GIST patients in this study who underwent operations. Clinical diagnosis of GIST employed tissue staining including hematoxylin and eosin (H&E), KIT and ANO1. The immunohistological diagnoses were confirmed under light microscopy by an experienced pathologist. Tumor samples from these 4 patients were used for flow cytometry assays and immunofluorescent staining as described below.
Table 1:
Characteristics of primary human GISTs
| Tumor Name | Primary Site | Mutation |
|---|---|---|
| GIST #1 | Gastric | KIT exon 11 V560E |
| GIST #2 | Gastric | KIT exon 11 V560E |
| GIST #3 | Gastric | KIT exon11 R586 N587_insPTQLPYDHKWEFPR |
| GIST #4 | Gastric | KIT exon11 V560D |
Tumor Dissociation
Resected fresh tumors were cut into fine pieces and processed into single-cell suspensions using the human tumor dissociation kit (Miltenyi Biotec, Auburn, CA). Briefly, tumor tissue was digested with a proprietary enzyme mixture and mechanically dissociated using the gentleMACS Dissociator (Miltenyi Biotec) following the manufacturer’s instructions for the tough tumor settings. Undigested tissue was removed by passing through a 70-micron filter. Dissociated tumor cells were collected and counted with a TC20 Automated Cell Counter (Bio-Rad). Cell viability was checked using 0.4% trypan blue dye.
GIST Cell and Tumorsphere Cultures
The GIST-T1 line containing KIT exon 11 (V560-Y579Δ5) mutation(25) was cultured in Dulbecco’s modified Eagle’s medium (DMEM; Gibco) with 10% FBS. The GIST882 line containing KIT exon 13 (K642E) mutation(26) was cultured in Roswell Park Memorial Institute (RPMI 1640; Gibco) with 20% FBS. All cell culture media were supplemented with 1% penicillin/streptomycin (Mediatech) and 2 mM glutamine (Mediatech). All cell lines were maintained in a humidified incubator with 5% CO2 at 37°C. All cell lines were confirmed to be negative for mycoplasma contamination. For tumorsphere culture, GIST-T1 cells were seeded at a density of 2.5 x 10⁵ cells/well in poly-HEMA-coated 6-well plates, and allowed to grow as spheres for indicated time.
Two-step Real-time Quantitative RT-PCR
Human GIST snap-frozen tumor was processed with a tissue homogenizer in RLT lysis buffer (Qiagen, Germantown, MD). Total RNA from tissue homogenates or cell pellets was prepared using the RNeasy Kit (Qiagen) according to manufacturer’s instructions. Reverse transcription with iScript cDNA synthesis kit (Bio-Rad) and quantitative real-time PCR conducted with iTaq universal SYBR Green supermix (Bio-Rad). Samples were run on a CFX96 real-time system (Bio-Rad) with the following PCR parameters: denaturing at 95°C for 30 seconds followed by 40 cycles of 10-second denaturation at 95°C, 30-second annealing at the optimal primer annealing temperatures, and 10-second extension at 72°C. Primers specific for genes of interest and the beta-actin and cyclophilin A housekeeping genes are in Supplementary Table 1. The threshold cycle (Ct) values from triplicated samples were automatically generated after each run. Target gene levels based on Ct values are presented as a ratio to levels detected in the control samples, according to the ΔΔCt method.(27)
Immunoblotting
Monolayer cells were lysed and scraped in RIPA buffer (Cell Signaling Technology, Danvers, MA) containing Halt Protease and Phosphatase Inhibitor Cocktail (ThermoFisher Scientific); while tumorsphere pellets were directly lysed in the same buffer/inhibitor solution. Whole cell lysates were cleared by centrifugation at 14,000 rpm for 30 min and protein was quantified using the BCA protein assay (ThermoFisher Scientific). Protein lysates were resolved on a 4–12% Bis-Tris gel (Life Technologies, Carlsbad, CA) and transferred to a polyvinylidene difluoride (PVDF) membrane which was blocked for 1 hour at room temperature. The membrane was incubated with indicated primary antibody (1:1,000) overnight at 4°C; then followed with 1 h incubation of horseradish peroxidase (HRP)-conjugated secondary antibody (1:5,000) at room temperature. Protein bands were detected using the Pierce enhanced chemiluminescence (ECL) Western blotting detection system (ThermoFisher Scientific). Bound antibodies were removed from membranes using Restore PLUS Western Blot Stripping Buffer (ThermoFisher Scientific). Then the membrane was re-probed with the alpha-tubulin antibody (Cell Signaling Technology) for loading controls and detected by an HRP-conjugated goat anti-mouse IgG (1:5,000, Jackson ImmunoResearch Laboratories, West Grove, PA) and the Pierce ECL reagents.
Flow Cytometry (FCM)/ Fluorescence-activated cell sorting (FACS)
GIST882 cells were harvested, counted using a TC20 cell counter (Bio-Rad), and stained with CD34-PE and CD117-APC (both from BD Biosciences) for 30 minutes on ice in the dark. To evaluate cell viability, propidium iodide (PI, Roche Applied Science, Indianapolis, IN) was added to samples immediately before analysis. Stained cells were analyzed using a BD FACSDiva cell sorter (BD Biosciences) with 10,000 events collected for each sample. GIST882 cells were treated with imatinib (IM) with the specified final concentration for 48-72 hours as indicated in figure legends. After treatment, cells were harvested, counted, and stained as described above. The 3 subpopulations were identified and defined as following: stem cells as KITlow CD34+, immature cells as KIThigh CD34+, and mature cells as KIThigh CD34−. Two subpopulations, stem cells and immature cells, were sorted and subjected to downstream experiments named as KITlow and KIThigh, respectively.
For single-cell sorting, individual KITlow (N=48) or KIThigh (N=48) cells were sorted directly into a 96-well plate and co-cultured in regular growth media with unsorted GIST882 (10,000 cells/well) on a Transwell top for 2 weeks; then the Transwell top was discarded and sorted cells continued to grow for additional 3 weeks. At the end of 5 weeks, cell proliferation was determined by CellTiter-Glo (CTG) assay as described below and expressed as relative fluorescent units (RFU).
Cell Viability Assay
GIST-T1 and GIST882 cells were seeded in 96-well plates and treated in triplicate with indicated compounds for 72 or 120 hours, respectively. MTT reagent, 3-(4, 5-dimethylthiazol-2-yl)-2,5-diphenyltetrazolium bromide (Sigma-Aldrich), was added to cells and then incubated for 4 hours at 37°C. Dimethyl sulfoxide (DMSO, Sigma-Aldrich) was used to dissolve purple formazan product. The absorbance was read at 560 nm to measure cell viability. The background absorbance was determined from wells with media only.
For sequential treatment experiments, GIST882 and GIST-T1 cells were treated for a total of 6 days in sextuplicate for each condition. More specifically, imatinib added to GIST cells for 3 days. After imatinib treatment, remaining cells in wells were subjected to various conditions for an additional 3 days: 0.1% DMSO, IM, BARD, BEM, (IM+BARD), or (IM+ BEM). All groups were analyzed by MTT assay to determine cell viability as described above. The following conditions were set as controls of 100% viability: cells treated with DMSO for 3 days (for the 3-day group) or DMSO 6 days (for the 6-day group).
Cell Cycle Analysis
GIST-T1 and GIST882 cells were grown to 70-80% confluency and harvested using Trypsin. Cells were then treated with RNAse (10 μg/ml) for 10 min at room temperature followed by propidium iodide (0.5 mg/ml in PBS) for 30 min at 37°C in the dark. Cell cycle arrest was achieved by nocodazole treatment (50 ng/mL) for 24 hours in regular growth media prior to the aforementioned steps. Cells were analyzed by BD FACSAria™ Flow Cytometer.
ALDEFLUOR Assay
ALDH isoform activity analysis was performed using the ALDEFLUOR kit (STEMCELL technologies). Briefly, GIST882 cell pellets or dissociated tumor tissue were collected and resuspended in Aldefluor assay buffer. Cells were then incubated with BODIPY-aminoacetaldehyde (BAAA) which is a fluorescent substrate for ALDH. Control tubes were set as BAAA added to cells in the presence of N,N-diethylaminobenzaldehyde (DEAB), an inhibitor of ALDH enzymes. ALDH-positive (i.e. ALDHhigh) versus ALDH-negative (i.e. ALDHlow) cells were analyzed and separated using a BD FACSDiva cell sorter.
Immunofluorescence and Confocal Microscopy
GIST tumorsphere pellets were embedded in optimal cutting temperature (OCT) compound prior to frozen sectioning. Sections were fixed with 4% paraformaldehyde, permeabilized with 0.3% Triton X-100, blocked with 5% normal donkey serum in PBS, and labelled with anti-OCT4 (ab200834), anti-NANOG (ab109250), or Ki-67 antibody (ab15580). Co-staining of ≥ 2 antibodies was performed with the OPAL 4-color manual IHC Kit (Akoya Biosciences) following the manufacturer’s instructions. Slides were incubated with Alexa Fluor-conjugated secondary antibodies (ThermoFisher Scientific) and 4′,6-diamidino-2-phenylindole (DAPI) at room temperature in the dark and mounted in ProLongGold antifademountant (ThermoFisher Scientific). Immunofluorescence images were captured using a Nikon Confocal A1R Microscope (Nikon, Melville, NY). In addition, fresh-frozen OCT-embedded tumor tissues were sectioned, fixed, stained, and imaged as described above.
In vivo Spleen-to-liver metastasis model
Five-week-old male nude mice were purchased from the Jackson Laboratory (Bar Harbor, ME). mCherry-conjugated T1 cells were treated with 10 nM IM for 4 days then sorted for KITlow or KIThigh cells. 1 x 10⁶ cells resuspended with Hanks’ Balanced Salt Solution (HBSS) were injected into the spleen (KITlow: n=3, KIThigh: n=3 ). After 3 weeks, all mice were sacrificed. The harvested livers from each mouse were analyzed using the IVIS imaging system (Xenogen) in an unblinded manner. The IVIS signals were graphed by total photon flux (p/s). All animal experiments were conducted in accordance with protocol S11020 approved by the Institutional Animal Care and Use Committee of University of California, San Diego.
Bioinformatics Analysis
Gene Set Enrichment Analysis (GSEA) was performed on paired data (pre- and post-IM) from 18 patients in RTOG 0132 study using publicly available data (GSE1596636).(28–30) Human GIST RNASeq data from 75 GIST samples generated in previous study are accessible from the Sequencing Read Archive (Accession number PRJNA521803).(31)
Onco-GPS
The methodology to define GIST states follows our original Onco-GPS approach.(32) The method starts by defining a group of GIST-relevant gene sets (see Supplementary Table 2) from our MSigDB (Molecular Signatures Database(33,34)). These were chosen based on the current molecular, biological and genomic understanding of the disease. These gene sets define a total of 3,675 GIST-relevant genes that we believe are relevant and representative of transcriptional changes in GIST. The mRNA profiles of these genes are selected in 4 GIST datasets(31,35–37) representing 134 GISTs. Genetically diverse GIST samples were utilized to study KITlow cells in a genotype-agnostic manner. This is a feasible approach because non-KIT mutant GIST often highly express wild-type KIT protein.(10) Additionally, non-KIT mutant GISTs are known to have overlapping downstream targets as KIT-mutant GIST and promote tumorigenesis via parallel pathways.(38) These datasets, sharing the same selected GIST-relevant genes, are then decomposed using a parallel Non-Negative Matrix Factorization (NMF) algorithm(39) that produces a common genes vs. components matrix (W) and 4 components vs. samples matrices (H1-4). The output lower rank matrices from the NMF decomposition (W, H1-4) represent the most coherent patterns of gene expression across the many GIST in the input datasets. The W matrix provides the weight of each gene in each component, and the matrix H provides the combination of components to make each of the original sample profiles. In this way, the NMF algorithm deconvolves the functional consequences of GIST oncogene activation and produces a set of 5 transcriptional components. The decomposition treats the 4 input datasets independently and in parallel so the model is able to find common transcriptional components shared by the datasets without one dominating the other as they all get some dedicated amount of numerical “real state” in the output (H1-4 matrices). Once the Onco-GPS transcriptional components have been divided they are used to cluster the GIST samples in the 4 datasets in order to define oncogenic states (Supplementary Fig. 5). This is accomplished using a hierarchical clustering algorithm(32). The components and oncogenic states are displayed in a 2D layout (Onco-GPS map) following the Onco-GPS method (Fig 5).
FIG. 5. KITlow primary tumors have distinct pathway activation.
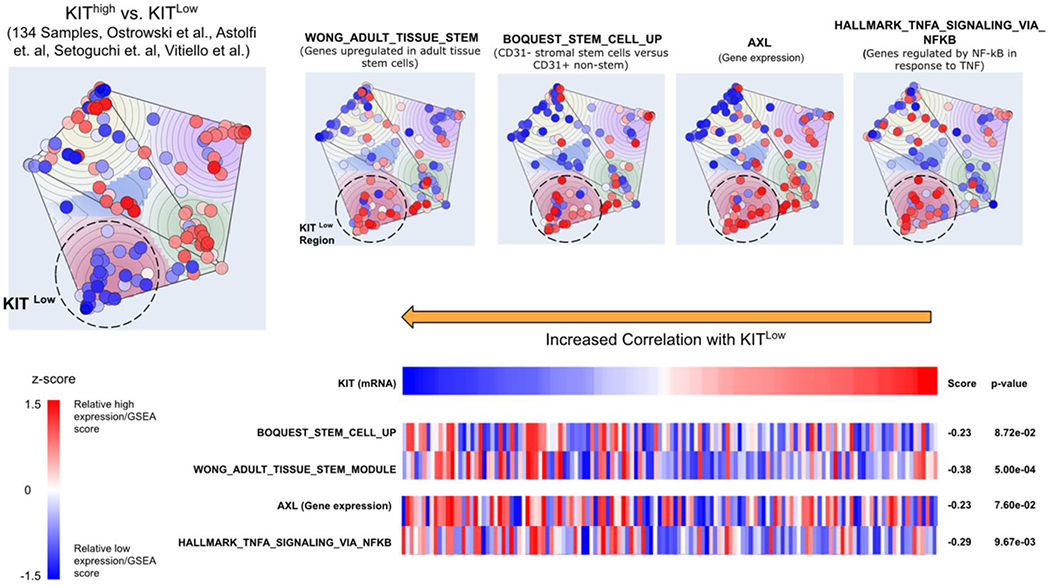
Onco-GPS map constructed using gene expression of 134 GIST samples from 4 datasets. Relative gene expression and gene set enrichment scores are shown on the map by coloring projected samples on a scale of blue for low enrichment and red for high enrichment of each indicated gene or pathway. Indicated genes and pathways are also shown in the left panel showing the matching score (Information Coefficient) against KIT mRNA expression.
Annotating the Onco-GPS components and single-sample GSEA Analysis.
This computational characterization is based on measuring the degree of association between each transcriptional component and different types of genomic features that have been profiled for the same tumor samples. To estimate the degree of association we will use a rescaled mutual information metric: the Information Coefficient (IC). The IC is a non-linear correlation coefficient based on the differential mutual information(40–42),
| (1) |
where ρ is the correlation coefficient, x is the oncogenic activation profile, and y is the genomic feature. The sign of the correlation coefficient provides directionality to the metric. The I(x,y) is the differential mutual information between x and y computed using kernel density estimation.
| (2) |
Where p(x), and p(y) are p(x, y) the joint and marginal probability densities. This type of feature selection process has been used in many of our studies.(43–52)
In order to characterize pathway enrichment, we used our single-sample GSEA (Gene Set Enrichment Analysis) algorithm(53) with gene sets from MSigDB (Molecular Signatures Database(33,34)), including recently-added subcollections of oncogenic and hallmark gene sets.(54) This is also the method we use to produce the profiles of pathways in the heatmap of Figure 1.
FIG. 1. IM increases expression of stem markers in human GIST.
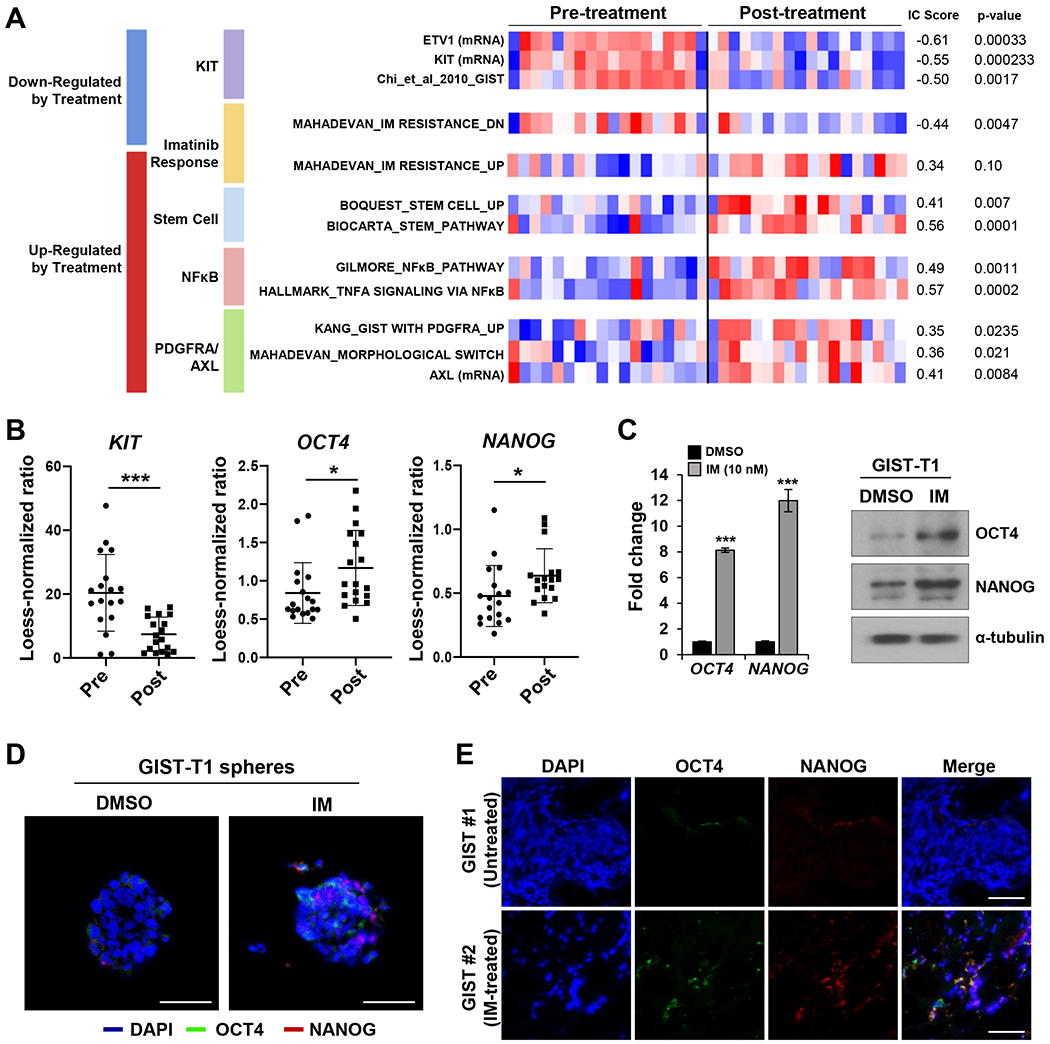
A. Gene Set Enrichment Analysis (GSEA) analysis(53) performed on 18 paired pre-IM vs. post-IM samples from RTOG 0132.(78) Selected gene sets that show differential enrichment before and after IM treatment. The heatmap displays the standardized enrichment scores of a variety of gene sets representing KIT activation, imatinib resistance, stemness, NF-κB, and PDGFRA/AXL. On the left side of the heatmap, the numbers display the association metric (IC score(40), and the p-values obtained by performing an empirical permutation test. Red: above mean; blue: below mean). B. Transcript expression differences among stem-associated transcription factors and KIT from RTOG0132 microarray data. *** and * represent statistical significance P<0.001 and P<0.05, respectively. C. Relative expression levels of stem markers by RT-PCR analysis and protein levels by Western blots in GIST-T1 tumorspheres treated with IM (10 nM) for 3 days. RT-PCR data performed in triplicates were shown as mean ± standard deviation (SD). Alpha-tubulin was used as a Western blot loading control. D. Protein levels of stem markers by immunofluorescent (IF) staining in GIST-T1 spheres treated with 100 nM IM for 7 days. E. Representative IF staining for co-localization of stem markers comparing untreated GIST #1 and IM-treated KIT exon 11 mutated GIST #2.
Onco-GPS components were characterized by matching individual mRNA gene and pathway profiles against the per-sample NMF component amplitudes using the Information Coefficient This was also done with KIT mRNA expression in order to investigate its relationship with e.g. stemness pathways.
Statistical Analysis
All statistical analysis was performed using GraphPad Prism 7 (GraphPad Software, La Jolla, CA). Data are reported as means ± standard deviation (SD). Comparisons between controls and experimental groups were analyzed for significance by the Student’s t-test (2-tailed) or Mann-Whitney test. Statistical significance was accepted at the 5% level (P ≤ 0.05). Correction for multiple comparisons was performed when appropriate.
Results
IM increases expression of stem markers in human GIST
We performed GSEA on 18 matched GISTs comparing pre- and post-neoadjuvant IM treatment (RTOG S0132).(28) Post-IM samples had reduced KIT (P=0.0002) and ETV1 (P<0.001) mRNA expression, as well as upregulation of known gene signatures associated with GIST tumorigenesis and IM-resistance. Additionally, we detected activation of several hallmark cancer pathways including “cancer stem cell”, NF-κB, PDGFRA, and AXL signaling gene signatures (Fig. 1A). Transcript expression of two stem-associated transcription factors (SATFs), OCT4 (P<0.05) and NANOG (P<0.05), showed induction after treatment with IM while KIT expression was suppressed (P<0.001) (Fig. 1B). Enrichment of cancer stem cell gene profiles represented a novel putative mechanism of IM-resistance. We then attempted to confirm this finding using established GIST cell lines. Tumorsphere formation has been associated with cancer “stemness” and can signify enrichment of cancer stem cells.(55) GIST-T1 tumorspheres were treated with imatinib (10 nM) for 72 hours and RT-qPCR was performed. We observed marked induction of SATFs including OCT4 (8.1-fold, P<0.001) and NANOG (12.0-fold, P<0.001) (Fig. 1C). While IM treatment decreased KIT protein (0.41-fold, P=0.048), it induced OCT4 (4.5-fold, P=0.015) and NANOG (2.9-fold, P=0.035) proteins in GIST-T1 tumorspheres (Fig. 1C; Supplementary Fig. 1A). These results were confirmed by immunofluorescence (IF) microscopy. GIST-T1 grown as tumorspheres led to detectable OCT4 and NANOG proteins as shown in DMSO panels. Treatment of GIST-T1 tumorspheres with imatinib (100 nM) further promoted a subpopulation of cells that highly expressed OCT4 and NANOG (Fig. 1D; Supplementary Fig. 1B). We also identified a similar pattern of scattered expression of SATFs in resected KIT exon 11 mutant human GIST imatinib therapy but not in the untreated KIT exon 11 mutant GIST (Fig. 1E; Supplementary Fig. 1C). Co-expression of OCT4 and NANOG was observed in the GIST tissues (detected by yellow color in Merge panels).
Treatment naïve GIST cells have properties of “stemness”
In addition to tumorsphere models, we evaluated aldehyde dehydrogenase (ALDH) function, which is an established marker of cell stemness.(56) The GIST882 cell line was found to have a high proportion of ALDHhigh cells (Fig. 2A). Consistent with aforementioned findings in tumorshpere models, we observed SATF enrichment within the ALDHhigh subpopulation compared with ALDHlow cells (Fig. 2B–C). There was induction of OCT4 (30.6-fold, P<0.001) and NANOG (34.9-fold, P<0.001) transcripts (Fig. 2B), along with the induction of OCT4 (21.5-fold, P=0.041) and NANOG (58.0-fold, P=0.025) proteins (Fig. 2C). Importantly, such ALDHhigh cells were also detected in primary human GISTs bearing KIT exon 11 mutations: GIST#3, OCT4 (1.9-fold, P<0.05) and NANOG (2.3-fold, P<0.01); and GIST#4, OCT4 (4.1-fold, P<0.001) and NANOG (2.3-fold, P<0.05) (Fig. 2D–E). Taken together, putative GIST stem-like cells exist and can be further enriched in 3D culture, as well as in sorted ALDHhigh subpopulation.
FIG. 2. Treatment naïve GIST cells have properties of “stemness”.
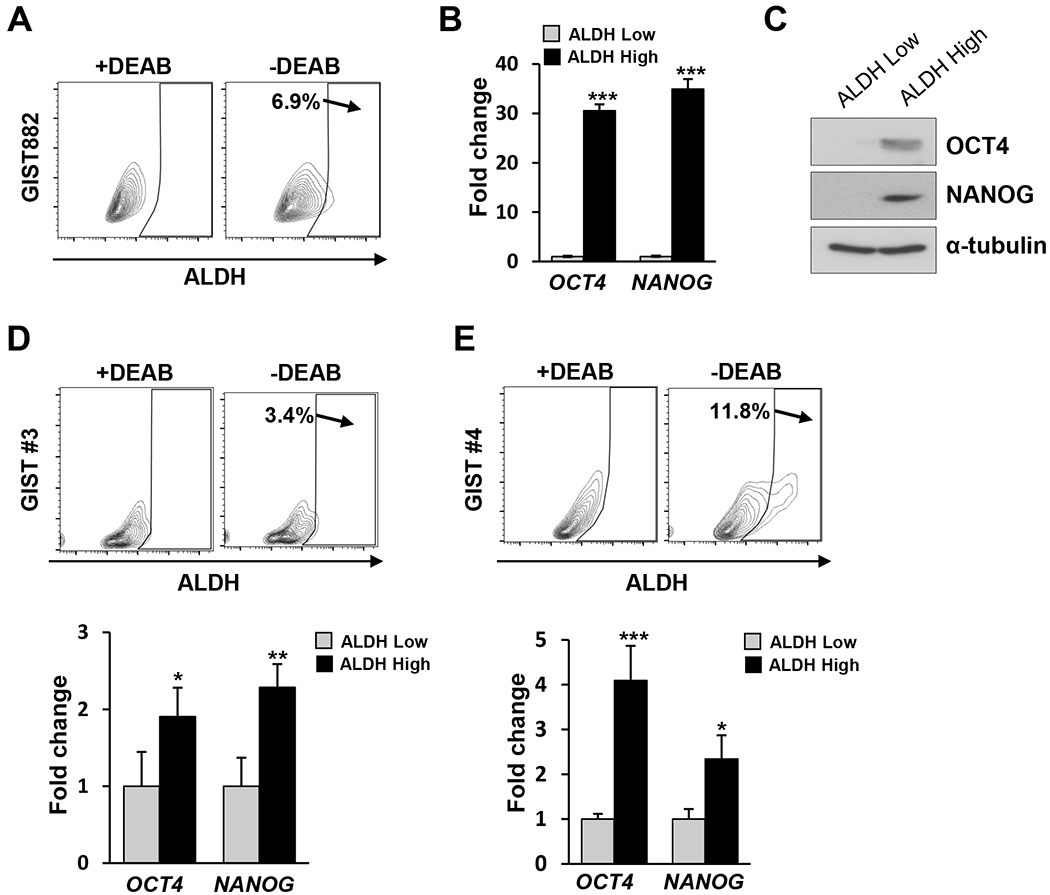
A. Specific ALDH fluorescent intensity was detected by FCM in GIST882 with or without ALDH inhibitor DEAB. B. Bar graphs displayed relative expression level of stem markers by RT-PCR analysis in sorted ALDHhigh and ALDHlow (set as 1-fold baseline) cells from GIST882. Data shown as mean ± SD was performed in triplicate. C. Immunoblots showed protein levels of stem markers in GIST882 from sorted ALDHhigh and ALDHlow cells. Alpha-tubulin was used as a loading control. D.-E. Two KIT-mutant GIST analyzed by FCM for ALDH fluorescent intensity in the presence or absence of DEAB. Bar graphs showed RT-PCR data of sorted ALDHhigh and ALDHlow (set as 1-fold baseline) from both GIST for OCT4 and NANOG relative expression. Data performed in triplicate was shown as mean ± SD. Statistical significance is indicated by *** P<0.001, ** P<0.01, and * P<0.05.
KITlow GIST cells are stem cell-like
As previously reported, GIST CSCs may represent a KITlow population in mice.(24) We next aimed to isolate and study the functional properties of human KITlow cells. We first evaluated the expression of SATFs in KITlow compared to KIThigh cells using RT-qPCR.(57) GIST882 KITlow cells had higher expression of OCT4 (1.6-fold, P=0.0033) and NANOG (1.9-fold, P=0.0046) (Fig. 3A). Next, we compared the colony forming potential of single-cell KITlow versus KIThigh cells to evaluate their self-renewal proliferation capability. FACS-sorted KIThighCD34+ and KITlowCD34+ GIST882 were sorted into single cells per well and cultured for 5 weeks and then analyzed for viable cell population. KITlow cells had a higher proliferation potential than KIThigh cells (P<0.05) (Fig. 3B). We next analyzed the cell cycle states of KITlow and KIThigh cells. GIST-T1 and GIST882 cells showed that KITlow cells had marked enrichment in G0-G1 cells compared to KIThigh cells (P<0.001). Importantly, the ratio of KITlow to KIThigh cells was unchanged following cell cycle arrest suggesting that KIT expression is not driven by cell cycle state (Supplemental Fig. 2). KITlow cells progressed through the cell cycle, but had a lower proportion of cells arrested at G2/M compared to KIThigh cells (P<0.001) in GIST-T1 and GIST882 cells. The proportion of cells in cell cycle states differed between GIST-T1 and GIST882 because the former has a doubling time of 12 hours while the latter doubling time is 24-36 hours. (Fig. 3C). Another hallmark of cancer stem cells is the ability to self-renew and differentiate into mature progeny. We tested the capacity for diffentiation of FACS-sorted KITlow cells to give rise to KIThigh cells. FACS-sorted KITlowCD34+ GIST882 cells were isolated and cultured for 5 days followed by FCM analyses. KITlow cells recapitulated the original cellular composition of the parental GIST882 cell line although the proportion of KITlow cells remained higher (Fig. 3D). To examine the proliferative potential of KITlow cells at the tissue level, multiplexing IF was performed in IM-treated GIST using antibodies against KIT, NANOG, and Ki-67. (Fig. 3E). We detected tumor foci containing KITlow cells with co-expression of NANOG and Ki-67. This supports our in vitro results in human tumor samples: stem cell-like KITlow cells in GIST have a higher proliferative potential. Taken together, these findings support the notion that KITlow cells have stem-like properties given their capacity to self-renew, differentiate and proliferate.
FIG. 3. KITlow GIST cells are stem cell-like.
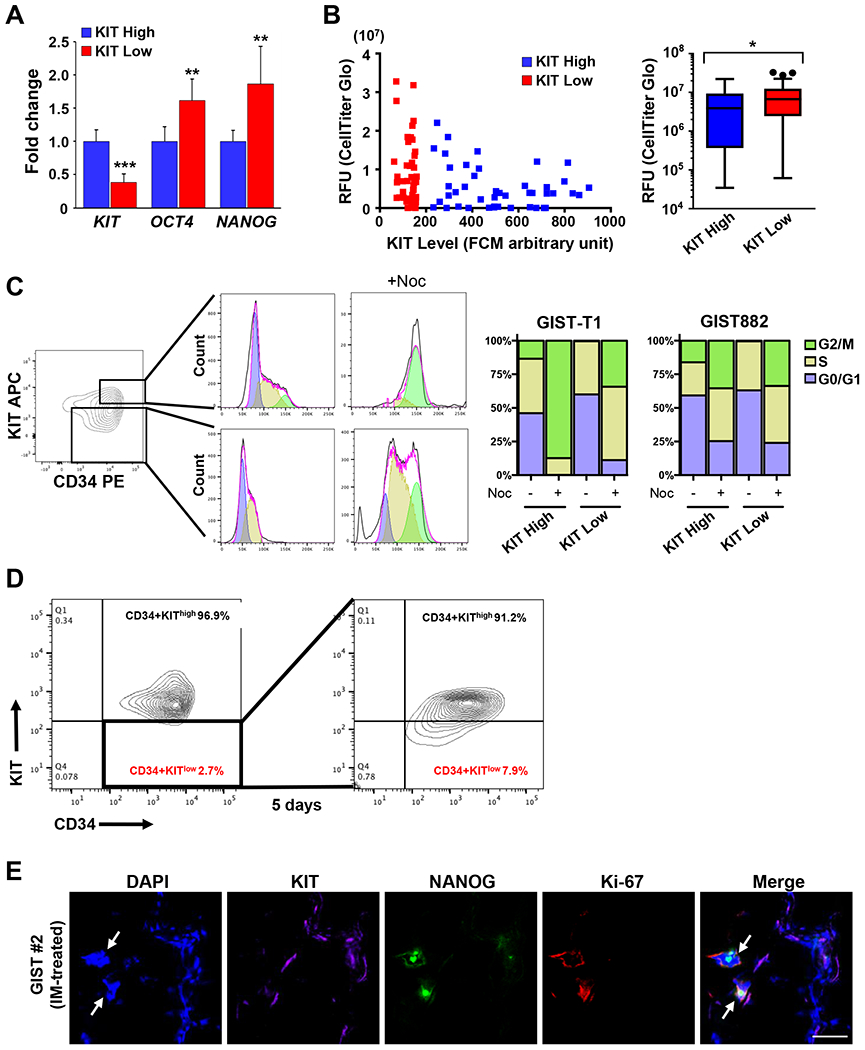
A. Relative expression level of stem markers (OCT4 and NANOG) and KIT by RT-PCR analysis in sorted GIST882 KIThigh and KITlow cells. Data performed in triplicate are shown as mean ± SD. *** P<0.001 and ** P<0.01. B. Cell viability displayed in relative fluorescence units (RFU) was determined by CellTiter-Glo assay in sorted GIST882 KIThigh and KITlow cells based on their fluorescence intensity. Box plots show the average RFU for sorted populations. *represents statistical significance P=0.042 by Mann-Whitney test. Three outliers were indicated by black dots. C. FCM contour plot show sorted KIThigh and KITlow cells inside the top and bottom boxed areas, respectively, that were collected and treated with DMSO or the microtubule inhibitor nocodazole (+Noc) for 24 hours. FCM histograms and bar graph show cell distribution within the cell cycle phases namely, G0/G1, S-phase and G2/M, from DMSO- or Noc-treated KIThigh and KITlow cells. D. FCM contour plots showed the percentages of KIThigh and KITlow cells that were derived from GIST882 KITlow cells (inside the boxed area) from the first sorting after culturing in regular growth media for 5 days. E. Representative IF staining for co-localization of KIT, NANOG, and Ki67 from IM-treated KIT exon 11 mutated GIST#2. Arrows indicate KITlow cells expressing both NANOG and Ki-67.
TKI treatment enriches for KITlow GIST cells
Gene expression analysis of matched samples pre- and post-IM treatment (Fig. 1) showed reduced KIT expression in imatinib treated tumors. Next, we examined the proportion of KITlow cells before and after imatinib treatment. IM treatment resulted in an increase in the population of KITlow cells (25.1% increase, P=0.01) and concomitant decrease in KIThigh cells (25% decrease, P=0.008) (Fig. 4A). We then tested the sensitivity of sorted cells to imatinib treatment. KIThigh cells were sensitive to imatinib treatment across a range of drug doses as compared to KITlow cells that demonstrated relative imatinib resistance, even at high drug doses (Fig. 4B). Lastly, we examined early changes in the proportion of KITlow and KIThigh cells in order to determine whether KITlow cell enrichment is a consequence of receptor downregulation or proliferation of the KITlow subpopulation (Fig. 4C–D). KIThigh cells from GIST882 pre-treated with short duration, high dose of imatinib had stable viability between 1 to 6 hours (1-hr and 3-hr, Supplemental Fig. 3) whereas significant cell death started at 24-hr post-IM. In contrast, the KITlow population was increased resulting from two events: 1) KIT protein was slightly down modulated by 6-hrs post-IM and then up to 24 hours (1-hr and 3-hr, Supplemental Fig. 3); 2) cell death of KIThigh cells began at the 24-hr time point leading to an additional enrichment of the KITlow population (Fig. 4C–D). This suggests that KITlow cells primarily represent a cell population insensitive to imatinib and there are two potential mechanisms, namely receptor downregulation and enrichment of insensitive cells, for imatinib resistance.
FIG. 4. TKI treatment enriches for KITlow GIST cells.
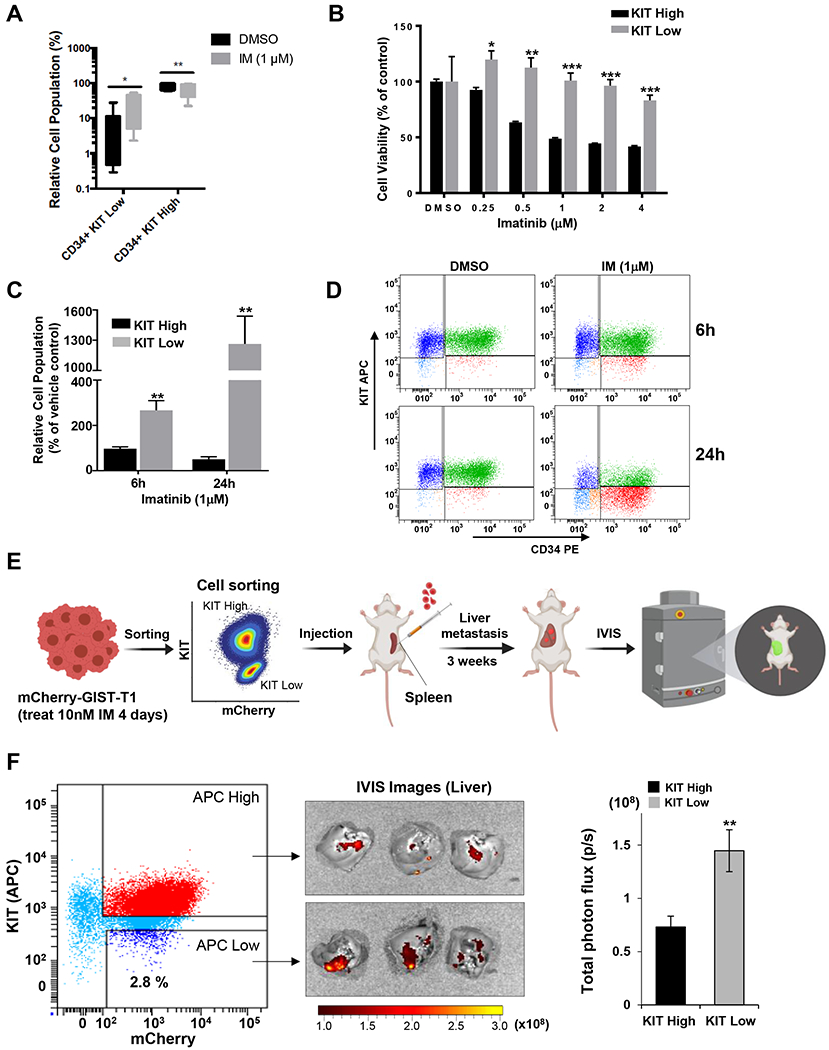
A. GIST882 cells were treated with 1 μM IM for 48 hours. FCM analysis performed on treated and untreated cells. Box-and-whisker plots depict median values ± standard deviation. B. GIST882 cells underwent FACS to separate KIThigh/low populations. Cell viability of sorted KIThigh and KITlow cells treated with indicated doses of IM for 72 hours. DMSO-treated cells were set as 100% viability. Statistical significance is indicated by *** P<0.001, ** P<0.01, and * P<0.05. C. Relative cell population from sub-groups of KIThigh and KITlow cells after treated GIST882 with 1μM IM for 6 or 24 hours and determined by FCM. Counts from cells treated with DMSO in each group at each time point were set as the baseline (100%). ** P<0.01. D. Representative FCM dot plots showed the sub-groups of KIThigh and KITlow cells from GIST882 cells 6- or 24-hr post-treatment with 1 μM IM. E. Flowchart diagram for in vivo testing of sorted KIThigh and KITlow from mCherry-GIST cells pre-treated with 10nM IM for 4 days in a liver metastasis model. F. FCM dot plot displayed cell sorting for KIThigh and KITlow from mCherry-T1 cells. IVIS images of the whole liver were obtained from all animals. Bar graph showed the liver metastasis quantified by the total photon flux (p/s). ** P<0.01.
To address the stem-like proliferative potential of KITlow cells in vivo, we utilized a spleen-to-liver metastasis mouse model as we have previously reported.(58) mCherry-labeled T1 cells after IM treatment were sorted into KIThigh and KITlow cells. Equal cell numbers from each sub-population were injected into the spleens of nude mice (n = 3 per group) and liver metastases were evaluated (Fig. 4E–F; Supplementary Fig. 4). KITlow cells show engraftment potential in this metastatic GIST animal model. Taken together, our findings indicate that imatinib treatment enriches KITlow cells have higher proliferative potential in vitro and in vivo.
KITlow primary tumors have distinct pathway activation
KITlow cells are present in genetically diverse forms of GIST. To better understand pathway activation that predominates within the KITlow subpopulation, we utilized a bioinformatic approach. In this analysis framework, GIST samples are used to define top oncogenic states and the top transcriptional component pathways that are statistically significant or near significant.(32) The map defines the top 5 oncogenic states and the top 5 transcriptional component pathways in GIST (Supplementary Fig. 5). In an unsupervised manner, the map naturally separates states based on KIT expression (Fig. 5). Interrogating KITlow samples revealed 2 distinct oncogenic states. One state was of particular interest (circled), which is associated with stem cell pathways, Gas6/AXL (transcript expression) and NF-κB gene sets. This agnostic data-driven approach serves as an encouraging validation of the in vitro cell line and primary tumor analysis that SATF activation occurs in KITlow cells. Furthermore, the value of the Onco-GPS map is to understand parallel pathway activation within a given oncogenic state. We noted that AXL and NF-κB were associated with a KITlow state. This is supported by enrichment of NF-κB (gene sets) and AXL receptor (transcripts) in the IM-treated tumors (GEO dataset GSE15966(28)) (Fig. 1A). Therefore, these pathways may represent novel targets for inhibition of KITlow GIST cells.
NF-κB and GAS6/AXL inhibition augments imatinib toxicity
We next tested the in vitro effect of TKI treatment in GIST cell lines. As demonstrated previously, IM treatment results in enrichment of resistant KITlow cells. GIST882 cells treated for 3 days with IM (300 nM) resulted in 46% cell viability as compared to control treatment (P<0.001, Fig. 6A). Cells were then retreated with imatinib for an additional 3 days or switched to DMSO for a total of 6-day treatment. Subsequent treatment with DMSO resulted in expected cell recovery. However, additional treatment with imatinib had limited additional toxicity with a final cell viability of 32%. Based on our prior evidence, we hypothesized that the plateau in cytotoxicity (between 3- and 6-day IM treatment) is determined by the KITlow subpopulation. We next aimed to apply the insights gleaned through the Onco-GPS map to drug pathways that may target KITlow cells. The Onco-GPS map revealed enrichment in TAM receptors (Tyro3, AXL, and MerTK) in KITlow, which are known to mediate TKI resistance in several cancer types.(59) Additionally, NF-κB is a well-established regulator of stemness and drug resistance.(60) To test these hypotheses, we utilized inhibitors for TAM receptors (R428, bemcentinib/BEM(61)) and NF-κB (bardoxolone/BARD(62)). We tested cytotoxicity of unsorted cells after pretreatment with imatinib (185 nM, for 72 hours) to enrich KITlow cells for subsequent treatments. Imatinib sensitized cells to BEM (1 μM, 70%, P<0.001), and BARD (1 μM, 73%, P<0.001) (Fig. 6B). In addition, combination treatment with imatinib and either inhibitor was more effective than imatinib treatment alone, exerting killing up to 85% as compared with controls (P<0.05, Fig. 6B). Similar effects were observed in GIST-T1 cells. More specifically, T1 cells treated for 3 days with IM (20 nM) resulted in 44% cell viability as compared to control treatment (P<0.001, Fig. 6C). Imatinib sensitized T1 cells to BEM (1 μM, 82%, P<0.001) and BARD (1 μM, 62%, P<0.001) (Fig. 6D). Combination of imatinib with either BEM or BARD was more potent than imatinib alone (P<0.001, Fig. 6D). We next sought to access the change of AXL and NF-κB expression when treated with BEM and BARD inhibitors, respectively. Our data showed that a decrease in NF-kB p65 phosphorylation level was detected as early as 60 minutes when inhibited with BARD (Fig. 6E). Inhibition of AXL phosphorylation by BEM treatment was detected as early as 30 minutes (Fig. 6F). Taken together, these data indicate that IM-resistant KITlow GIST cells are a targetable compartment, and that inhibition of TAM- and NF-κB pathways alone or in combination with TKI can serve as platforms for future studies.
FIG. 6. Combination drug treatment is cytotoxic in IM-resistant GIST.
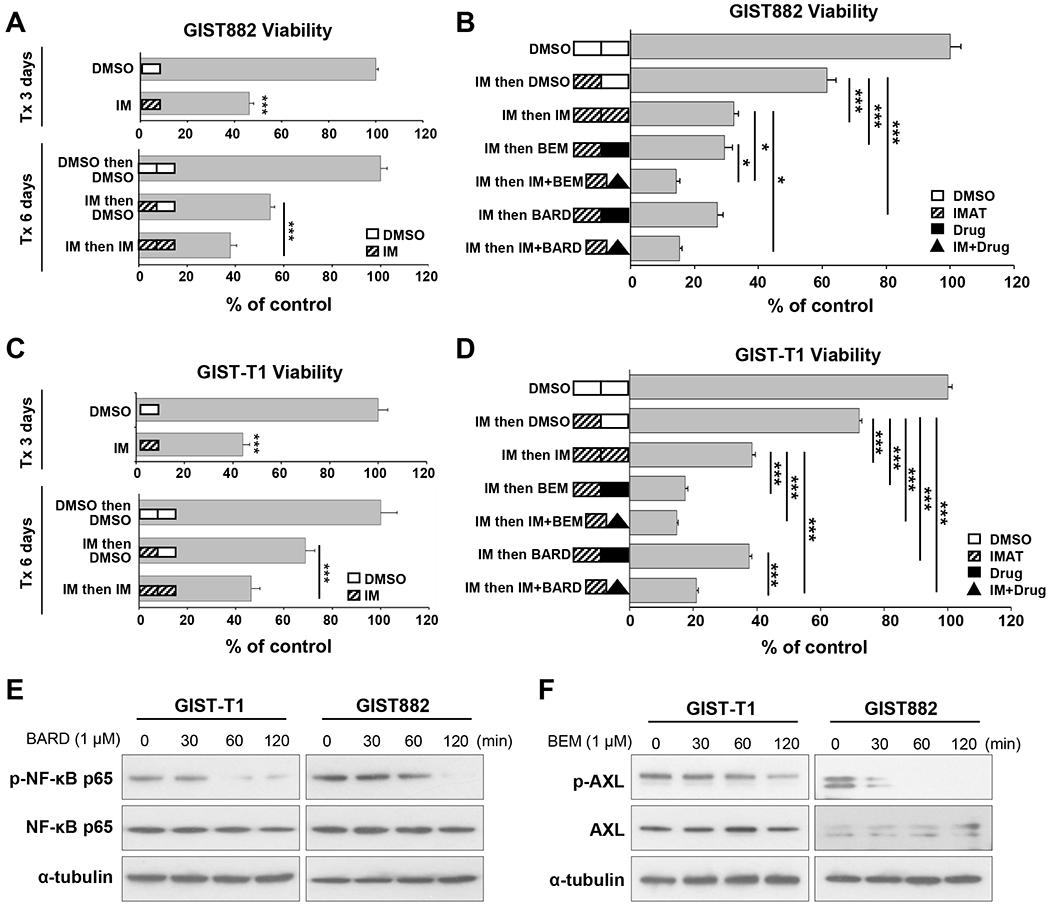
A. Cell viability for GIST882 cells in sequential treatment experiments with 300 nM IM (dose selected based on IC75). Some cells were treated for a total of 6 days. After 3-day IM treatment (i.e. Days 1-3), remaining cells in wells were refreshed with new media containing DMSO or IM then cultured for an additional 3 days (i.e. Days 4-6). For the 3-day group, cells treated with DMSO were set as controls of 100% viability; whereas controls for the 6-day group were cells in DMSO from Days 1-3 then in DMSO from Days 4-6. B. Cell viability for GIST882 cells treated with 185 nM IM (dose selected based on IC50) followed by various compounds in sequential treatment experiments. After 3-day IM treatment (i.e. Days 1-3), remaining cells were refed with fresh media containing DMSO, 185nM IM, 1μM BARD, 1 μM BEM, or combination of IM and indicated drugs were then cultured for an additional 3 days (i.e. Days 4-6). C. Cell viability for GIST-T1 cells in sequential treatment experiments with 20 nM IM (dose selected based on IC75). Some T1 cells underwent 6-day treatment as described above in (A) for GIST882 cells. D. Cell viability for GIST-T1 cells with 20 nM IM treatment for 3 days then followed with various compounds and 20 nM IM in sequential treatment as described above in (B) for GIST882 cells. DMSO-treated cells (for total 6 days) were set as 100% viability controls. Statistical significance is indicated by *** P<0.001 and * P<0.05. E. GIST cells were treated with 1μM BARD for indicated time and lysed for Western blotting to detect total NF-kB p65 protein and phospho-NF-kB p65 (Ser536). F. Immunoblots from GIST cells treated with 1μM BEM for indicated time and probed for total AXL and phosphor-AXL. Alpha-tubulin was used a loading control.
Discussion
Imatinib (IM) activity in gastrointestinal stromal tumor serves as a paradigm for targeted therapy in solid organ malignancies. However, IM does not cure GIST and a majority of patients either develop resistance on therapy, or experience disease recurrence after discontinuation of therapy. Failure of KIT targeted therapies prompted us to hypothesize that a KIT-insensitive subpopulation may serve as a mechanism of disease persistence. In this study, we find that KITlow cells are a distinct subpopulation in human GIST, which have intrinsic (i.e., de novo or primary) IM-resistance. Moreover, TKI treatment induces enrichment of this KITlow cellular subpopulation, which expresses stem-associated transcription factors and has several functional properties of bona fide cancer stem cells in vitro and in vivo. To further characterize the KITlow phenotype, we employed a data-driven integrative bioinformatic approach which identified Gas6/AXL and the NF-κB pathway as putative novel therapeutic targets in vitro. Together, these data suggest that KITlow cells may function as a targetable cellular compartment in GIST that is a source of disease persistence despite molecularly matched therapy for KIT oncogene driven disease.
The role of cancer stem cells (CSCs) in GIST has been poorly understood. Characterization of GIST CSCs has been partly derailed by the observation that well established markers of CSCs (e.g., CD44 and CD133) are ubiquitously expressed on GIST cells.(23) Additionally, KIT/CD117 is the stem cell factor receptor (SCFR) and has been proposed as the source of drug resistance, disease recurrence, and metastasis in many other tumor types.(63,64) In the absence of established surface markers, several studies have interrogated alternate candidates for markers of GIST CSCs. BMI1, TERT and KLF4 were found to be preferentially expressed in GISTs, and expression of BMI1 was found to correlate with advanced disease.(65) Moreover, Nestin, or neuroectodermal stem cell marker, expression has also been reported as a marker of aggressive forms of GIST.(66) In the current study, we find that OCT4 and NANOG are previously unappreciated stem cell associated transcription factors (SATFs) that were upregulated following TKI treatment and overexpressed in ALDHhigh and KITlow GIST cells, which both have selected hallmarks of CSC-like cells.
Although these associations are valuable, the first mechanistic insight into the role of CSCs in GIST was described in a mouse model of progenitor ICCs.(24) Bardsley et al. discovered an ICC progenitor in the gastric wall of mice with properties of stem cells including self-renewal and the ability to differentiate into mature ICCs. A cell line derived from this ICC progenitor demonstrated spontaneous transformation resulting in the formation of GIST-like tumors. Importantly, this ICC progenitor was noted to have low KIT expression compared to its mature ICC counterpart. Here, we find that KITlow cells are a distinct cellular subpopulation within human GISTs. These cells are quiescent, but have greater replicative capacity and superior colony-forming potential than KIThigh cells. Additionally, isolated and cultured KITlow cells give rise to KIThigh cells. Moreover, imatinib treatment preferentially enriches KITlow cells while having a cytotoxic effect on KIThigh cells. These results suggest that KITlow cells have stem-like properties, and may represent a reservoir for disease persistence following TKI therapy. This model mirrors an established mechanism of CML disease persistence in which CML stem progenitors have been shown to be quiescent, stem-like cells that exhibit imatinib resistance.(67)
The notion that some GIST lack KIT expression is known and these KIT-negative tumors were found to harbor primarily PDGFRA mutations.(68) In a recent paper, Tu et al. profiled tyrosine kinases that were differentially activated in IM-resistant cell lines of KIT-negative GIST.(69) They found that EGFR, AXL, EPHA2 and FAK were active in KIT-negative cell lines. Interestingly, AXL knockdown and pathway inhibition was found to be cytotoxic in an IM-resistant GIST line. AXL has also been previously shown to be important in imatinib-resistant GIST.(70,71) In the current study, we utilized a bioinformatic approach to identify co-functioning pathways within a KITlow, stem cell associated oncogenic state. We confirmed that Gas6/AXL and other TAM receptors (Tyro3 and MerTK) were associated with this state. AXL is an attractive target as it has also been previously reported to increase tumorigenicity of breast CSCs resulting in decreased breast CSC chemosensitivity.(72) Increased expression of AXL also accounts for TKI resistance in EGFR-mutant non-small cell lung cancer,(73) pancreatic cancer metastases,(74) and melanoma.(47,75) In addition to the prior reports in GIST, we now find that AXL inhibition augments imatinib cytotoxicity presumably by targeting the KITlow compartment. This result was observed in imatinib-naïve cells compared to imatinib-resistant cell lines as shown in prior reports.(69,70) The Onco-GPS bioinformatic analysis also suggested that NF-κB is active in KITlow cells. NF-κB has been previously implicated in GIST tumorigenesis through an autoregulatory loop or recruitment of tumor-associated macrophages.(76,77) Here, we found that the addition of NF-κB inhibition to imatinib resulted in augmented cell killing over IM-treatment alone. Thus, our findings provide new evidence for therapeutic targets in a rare subpopulation of GIST that is imatinib-resistant in the absence of imatinib selection pressure.
This study has several limitations. First, KITlow cells are a rare cell subpopulation. FACS-isolated KITlow cells “differentiate” quickly, which poses technical challenges to studying this cell population in downstream experiments. We addressed this by enriching the proportion of KITlow cells with imatinib pretreatment prior to FACS, which also mimics patient treatment schema. Indeed, our data supported the notion that TKI-resistant cells with stem-like characteristics are responsible for disease recurrence. However, an immortalized cell line would be a valuable resource to study this cell population. Additionally, negative marker selection is a suboptimal method of cellular sorting. We attempted several methods of transcriptomic and proteomic screening KITlow cells for over 240 surface markers (Supplemental Table 3). However, we were not able to identify a unique positive selection marker for the subpopulation. We addressed this limitation by performing a rigid methodology of fluorescence minus one (FMO) controls within our FACS protocol that enabled reproducible isolation of the KITlow subpopulation, which was capable of complementary analyses.
Despite the success of IM in GIST therapy, disease persistence remains an unaddressed challenge. Here, we report that KITlow cells are stem-like cells within human GISTs that have primary IM resistance. These KITlow cells also possess distinct pathway activation that can be targeted to eradicate this IM-resistant cellular compartment. Our findings support the role of combinatorial therapeutic approaches to overcome drug resistance or to treat disease persistence in GIST.
Supplementary Material
Conflict of interest:
J.K.S receives research funding from Amgen Pharmaceuticals and Foundation Medicine, consultant fees from Deciphera, speaker’s fees from Deciphera, Foundation Medicine, La-Hoffman Roche, Merck, MJH Life Sciences, QED Therapeutics, and has stock in Personalis. These disclosures had no impact on any of the work presented in this manuscript. There are no conflicts of interest to declare by the remaining authors.
Financial Support:
We appreciate funding support from the Surgical Society of the Alimentary Tract (SSAT) Mentored Research Award (S.B.) and NIH T32 CA121938 Cancer Therapeutics (CT2) Training Fellowship (S.B.). In addition, we appreciate funding support from Hope for a Cure Foundation (J.K.S.), The Life Raft Group (J.K.S.), Kristen Ann Carr Fund (J.K.S.), Lighting the Path Forward for GIST Cancer Research (J.K.S.), The David Foundation (J.K.S.), Pedal the Cause (J.K.S., R.W-R.), NIH K08 CA168999 (J.K.S.), NIH R01 CA226803 (J.K.S.), FDA R01 FD006334 (J.K.S.), R01CA226803 (P.T), U01CA217885 (P.T, J.M., H.Y., S.T.), U24CA194107 (J.M., P.T), U24 CA220341 (JM, PT), R01 GM074024 (JM, PT), U24 CA248457 (J.M., P.T.), P30 CA023100 (P.T. HY, ST), R01HG009285 (P.T), R01DE026870 (P.T), U01DE028227 (P.T), U54CA209891 (P.T) and T15LM011271 (ATW).
References
- 1.Ma GL, Murphy JD, Martinez ME, Sicklick JK. Epidemiology of gastrointestinal stromal tumors in the era of histology codes: results of a population-based study. Cancer Epidemiol Biomarkers Prev 2015;24(1):298–302 doi 10.1158/1055-9965.EPI-14-1002. [DOI] [PMC free article] [PubMed] [Google Scholar]
- 2.Joensuu H, Vehtari A, Riihimaki J, Nishida T, Steigen SE, Brabec P, et al. Risk of recurrence of gastrointestinal stromal tumour after surgery: an analysis of pooled population-based cohorts. Lancet Oncol 2012;13(3):265–74 doi 10.1016/S1470-2045(11)70299-6. [DOI] [PubMed] [Google Scholar]
- 3.Dematteo RP, Ballman KV, Antonescu CR, Maki RG, Pisters PW, Demetri GD, et al. Adjuvant imatinib mesylate after resection of localised, primary gastrointestinal stromal tumour: a randomised, double-blind, placebo-controlled trial. Lancet 2009;373(9669):1097–104 doi 10.1016/S0140-6736(09)60500-6. [DOI] [PMC free article] [PubMed] [Google Scholar]
- 4.Joensuu H, Eriksson M, Sundby Hall K, Hartmann JT, Pink D, Schutte J, et al. One vs three years of adjuvant imatinib for operable gastrointestinal stromal tumor: a randomized trial. JAMA 2012;307(12):1265–72 doi 10.1001/jama.2012.347. [DOI] [PubMed] [Google Scholar]
- 5.Le Cesne A, Ray-Coquard I, Bui BN, Adenis A, Rios M, Bertucci F, et al. Discontinuation of imatinib in patients with advanced gastrointestinal stromal tumours after 3 years of treatment: an open-label multicentre randomised phase 3 trial. Lancet Oncol 2010;11(10):942–9 doi 10.1016/S1470-2045(10)70222-9. [DOI] [PubMed] [Google Scholar]
- 6.Reichardt P, Demetri GD, Gelderblom H, Rutkowski P, Im SA, Gupta S, et al. Correlation of KIT and PDGFRA mutational status with clinical benefit in patients with gastrointestinal stromal tumor treated with sunitinib in a worldwide treatment-use trial. BMC Cancer 2016;16:22 doi 10.1186/s12885-016-2051-5. [DOI] [PMC free article] [PubMed] [Google Scholar]
- 7.Ben-Ami E, Barysauskas CM, von Mehren M, Heinrich MC, Corless CL, Butrynski JE, et al. Long-term follow-up results of the multicenter phase II trial of regorafenib in patients with metastatic and/or unresectable GI stromal tumor after failure of standard tyrosine kinase inhibitor therapy. Ann Oncol 2016;27(9):1794–9 doi 10.1093/annonc/mdw228. [DOI] [PMC free article] [PubMed] [Google Scholar]
- 8.Wardelmann E, Thomas N, Merkelbach-Bruse S, Pauls K, Speidel N, Buttner R, et al. Acquired resistance to imatinib in gastrointestinal stromal tumours caused by multiple KIT mutations. Lancet Oncol 2005;6(4):249–51 doi 10.1016/S1470-2045(05)70097-8. [DOI] [PubMed] [Google Scholar]
- 9.Alkhuziem M, Burgoyne AM, Fanta PT, Tang CM, Sicklick JK. The Call of “The Wild”-Type GIST: It’s Time for Domestication. J Natl Compr Canc Netw 2017;15(5):551–4. [DOI] [PMC free article] [PubMed] [Google Scholar]
- 10.Corless CL, Barnett CM, Heinrich MC. Gastrointestinal stromal tumours: origin and molecular oncology. Nat Rev Cancer 2011;11(12):865–78 doi 10.1038/nrc3143. [DOI] [PubMed] [Google Scholar]
- 11.Burgoyne AM, Somaiah N, Sicklick JK. Gastrointestinal Stromal Tumors in the Setting of Multiple Tumor Syndromes. Current Opinion in Oncology 2014:In Press. [DOI] [PubMed] [Google Scholar]
- 12.Heinrich MC, Jones RL, von Mehren M, Schoffski P, Serrano C, Kang YK, et al. Avapritinib in advanced PDGFRA D842V-mutant gastrointestinal stromal tumour (NAVIGATOR): a multicentre, open-label, phase 1 trial. Lancet Oncol 2020;21(7):935–46 doi 10.1016/S1470-2045(20)30269-2. [DOI] [PubMed] [Google Scholar]
- 13.Rubin BP, Heinrich MC, Corless CL. Gastrointestinal stromal tumour. Lancet 2007;369(9574):1731–41 doi 10.1016/S0140-6736(07)60780-6. [DOI] [PubMed] [Google Scholar]
- 14.Liegl-Atzwanger B, Fletcher JA, Fletcher CD. Gastrointestinal stromal tumors. Virchows Arch 2010;456(2):111–27 doi 10.1007/s00428-010-0891-y. [DOI] [PubMed] [Google Scholar]
- 15.Agaram NP, Wong GC, Guo T, Maki RG, Singer S, Dematteo RP, et al. Novel V600E BRAF mutations in imatinib-naive and imatinib-resistant gastrointestinal stromal tumors. Genes Chromosomes Cancer 2008;47(10):853–9 doi 10.1002/gcc.20589. [DOI] [PMC free article] [PubMed] [Google Scholar]
- 16.Shi E, Chmielecki J, Tang CM, Wang K, Heinrich MC, Kang G, et al. FGFR1 and NTRK3 actionable alterations in “Wild-Type” gastrointestinal stromal tumors. J Transl Med 2016;14(1):339 doi 10.1186/s12967-016-1075-6. [DOI] [PMC free article] [PubMed] [Google Scholar]
- 17.Brenca M, Rossi S, Polano M, Gasparotto D, Zanatta L, Racanelli D, et al. Transcriptome sequencing identifies ETV6-NTRK3 as a gene fusion involved in GIST. J Pathol 2015. doi 10.1002/path.4677. [DOI] [PubMed] [Google Scholar]
- 18.Hechtman JF, Zehir A, Mitchell T, Borsu L, Singer S, Tap W, et al. Novel oncogene and tumor suppressor mutations in KIT and PDGFRA wild type gastrointestinal stromal tumors revealed by next generation sequencing. Genes Chromosomes Cancer 2015;54(3):177–84 doi 10.1002/gcc.22230. [DOI] [PMC free article] [PubMed] [Google Scholar]
- 19.Seidal T, Edvardsson H. Expression of c-kit (CD117) and Ki67 provides information about the possible cell of origin and clinical course of gastrointestinal stromal tumours. Histopathology 1999;34(5):416–24. [DOI] [PubMed] [Google Scholar]
- 20.Sircar K, Hewlett BR, Huizinga JD, Chorneyko K, Berezin I, Riddell RH. Interstitial cells of Cajal as precursors of gastrointestinal stromal tumors. Am J Surg Pathol 1999;23(4):377–89. [DOI] [PubMed] [Google Scholar]
- 21.Wang L, Vargas H, French SW. Cellular origin of gastrointestinal stromal tumors: a study of 27 cases. Arch Pathol Lab Med 2000;124(10):1471–5. [DOI] [PubMed] [Google Scholar]
- 22.Beadling C, Patterson J, Justusson E, Nelson D, Pantaleo MA, Hornick JL, et al. Gene expression of the IGF pathway family distinguishes subsets of gastrointestinal stromal tumors wild type for KIT and PDGFRA. Cancer Med 2013;2(1):21–31 doi 10.1002/cam4.57. [DOI] [PMC free article] [PubMed] [Google Scholar]
- 23.Chen J, Guo T, Zhang L, Qin LX, Singer S, Maki RG, et al. CD133 and CD44 are universally overexpressed in GIST and do not represent cancer stem cell markers. Genes Chromosomes Cancer 2011. doi 10.1002/gcc.20942. [DOI] [PMC free article] [PubMed] [Google Scholar]
- 24.Bardsley MR, Horvath VJ, Asuzu DT, Lorincz A, Redelman D, Hayashi Y, et al. Kitlow stem cells cause resistance to Kit/platelet-derived growth factor alpha inhibitors in murine gastrointestinal stromal tumors. Gastroenterology 2010;139(3):942–52 doi 10.1053/j.gastro.2010.05.083. [DOI] [PMC free article] [PubMed] [Google Scholar]
- 25.Taguchi T, Sonobe H, Toyonaga S, Yamasaki I, Shuin T, Takano A, et al. Conventional and molecular cytogenetic characterization of a new human cell line, GIST-T1, established from gastrointestinal stromal tumor. Lab Invest 2002;82(5):663–5. [DOI] [PubMed] [Google Scholar]
- 26.Tuveson DA, Willis NA, Jacks T, Griffin JD, Singer S, Fletcher CD, et al. STI571 inactivation of the gastrointestinal stromal tumor c-KIT oncoprotein: biological and clinical implications. Oncogene 2001;20(36):5054–8 doi 10.1038/sj.onc.1204704. [DOI] [PubMed] [Google Scholar]
- 27.Sicklick JK, Li YX, Jayaraman A, Kannangai R, Qi Y, Vivekanandan P, et al. Dysregulation of the Hedgehog pathway in human hepatocarcinogenesis. Carcinogenesis 2006;27(4):748–57 doi 10.1093/carcin/bgi292. [DOI] [PubMed] [Google Scholar]
- 28.Rink L, Skorobogatko Y, Kossenkov AV, Belinsky MG, Pajak T, Heinrich MC, et al. Gene expression signatures and response to imatinib mesylate in gastrointestinal stromal tumor. Mol Cancer Ther 2009;8(8):2172–82 doi 1535-7163.MCT-09-0193 [pii] 10.1158/1535-7163.MCT-09-0193. [DOI] [PMC free article] [PubMed] [Google Scholar]
- 29.Subramanian A, Tamayo P, Mootha VK, Mukherjee S, Ebert BL, Gillette MA, et al. Gene set enrichment analysis: a knowledge-based approach for interpreting genome-wide expression profiles. Proc Natl Acad Sci U S A 2005;102(43):15545–50 doi 10.1073/pnas.0506580102. [DOI] [PMC free article] [PubMed] [Google Scholar]
- 30.Mootha VK, Lindgren CM, Eriksson KF, Subramanian A, Sihag S, Lehar J, et al. PGC-1alpha-responsive genes involved in oxidative phosphorylation are coordinately downregulated in human diabetes. Nat Genet 2003;34(3):267–73 doi 10.1038/ng1180. [DOI] [PubMed] [Google Scholar]
- 31.Vitiello GA, Bowler TG, Liu M, Medina BD, Zhang JQ, Param NJ, et al. Differential immune profiles distinguish the mutational subtypes of gastrointestinal stromal tumor. J Clin Invest 2019;129(5):1863–77 doi 10.1172/JCI124108. [DOI] [PMC free article] [PubMed] [Google Scholar]
- 32.Kim JW, Abudayyeh OO, Yeerna H, Yeang CH, Stewart M, Jenkins RW, et al. Decomposing Oncogenic Transcriptional Signatures to Generate Maps of Divergent Cellular States. Cell Syst 2017;5(2):105–18 e9 doi 10.1016/j.cels.2017.08.002. [DOI] [PMC free article] [PubMed] [Google Scholar]
- 33.Liberzon A, Subramanian A, Pinchback R, Thorvaldsdottir H, Tamayo P, Mesirov JP. Molecular signatures database (MSigDB) 3.0. Bioinformatics 2011;27(12):1739–40 doi 10.1093/bioinformatics/btr260. [DOI] [PMC free article] [PubMed] [Google Scholar]
- 34.Liberzon A A description of the Molecular Signatures Database (MSigDB) Web site. Methods Mol Biol 2014;1150:153–60 doi 10.1007/978-1-4939-0512-6_9. [DOI] [PubMed] [Google Scholar]
- 35.Ostrowski J, Polkowski M, Paziewska A, Skrzypczak M, Goryca K, Rubel T, et al. Functional features of gene expression profiles differentiating gastrointestinal stromal tumours according to KIT mutations and expression. BMC Cancer 2009;9:413 doi 1471-2407-9-413 [pii] 10.1186/1471-2407-9-413. [DOI] [PMC free article] [PubMed] [Google Scholar]
- 36.Astolfi A, Nannini M, Pantaleo MA, Di Battista M, Heinrich MC, Santini D, et al. A molecular portrait of gastrointestinal stromal tumors: an integrative analysis of gene expression profiling and high-resolution genomic copy number. Lab Invest 2010;90(9):1285–94 doi labinvest2010110 [pii] 10.1038/labinvest.2010.110. [DOI] [PubMed] [Google Scholar]
- 37.Edgar R, Domrachev M, Lash AE. Gene Expression Omnibus: NCBI gene expression and hybridization array data repository. Nucleic Acids Res 2002;30(1):207–10 doi 10.1093/nar/30.1.207. [DOI] [PMC free article] [PubMed] [Google Scholar]
- 38.Kang HJ, Nam SW, Kim H, Rhee H, Kim NG, Kim H, et al. Correlation of KIT and platelet-derived growth factor receptor alpha mutations with gene activation and expression profiles in gastrointestinal stromal tumors. Oncogene 2005;24(6):1066–74 doi 10.1038/sj.onc.1208358. [DOI] [PubMed] [Google Scholar]
- 39.Kannan R, Ballard G, Park H. A high-performance parallel algorithm for nonnegative matrix factorization. Proceedings of the 21st ACM SIGPLAN Symposium on Principles and Practice of Parallel Programming. Barcelona, Spain: Association for Computing Machinery; 2016. p Article 9. [Google Scholar]
- 40.Kim JW, Botvinnik OB, Abudayyeh O, Birger C, Rosenbluh J, Shrestha Y, et al. Characterizing genomic alterations in cancer by complementary functional associations. Nat Biotechnol 2016;34(5):539–46 doi 10.1038/nbt.3527. [DOI] [PMC free article] [PubMed] [Google Scholar]
- 41.Joe H Relative Entropy Measures of Multivariate Dependence. Journal of the American Statistical Association 1989;84(405):157–64 doi 10.1080/01621459.1989.10478751. [DOI] [Google Scholar]
- 42.Linfoot EH. An informational measure of correlation. Information and Control 1957;1(1):85–9 doi 10.1016/S0019-9958(57)90116-X. [DOI] [Google Scholar]
- 43.Cowley GS, Weir BA, Vazquez F, Tamayo P, Scott JA, Rusin S, et al. Parallel genome-scale loss of function screens in 216 cancer cell lines for the identification of context-specific genetic dependencies. Sci Data 2014;1:140035 doi 10.1038/sdata.2014.35. [DOI] [PMC free article] [PubMed] [Google Scholar]
- 44.Abazeed ME, Adams DJ, Hurov KE, Tamayo P, Creighton CJ, Sonkin D, et al. Integrative radiogenomic profiling of squamous cell lung cancer. Cancer Res 2013;73(20):6289–98 doi 10.1158/0008-5472.CAN-13-1616. [DOI] [PMC free article] [PubMed] [Google Scholar]
- 45.Stewart ML, Tamayo P, Wilson AJ, Wang S, Chang YM, Kim JW, et al. KRAS Genomic Status Predicts the Sensitivity of Ovarian Cancer Cells to Decitabine. Cancer Res 2015;75(14):2897–906 doi 10.1158/0008-5472.CAN-14-2860. [DOI] [PMC free article] [PubMed] [Google Scholar]
- 46.Wilson FH, Johannessen CM, Piccioni F, Tamayo P, Kim JW, Van Allen EM, et al. A functional landscape of resistance to ALK inhibition in lung cancer. Cancer Cell 2015;27(3):397–408 doi 10.1016/j.ccell.2015.02.005. [DOI] [PMC free article] [PubMed] [Google Scholar]
- 47.Konieczkowski DJ, Johannessen CM, Abudayyeh O, Kim JW, Cooper ZA, Piris A, et al. A melanoma cell state distinction influences sensitivity to MAPK pathway inhibitors. Cancer Discov 2014;4(7):816–27 doi 10.1158/2159-8290.CD-13-0424. [DOI] [PMC free article] [PubMed] [Google Scholar]
- 48.Hanaford AR, Archer TC, Price A, Kahlert UD, Maciaczyk J, Nikkhah G, et al. DiSCoVERing Innovative Therapies for Rare Tumors: Combining Genetically Accurate Disease Models with In Silico Analysis to Identify Novel Therapeutic Targets. Clin Cancer Res 2016;22(15):3903–14 doi 10.1158/1078-0432.CCR-15-3011. [DOI] [PMC free article] [PubMed] [Google Scholar]
- 49.Feng X, Arang N, Rigiracciolo DC, Lee JS, Yeerna H, Wang Z, et al. A Platform of Synthetic Lethal Gene Interaction Networks Reveals that the GNAQ Uveal Melanoma Oncogene Controls the Hippo Pathway through FAK. Cancer Cell 2019;35(3):457–72 e5 doi 10.1016/j.ccell.2019.01.009. [DOI] [PMC free article] [PubMed] [Google Scholar]
- 50.Reilly B, Tanaka TN, Diep D, Yeerna H, Tamayo P, Zhang K, et al. DNA methylation identifies genetically and prognostically distinct subtypes of myelodysplastic syndromes. Blood Adv 2019;3(19):2845–58 doi 10.1182/bloodadvances.2019000192. [DOI] [PMC free article] [PubMed] [Google Scholar]
- 51.Liu C, Sadat SH, Ebisumoto K, Sakai A, Panuganti BA, Ren S, et al. Cannabinoids Promote Progression of HPV-Positive Head and Neck Squamous Cell Carcinoma via p38 MAPK Activation. Clinical cancer research : an official journal of the American Association for Cancer Research 2020;26(11):2693–703 doi 10.1158/1078-0432.CCR-18-3301. [DOI] [PMC free article] [PubMed] [Google Scholar]
- 52.Kim JW, Berrios C, Kim M, Schade AE, Adelmant G, Yeerna H, et al. STRIPAK directs PP2A activity toward MAP4K4 to promote oncogenic transformation of human cells. Elife 2020;9 doi 10.7554/eLife.53003. [DOI] [PMC free article] [PubMed] [Google Scholar]
- 53.Barbie DA, Tamayo P, Boehm JS, Kim SY, Moody SE, Dunn IF, et al. Systematic RNA interference reveals that oncogenic KRAS-driven cancers require TBK1. Nature 2009;462(7269):108–12 doi 10.1038/nature08460. [DOI] [PMC free article] [PubMed] [Google Scholar]
- 54.Liberzon A, Birger C, Thorvaldsdottir H, Ghandi M, Mesirov JP, Tamayo P. The Molecular Signatures Database (MSigDB) hallmark gene set collection. Cell Syst 2015;1(6):417–25 doi 10.1016/j.cels.2015.12.004. [DOI] [PMC free article] [PubMed] [Google Scholar]
- 55.Chaicharoenaudomrung N, Kunhorm P, Noisa P. Three-dimensional cell culture systems as an in vitro platform for cancer and stem cell modeling. World J Stem Cells 2019;11(12):1065–83 doi 10.4252/wjsc.v11.i12.1065. [DOI] [PMC free article] [PubMed] [Google Scholar]
- 56.Ma I, Allan AL. The role of human aldehyde dehydrogenase in normal and cancer stem cells. Stem Cell Rev Rep 2011;7(2):292–306 doi 10.1007/s12015-010-9208-4. [DOI] [PubMed] [Google Scholar]
- 57.Yu J, Vodyanik MA, Smuga-Otto K, Antosiewicz-Bourget J, Frane JL, Tian S, et al. Induced pluripotent stem cell lines derived from human somatic cells. Science 2007;318(5858):1917–20 doi 10.1126/science.1151526. [DOI] [PubMed] [Google Scholar]
- 58.Yoon H, Tang CM, Banerjee S, Yebra M, Noh S, Burgoyne AM, et al. Cancer-associated fibroblast secretion of PDGFC promotes gastrointestinal stromal tumor growth and metastasis. Oncogene 2021. doi 10.1038/s41388-021-01685-w. [DOI] [PMC free article] [PubMed] [Google Scholar]
- 59.Vouri M, Hafizi S. TAM Receptor Tyrosine Kinases in Cancer Drug Resistance. Cancer Res 2017;77(11):2775–8 doi 10.1158/0008-5472.CAN-16-2675. [DOI] [PubMed] [Google Scholar]
- 60.Kaltschmidt C, Banz-Jansen C, Benhidjeb T, Beshay M, Forster C, Greiner J, et al. A Role for NF-kappaB in Organ Specific Cancer and Cancer Stem Cells. Cancers (Basel) 2019;11(5) doi 10.3390/cancers11050655. [DOI] [PMC free article] [PubMed] [Google Scholar]
- 61.Holland SJ, Pan A, Franci C, Hu Y, Chang B, Li W, et al. R428, a selective small molecule inhibitor of Axl kinase, blocks tumor spread and prolongs survival in models of metastatic breast cancer. Cancer Res 2010;70(4):1544–54 doi 10.1158/0008-5472.CAN-09-2997. [DOI] [PubMed] [Google Scholar]
- 62.Ahmad R, Raina D, Meyer C, Kharbanda S, Kufe D. Triterpenoid CDDO-Me blocks the NF-kappaB pathway by direct inhibition of IKKbeta on Cys-179. J Biol Chem 2006;281(47):35764–9 doi 10.1074/jbc.M607160200. [DOI] [PubMed] [Google Scholar]
- 63.Foster BM, Zaidi D, Young TR, Mobley ME, Kerr BA. CD117/c-kit in Cancer Stem Cell-Mediated Progression and Therapeutic Resistance. Biomedicines 2018;6(1) doi 10.3390/biomedicines6010031. [DOI] [PMC free article] [PubMed] [Google Scholar]
- 64.Tomizawa F, Jang MK, Mashima T, Seimiya H. c-KIT regulates stability of cancer stemness in CD44-positive colorectal cancer cells. Biochem Biophys Res Commun 2020;527(4):1014–20 doi 10.1016/j.bbrc.2020.05.024. [DOI] [PubMed] [Google Scholar]
- 65.Bai C, Liu X, Xu J, Qiu C, Wang R, Zheng J. Expression profiles of stemness genes in gastrointestinal stromal tumor. Hum Pathol 2018;76:76–84 doi 10.1016/j.humpath.2018.02.015. [DOI] [PubMed] [Google Scholar]
- 66.Yang XH, Wu QL, Yu XB, Xu CX, Ma BF, Zhang XM, et al. Nestin expression in different tumours and its relevance to malignant grade. J Clin Pathol 2008;61(4):467–73 doi jcp.2007.047605 [pii] 10.1136/jcp.2007.047605. [DOI] [PubMed] [Google Scholar]
- 67.Corbin AS, Agarwal A, Loriaux M, Cortes J, Deininger MW, Druker BJ. Human chronic myeloid leukemia stem cells are insensitive to imatinib despite inhibition of BCR-ABL activity. J Clin Invest 2011;121(1):396–409 doi 10.1172/JCI35721. [DOI] [PMC free article] [PubMed] [Google Scholar]
- 68.Medeiros F, Corless CL, Duensing A, Hornick JL, Oliveira AM, Heinrich MC, et al. KIT-negative gastrointestinal stromal tumors: proof of concept and therapeutic implications. Am J Surg Pathol 2004;28(7):889–94 doi 00000478-200407000-00007 [pii]. [DOI] [PubMed] [Google Scholar]
- 69.Tu Y, Zuo R, Ni N, Eilers G, Wu D, Pei Y, et al. Activated tyrosine kinases in gastrointestinal stromal tumor with loss of KIT oncoprotein expression. Cell cycle (Georgetown, Tex) 2018;17(23):2577–92 doi 10.1080/15384101.2018.1553335. [DOI] [PMC free article] [PubMed] [Google Scholar]
- 70.Mahadevan D, Cooke L, Riley C, Swart R, Simons B, Della Croce K, et al. A novel tyrosine kinase switch is a mechanism of imatinib resistance in gastrointestinal stromal tumors. Oncogene 2007;26(27):3909–19 doi 1210173 [pii] 10.1038/sj.onc.1210173. [DOI] [PubMed] [Google Scholar]
- 71.Mahadevan D, Theiss N, Morales C, Stejskal AE, Cooke LS, Zhu M, et al. Novel receptor tyrosine kinase targeted combination therapies for imatinib-resistant gastrointestinal stromal tumors (GIST). Oncotarget 2015;6(4):1954–66 doi 10.18632/oncotarget.3021. [DOI] [PMC free article] [PubMed] [Google Scholar]
- 72.Asiedu MK, Beauchamp-Perez FD, Ingle JN, Behrens MD, Radisky DC, Knutson KL. AXL induces epithelial-to-mesenchymal transition and regulates the function of breast cancer stem cells. Oncogene 2014;33(10):1316–24 doi 10.1038/onc.2013.57. [DOI] [PMC free article] [PubMed] [Google Scholar]
- 73.Zhang Z, Lee JC, Lin L, Olivas V, Au V, LaFramboise T, et al. Activation of the AXL kinase causes resistance to EGFR-targeted therapy in lung cancer. Nat Genet 2012;44(8):852–60 doi 10.1038/ng.2330. [DOI] [PMC free article] [PubMed] [Google Scholar]
- 74.Kirane A, Ludwig KF, Sorrelle N, Haaland G, Sandal T, Ranaweera R, et al. Warfarin Blocks Gas6-Mediated Axl Activation Required for Pancreatic Cancer Epithelial Plasticity and Metastasis. Cancer Res 2015;75(18):3699–705 doi 10.1158/0008-5472.CAN-14-2887-T. [DOI] [PMC free article] [PubMed] [Google Scholar]
- 75.Wood KC, Konieczkowski DJ, Johannessen CM, Boehm JS, Tamayo P, Botvinnik OB, et al. MicroSCALE screening reveals genetic modifiers of therapeutic response in melanoma. Sci Signal 2012;5(224):rs4 doi 10.1126/scisignal.2002612. [DOI] [PMC free article] [PubMed] [Google Scholar]
- 76.Hsueh YS, Chang HH, Shan YS, Sun HS, Fletcher JA, Li CF, et al. Nuclear KIT induces a NFKBIB-RELA-KIT autoregulatory loop in imatinib-resistant gastrointestinal stromal tumors. Oncogene 2019;38(38):6550–65 doi 10.1038/s41388-019-0900-9. [DOI] [PMC free article] [PubMed] [Google Scholar]
- 77.Mu J, Sun P, Ma Z, Sun P. BRD4 promotes tumor progression and NF-kappaB/CCL2-dependent tumor-associated macrophage recruitment in GIST. Cell Death Dis 2019;10(12):935 doi 10.1038/s41419-019-2170-4. [DOI] [PMC free article] [PubMed] [Google Scholar] [Retracted]
- 78.Eisenberg BL, Harris J, Blanke CD, Demetri GD, Heinrich MC, Watson JC, et al. Phase II trial of neoadjuvant/adjuvant imatinib mesylate (IM) for advanced primary and metastatic/recurrent operable gastrointestinal stromal tumor (GIST): early results of RTOG 0132/ACRIN 6665. J Surg Oncol 2009;99(1):42–7 doi 10.1002/jso.21160. [DOI] [PMC free article] [PubMed] [Google Scholar]
Associated Data
This section collects any data citations, data availability statements, or supplementary materials included in this article.