

Abstract
Backgrounds
Branched-chain amino acids (BCAAs; isoleucine, leucine and valine) correlate with insulin resistance and poor glucose control, which may in part explain associations between type 2 diabetes (T2D) and cardiovascular disease (CVD). However, the relationships of BCAAs with other cardiometabolic pathways, including inflammation and dyslipidemia, are unclear. We hypothesized that plasma BCAAs would correlate with multiple pathways of cardiometabolic dysfunction.
Methods
We conducted a cross-sectional analysis among 19,472 participants (mean age=54.9 years, SD=7.2 years) in the Women’s Health Study without a history of T2D, CVD, or cancer. We quantified the concentrations of individual biomarkers of inflammation and lipids, across quartiles of BCAAs, adjusting for age, smoking, BMI, physical activity, and other established CVD risk factors at blood draw.
Results
Women in the highest vs. lowest quartiles of plasma BCAAs had higher inflammatory markers including high-sensitivity C-reactive protein (multivariable-adjusted means: 1.96 vs. 1.43 mg/L), fibrinogen (367 vs. 362 mg/dL), soluble intercellular cell adhesion molecule-1 (361 vs. 353 ng/mL), and glycoprotein acetylation (407 vs. 371 µmol/L) (p-trend=0.0002 for fibrinogen; p<0.0001 for others). Similarly for lipids, women with higher BCAAs had lower HDL-c (49.0 vs. 55.0 mg/dL), and higher triglycerides (143 vs. 114 mg/dL), LDL-c (133 vs. 124 mg/dL), and lipoprotein insulin resistance score (52.6 vs. 37.3) (all: p<0.0001). Similar associations with these biomarkers were observed in isoleucine, leucine and valine, respectively.
Conclusions
Higher circulating BCAA concentrations are associated with adverse profiles of biomarkers of inflammation and dyslipidemia independent of established CVD risk factors, and thus may reflect poorer cardiometabolic health through multiple pathways.
Clinical Trial Registration
www.clinicaltrials.gov; Unique Identifier: NCT00000479
Keywords: branched chain amino acids, type 2 diabetes, inflammation, lipid metabolism, cardiovascular disease
Introduction
Type 2 diabetes (T2D) is one of the most prevalent chronic diseases, which is strongly linked to the development of cardiovascular disease (CVD). However, mechanisms underlying these interrelated diseases are poorly understood. Characterizing the metabolite traits shared by T2D and CVD years prior to their diagnosis may allow the identification of high-risk individuals, increase opportunities for early intervention and prevention, and uncover shared pathways for potential novel therapeutic targets.
Branched-chain amino acids (BCAAs; isoleucine, leucine, and valine) are essential amino acids that are preserved in muscle and utilized to synthesize proteins and perform various metabolic/physiological functions 1. The degradation of BCAAs occurs mainly in mitochondria, eventually producing acetyl-CoA or succinyl-CoA, which enters Krebs cycle. This process occurs outside of liver, which lacks the expression of mitochondrial branched-chain aminotransferase. Dysfunction at each step in this process can lead to an accumulation of plasma BCAAs, such as in maple syrup urine disease, a deficiency of branched-chain α-ketoacid dehydrogenase complex. Recent evidence shows lowered branched-chain keto acid dehydrogenase activity 2, muscle breakdown 3, as well as excess adiposity 4, 5, contribute to higher circulating BCAAs. Circulating BCAAs are highly predictive of incident T2D 6, 7, and we have previously demonstrated the positive association between BCAAs with incident CVD risk 8. Mendelian randomization studies suggest a causal role of impaired BCAA metabolism in the disease process of T2D 9, 10 although evidence is inconclusive. However, the relationships of BCAAs with other cardiometabolic traits predictive of CVD incidence have not been explored, which may contribute to our understanding of the T2D/CVD relationship.
Evidence supports T2D as an inflammatory disease in terms of hypoxia, cell death, or various inflammatory cytokines/chemokines, which may partly explain the consequent development of CVD 11. A variety of molecules are involved in systemic inflammation, some represented as biomarkers including C-reactive protein (CRP), fibrinogen, soluble intercellular adhesion molecule-1 (sICAM-1), or glycoprotein acetylation (GlycA), which may be related to impaired glucose metabolism and incident T2D 12–15. Dyslipidemia may also contribute to the relationship between T2D and CVD risk. Various lipid and lipoprotein abnormalities are associated with impaired glucose metabolism, including higher triglycerides and lower HDL cholesterol, primarily triggered by the overproduction of triglyceride-rich VLDL particle (VLDL-p) mediated by insulin 16, 17. A recently derived lipoprotein insulin resistance score (LPIR) is a composite biomarker based on six lipid metabolite features 18 reflecting risk for T2D 18–20. However, the relationships between circulating BCAA levels with each of these cardiometabolic pathways represented by these individual biomarkers are largely unknown.
We therefore aimed to evaluate the interrelationship of BCAAs with established cardiometabolic traits to further characterize BCAAs as metabolites of T2D and CVD risks. We conducted cross-sectional analyses for the associations of plasma BCAAs with inflammatory and lipid biomarkers in the Women’s Health Study (WHS), which recruited a large cohort of US women. We hypothesized that higher plasma total or individual BCAAs would be correlated with cardiometabolic biomarkers representing lipid or inflammatory profiles, possibly independent of concurrent traits of glycemic control as measured by hemoglobin A1C (HbA1c). We also examined effect modification by BMI, a consistent predictor of higher total plasma BCAAs 21–23.
Methods
Data described in the manuscript, code book, and analytic code will be made available upon request pending application and approval. Written informed consent was obtained from all participants and the study protocol was approved by the Institutional Review Board of the Brigham and Women’s Hospital (Boston, Massachusetts). The full methods are now available as supplemental data.
Results
Baseline characteristics
In 19,472 women in the WHS included in this analysis, the mean (SD) age was 54.9 (7.2) years with median [IQR] BMI of 24.8 [22.4, 28.3] kg/m2. Median [IQR] concentration of summed BCAAs was 396 [349, 450] μmol/L (the distribution is shown in Supplemental Figure 1). The baseline characteristics of the participants according to the quartiles of plasma BCAA levels are summarized in Table 1. Higher BCAA was associated with older age, higher BMI, lower physical activity level, lower diet quality represented by AHEI-2010, lower alcohol intake, lower prevalence of smoking, use of cholesterol-lowering drugs, and post-menopausal status.
Table 1.
Characteristics of 19,472 Women’s Health Study participants at baseline blood draw according to quartiles of plasma BCAA level
| BCAA quartile | |||||
|---|---|---|---|---|---|
| Quartile 1 | Quartile 2 | Quartile 3 | Quartile 4 | ||
| n=4868 | n=4868 | n=4868 | n=4868 | p | |
| Demographics | |||||
| Age, years | 54.7 (7.3) | 55.0 (7.4) | 55.2 (7.1) | 54.9 (7.0) | 0.016 |
| Race, % | 0.081 | ||||
| White, Non-Hispanic | 4640 (96.0) | 4643 (96.1) | 4622 (95.9) | 4569 (94.7) | |
| Hispanic | 41 (0.8) | 43 (0.9) | 48 (1.0) | 58 (1.2) | |
| African American | 81 (1.7) | 67 (1.4) | 86 (1.8) | 89 (1.8) | |
| Asian/Pacific Islander | 51 (1.1) | 61 (1.3) | 52 (1.1) | 83 (1.7) | |
| American Indian/Alaskan Native | 11 (0.2) | 9 (0.2) | 6 (0.1) | 14 (0.3) | |
| Other/unknown | 8 (0.2) | 10 (0.2) | 7 (0.1) | 11 (0.2) | |
| Smoking, % | <0.001 | ||||
| Never | 2380 (48.9) | 2521 (51.8) | 2612 (53.7) | 2613 (53.7) | |
| Past use | 1844 (37.9) | 1800 (37.0) | 1729 (35.5) | 1698 (34.9) | |
| Current use | 644 (13.2) | 547 (11.2) | 527 (10.8) | 557 (11.4) | |
| Family history of T2D, % | 1065 (21.9) | 1148 (23.6) | 1223 (25.1) | 1462 (30.0) | <0.001 |
| BMI, kg/m2 | 23.3 [21.4, 25.8] | 24.1 [22.1, 26.6] | 25.1 [22.8, 28.4] | 27.4 [24.1, 31.0] | <0.001 |
| BMI, % | <0.001 | ||||
| <25 | 3418 (70.2) | 2921 (60.0) | 2356 (48.4) | 1535 (31.5) | |
| ≥25, <30 | 1100 (22.6) | 1422 (29.2) | 1621 (33.3) | 1845 (37.9) | |
| ≥30 | 350 (7.2) | 525 (10.8) | 891 (18.3) | 1488 (30.6) | |
| Menopausal status, % | <0.001 | ||||
| Premenopausal | 1469 (30.2) | 1306 (26.8) | 1230 (25.3) | 1208 (24.8) | |
| Postmenopausal, natural | 1898 (39.0) | 1929 (39.6) | 1926 (39.6) | 1812 (37.2) | |
| Postmenopausal, non-natural | 679 (13.9) | 778 (16.0) | 845 (17.4) | 876 (18.0) | |
| Uncertain | 822 (16.9) | 855 (17.6) | 867 (17.8) | 972 (20.0) | |
| Use of menopausal hormone therapy, % | <0.001 | ||||
| Never | 2380 (48.9) | 2288 (47.0) | 2343 (48.1) | 2406 (49.4) | |
| Past use | 393 (8.1) | 414 (8.5) | 417 (8.6) | 492 (10.1) | |
| Current use | 2095 (43.0) | 2166 (44.5) | 2108 (43.3) | 1970 (40.5) | |
| Pregnancies lasting ≥6 months, % | 0.052 | ||||
| None | 666 (13.7) | 629 (12.9) | 645 (13.2) | 627 (12.9) | |
| 1 time | 459 (9.4) | 404 (8.3) | 392 (8.1) | 412 (8.5) | |
| 2 times | 1462 (30.0) | 1480 (30.4) | 1434 (29.5) | 1389 (28.5) | |
| ≥3 times | 2281 (46.9) | 2355 (48.4) | 2397 (49.2) | 2440 (50.1) | |
| Total leisure-time physical activity, MET-hours/week | 10.5 [3.4, 23.0] | 10.0 [3.4, 21.2] | 9.1 [2.9, 20.5] | 6.9 [2.2, 17.5] | <0.001 |
| aHEI-2010 | 48.7 [42.4, 55.6] | 48.3 [42.3, 54.9] | 48.2 [42.1, 54.7] | 47.6 [41.4, 53.6] | <0.001 |
| Alcohol intake, g/day | 1.2 [0.0, 6.5] | 1.1 [0.0, 5.7] | 0.86 [0.0, 4.6] | 0.86 [0.0, 2.9] | <0.001 |
| Alcohol intake, % | <0.001 | ||||
| None | 1904 (39.1) | 1996 (41.0) | 2164 (44.5) | 2409 (49.5) | |
| <10 g/day | 2106 (43.3) | 2162 (44.4) | 2072 (42.6) | 1949 (40.0) | |
| <20 g/day | 566 (11.6) | 466 (9.6) | 420 (8.6) | 334 (6.9) | |
| ≥20 g/day | 292 (6.0) | 244 (5.0) | 212 (4.4) | 176 (3.6) | |
| Assignment to aspirin | 2399 (49.3) | 2444 (50.2) | 2434 (50.0) | 2465 (50.6) | 0.60 |
| Assignment to vitamin E | 2444 (50.2) | 2382 (48.9) | 2392 (49.1) | 2462 (50.6) | 0.29 |
| Use of cholesterol-lowering drugs | 120 (2.5) | 146 (3.0) | 171 (3.5) | 201 (4.1) | <0.001 |
| Laboratory marker | |||||
| Total BCAAs | 317 [292, 334] | 373 [361, 385] | 421 [408, 434] | 493 [468, 533] | <0.001 |
| hsCRP, mg/L | 1.27 [0.54, 2.84] | 1.65 [0.69, 3.57] | 2.11 [0.93, 4.25] | 2.84 [1.36, 5.24] | <0.001 |
| Fibrinogen, mg/dL | 337 [298, 387] | 345 [306, 394] | 356 [313, 407] | 365 [319, 418] | <0.001 |
| GlycA,µmol/L | 353 [316, 395] | 373 [332, 416] | 389 [349, 434] | 410 [366, 455] | <0.001 |
| sICAM-1, ng/mL | 333 [294, 381] | 337 [297, 386] | 344 [303, 394] | 356 [311, 408] | <0.001 |
| Triglyceride,mg/dL | 94 [69, 134] | 106 [76, 151] | 118 [83, 168] | 140 [99, 193] | <0.001 |
| LDL cholesterol, mg/dL | 116 [97, 138] | 122 [102, 144] | 125 [104, 148] | 128 [108, 152] | <0.001 |
| HDL cholesterol, mg/dL | 57 [48, 68] | 55 [46, 65] | 52 [43, 61] | 47 [40, 56] | <0.001 |
| LPIR score | 25 [15, 44] | 33 [18, 52] | 41 [22, 61] | 56 [35, 71] | <0.001 |
| HbA1c, % | 5.0 [4.8, 5.1] | 5.0 [4.8, 5.1] | 5.0 [4.9, 5.2] | 5.1 [4.9, 5.3] | <0.001 |
Values are mean (SD), median [IQR], or number (%).
Abbreviations: BCAA, branched chain amino acid; MET-hours, metabolic equivalent task hours; hsCRP, high-sensitivity C-reactive protein; sICAM-1, soluble intercellular cell adhesion molecule-1; LPIR, lipoprotein insulin resistance score.
Correlation between BCAA and inflammation, lipid, and HbA1c
Figure 1 illustrates the spearman correlation network between total BCAAs, inflammatory biomarkers, and lipid biomarkers. Total plasma BCAAs were significantly correlated with all biomarkers (p<0.0001), with highest correlations observed with LPIR (ρ=0.35) and GlycA (ρ=0.30) (hsCRP: ρ=0.24, fibrinogen: ρ=0.13, sICAM-1: ρ=0.11, triglyceride: ρ=0.26, HDL: ρ=–0.27, LDL: ρ=0.14, HbA1c: ρ=0.17). hsCRP with GlycA had the highest correlations between inflammatory biomarkers (ρ=0.58, p<0.0001). The correlation matrix is shown in Supplemental Table 1.
Figure 1:
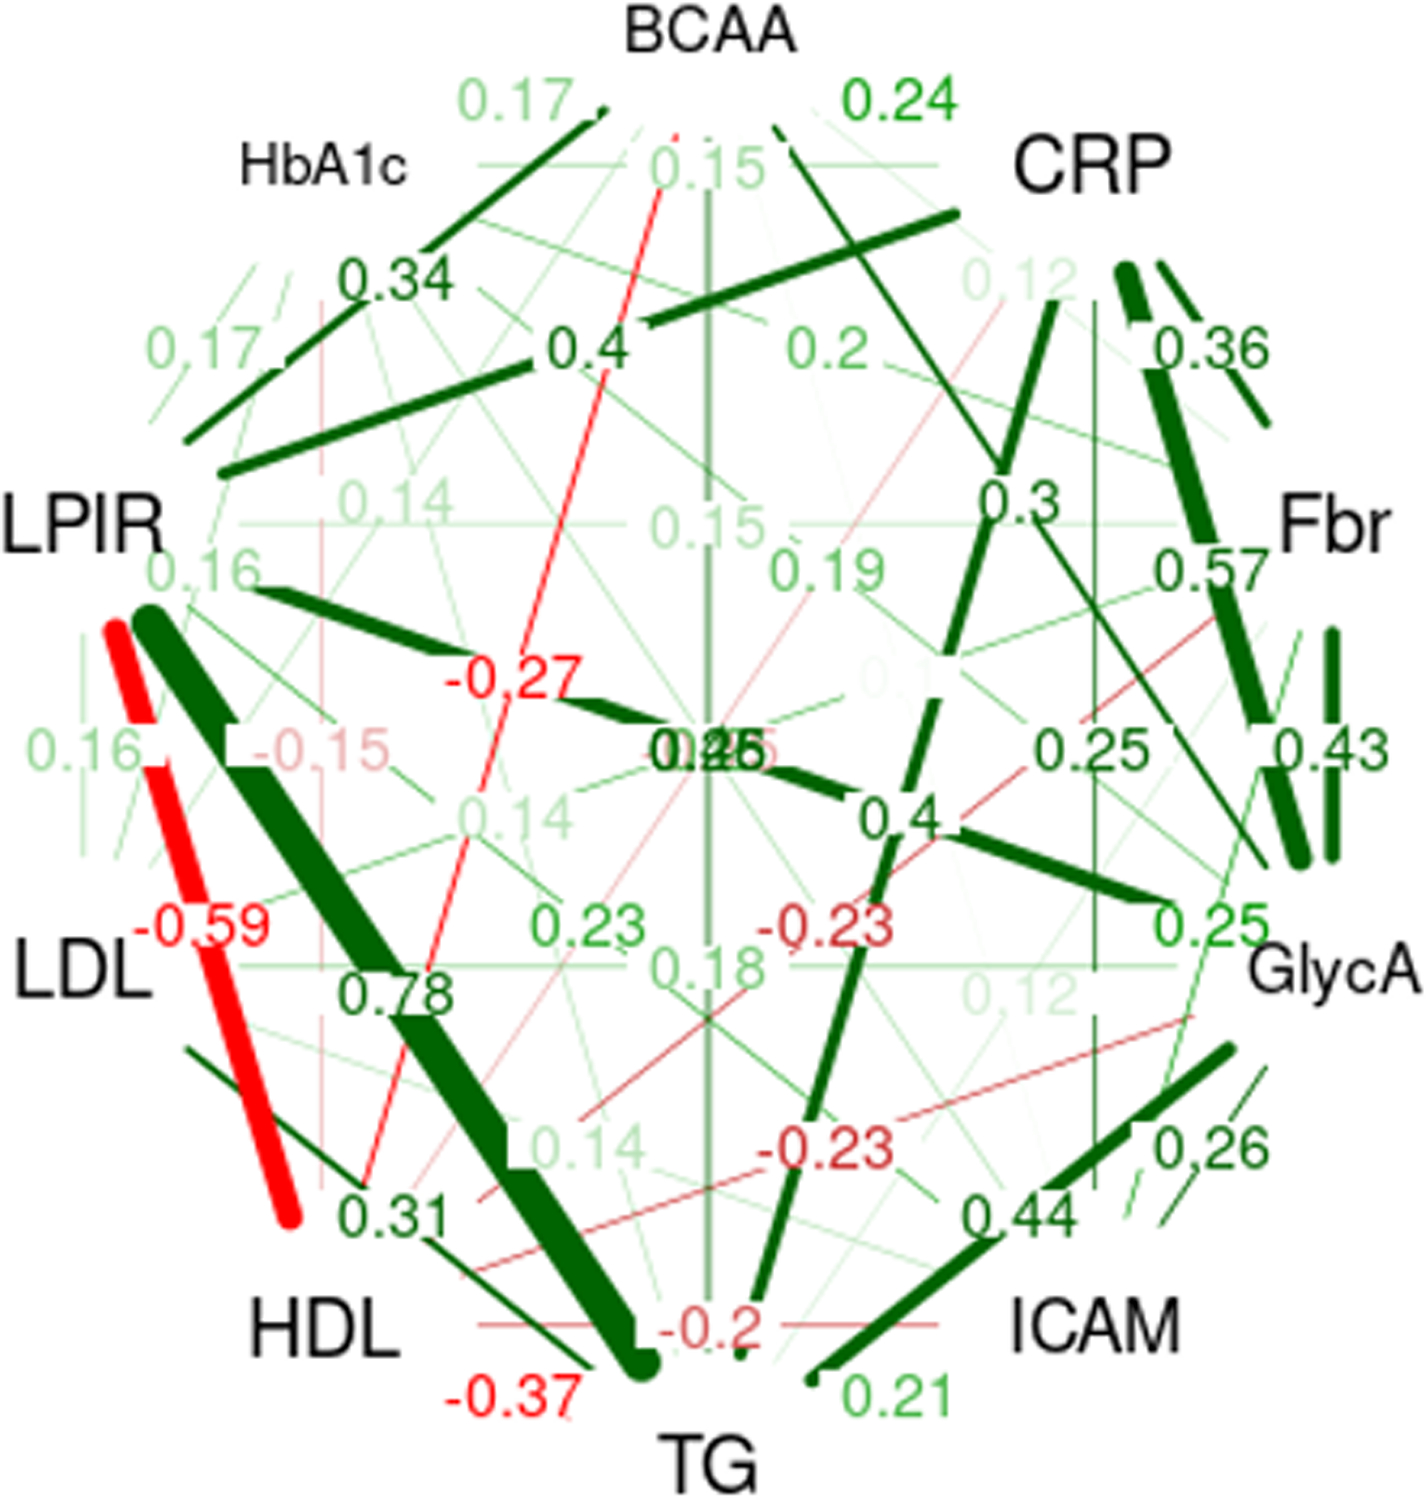
Correlation network between BCAA, inflammatory biomarkers, lipid biomarkers, and HbA1c. Correlation network between BCAA, hsCRP, fibrinogen, GlycA, sICAM-1, triglyceride, HDL-c, LDL-c, LPIR, and HbA1c is shown. Spearman correlation coefficients (ρ) were calculated in each pair of biomarkers and only associations with ρ>0.10 are visualized as lines. Thicker lines indicate stronger correlations and green and red lines represent positive and negative correlations, respectively.
Abbreviations: BCAA, branched chain amino acid; hsCRP, high-sensitivity C-reactive protein; sICAM-1, soluble intercellular cell adhesion molecule-1; HDL-c, HDL cholesterol; LDL-c, LDL cholesterol; LPIR, lipoprotein insulin resistance score; HbA1c, hemoglobin A1C.
Associations of BCAA and inflammation/lipid
Table 2 summarizes the associations between BCAA and cardiometabolic biomarkers. Women in the highest vs. lowest quartiles of plasma BCAAs had higher hsCRP (adjusted mean [95% CI]: 1.96 [1.85, 2.07] vs. 1.43 [1.35, 1.51] mg/L), fibrinogen (367 [363, 371] vs. 362 [358, 366] mg/dL), sICAM-1 (361 [357, 365] vs. 353 [349, 357] ng/mL), and GlycA (407 [403, 410] vs. 371 [368, 375] µmol/L) (p-trend=0.0002 for fibrinogen; p<0.0001 for others). Further adjustment for HbA1c attenuated these associations, and the association with fibrinogen became not statistically significant after consideration of multiple comparisons (Table 3).
Table 2.
Adjusted means of inflammatory and lipid biomarkers by the quartiles of BCAA level
| BCAA quartile | |||||
|---|---|---|---|---|---|
| Quartile 1 | Quartile 2 | Quartile 3 | Quartile 4 | †p for linear trend | |
| Inflammation | Geometric mean [95% confidence interval] | ||||
| hsCRP, mg/L (N=18880) | |||||
| Age-adjusted | 1.22 [1.19, 1.26] | 1.54 [1.49, 1.58] | 1.92 [1.86, 1.98] | 2.51 [2.44, 2.59] | <0.0001 |
| *Multivariable-adjusted | 1.43 [1.35, 1.51] | 1.62 [1.53, 1.71] | 1.8 [1.7, 1.91] | 1.96 [1.85, 2.07] | <0.0001 |
| Fibrinogen, mg/dL (N=19148) | |||||
| Age-adjusted | 340 [338, 341] | 347 [345, 349] | 356 [354, 358] | 365 [363, 367] | <0.0001 |
| *Multivariable-adjusted | 362 [358, 366] | 365 [361, 369] | 368 [364, 372] | 367 [363, 371] | 0.0002 |
| sICAM-1, ng/mL (N=19146) | |||||
| Age-adjusted | 338 [336, 340] | 340 [338, 342] | 346 [344, 348] | 358 [356, 360] | <0.0001 |
| *Multivariable-adjusted | 353 [349, 357] | 353 [349, 358] | 356 [352, 360] | 361 [357, 365] | <0.0001 |
| GlycA, µmol/L (N=19283) | |||||
| Age-adjusted | 354 [352, 355] | 371 [369, 373] | 387 [386, 389] | 406 [404, 408] | <0.0001 |
| *Multivariable-adjusted | 371 [368, 375] | 385 [382, 389] | 397 [393, 400] | 407 [403, 410] | <0.0001 |
| Lipid | |||||
| Triglyceride, mg/dL (N=19265) | |||||
| Age-adjusted | 99 [98, 100] | 108 [107, 110] | 119 [117, 120] | 139 [137, 141] | <0.0001 |
| *Multivariable-adjusted | 114 [111, 117] | 121 [118, 124] | 128 [125, 132] | 143 [140, 147] | <0.0001 |
| HDL-c, mg/dL (N=19250) | |||||
| Age-adjusted | 56.9 [56.5, 57.3] | 54.3 [53.9, 54.7] | 51.6 [51.2, 51.9] | 47.3 [47.0, 47.6] | <0.0001 |
| *Multivariable-adjusted | 55.0 [54.2, 55.7] | 53.1 [52.4, 53.9] | 51.5 [50.8, 52.3] | 49.0 [48.3, 49.6] | <0.0001 |
| LDL-c, mg/dL (N=19251) | |||||
| Age-adjusted | 119 [118, 120] | 124 [124, 125] | 127 [126, 128] | 131 [130, 132] | <0.0001 |
| *Multivariable-adjusted | 124 [122, 126] | 129 [127, 131] | 131 [129, 133] | 133 [131, 135] | <0.0001 |
| LPIR score (N=19407) | |||||
| Age-adjusted | 30.5 [29.9, 31.2] | 35.9 [35.3, 36.5] | 42 [41.4, 42.6] | 52.7 [52.1, 53.4] | <0.0001 |
| *Multivariable-adjusted | 37.3 [36.1, 38.6] | 41 [39.8, 42.3] | 45.1 [43.9, 46.3] | 52.6 [51.4, 53.9] | <0.0001 |
Numbers are adjusted geometric means [95% confidence intervals] calculated based on multivariable linear regression.
Models were adjusted for age at the randomization (continuous), assignment to ASA group, assignment to vitamin E group, race (white or not), family history of diabetes, smoking (none, ever, current), menopausal status (premenopausal, postmenopausal [natural], postmenopausal [non-natural], unsure), use of menopausal hormone therapy (never, past, current), parity as number of pregnancies lasting ≥6 months (nulliparous, 0, 1, 2, ≥3), exercise as total MET-hour/week (quintiles), aHEI-2010 (quintiles), alcohol consumption (none, <10g/day, <20g/day, ≥20g/day), the use of cholesterol lowering drugs, and BMI (continuous).
Test for trend was based on a variable containing the median value for each quartile.
P-trend threshold was 0.006 after Bonferroni correction.
Abbreviations: BCAA, branched chain amino acid; hsCRP, high-sensitivity C-reactive protein; sICAM-1, soluble intercellular cell adhesion molecule-1; HDL-c, HDL cholesterol; LDL-c, LDL cholesterol; LPIR, lipoprotein insulin resistance score.
Table 3.
Adjusted means of inflammation/lipid biomarkers by the quartiles of BCAA level after adjustment for HbA1c
| BCAA quartile | |||||
|---|---|---|---|---|---|
| Quartile 1 | Quartile 2 | Quartile 3 | Quartile 4 | *p-trend | |
| Geometric mean [95% confidence interval] | |||||
| Inflammation | |||||
| hsCRP, mg/dL | 1.41 [1.33, 1.5] | 1.6 [1.51, 1.7] | 1.78 [1.68, 1.89] | 1.9 [1.8, 2.02] | <0.0001 |
| Fibrinogen, mg/dL | 361 [357, 365] | 364 [360, 368] | 367 [363, 371] | 364 [360, 368] | 0.0090 |
| sICAM-1, ng/mL | 352 [348, 356] | 352 [348, 357] | 355 [351, 359] | 358 [354, 362] | <0.0001 |
| GlycA, µmol/L | 371 [367, 374] | 384 [381, 388] | 395 [392, 399] | 404 [400, 408] | <0.0001 |
| Lipid | |||||
| Triglyceride, mg/dL | 113 [110, 116] | 121 [117, 124] | 128 [124, 131] | 142 [138, 146] | <0.0001 |
| HDL-c, mg/dL | 55.1 [54.3, 55.9] | 53.3 [52.6, 54.0] | 51.7 [51.0, 52.4] | 49.3 [48.6, 50.0] | <0.0001 |
| LDL-c, mg/dL | 124 [122, 126] | 129 [127, 131] | 131 [129, 133] | 132 [130, 134] | <0.0001 |
| LPIR score | 37.2 [35.9, 38.4] | 40.8 [39.6, 42] | 44.9 [43.6, 46.1] | 52 [50.8, 53.3] | <0.0001 |
Numbers are adjusted geometric means [95% confidence intervals] calculated based on multivariable linear regression.
Models were adjusted for age at the randomization (continuous), assignment to ASA group, assignment to vitamin E group, race (white or not), family history of diabetes, smoking (none, ever, current), menopausal status (premenopausal, postmenopausal [natural], postmenopausal [non-natural], unsure), use of menopausal hormone therapy (never, past, current), parity as number of pregnancies lasting ≥6 months (nulliparous, 0, 1, 2, ≥3), exercise as total MET-hour/week (quintiles), aHEI-2010 (quintiles), alcohol consumption (none, <10g/day, <20g/day, ≥20g/day), the use of cholesterol lowering drugs, BMI (continuous), and HbA1c (continuous).
Test for trend was based on a variable containing the median value for each quartile. P-trend threshold was 0.006 after Bonferroni correction.
Abbreviations: BCAA, branched chain amino acid; hsCRP, high-sensitivity C-reactive protein; sICAM-1, soluble intercellular cell adhesion molecule-1; HDL-c, HDL cholesterol; LDL-c, LDL cholesterol; LPIR, lipoprotein insulin resistance score.
Higher BCAA was associated with elevated triglycerides (143 [140, 147] vs. 114 [111, 117] mg/dL), LDL-c (133 [131, 135] vs. 124 [122, 126] mg/dL) and LPIR (52.6 [51.4, 53.9] vs. 37.3 [36.1, 38.6] unit), and lower HDL cholesterol (HDL-c) (49.0 [48.3, 49.6] vs. 55.0 [54.2, 55.7] mg/dL) in the multivariable-adjusted models (all: p-trend<0.0001) (Table 2). Further adjustment for HbA1c did not substantially attenuate these associations (Table 3).
Standardized differences of each cardiometabolic biomarker per SD difference of BCAA levels after adjustment of confounders were illustrated in Figure 2. In inflammatory biomarkers, the strongest association with BCAA was seen for GlycA (0.203 [95%CI: 0.19. 0.217] per SD difference of BCAA). Among lipid biomarkers, the association with BCAA was strongest in LPIR (0.254 [95%CI: 0.241. 0.267] per SD difference of BCAA).
Figure 2:
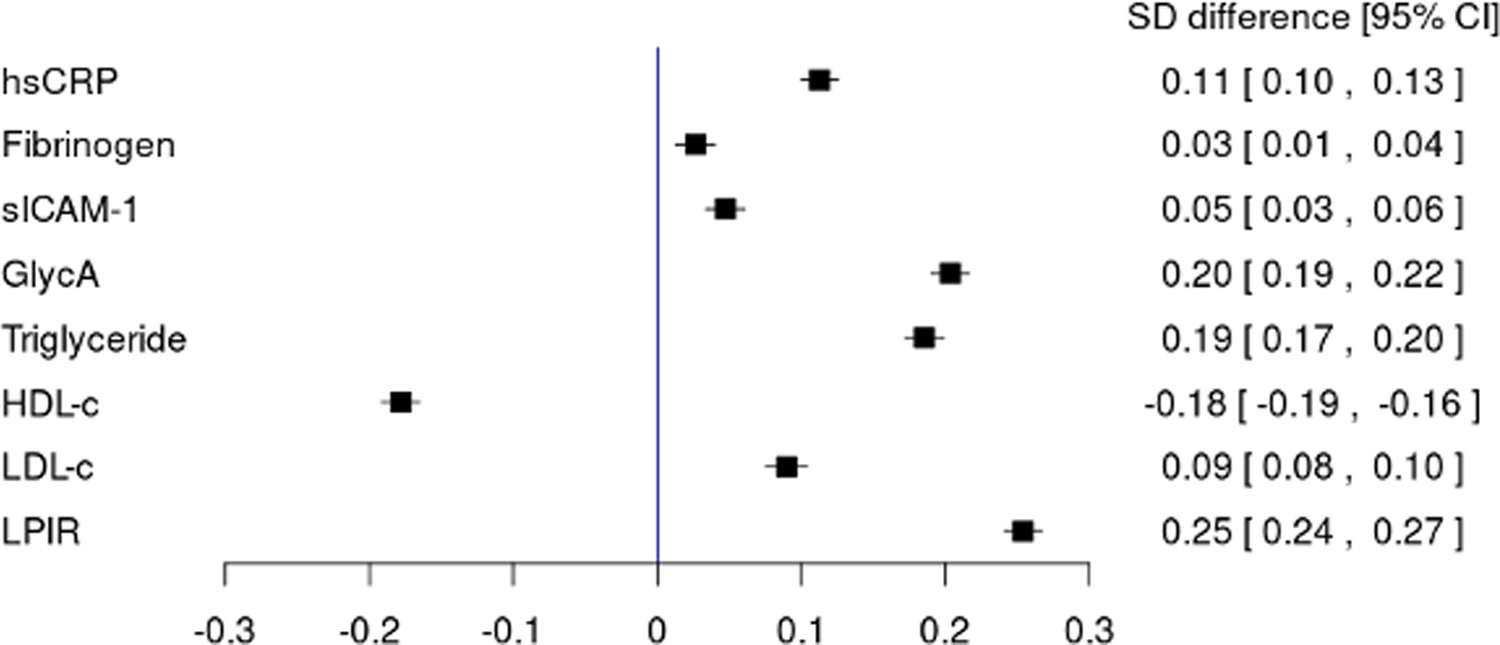
Standardized differences of cardiometabolic biomarkers per SD changes of BCAA levels. Linear regressions of standardized biomarkers constructed by standardized continuous total BCAA levels and covariates [age at randomization (continuous), assignment to ASA group, assignment to vitamin E group, race (white or non-white), family history of diabetes, smoking history (none, ever, current), menopausal status (premenopausal, postmenopausal [natural], postmenopausal [non-natural], unsure), use of menopausal hormone therapy (never, past, current), parity as number of pregnancies lasting ≥6 months (nulliparous, 0, 1, 2, ≥3), exercise as total MET-hour/week (quintiles), aHEI-2010 (quintiles), alcohol consumption (none, <10g/day, <20g/day, ≥20g/day), the use of cholesterol lowering drugs, and BMI (continuous)]. Standardized differences [95% confidence interval] per SD of BCAAs are shown.
Abbreviations: BCAA, branched chain amino acid; hsCRP, high-sensitivity C-reactive protein; sICAM-1, soluble intercellular cell adhesion molecule-1; HDL-c, HDL cholesterol; LDL-c, LDL cholesterol; LPIR, lipoprotein insulin resistance score.
Stratified analysis by BMI
Supplemental Table 2 (least square means) and Supplemental Figure 2 (standardized differences) illustrates the associations between BCAA concentrations and inflammation/lipid biomarkers stratified by BMI. Overall, these associations differed across BMI categories, but the patterns were not consistent. In inflammatory biomarkers, after consideration of multiple comparisons, the associations of BCAAs and sICAM-1 were significantly different according to BMI (p-interaction<0.0001). In particular, sICAM-1 was robustly associated with BCAA concentration in women with BMI≥25 kg/m2 (p-trend<0.0001) but not in those with BMI<25 kg/m2 (p-trend=0.19). Among lipid biomarkers, LDL-c and LPIR score were differentially related to BCAA levels according to BMI categories (p-interaction=0.0004 and 0.0002, respectively). There were no significant interactions between BMI and hsCRP or HDL-c with BCAAs.
Associations between individual BCAAs and biomarkers
We also assessed the relationships between inflammatory/lipid biomarkers and the individual BCAAs, isoleucine (Supplemental Table 3 and Supplemental Figure 3), leucine (Supplemental Table 4 and Supplemental Figure 4), and valine (Supplemental Table 5 and Supplemental Figure 5). The associations between fibrinogen and isoleucine and valine were not significant in the multivariable-adjusted models. The other associations were significant, and the directions were the same as the relationships with summed BCAA levels.
Sensitivity analysis
The results were similar when we stratified by age <60 or ≥60 years (Supplemental Tables 6 and Supplemental Figure 6), with all p-values for interaction non-significant. In the adjusted models, circulating BCAA concentration was significantly associated with all of the inflammatory and lipid biomarkers except for fibrinogen. Additional sensitivity analyses by fasting status showed similar results for nonfasting BCAA measurements (not shown).
Discussion
In this large cross-sectional study of US women, plasma BCAA concentrations were associated with biomarkers of inflammation and dyslipidemia, indicative of their correlation with an overall poorer cardiometabolic health profile. Among inflammatory biomarkers, plasma BCAAs were moderately associated with hsCRP and GlycA. Higher BCAA levels were also moderately associated with the LPIR score. The interactions of BCAAs and BMI varied according to cardiometabolic biomarkers. The findings for the individual BCAAs, isoleucine, leucine and valine and inflammatory/lipid biomarkers were similar to total BCAAs.
Few studies have investigated the relationships between circulating BCAA metabolites and inflammation in humans. In a study of 286 Finnish twins, hsCRP levels were modestly correlated with isoleucine and leucine, but not with valine 24. Among 611 Chinese adults, hsCRP was not significantly associated with serum BCAAs after adjustment for age, sex, smoking and alcohol consumption (p=0.064) 25. However, this was a small and diverse population that included participants with ages ranging from 21 to 110 years, and without exclusion for prevalent T2D at blood draw, which may introduce variability. We investigated circulating BCAAs in relation to biomarkers representing various inflammatory pathways. Associations of BCAAs with hsCRP and GlycA persisted even after adjusting for HbA1c, a marker of glycemic control, suggesting BCAAs may be related to cardiometabolic risk independent of this T2D-related glycemic trait. GlycA is a nuclear magnetic resonance (NMR) signal basically reflecting the glycosylation and abundance of α1-acid glycoprotein, haptoglobin, α1-antitrypsin, α1-antichymotrypsin and transferrin 26. Evidence indicates that GlycA itself 13, as well as the major contributors including α1-acid glycoprotein 27, α1-antitrypsin28 and transferrin 29, are associated with incident T2D. The association of BCAAs with fibrinogen was attenuated after adjusting for HbA1c, suggesting that BCAAs are not likely to be independently related to this inflammatory marker.
Higher circulating BCAAs were associated with biomarkers of dyslipidemia. The relationship between BCAAs and the LPIR score persisted with adjustment for HbA1c and was similar across BMI strata. These findings are consistent with known relationships between BCAAs and insulin resistance, which correlates highly with LPIR 18,6, 20. Of note, dyslipidemia, as well as inflammation, may potentially precede the development of insulin resistance, as is supported by prior evidence that elevated LPIR 19 and hsCRP 13, 30 are involved upstream of T2D progression; in addition, both biomarkers were strongly associated with incident CHD 31, 32; therefore, impaired BCAA metabolism, capturing multiple aspects of inflammation and dyslipidemia, may represent a shared pathology predisposing to T2D and CVD. However, the temporal relationship of these correlations cannot be established given the cross-sectional nature of this analysis.
Strengths of this study include the large sample size, measured inflammatory/lipid biomarkers, and detailed demographic, lifestyle, and health information to carefully control for potential confounders. Our study has limitations, however, including the cross-sectional design, which precludes the ability to establish the temporality between biomarkers. The female participants were predominantly white with higher socioeconomic status 33, thus limiting generalizability of the study findings. Also, we cannot rule out residual confounding by unmeasured confounding by other determinants of BCAAs and cardiometabolic risk, including other biomarkers that were not included in our investigation.
Conclusion
In a large cohort of US women without T2D or CVD, plasma BCAAs were associated with biomarkers of inflammation (hsCRP, sICAM-1 and GlycA) and dyslipidemia (triglyceride, LDL-c, HDL-c and LPIR), indicative of an overall poorer cardiometabolic health profile. BCAAs remained positively associated with some of these pathways independent of impaired glucose metabolism, supporting elevated BCAAs may be an independent component of cardiometabolic risk.
Supplementary Material
Acknowledgments:
R.H., D.K.T., and J.E.M. designed the study and wrote the first version of the manuscript. R.H. analyzed the data. P.R.L., S.M., P.M.R., J.E.B., I.L., and J.E.M collected clinical and biospecimen data and provided critical feedback. N.R.C. consulted on the statistical analyses. All co-authors contributed to writing and approved the final version of the manuscript.
Sources of Funding: This research is supported by a Young Investigator in Medicine Hearst Award to D K Tobias from the Brigham and Women’s Hospital Department of Medicine. R Hamaya is supported by a fellowship from The Uehara Memorial Foundation. Women’s Health Study is supported by the NIH (CA-047988, HL-043851, HL-080467, HL-099355, and UM1 CA182913). S Mora is supported by the research grants from the National Heart, Lung, and Blood Institute (R01HL134811, R01117861, and K24 HL136852); National Institute of Diabetes and Digestive and Kidney Diseases (DK112940); American Heart Association (0670007N); and the Molino Family Trust. The BCAA NMR measurements in the Women’s Health Study were provided at no charge by LabCorp, Inc. P M Ridker received unrelated research grants from Kowa, Novartis, Amarin, and NHLBI during the period of this study and has served as a research consultant to Novartis, AstraZeneca, Jansen, Agepha, Inflazome, IQVIA, Uppton, Agepha, CiviBiopharm, Corvidia, and Flame for work unrelated to this manuscript. P R Lawler receives unrelated research funding from the Canadian Institutes for Health Research, the Peter Munk Cardiac Centre, the Ted Rogers Foundation for Heart Research, the Thistledown Foundation, the LifeArc Foundation, the Province of Ontario, and the Heart and Stroke/Richard Lewar Centre of Excellence in Cardiovascular Research at the University of Toronto; received unrelated consulting fees from Novartis, Corrona, and Brigham and Women’s Hospital; and received unrelated royalties from McGraw-Hill Publishing. The funding organizations played no role in the design of study, choice of enrolled patients, review and interpretation of data, and final approval of manuscript.
Nonstandard Abbreviations and Acronyms
- BCAA
branched-chain amino acid
- GlycA
glycoprotein acetylation
- hsCRP
high-sensitivity C-reactive protein
- LPIR
lipoprotein insulin resistance score
- sICAM-1
soluble intercellular adhesion molecule-1
- T2D
type 2 diabetes
- WHS
Women’s Health Study
Footnotes
Publisher's Disclaimer: This article is published in its accepted form; it has not been copyedited and has not appeared in an issue of the journal. Preparation for inclusion in an issue of Circulation: Genomic and Precision Medicine involves copyediting, typesetting, proofreading, and author review, which may lead to differences between this accepted version of the manuscript and the final published version.
Disclosures: S Mora received institutional research grant support from Atherotech Diagnostics for research outside the current work, served as a consultant and member of the scientific advisory board to Quest Diagnostics, served as a consultant to Pfizer for work outside the current study, and has a patent regarding the use of GlycA in relation to colorectal cancer risk. P M Ridker received unrelated research grants from Kowa, Novartis, Amarin, and NHLBI during the period of this study and has served as a research consultant to Novartis, AstraZeneca, Jansen, Agepha, Inflazome, IQVIA, Uppton, Agepha, CiviBiopharm, Corvidia, and Flame for work unrelated to this manuscript. The other authors had no conflicts of interests related to this manuscript.
References:
- 1.Brosnan JT, Brosnan ME. Branched-chain amino acids: enzyme and substrate regulation. J Nutr 2006;136:207s–11s. [DOI] [PubMed] [Google Scholar]
- 2.Burrage LC, Nagamani SC, Campeau PM, Lee BH. Branched-chain amino acid metabolism: from rare Mendelian diseases to more common disorders. Hum Mol Genet 2014;23:R1–8. [DOI] [PMC free article] [PubMed] [Google Scholar]
- 3.Mayers JR, Wu C, Clish CB, Kraft P, Torrence ME, Fiske BP, Yuan C, Bao Y, Townsend MK, Tworoger SS, et al. Elevation of circulating branched-chain amino acids is an early event in human pancreatic adenocarcinoma development. Nat Med 2014;20:1193–1198. [DOI] [PMC free article] [PubMed] [Google Scholar]
- 4.Liu R, Hong J, Xu X, Feng Q, Zhang D, Gu Y, Shi J, Zhao S, Liu W, Wang X, et al. Gut microbiome and serum metabolome alterations in obesity and after weight-loss intervention. Nat Med 2017;23:859–868. [DOI] [PubMed] [Google Scholar]
- 5.Tobias DK, Mora S, Verma S, Lawler PR. Altered branched chain amino acid metabolism: toward a unifying cardiometabolic hypothesis. Curr Opin Cardiol 2018;33:558–564. [DOI] [PMC free article] [PubMed] [Google Scholar]
- 6.Guasch-Ferré M, Hruby A, Toledo E, Clish CB, Martínez-González MA, Salas-Salvadó J, Hu FB. Metabolomics in Prediabetes and Diabetes: A Systematic Review and Meta-analysis. Diabetes Care 2016;39:833–846. [DOI] [PMC free article] [PubMed] [Google Scholar]
- 7.Wang TJ, Larson MG, Vasan RS, Cheng S, Rhee EP, McCabe E, Lewis GD, Fox CS, Jacques PF, Fernandez C, et al. Metabolite profiles and the risk of developing diabetes. Nature Med 2011;17:448–453. [DOI] [PMC free article] [PubMed] [Google Scholar]
- 8.Tobias DK, Clish C, Mora S, Li J, Liang L, Hu FB, Manson JE, Zhang C. Dietary Intakes and Circulating Concentrations of Branched-Chain Amino Acids in Relation to Incident Type 2 Diabetes Risk Among High-Risk Women with a History of Gestational Diabetes Mellitus. Clin Chem 2018;64:1203–1210. [DOI] [PMC free article] [PubMed] [Google Scholar]
- 9.Lotta LA, Scott RA, Sharp SJ, Burgess S, Luan Ja, Tillin T, Schmidt AF, Imamura F, Stewart ID, Perry JRB, et al. Genetic Predisposition to an Impaired Metabolism of the Branched-Chain Amino Acids and Risk of Type 2 Diabetes: A Mendelian Randomisation Analysis. PLoS Med 2016;13:e1002179–e1002179. [DOI] [PMC free article] [PubMed] [Google Scholar]
- 10.Xuan L, Hou Y, Wang T, Li M, Zhao Z, Lu J, Xu Y, Chen Y, Qi L, Wang W, et al. Association of branched chain amino acids related variant rs1440581 with risk of incident diabetes and longitudinal changes in insulin resistance in Chinese. Acta diabetologica 2018;55:901–908. [DOI] [PubMed] [Google Scholar]
- 11.Donath MY, Shoelson SE. Type 2 diabetes as an inflammatory disease. Nat Rev Immunol 2011;11:98–107. [DOI] [PubMed] [Google Scholar]
- 12.Liu C, Feng X, Li Q, Wang Y, Li Q, Hua M. Adiponectin, TNF-α and inflammatory cytokines and risk of type 2 diabetes: A systematic review and meta-analysis. Cytokine 2016;86:100–109. [DOI] [PubMed] [Google Scholar]
- 13.Akinkuolie AO, Pradhan AD, Buring JE, Ridker PM, Mora S. Novel protein glycan side-chain biomarker and risk of incident type 2 diabetes mellitus. Arterioscler Thromb Vasc Biol 2015;35:1544–50. [DOI] [PMC free article] [PubMed] [Google Scholar]
- 14.Blüher M, Unger R, Rassoul F, Richter V, Paschke R. Relation between glycaemic control, hyperinsulinaemia and plasma concentrations of soluble adhesion molecules in patients with impaired glucose tolerance or Type II diabetes. Diabetologia 2002;45:210–6. [DOI] [PubMed] [Google Scholar]
- 15.Jain A, Gupta HL, Narayan S. Hyperfibrinogenemia in patients of diabetes mellitus in relation to glycemic control and urinary albumin excretion rate. J Assoc Physicians India 2001;49:227–30. [PubMed] [Google Scholar]
- 16.McLaughlin T, Abbasi F, Cheal K, Chu J, Lamendola C, Reaven G. Use of metabolic markers to identify overweight individuals who are insulin resistant. Ann Intern Med 2003;139:802–9. [DOI] [PubMed] [Google Scholar]
- 17.Sparks JD, Sparks CE, Adeli K. Selective hepatic insulin resistance, VLDL overproduction, and hypertriglyceridemia. Arterioscler Thromb Vasc Biol 2012;32:2104–12. [DOI] [PubMed] [Google Scholar]
- 18.Shalaurova I, Connelly MA, Garvey WT, Otvos JD. Lipoprotein insulin resistance index: a lipoprotein particle-derived measure of insulin resistance. Metab Syndr Relat Disord 2014;12:422–429. [DOI] [PMC free article] [PubMed] [Google Scholar]
- 19.Mackey RH, Mora S, Bertoni AG, Wassel CL, Carnethon MR, Sibley CT, Goff DC Jr. Lipoprotein particles and incident type 2 diabetes in the multi-ethnic study of atherosclerosis. Diabetes Care 2015;38:628–36. [DOI] [PMC free article] [PubMed] [Google Scholar]
- 20.Harada PHN, Demler OV, Dugani SB, Akinkuolie AO, Moorthy MV, Ridker PM, Cook NR, Pradhan AD, Mora S. Lipoprotein insulin resistance score and risk of incident diabetes during extended follow-up of 20 years: The Women’s Health Study. J Clin Lipidol 2017;11:1257–1267.e2. [DOI] [PMC free article] [PubMed] [Google Scholar]
- 21.Zheng Y, Ceglarek U, Huang T, Li L, Rood J, Ryan DH, Bray GA, Sacks FM, Schwarzfuchs D, Thiery J, et al. Weight-loss diets and 2-y changes in circulating amino acids in 2 randomized intervention trials. Am J Clin Nutr 2016;103:505–11. [DOI] [PMC free article] [PubMed] [Google Scholar]
- 22.Lips MA, Van Klinken JB, van Harmelen V, Dharuri HK, t Hoen PA, Laros JF, van Ommen GJ, Janssen IM, Van Ramshorst B, Van Wagensveld BA, et al. Roux-en-Y gastric bypass surgery, but not calorie restriction, reduces plasma branched-chain amino acids in obese women independent of weight loss or the presence of type 2 diabetes. Diabetes Care 2014;37:3150–6. [DOI] [PubMed] [Google Scholar]
- 23.Hanvold SE, Vinknes KJ, Bastani NE, Turner C, Løken EB, Mala T, Refsum H, Aas AM. Plasma amino acids, adiposity, and weight change after gastric bypass surgery: are amino acids associated with weight regain? Eur J Nutr 2018;57:2629–2637. [DOI] [PubMed] [Google Scholar]
- 24.Bogl LH, Kaye SM, Rämö JT, Kangas AJ, Soininen P, Hakkarainen A, Lundbom J, Lundbom N, Ortega-Alonso A, Rissanen A, et al. Abdominal obesity and circulating metabolites: A twin study approach. Metabolism 2016;65:111–21. [DOI] [PubMed] [Google Scholar]
- 25.Sun L, Hu C, Yang R, Lv Y, Yuan H, Liang Q, He B, Pang G, Jiang M, Dong J, et al. Association of circulating branched-chain amino acids with cardiometabolic traits differs between adults and the oldest-old. Oncotarget 2017;8:88882–88893. [DOI] [PMC free article] [PubMed] [Google Scholar]
- 26.Otvos JD, Shalaurova I, Wolak-Dinsmore J, Connelly MA, Mackey RH, Stein JH, Tracy RP. GlycA: A Composite Nuclear Magnetic Resonance Biomarker of Systemic Inflammation. Clin Chem 2015;61:714–723. [DOI] [PubMed] [Google Scholar]
- 27.Schmidt MI, Duncan BB, Sharrett AR, Lindberg G, Savage PJ, Offenbacher S, Azambuja MI, Tracy RP, Heiss G. Markers of inflammation and prediction of diabetes mellitus in adults (Atherosclerosis Risk in Communities study): a cohort study. Lancet 1999;353:1649–52. [DOI] [PubMed] [Google Scholar]
- 28.Sandström CS, Ohlsson B, Melander O, Westin U, Mahadeva R, Janciauskiene S. An association between Type 2 diabetes and alpha-antitrypsin deficiency. Diabet Med 2008;25:1370–3. [DOI] [PubMed] [Google Scholar]
- 29.Fumeron F, Péan F, Driss F, Balkau B, Tichet J, Marre M, Grandchamp B. Ferritin and transferrin are both predictive of the onset of hyperglycemia in men and women over 3 years: the data from an epidemiological study on the Insulin Resistance Syndrome (DESIR) study. Diabetes Care 2006;29:2090–4. [DOI] [PubMed] [Google Scholar]
- 30.Pradhan AD, Manson JE, Rifai N, Buring JE, Ridker PM. C-reactive protein, interleukin 6, and risk of developing type 2 diabetes mellitus. JAMA 2001;286:327–34. [DOI] [PubMed] [Google Scholar]
- 31.Ridker PM. From C-Reactive Protein to Interleukin-6 to Interleukin-1: Moving Upstream To Identify Novel Targets for Atheroprotection. Circ Res 2016;118:145–56. [DOI] [PMC free article] [PubMed] [Google Scholar]
- 32.Dugani SB, Moorthy MV, Li C, Demler OV, Alsheikh-Ali AA, Ridker PM, Glynn RJ, Mora S. Association of Lipid, Inflammatory, and Metabolic Biomarkers With Age at Onset for Incident Coronary Heart Disease in Women. JAMA Cardiol 2021;6:437–447. [DOI] [PMC free article] [PubMed] [Google Scholar]
- 33.Fryar CD, Kruszon-Moran D, Gu Q, Ogden CL. Mean Body Weight, Height, Waist Circumference, and Body Mass Index Among Adults: United States, 1999–2000 Through 2015–2016. Natl Health Stat Report 2018:1–16. [PubMed] [Google Scholar]
- 34.Ridker PM, Cook NR, Lee IM, Gordon D, Gaziano JM, Manson JE, Hennekens CH, Buring JE. A randomized trial of low-dose aspirin in the primary prevention of cardiovascular disease in women. N Engl J Med 2005;352:1293–1304. [DOI] [PubMed] [Google Scholar]
- 35.Tobias DK, Mora S, Verma S, Billia F, Buring JE, Lawler PR. Fasting status and metabolic health in relation to plasma branched chain amino acid concentrations in women. Metabolism 2020:154391. [DOI] [PMC free article] [PubMed] [Google Scholar]
- 36.Wolak-Dinsmore J, Gruppen EG, Shalaurova I, Matyus SP, Grant RP, Gegen R, Bakker SJL, Otvos JD, Connelly MA, Dullaart RPF. A novel NMR-based assay to measure circulating concentrations of branched-chain amino acids: Elevation in subjects with type 2 diabetes mellitus and association with carotid intima media thickness. Clin Biochem 2018;54:92–99. [DOI] [PubMed] [Google Scholar]
- 37.Ridker PM, Rifai N, Rose L, Buring JE, Cook NR. Comparison of C-reactive protein and low-density lipoprotein cholesterol levels in the prediction of first cardiovascular events. N Engl J Med 2002;347:1557–1565. [DOI] [PubMed] [Google Scholar]
- 38.Whitton CM, Sands D, Hubbard AR, Gaffney PJ. A collaborative study to establish the 2nd International Standard for Fibrinogen, Plasma. Thromb Haemost 2000;84:258–262. [PubMed] [Google Scholar]
- 39.Akinkuolie AO, Buring JE, Ridker PM, Mora S. A novel protein glycan biomarker and future cardiovascular disease events. J Am Heart Assoc 2014;3:e001221–e001221. [DOI] [PMC free article] [PubMed] [Google Scholar]
- 40.Albert MA, Glynn RJ, Buring JE, Ridker PM. Differential effect of soluble intercellular adhesion molecule-1 on the progression of atherosclerosis as compared to arterial thrombosis: a prospective analysis of the Women’s Health Study. Atherosclerosis 2008;197:297–302. [DOI] [PMC free article] [PubMed] [Google Scholar]
- 41.Mora S, Otvos JD, Rifai N, Rosenson RS, Buring JE, Ridker PM. Lipoprotein particle profiles by nuclear magnetic resonance compared with standard lipids and apolipoproteins in predicting incident cardiovascular disease in women. Circulation 2009;119:931–9. [DOI] [PMC free article] [PubMed] [Google Scholar]
- 42.Chiuve SE, Fung TT, Rimm EB, Hu FB, McCullough ML, Wang M, Stampfer MJ, Willett WC. Alternative dietary indices both strongly predict risk of chronic disease. J Nutr 2012;142:1009–18. [DOI] [PMC free article] [PubMed] [Google Scholar]
Associated Data
This section collects any data citations, data availability statements, or supplementary materials included in this article.