Abstract
Elderly individuals exhibit unbalanced bone marrow (BM) effector T cell subset differentiation, such as increased T helper type 1 (Th1) and T cytotoxic type 1 (Tc1) cell frequencies, but the underlying mechanism is still unclear. Endothelial cells (ECs), which are instructive components of the BM microenvironment, exhibit the phenotype of semi‐professional antigen‐presenting cells and regulate T cell recruitment and activation. Thus, we compared the frequency and function of BM ECs, especially their capacity to regulate effector T cell subsets, between young and elderly healthy individuals, and explored the underlying mechanism of this immunomodulatory discrepancy. Although the young and elderly EC percentages were comparable, young ECs showed fewer reactive oxygen species and better migratory and tube‐forming abilities than elderly ECs. Notably, increased T cell activation molecules and inflammatory cytokines were found in elderly ECs which regulated T cells to differentiate into more proinflammatory T cells, including Th1 and Tc1 cells, than young ECs.
Keywords: endothelial cells, reactive oxygen species, T cells, young donors
BM ECs from young donors had lower ROS levels, better functions, and more balanced T cell modulating effects than ECs from old donors. Lower TLR signaling and costimulatory molecules, and less inflammatory and chemotaxis cytokine secretion in ECs from young donors might cause young ECs to induce more balanced T cell subset differentiation than old ECs.

INTRODUCTION
The immune system undergoes a series of physiological functional declines with ageing, which are termed immunosenescence and partly result in poor responses to vaccines and increased incidence of severe infectious diseases and cancer in the elderly population [1, 2]. Some studies have shown that the adaptive immune system, especially T cells, is more susceptible to ageing than the innate immune system [3, 4]. Our and other previous studies showed decreased frequencies of bone marrow (BM) lymphoid progenitor cells and naive T cells but increased frequencies of memory T cells, as well as unbalanced effector T cell subset differentiation, such as increased T helper type 1 (Th1) and T cytotoxic 1 (Tc1) cells, in elderly individuals [1, 2, 5]. Emerging evidence has indicated that decreased BM lymphoid progenitor cells and involution of the thymus may be responsible for the alterations in T cell subsets with ageing [6, 7, 8]. However, the underlying mechanism of the more balanced differentiation of effector T cell subsets in young individuals than in elderly individuals remains to be clarified.
The BM, as both a primary and secondary lymphoid organ, plays an essential role in regulating the development and differentiation of T cells [9]. Endothelial cells (ECs), which line the interior of blood and lymphatic vessels, are instructive components of the BM microenvironment [10]. In addition to supporting self‐renewal and lineage‐specific differentiation of haematopoietic stem cells through the release of specific angiocrine factors [11, 12, 13], ECs also play crucial immunological roles, particularly in T cell recruitment and activation [14, 15]. Emerging evidence has suggested that ECs exhibit a semi‐professional antigen‐presenting cell (APC) phenotype by expressing classic innate immune receptors such as Toll‐like receptors (TLRs), NOD‐like receptors and inducible co‐stimulatory ligands [16, 17, 18]. Although controversial, some studies have suggested that ECs express co‐stimulatory molecules such as CD80 and CD86 [19, 20]. Activation of EC TLRs by lipopolysaccharide (LPS) or lipopeptide up‐regulated the secretion of specific cytokines, chemokines and adhesion molecules and increased the recruitment and activation of T cells [14, 15]. In addition, recent studies demonstrated that ECs were able to suppress T cell proliferation and modulate T cells to produce fewer proinflammatory cytokines through tumour necrosis factor (TNF) and its receptor 2 signalling pathway [10]. Moreover, liver sinusoidal ECs have been shown to modulate naive CD8+ T cells to secrete less interferon (IFN)‐γ and interleukin (IL)‐2 by cross‐presentation to CD8+ T cells, which then induces immune tolerance [21, 22]. However, whether the frequency and functions of BM ECs, especially their capacity to regulate effector T cell subsets, differs between young and elderly individuals remains to be clarified.
Therefore, the current study was performed to evaluate the frequency and reactive oxygen species (ROS) levels of BM ECs among young, middle‐aged and elderly healthy individuals. Moreover, we investigated whether the function of BM ECs, especially their capacity to modulate the differentiation of effector T cell subsets, differs between young and elderly individuals and the underlying mechanism of this immunomodulatory discrepancy. Our study may contribute to improving the understanding of T cell subset alterations with ageing.
MATERIALS AND METHODS
Healthy donors
In the study, a total of 45 healthy adult individuals who routinely received BM examination as allo‐haematopoietic stem cell transplantation (HSCT) donors from 1 July 2020 to 1 March 2021 at Peking University Institute of Hematology were enrolled. Donors aged <30, 30–45 and >45 years were divided into the young, middle‐aged and elderly groups, respectively, with 15 donors per group. The donor characteristics, including age, sex and routine peripheral blood parameters, were evaluated among young, middle‐aged and elderly donors.
Peking University People’s Hospital Ethics Committee consented the study. Moreover, all subjects signed informed consent before enrolment, in conformity with the Declaration of Helsinki.
Characterization of BM ECs
BM mononuclear cells (BMMNCs) were isolated with Ficoll‐Paque solution (HaoYang, Tianjin, China). The following multicolour flow cytometry panels were applied to quantify ECs in BM: anti‐CD34‐phycoerythrin/cyanin 7 (PE/Cy7), anti‐CD309‐PE and anti‐CD133‐APC (BD Biosciences, San Jose, California, USA). ECs were identified as CD34+CD309+CD133+, and the relative EC frequency was expressed as a fraction of BMMNCs [23, 24, 25, 26, 27]. Samples were collected on a BD LSRFortessa flow cytometer and the compensation adjustment and data analysis were accomplished via BD LSRFortessa software.
Measurement of intracellular ROS
To examine EC ROS levels, 10 µmol/l dichloro‐dihydro‐fluorescein diacetate (DCFH‐DA) (Beyotime, Beijing, China) was added into the BMMNC suspension, which was stained with EC markers at 37°C for 15 min [23, 24, 25, 26, 27]. EC ROS levels were examined by flow cytometry and expressed as the mean fluorescence intensity (MFI).
Culture of primary BM ECs
As previously reported [23, 24, 25, 26, 27], BMMNCs were extracted and seeded to the cell culture plates (Corning, New York, USA) precoated with fibronectin (Sigma, St Louis, Missouri, USA). EGM‐2‐BulletKit (Lonza, Walkersille, Maryland, USA) medium with extra 10% fetal bovine serum (FBS) (gibco, Carlsbad, Maryland, USA) was added to the cell plates and was renewed on the fourth day to supplement cell nutrition.
1,1′‐dioctadecyl‐3,3,3′,3′‐tetramethyl indocarbocyanine perchlorate‐labelled‐acetylated low‐density lipoprotein (DiI‐Ac‐LDL) uptake and fluorescein isothiocyanate Ulex Europaeus agglutinin‐I (FITC–UEA‐I) binding assay
As previously reported [23, 24, 25, 26, 27], DiI‐Ac‐LDL (Life Technologies, Frederick, Maryland, USA) and FITC‐UEA‐I (Sigma) was added to anchorage‐dependent cells that had been cultured for 7 days, and then cells were observed under a fluorescence microscope (Olympus, Tokyo, Japan). Double‐positive‐stained cells were considered as ECs, and the EC numbers on the three random views per well were counted manually [23, 24, 25, 26, 27].
Tube‐formation assay
Matrigel, 250 µl (Corning), was added to each well of a 24‐well plate overnight. Then, 7‐day‐cultured ECs were plated with a density of 5 × 10⁴/well above Matrigel and cultured in 500 µl EGM‐2 medium in an incubator [23, 24, 25]. After 48 h, the tube formed by ECs were observed with a light microscope (Olympus) and three photographs per well were taken randomly [23, 24, 25]. ImageJ (National Institutes of Health, Bethesda, Maryland, USA) was used to quantify the relative tube length.
Migration assay
After 7 days of culture, the cells were detached, and 5 ×10⁴ cells were resuspended in the upper chamber of a Transwell chamber (pore size 8 µm; Corning) with 200 µl EBM‐2 basal medium (Lonza), while 500 µl EGM‐2‐BulletKit containing 10% FBS was added to the lower chamber [23, 24, 25, 26, 27]. After 24 h, cells that migrated from the upper chamber to the lower surface of the membrane were fixed and stained as per previous protocols [23, 24, 25, 26, 27]. For quantification, the stained cells were observed and counted manually in three random views per well with a phase‐contrast microscope (Olympus).
Co‐culture of ECs and CD3+ T cells
CD3+ cells were sorted from BMMNCs with a CD3 MicroBead kit (Miltenyi Biotec, Bergisch Gladbach, Germany) and were co‐cultured with 7‐day primary cultured ECs directly at a ratio of 1:10. The previous medium for ECs was changed to 1 ml RPMI medium (gibco) containing 10% FBS per well for co‐culture.
Immunophenotype analysis of the co‐cultured T cell subsets
After 3 days of co‐culture, CD3+ T cells were treated with cell stimulation cocktail (×500; eBioscience, San Diego, California, USA), as the manufacturer’s instructions, to induce CD3+ T cells activation and cytokine secretion. Then, we evaluated the IL‐4, IFN‐γ, IL‐17 and forkhead box protein 3 (FoxP3) levels by flow cytometry using the following monoclonal antibody panel: CD3‐APC‐H7, CD8‐V500, CD25‐PE/Cy7, IL‐4‐PE, IFN‐γ‐peridinin chlorophyll cyanin 5.5 (PerCPCy5.5), IL‐17‐FITC and FoxP3‐APC (BD Biosciences) [5, 28, 29, 30]. The immunophenotyping of T cell subsets, including Th1, Th2, Th17, Tc1, Tc2 and regulatory T cells (Tregs), were in keeping with our previous studies [5, 28, 29, 30, 31].
RNA sequencing
To determine the regulatory mechanism involved in the improved ability of young donor ECs to support T cell differentiation, we performed RNA sequencing (RNA‐seq) in 7‐day‐cultured ECs from young and elderly donors. RNA extraction and analysis of differential gene expression and gene oncology (GO) enrichment between the young and elderly donor EC groups were completed as previously reported [27, 32].
Quantitative real‐time–polymerase chain reaction (qRT–PCR)
Total RNA was isolated from 1 × 10⁷ 7‐day‐cultured ECs using Trizol reagent (Life Technologies). qRT–PCR was carried out with the QuantiTect SYBR green RT–PCR kit (Qiagen, Hilden, Germany), according to the manufacturer’s instructions. The relative mRNA levels of TLR‐1, TLR‐2 and TLR‐4, CCR‐2, CCR‐5, C‐X‐C chemokine ligand‐10 (CXCL‐10), perforin 1 (PRF‐1) and the NOD‐like receptor protein 3 (NLRP‐3) inflammasome were analysed after normalization to 18s mRNA levels.
Analysis of T cell activation molecules in ECs by flow cytometry
BMMNCs were cultured in EGM‐2‐BulletKit medium and then incubated with 100 ng/ml LPS for 4 h. Afterwards, to test the levels of T cell activation molecules in ECs, the cells were collected and stained with the previously mentioned EC markers and the following multicolour flow cytometry panel at room temperature for 15 min: anti‐TLR‐4‐BV786, anti‐C‐C chemokine receptor (CCR)‐5‐BUV737, anti‐CD80‐BV650 and anti‐CD86‐BB515 (BD Biosciences).
Statistical analysis
Statistical analysis of two and three groups were completed via Mann–Whitney U‐test and one‐way analysis of variance (ANOVA), respectively, by GraphPad Prism (GraphPad Software, San Diego, California, USA). p values < 0.05 were considered statistically significant.
RESULTS
Donor characteristics
A total of 45 healthy donors including 29 males and 16 females were recruited in the study cohort. The median age of these subjects was 38 years, aged from 18 to 64 years. Supporting information, Table S1 shows the characteristics of donors in the young, middle‐aged and elderly groups. The counts of peripheral blood cells were not statistically significant among the three groups.
Comparable frequencies but lower ROS levels in BM ECs from young donors
To clarify whether BM EC frequencies differ in young, middle‐aged and elderly individuals, we measured BM ECs (CD34+CD309+CD133+) by flow cytometry. Figure 1 shows the gating strategy of BM ECs and the percentages as well as intracellular ROS levels of BM ECs among the three age groups. The percentages of primary BM ECs were comparable in the three groups (Figure 1b, 0.12 ± 0.01% versus 0.11 ± 0.01%, p = 0.98; 0.12 ± 0.01% versus 0.11 ± 0.009%, p = 0.74), whereas the ROS levels in BM ECs from young donors were significantly lower than those from middle‐aged donors (Figure 1c, 1661 ± 259 versus 2462 ± 253, p = 0.02) and elderly donors (Figure 1c, 1661 ± 259 versus 2715 ± 315, p = 0.005).
FIGURE 1.
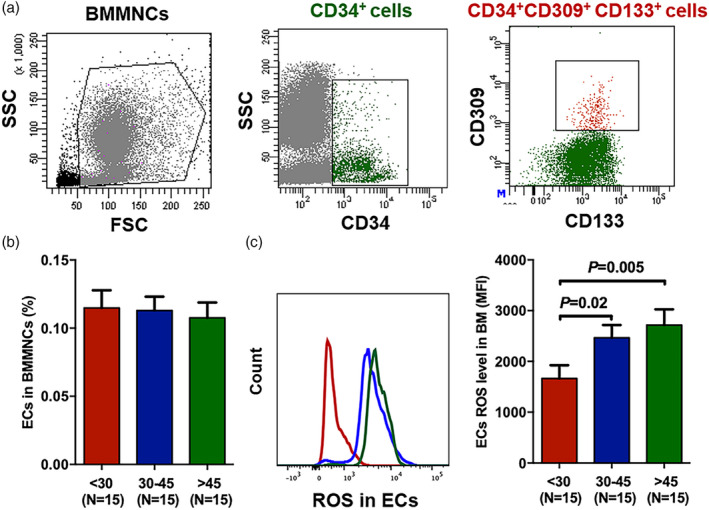
Comparable frequencies but lower reactive oxygen species (ROS) levels in bone marrow endothelial cells (BM ECs) from young donors than from elderly donors. Representative gating strategy for BM ECs (CD34+CD309+CD133+) from healthy donors (a). Frequencies of BM ECs in BM mononuclear cells (MNCs) (b) and intercellular ROS levels in BM ECs (c) among young, middle‐aged and elderly donors. The data are shown as the mean ± standard error of the mean (SEM)
Characterization of primary cultured BM ECs
On the 7th day of culture, anchorage‐dependent spindle‐shaped cells were trypsinized and then confirmed by flow cytometry using the CD34+CD309+CD133+ markers. In addition, the spindle‐shaped cells with double‐positive staining of DiI‐Ac‐LDL and FITC‐UEA‐I were functionally determined to be ECs (Figure 2c).
FIGURE 2.
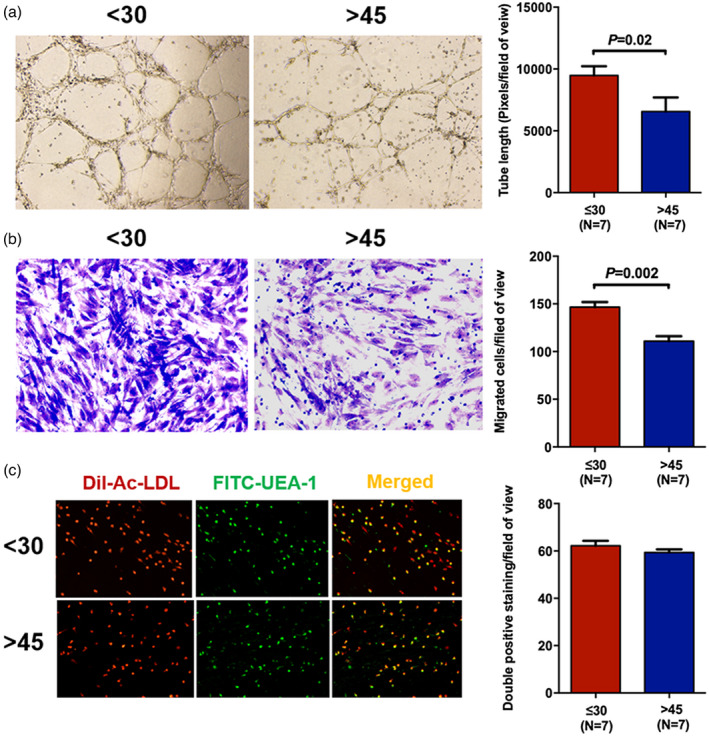
Better migration and tube formation functions of bone marrow endothelial cells (BM ECs) from young than elderly donors. Representative tube formation images and tube length of 7‐day primary cultured BM ECs (magnification ×4) in the young and elderly donor groups (a). Typical figures of the Transwell migration assay and counts of the migrated BM ECs (magnification ×10) from young and elderly donors (b). Representative images of double‐positive‐stained ECs (yellow) with 1,1′‐dioctadecyl‐3,3,3′,3′‐tetramethyl indocarbocyanine perchlorate‐labelled‐acetylated low‐density lipoprotein (DiI‐Ac‐LDL) uptake (red) and fluorescein isothiocyanate‐Ulex europaeus agglutinin‐I (FITC‐UEA‐I) binding (green) and the double‐positive‐stained cell numbers (magnification ×10) in the young and elderly donor groups (c)
Improved migration and tube formation functions of BM ECs from young donors
On the 7th day of culture, BM ECs from young donors showed significantly higher ability for tube formation (Figure 2a, 9476 ± 746.1 versus 5748 ± 950.1, p = 0.02) and migration (Figure 2b, 146.6 ± 5.3 versus 110.8 ± 5.2, p = 0.002) than those of cells from elderly donors. No significant difference was found in double‐positive staining between the young and elderly groups (Figure 2c, 62.2 ± 2.1 versus 59.3 ± 1.3, p = 0.48), which was in accordance with the flow cytometric EC frequency results.
ECs from young donors’ regulated T cells to produce fewer proinflammatory cytokines
To investigate the effect of ECs from individuals with different ages on T cell cytokine production capacity, CD3+ T cells from middle‐aged donors were co‐cultured with ECs from young and elderly donors for 3 days, respectively, and then T cell subsets were examined via flow cytometry.
Figure 3a shows the schematic diagram of the study design for the co‐culture of ECs with CD3+ T cells. After co‐culture, significantly fewer type 1 T cells, including Th1 cells (Figure 3b, 4.60 ± 1.21% versus 17.46% ± 4.28%, p = 0.001) and Tc1 cells (Figure 3e, 5.09 ± 0.73% versus 19.3% ± 2.86%, p = 0.0006), were observed in young donors than in elderly donors. No statistic differences were found in the Th2 (Figure 3c) and Tc2 cell frequencies (Figure 3f) between the two groups. Therefore, the ratios of Th1/Th2 cells (Figure 3d, 1.15 ± 0.35 versus 3.68 ± 0.94, p = 0.01) and Tc1/Tc2 cells (Figure 3g, 1.33 ± 0.36 versus 3.43 ± 0.79, p = 0.02) were notably less in the young group than the elderly group. No significant differences were observed in CD4+/CD8+ T cell ratio (Figure 3h), Th17 (Figure 3i) or Tregs (Figure 3j) between the two groups.
FIGURE 3.
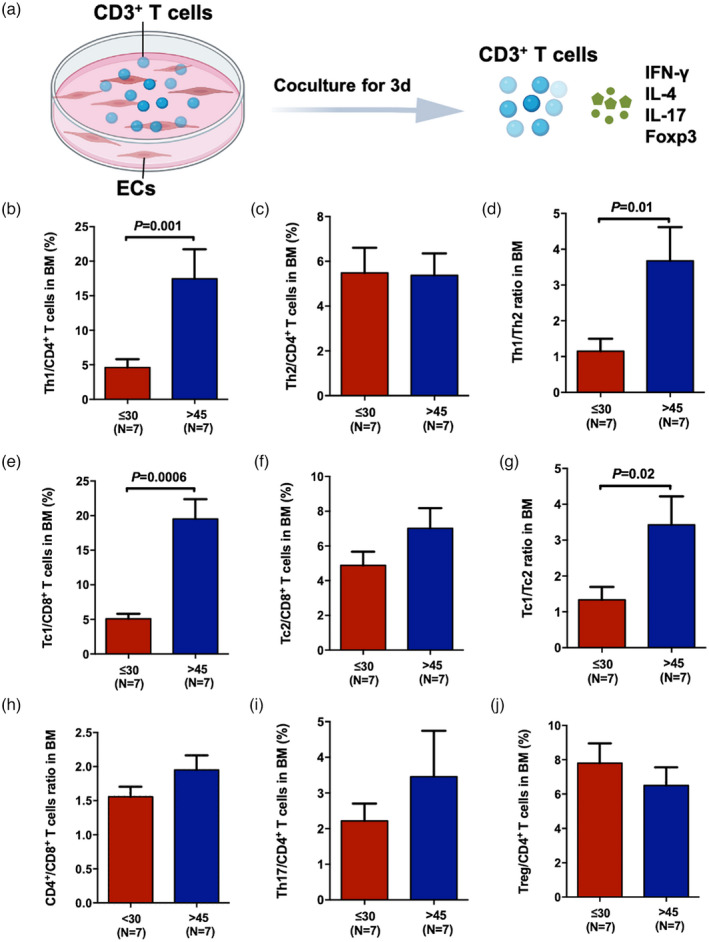
Endothelial cells (ECs) from young donors’ regulated T cells to produce fewer proinflammatory cytokines. Schematic diagram of the study design of the co‐culture of ECs and CD3+ T cells and the measurement of effector T subsets after 3 days of co‐culture (a). The frequencies of bone marrow (BM) T helper type 1 (Th1) [CD3+CD8−interferon (IFN)‐γ+] (b), Th2 [CD3+CD8−interleukin (IL)‐4+] (c), T cytotoxic cell 1 (Tc1) (CD3+CD8+IFN‐γ+) (e), Tc2 (CD3+CD8+IL‐4+) (f), Th17 (CD3+CD8−IL‐17+) (i) and regulatory T cells (Tregs) [CD3+CD8−CD25+forkhead box protein 3 (FoxP3+)] (j) in young and elderly donors. The ratios of BM Th1/Th2 (d), Tc1/Tc2 (g), CD4+/CD8+ T cells (h) in young and elderly donors
Up‐regulated cytokine‐mediated signalling pathway and T cell activation regulatory genes in elderly ECs
To clarify the possible mechanism by which ECs from young and elderly donors cause different effects on T cell subsets, RNA‐seq analyses were performed in ECs from three young donors and three elderly donors that were cultured for 7 days (Figure 4a). Among the 30 331 genes in the volcano plot (Figure 4b), 975 genes had lower expression, and 688 genes had higher expression in the elderly ECs compared to the young ECs. GO term enrichment analysis indicated that genes related to neutrophil activation involved in the immune response were up‐regulated in elderly ECs (Supporting information, Figure S1), suggesting that elderly ECs participated in more immune cell activation than young ECs. GO enrichment analysis also showed the top 10 biological processes enriched by up‐regulated genes in ECs from young and elderly donors, and the results indicated that the cytokine‐mediated signalling pathway and regulation of the T cell activation process were significantly up‐regulated in the elderly group (Figure 4c). The size of each circle indicates the ratio of differentially expressed gene counts to the total gene counts of the term. Heat‐maps show that the expression of genes involved in these two biological processes, including TLR‐1, TLR‐2, co‐stimulatory molecules such as CD86, chemokines and chemokine receptors such as CXCL‐10, CCR‐2 and CCR‐5, and inflammatory cytokines such as PRF‐1 and NLRP‐3, was up‐regulated in elderly ECs compared with young ECs (Figure 4d).
FIGURE 4.
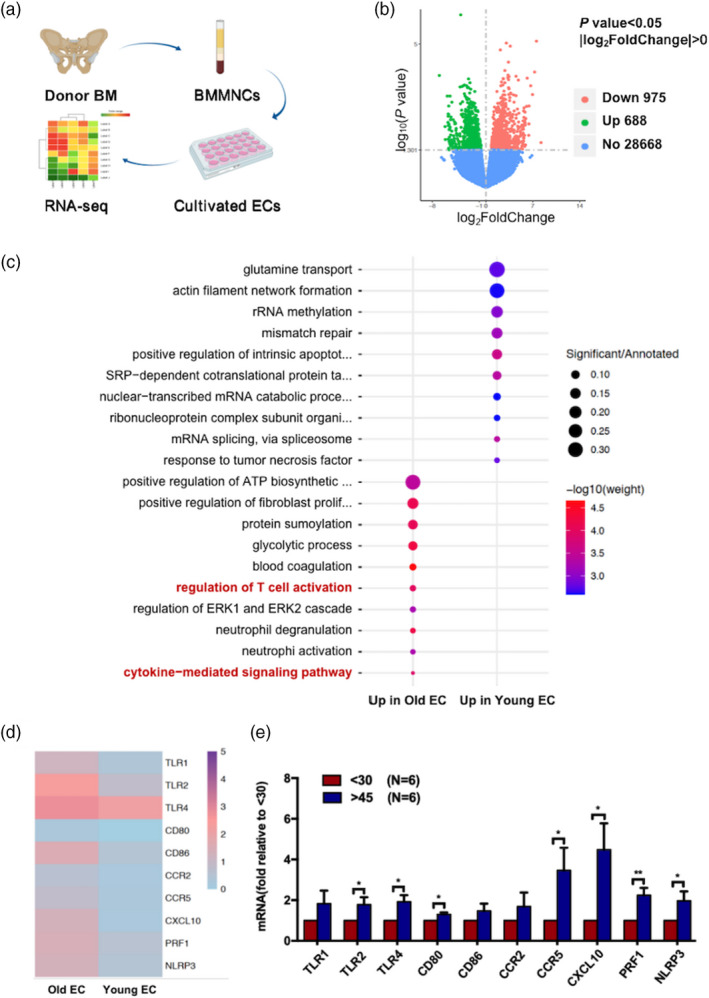
Up‐regulated genes related to the cytokine‐mediated signalling pathway and the regulation of T cell activation in bone marrow endothelial cells (BM ECs) from elderly donors. Schematic diagram of the study design for RNA‐seq analysis of ECs from donors (a). Volcano plots of the down‐regulated (red) and up‐regulated genes (green) in the elderly group and comparable genes (blue) between the two groups (b). Gene oncology (GO) enrichment analysis shows the top 10 biological processes enriched by up‐regulated genes in ECs from young and elderly donors (c). Heat‐maps show gene expression involved in the regulation of T cell activation and cytokine‐mediated signalling pathways, including Toll‐like receptor (TLR)‐1, TLR‐2, TLR‐4, CD80, CD86, C‐X‐C chemokine ligand 10 (CXCL‐10), C‐C chemokine receptor (CCR)‐2, CCR‐5, perforin 1 (PRF‐1) and NOD‐like receptor protein 3 (NLRP‐3) in young and elderly ECs (scaled by row) (d). The relative mRNA expression levels of the aforementioned genes in ECs from young and elderly donors tested by quantitative reverse transcription–polymerase chain reaction (qRT–PCR) (e); *p < 0.05, **p < 0.005
To confirm the RNA‐seq results, we further compared the relative mRNA expression of the aforementioned genes in young and elderly BM ECs by qRT–PCR. Supporting information, Table S2 shows the forward and reverse gene primers that were used for qRT–PCR. In accord with the RNA‐seq results, the mRNA levels of TLR family members, including TLR‐2 (Figure 4e, 1.78 ± 0.36‐fold, p = 0.04) and TLR‐4 (Figure 4e, 1.92 ± 0.32‐fold, p = 0.01), CD80 (Figure 4e, 1.3 ± 0.01‐fold, p = 0.01), CCR‐5 (Figure 4e, 3.46 ± 1.14‐fold, p = 0.04), CXCL‐10 (Figure 4e, 4.48 ± 1.29‐fold, p = 0.02), PRF‐1 (Figure 4e, 2.24 ± 0.35‐fold, p = 0.004) and NLPR‐3 (Figure 4e, 1.99 ± 0.46‐fold, p = 0.04), were significantly higher in ECs derived from the elderly donors than in ECs from the young donors.
Lower expression of TLR‐4, CCR‐5 and CD80 in ECs from young donors
To confirm the RNA‐seq and qRT–PCR results and to further explore probable immunoregulatory mechanisms of ECs, we determined the expression of TLR‐4, CCR‐5 and co‐stimulatory molecules such as CD80 and CD86 in young and elderly BM ECs by flow cytometry after 4 h of LPS stimulation. Figure 5 shows the representative gating strategy for the expression of TLR‐4, CCR‐5, CD80 and CD86 (left panel) and their expressed frequencies (right panel) in ECs from the young and elderly donor groups. The frequencies of TLR‐4+ ECs (Figure 5a, 4.16 ± 0.82% versus 10.39 ± 1.32%, p = 0.0001), CCR5+ ECs (Figure 5b, 4.8 ± 0.89% versus 10.05 ± 1.47%, p = 0.001) and CD80+ ECs (Figure 5c, 5.62 ± 0.78% versus 10.67 ± 1.25%, p = 0.002) in young donors were markedly lower than those in elderly donors. The percentage of CD86+ ECs (Figure 5d, 13.51 ± 0.98% versus 16.53 ± 1.22%, p = 0.08) was lower in young donors than in elderly donors, although the result was not statistically significant.
FIGURE 5.
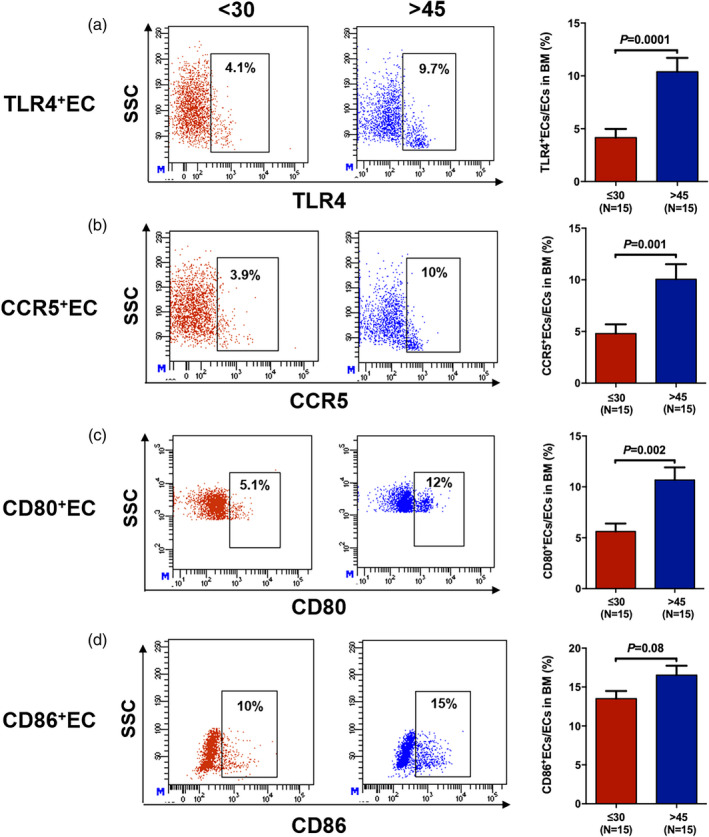
Lower expression of Toll‐like receptor (TLR)‐4, C‐C chemokine receptor (CCR)‐5 and CD80 in endothelial cells (ECs) from young than from elderly donors. The representative gating strategy and frequencies of TLR‐4+ ECs (a), CCR‐5+ ECs (b), CD80+ ECs (c) and CD86+ ECs (d) from the young and elderly donors with lipopolysaccharide (LPS) stimulation
DISCUSSION
In the current study, we found that although the percentages of BM ECs in young and elderly donors were comparable, BM ECs from young donors had significantly lower ROS levels and better migratory and tube‐forming abilities than those from elderly donors, which was in accordance with previous murine and human circulating blood studies about EC ageing [33, 34]. Moreover, young ECs regulated T cell differentiation into more balanced Th1, Th2, Tc1 and Tc2 cells than elderly ECs. Reduced levels of T cell activation molecules and inflammatory cytokines in young BM ECs may be the possible mechanism underlying of the balanced immunomodulatory effects of young ECs (Figure 6). Studies have shown that ECs can stimulate purified T cell proliferation without the involvement of other antigen‐presenting cells, as ECs express major histocompatibility complex classes I and II molecules and innate immune receptors and secrete inflammatory mediators [18, 35, 36]. Human ECs were found to induce programmed death ligand‐1 expression on Tregs and thus enhance the suppressive ability of Tregs [15]. One murine study demonstrated pretreatment of EC with palmitoyl‐3‐cysteine‐serine‐lysine‐4 (TLR‐1/2 ligand) reverted the suppressive properties of T cells and triggered virus‐specific CD8+ T cell immunity [17]. Notably, destruction of the EC barrier triggered T cell co‐stimulation and led to the activation of immune effectors such as Th1 and Tc1 cells and the release of inflammatory mediators to destroy infected cells [14]. In the present study, young BM ECs exhibited lower expression of T cell activation receptors such as TLRs, fewer co‐stimulatory molecules such as CD80, fewer chemokine receptors and ligands such as CCR‐5 and CXCL‐10 and fewer inflammatory cytokines such as PRF‐1 and NLRP‐3 than elderly BM ECs. Therefore, combining previous reports [14, 15, 16, 17, 18, 35, 36] and the current study, we hypothesize that the different immunomodulatory effects of ECs from young and elderly individuals may lead to T cell subset alterations with ageing. Furthermore, the increased TLR signalling pathways and co‐stimulatory molecules and chemokines in ECs from older individuals might be one of the underlying reasons for the imbalance in effector T cell subsets.
FIGURE 6.
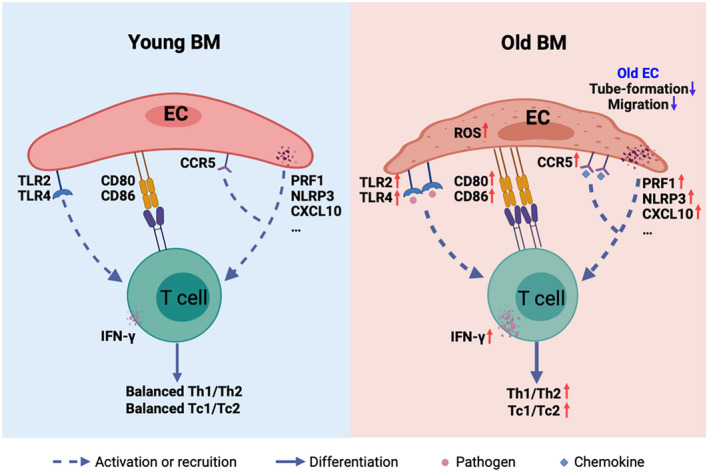
Graphic abstract of the current study. Bone marrow endothelial cells (BM ECs) from young donors had lower reactive oxygen species (ROS) levels, better functions and more balanced T cell modulating effects than ECs from elderly donors. Lower Toll‐like receptor (TLR) signalling and co‐stimulatory molecules and less inflammatory and chemotaxis cytokine secretion in ECs from young donors might cause young ECs to induce more balanced T cell subset differentiation than elderly ECs
T cell subset disparities have been found to affect the incidence of acute graft‐versus‐host disease (aGVHD), a common and life‐threatening complication after allogeneic haematopoietic stem cell transplantation [37, 38, 39, 40, 41]. Numerous studies have shown that the occurrence of aGVHD was related to increased frequencies of donor Th1 and Tc1 cells and reduced frequencies of Th2 and Tc2 cells [37, 38, 41]. Furthermore, we recently reported that young donors had lower percentages of Th1 and Tc1 cells than elderly donors [5], which could partly explain why patients receiving transplants from young donors showed less aGVHD than those who received transplants from elderly donors [42, 43]. However, the in‐depth reason why the aGVHD incidence was affected by donor age remains to be explored. It is worth noting that our study and other previous studies indicated that the number and function of ECs were damaged, EC ROS levels were increased in aGVHD patients and EC destruction could predict the severity of aGVHD [23, 44]. Moreover, our current data demonstrated that ECs from younger donors could instruct T cells to generate more balanced Th1/Th2 and Tc1/Tc2 cell ratios. Thus, we hypothesize that the different effects on T cells by ECs from donors of different ages might affect the occurrence of aGVHD in patients after allo‐HSCT.
We are aware, however, that the mechanism by which T cell subsets change with ageing is heterogeneous. It would be more rigorous and informative to add extending analysis of T cell activation molecules in BM ECs in donors of different ages at the protein level, and whether those molecules directly impact effector T cell subset differentiation needs to be further explored.
In summary, the current study indicated lower EC ROS levels, better BM EC functions and more balanced T cell modulating effects of BM ECs from young donors than from elderly donors. Our preliminary data show that lower TLR signalling and co‐stimulatory molecules, as well as chemokine and receptor expression, and less inflammatory cytokine secretion in the ECs of young individuals might cause young ECs to induce more balanced T cell subset differentiation than elderly ECs. Although further validation is required, our results may provide a new prospect to more clearly understand the mechanism of effector T cell subset alterations with ageing.
CONFLICTS OF INTEREST
The authors declare no commercial or financial conflicts of interest.
AUTHOR CONTRIBUTIONS
Y.K. designed the study and supervised the manuscript preparation. S.Q.T. and W.L.Y. performed the research and analysed the data and contributed equally to this work. W.L.Y. and Y.K. wrote the manuscript. All other authors participated in the collection of patient data. All the authors agreed to submit the final manuscript.
Supporting information
Supplementary Material
ACKNOWLEDGEMENTS
This work was supported by National Natural Science Foundation of China (82070188, 81870139 and 81930004) and the Foundation for Innovative Research Groups of the National Natural Science Foundation of China (81621001). The authors thank all the core facilities at Peking University Institute of Hematology for patient care and sample collection. We thank Dr Li‐Ping Guo from Peking University People’s Hospital for excellent transcriptomic data analysis. American Journal Experts (www.journalexperts.com) provided editorial assistance to the authors during the preparation of the manuscript.
Tang S‐Q, Yao W‐L, Wang Y‐Z, Zhang Y‐Y, Zhao H‐Y, Wen Q, et al. Improved function and balance in T cell modulation by endothelial cells in young people. Clin Exp Immunol. 2021;206:196–207. 10.1111/cei.13654
Shu‐Qian Tang and Wei‐Li Yao contributed equally to this study.
DATA AVAILABILITY STATEMENT
The data presented in this manuscript are included in the paper and the Supporting information.
REFERENCES
- 1. Pritz T, Weinberger B, Grubeck‐Loebenstein B. The aging bone marrow and its impact on immune responses in old age. Immunol Lett. 2014;162:310–5. [DOI] [PubMed] [Google Scholar]
- 2. Pangrazzi L, Meryk A, Naismith E, Koziel R, Lair J, Krismer M, et al. ‘Inflamm‐aging’ influences immune cell survival factors in human bone marrow. Eur J Immunol. 2017;47:481–92. [DOI] [PMC free article] [PubMed] [Google Scholar]
- 3. Pawelec G. Hallmarks of human ‘immunosenescence’: adaptation or dysregulation? Immun Ageing. 2012;9:15. [DOI] [PMC free article] [PubMed] [Google Scholar]
- 4. Peters A, Delhey K, Nakagawa S, Aulsebrook A, Verhulst S. Immunosenescence in wild animals: meta‐analysis and outlook. Ecol Lett. 2019;22:1709–22. [DOI] [PubMed] [Google Scholar]
- 5. Yao W‐L, Wen Q, Zhao H‐Y, Tang S‐Q, Zhang Y‐Y, Wang Y, et al. Different subsets of haematopoietic cells and immune cells in bone marrow between young and older donors. Clin Exp Immunol. 2021;203:137–49. [DOI] [PMC free article] [PubMed] [Google Scholar]
- 6. Pang WW, Price EA, Sahoo D, Beerman I, Maloney WJ, Rossi DJ, et al. Human bone marrow hematopoietic stem cells are increased in frequency and myeloid‐biased with age. Proc Natl Acad Sci USA. 2011;108:20012–7. [DOI] [PMC free article] [PubMed] [Google Scholar]
- 7. Lynch HE, Goldberg GL, Chidgey A, Van den Brink MRM, Boyd R, Sempowski GD. Thymic involution and immune reconstitution. Trends Immunol. 2009;30:366–73. [DOI] [PMC free article] [PubMed] [Google Scholar]
- 8. George AJ, Ritter MA. Thymic involution with ageing: obsolescence or good housekeeping? Immunol Today. 1996;17:267–72. [DOI] [PubMed] [Google Scholar]
- 9. Riether C, Schürch CM, Ochsenbein AF. Regulation of hematopoietic and leukemic stem cells by the immune system. Cell Death Differ. 2015;22:187–98. [DOI] [PMC free article] [PubMed] [Google Scholar]
- 10. Naserian S, Abdelgawad ME, Afshar Bakshloo M, Ha G, Arouche N, Cohen JL, et al. The TNF/TNFR2 signaling pathway is a key regulatory factor in endothelial progenitor cell immunosuppressive effect. Cell Commun Signal. 2020;18:94. [DOI] [PMC free article] [PubMed] [Google Scholar]
- 11. Crane GM, Jeffery E, Morrison SJ. Adult haematopoietic stem cell niches. Nat Rev Immunol. 2017;17:573–90. [DOI] [PubMed] [Google Scholar]
- 12. Poulos MG, Ramalingam P, Gutkin MC, Llanos P, Gilleran K, Rabbany SY, et al. Endothelial transplantation rejuvenates aged hematopoietic stem cell function. J Clin Invest. 2017;127:4163–78. [DOI] [PMC free article] [PubMed] [Google Scholar]
- 13. Hooper AT, Butler JM, Nolan DJ, Kranz A, Iida K, Kobayashi M, et al. Engraftment and reconstitution of hematopoiesis is dependent on VEGFR2‐mediated regeneration of sinusoidal endothelial cells. Cell Stem Cell. 2009;4:263–74. [DOI] [PMC free article] [PubMed] [Google Scholar]
- 14. Razakandrainibe R, Pelleau S, Grau GE, Jambou R. Antigen presentation by endothelial cells: what role in the pathophysiology of malaria? Trends Parasitol. 2012;28:151–60. [DOI] [PubMed] [Google Scholar]
- 15. Lim WC, Olding M, Healy E, Millar TM. Human endothelial cells modulate CD4(+) T cell populations and enhance regulatory T cell suppressive capacity. Front Immunol. 2018;9:565. [DOI] [PMC free article] [PubMed] [Google Scholar]
- 16. Khayyamian S, Hutloff A, Buchner K, Grafe M, Henn V, Kroczek RA, et al. ICOS‐ligand, expressed on human endothelial cells, costimulates Th1 and Th2 cytokine secretion by memory CD4+ T cells. Proc Natl Acad Sci USA. 2002;99:6198–203. [DOI] [PMC free article] [PubMed] [Google Scholar]
- 17. Liu J, Jiang M, Ma Z, Dietze KK, Zelinskyy G, Yang D, et al. TLR1/2 ligand‐stimulated mouse liver endothelial cells secrete IL‐12 and trigger CD8+ T cell immunity in vitro . J Immunol. 2013;191:6178–90. [DOI] [PubMed] [Google Scholar]
- 18. Khakpour S, Wilhelmsen K, Hellman J. Vascular endothelial cell Toll‐like receptor pathways in sepsis. Innate Immun. 2015;21:827–46. [DOI] [PubMed] [Google Scholar]
- 19. Hancock WW, Sayegh MH, Zheng X‐G, Peach R, Linsley PS, Turka LA. Costimulatory function and expression of CD40 ligand, CD80, and CD86 in vascularized murine cardiac allograft rejection. Proc Natl Acad Sci USA. 1996;93:13967–72. [DOI] [PMC free article] [PubMed] [Google Scholar]
- 20. Lozanoska‐Ochser B, Klein NJ, Huang GC, Alvarez RA, Peakman M. Expression of CD86 on human islet endothelial cells facilitates T cell adhesion and migration. J Immunol. 2008;181:6109–16. [DOI] [PubMed] [Google Scholar]
- 21. Diehl L, Schurich A, Grochtmann R, Hegenbarth S, Chen L, Knolle PA. Tolerogenic maturation of liver sinusoidal endothelial cells promotes B7‐homolog 1‐dependent CD8+ T cell tolerance. Hepatology. 2008;47:296–305. [DOI] [PubMed] [Google Scholar]
- 22. Limmer A, Ohl J, Kurts C, Ljunggren H‐G, Reiss Y, Groettrup M, et al. Efficient presentation of exogenous antigen by liver endothelial cells to CD8+ T cells results in antigen‐specific T‐cell tolerance. Nat Med. 2000;6:1348–54. [DOI] [PubMed] [Google Scholar]
- 23. Cao X‐N, Kong Y, Song Y, Shi M‐M, Zhao H‐Y, Wen QI, et al. Impairment of bone marrow endothelial progenitor cells in acute graft‐versus‐host disease patients after allotransplant. Br J Haematol. 2018;182:870–86. [DOI] [PubMed] [Google Scholar]
- 24. Kong Y, Cao X‐N, Zhang X‐H, Shi M‐M, Lai Y‐Y, Wang YU, et al. Atorvastatin enhances bone marrow endothelial cell function in corticosteroid‐resistant immune thrombocytopenia patients. Blood. 2018;131:1219–33. [DOI] [PubMed] [Google Scholar]
- 25. Kong Y, Shi M‐M, Zhang Y‐Y, Cao X‐N, Wang YU, Zhang X‐H, et al. N‐acetyl‐L‐cysteine improves bone marrow endothelial progenitor cells in prolonged isolated thrombocytopenia patients post allogeneic hematopoietic stem cell transplantation. Am J Hematol. 2018;93:931–42. [DOI] [PubMed] [Google Scholar]
- 26. Kong Y, Wang YU, Zhang Y‐Y, Shi M‐M, Mo X‐D, Sun Y‐Q, et al. Prophylactic oral NAC reduced poor hematopoietic reconstitution by improving endothelial cells after haploidentical transplantation. Blood Adv. 2019;3:1303–17. [DOI] [PMC free article] [PubMed] [Google Scholar]
- 27. Lyu Z‐S, Cao X‐N, Wen QI, Mo X‐D, Zhao H‐Y, Chen Y‐H, et al. Autophagy in endothelial cells regulates their haematopoiesis‐supporting ability. EBioMedicine. 2020;53:102677. [DOI] [PMC free article] [PubMed] [Google Scholar]
- 28. Kong Y, Wang Y‐T, Cao X‐N, Song Y, Chen Y‐H, Sun Y‐Q, et al. Aberrant T cell responses in the bone marrow microenvironment of patients with poor graft function after allogeneic hematopoietic stem cell transplantation. J Transl Med. 2017;15:57. [DOI] [PMC free article] [PubMed] [Google Scholar]
- 29. Song Y, Wang Y‐T, Huang X‐J, Kong Y. Abnormalities of the bone marrow immune microenvironment in patients with immune thrombocytopenia. Ann Hematol. 2016;95:959–65. [DOI] [PubMed] [Google Scholar]
- 30. Wang Y‐T, Kong Y, Song Y, Han W, Zhang Y‐Y, Zhang X‐H. Increased type 1 immune response in the bone marrow immune microenvironment of patients with poor graft function after allogeneic hematopoietic stem cell transplantation. Biol Blood Marrow Transplant. 2016;22:1376–82. [DOI] [PubMed] [Google Scholar]
- 31. Song Y, Shi M‐M, Zhang Y‐Y, Mo X‐D, Wang YU, Zhang X‐H, et al. Abnormalities of the bone marrow immune microenvironment in patients with prolonged isolated thrombocytopenia after allogeneic hematopoietic stem cell transplantation. Biol Blood Marrow Transplant. 2017;23:906–12. [DOI] [PubMed] [Google Scholar]
- 32. Kong Y, Wu Y‐L, Song Y, Shi M‐M, Cao X‐N, Zhao H‐Y, et al. Ruxolitinib/nilotinib cotreatment inhibits leukemia‐propagating cells in Philadelphia chromosome‐positive ALL. J Transl Med. 2017;15:184. [DOI] [PMC free article] [PubMed] [Google Scholar]
- 33. Kusumbe AP, Ramasamy SK, Itkin T, Mäe MA, Langen UH, Betsholtz C. Age‐dependent modulation of vascular niches for haematopoietic stem cells. Nature. 2016;532:380–4. [DOI] [PMC free article] [PubMed] [Google Scholar]
- 34. Heiss C, Keymel S, Niesler U, Ziemann J, Kelm M, Kalka C. Impaired progenitor cell activity in age‐related endothelial dysfunction. J Am Coll Cardiol. 2005;45:1441–8. [DOI] [PubMed] [Google Scholar]
- 35. Rose ML. Endothelial cells as antigen‐presenting cells: role in human transplant rejection. Cell Mol Life Sci. 1998;54:965–78. [DOI] [PMC free article] [PubMed] [Google Scholar]
- 36. Dunzendorfer S, Lee H‐K, Soldau K, Tobias PS. Toll‐like receptor 4 functions intracellularly in human coronary artery endothelial cells: roles of LBP and sCD14 in mediating LPS responses. FASEB J. 2004;18:1117–9. [DOI] [PubMed] [Google Scholar]
- 37. Blazar BR, Murphy WJ, Abedi M. Advances in graft‐versus‐host disease biology and therapy. Nat Rev Immunol. 2012;12:443–58. [DOI] [PMC free article] [PubMed] [Google Scholar]
- 38. Chang YJ, Zhao XY, Huang XJ. Strategies for enhancing and preserving anti‐leukemia effects without aggravating graft‐versus‐host disease. Front Immunol. 2018;9:3041. [DOI] [PMC free article] [PubMed] [Google Scholar]
- 39. Holtan SG, Pasquini M, Weisdorf DJ. Acute graft‐versus‐host disease: a bench‐to‐bedside update. Blood. 2014;124:363–73. [DOI] [PMC free article] [PubMed] [Google Scholar]
- 40. Zeiser R, Socie G, Blazar BR. Pathogenesis of acute graft‐versus‐host disease: from intestinal microbiota alterations to donor T cell activation. Br J Haematol. 2016;175:191–207. [DOI] [PubMed] [Google Scholar]
- 41. Ferrara JLM, Levine JE, Reddy P, Holler E. Graft‐versus‐host disease. Lancet. 2009;373:1550–61. [DOI] [PMC free article] [PubMed] [Google Scholar]
- 42. Wang Y, Chang YJ, Xu LP, Liu KY, Liu DH, Zhang XH, et al. Who is the best donor for a related HLA haplotype‐mismatched transplant? Blood. 2014;124:843–50. [DOI] [PubMed] [Google Scholar]
- 43. Chang YJ, Luznik L, Fuchs EJ, Huang XJ. How do we choose the best donor for T‐cell‐replete, HLA‐haploidentical transplantation? J Hematol Oncol. 2016;9:35. [DOI] [PMC free article] [PubMed] [Google Scholar]
- 44. Mir E, Palomo M, Rovira M, Pereira A, Escolar G, Penack O, et al. Endothelial damage is aggravated in acute GvHD and could predict its development. Bone Marrow Transplant. 2017;52:1317–25. [DOI] [PubMed] [Google Scholar]
Associated Data
This section collects any data citations, data availability statements, or supplementary materials included in this article.
Supplementary Materials
Supplementary Material
Data Availability Statement
The data presented in this manuscript are included in the paper and the Supporting information.


