Abstract
Recycling multilayer plastic packaging is challenging due to its intrinsic compositional heterogeneity. A promising route to increase recycling rates for these materials is delamination, which allows recycling the polymers separately. Yet, this process is not well understood on a fundamental level. This study aimed to obtain first principles‐based insights of the delamination mechanism of multilayer flexible packaging film (MFPF) with carboxylic acids. Delamination of MFPFs was described through a model based on Fick's first law of diffusion and first‐order dissolution kinetics of polyurethane adhesives. The model was experimentally tested on 5 different MFPFs at different temperatures (50–75 °C), formic acid concentrations (50–100 vol %), and solid/liquid (S/L) ratios (0.005, 0.025, and 0.12 g mL−1). Under the studied conditions the model proved to successfully estimate the delamination time of MFPF with the average Theil's Inequality Coefficient (TIC) value of 0.14. Essential for scaling‐up delamination processes is the possibility to use high S/L ratios as the solubility of the adhesive is rarely limiting.
Keywords: Adhesive, delamination, diffusion, multilayer plastic packaging, recycling
Multilayer plastic packaging: Delamination of multilayer flexible packaging films (MFPFs) is described through a model based on Fick's first law of diffusion and first‐order dissolution kinetics of polyurethane adhesives. The model is validated on typical MFPFs under different experimental conditions. Under the studied conditions the model successfully estimates the delamination time of MFPFs.
Introduction
Plastic packaging, which corresponds to approximately 40 % of the plastic volume produced, is used in various applications such as food, beverages, cosmetics, and pharmaceuticals. [1] Although the general perception of plastic packaging is far from positive due to the generation of high amounts of waste, it offers numerous advantages such as providing protection towards contamination, extending shelf life of products, and displaying product information. [2] In addition, its thin structure and light weight result in lower energy consumption during its production and lower transport costs compared to alternatives such as glass, paper, aluminum cans, and others, as such creating a cascade of economic and environmental benefits throughout the entire value chain.[ 3 , 4 ]
Plastic packaging is sometimes laminated with different polymer layers to obtain superior physicochemical properties (Figure 1), as such improving its functionality by, for example, increasing shelf life. For example, sealing properties of polyethylene terephthalate (PET) are known to be an issue, thus it is often laminated with polyolefins. [5] Also, the use of an aluminum (Al) layer allows protection against UV light, preserving the nutritional value of the products by avoiding photo‐oxidation reactions. [5] Although the combination of different polymer layers broadens the functionality and application area of plastic packaging, the recyclability of multilayer flexible packaging film (MFPF) decreases. During mechanical recycling, for instance, incompatibility issues may arise in these polymer blends, such as polyethylene (PE) and PET. [6] Similarly, heterogeneous polymers such as PET, polyamide (PA), polycarbonate (PC), and others cause contamination of polyolefinic plastic waste in thermochemical recycling.[ 7 , 8 ] Therefore, these complicated multilayer plastic film fractions are still mainly incinerated or landfilled to date. [9]
Figure 1.
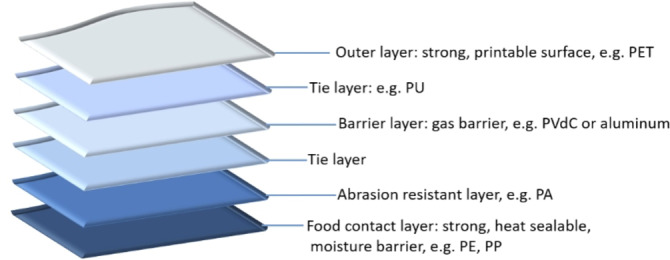
An example of a multilayer flexible packaging film structure (adapted and redrawn from ref. [10]).
One of the options to increase the recycling rate of MFPF is to use compatibilizers during mechanical recycling to improve the miscibility of polymer blends. [6] Although there is still extensive research on the theory and mechanism of compatibilizers, their use in industry is limited since they are rather expensive and sophisticated.[ 7 , 11 , 12 , 13 ]
Recently, there is also a growing interest towards replacement of multilayer packaging by monolayers in order to eliminate processing problems related to complexity of multilayers. For example, the RecycleReady Technology of DOW® (USA) allows for the substitution of heterogeneous multilayer packaging (e. g., containing PET and PE) by a PE‐based monolayer packaging. [14] Similarly, Borealis and Borouge present a monomaterial PE for flexible packaging based on the proprietary Borstar® bimodal technology in combination with machine direction oriented (MDO) processing technology. [15] Although single‐layer packaging is promising to enhance circularity of flexible packaging, it is not easy to achieve the combination of functions that typical multilayer structure can provide. Therefore, it is not unthinkable that multilayers will continue to be used provided that there is an option to separate the layers efficiently.
A first option to separate MFPFs is selective dissolution‐precipitation of constituent polymer layers. For example, in the patented method of Thome et al. [19] polyolefins were dissolved selectively from a composite packaging containing various synthetic polymers by using cycloalkanes, n‐alkanes, and isoalkanes. After nonsoluble components were removed, the solution was dispersed in an aqueous solution to precipitate the polyolefin fraction. [16] Similarly, in the study of Mumladze et al. switchable hydrophilic solvents were used to delaminate MFPF waste by dissolving PE layer selectively. [17] In the patented method of Nauman and Lynch, multilayer structures were sequentially dissolved in a single solvent by creating a gradual increase in temperature in order to obtain pure polymer fractions. [18] Although there are several studies and patents focusing on selective dissolution‐precipitation of the target polymer to separate multilayer components, many of them are primarily focused on recovering the polyolefins.[ 18 , 19 , 20 , 21 , 22 , 23 ] In contrast, in the study of Walker et al., [24] all the constituent polymer layers of multilayer plastic packaging (PET, PE, and ethylene vinyl alcohol (EVOH)) were recovered through solvent‐targeted recovery and precipitation (STRAP) with nearly 100 % material efficiency and at a cost comparable to the virgin materials. This indicates that STRAP process would become competitive to design solvent systems for recycling of MFPFs.
A second option is delamination of MFPF by selective decomposition of polymer layers. [25] For example, Kulkarni et al. studied the recovery of Al from multilayer packaging structures by depolymerizing PET and PA via the use of sub and supercritical water. [26] Also sulfuric acid was proposed at different concentrations to degrade PET from a MFPF consisting of PET and PE layers. [27] Although the results of chemical decomposition of interlayers are promising in terms of polyolefin recovery, degradation products remain as impurity in the solution affecting the recovery of medium adversely. For example, in a study on selective PET degradation, it is shown that the energy consumption for the solvent and product recovery leads to a major part of the greenhouse gas (GHG) emissions. [25]
A third option towards delamination of MFPF is by dissolution of the tie layers used to laminate dissimilar polymer layers. These tie layers typically consist of polyurethanes (PU), acrylates, acid anhydrides, or others. Several studies describe the separation of polymer‐aluminum multilayer packaging by using organic solvent systems.[ 16 , 28 ] For example, the patented method of Panagiotis et al. comprises preconditioning the cured composite laminate material by soaking in one or more solvents such as water, benzyl alcohol, acetone, methyl ethyl ketone (MEK), or a combination of one or more thereof to delaminate composite laminate materials. [29] Although extensive studies are ongoing on using solvents as a delamination agent, the choice of the solvent is dependent on the type of plastic laminates. In addition, since the solvents mainly cause swelling of the interlayer binder, residues of adhesion promoters remain on the separated polymer layers. [30]
Alternatively, acids are also used as a delaminating agent towards delamination of broader range of multilayer structures.[ 31 , 32 ] For example, in the patented method of Massura et al. protonic carboxylic acids such as acetic acid are mixed with organic solvents to increase the solubility of adhesives for the separation of polymer, Al and/or paper from multilayered films.[ 32 , 33 , 34 ] Similarly, inorganic acids such as nitric acid, phosphoric acid are also used for delamination of Al containing composite packaging or industrial refuse in various patents.[ 35 , 36 ] Compared to solvent‐based delamination, acid‐based delamination was the first technology to reach to the fully industrial stage. [37] For example, the patented Saperatec technology (Germany) performs delamination of Al containing multilayer packaging in a pilot scale with a capacity of 17 kt a−1 by using short‐chain carboxylic acids in combination with a swelling agent.[ 38 , 39 ] Likewise, in China recycling of composite packaging waste is carried out in a continuous industrial scale with a capacity of 50 t d−1 through Al−PE delamination using formic acid and nitric acid.[ 37 , 40 , 41 ] Although these technologies are able to obtain raw materials of high purity, they are limited to processing a single type of plastic structure at a given point in time. In all these cases it seems quite plausible that the processes can be improved if the fundamental understanding of the delamination mechanism is improved. [30]
To the best of our knowledge, there is no detailed scientific study available on understanding of the (carboxylic) acid‐based delamination mechanism. This is surprising as there are stringent recycling targets; for example, the Packaging and Packaging Waste Directive introduces a new plastic packaging recycling target of 55 % to be reached by 2030. [42] Delamination is one of the promising routes to achieve this ambitious recycling rate, as also emphasized by various organizations such as among others, Ellen MacArthur Foundation, Netherlands Institute for Sustainable Packaging (KIDV), and Community of Practice Laminate Packaging (CoP).[ 43 , 44 , 45 ] Therefore, the objective of this study is to gain fundamental understanding into the delamination mechanism of MFPF with carboxylic acids by:
investigation the effect of alkyl chain length of carboxylic acids on diffusivity, followed by confirming the results through comparison of the delamination rate of the multilayer samples in different acid media;
understanding the theoretical aspects for delamination such as diffusivity of acids through different polymer layers and the solubility of pure adhesives in these acids;
developing a fundamental kinetic model based on diffusivity and solubility phenomena, followed by development of a model for the delamination process of different MFPFs;
confirmation of the fundamental kinetic model through case studies performed on different MFPFs at different experimental conditions such as temperature, acid concentration, and solid/liquid (S/L) ratio.
Experimental Section
Multilayer samples, chemicals, and reagents
Colored MFPFs with different compositions given in Table 1, were supplied by Siegwerk Druckfarben AG & Co next to the constituent polymer films and the cured aromatic solvent based (SB)‐PU and solvent free (SF)‐PU adhesives. Among these provided multilayer samples, samples A and B are mainly used as food packaging since Al provides superior protection towards light and oxygen. Also, the cast propylene (cPP) offers higher sealing strength and glossy appearance, making the food packaging more appealing. [46] Samples C, D, and E are used as packaging for hygiene and also food products. Compared to untreated PET films, corona‐treated PET films (corona PET) and chemically treated PET films (chemPET) are more suitable for the packaging industry since they provide better bonding towards coatings or printing inks due to increased surface energy.[ 47 , 48 ] In the kinetic and case studies, the MFPFs were used as received at particle sizes of 20×20 mm.
Table 1.
Multilayer flexible packaging film samples and their respective composition.
|
Sample code |
Layer 1 |
Layer 2 |
Layer 3 |
Layer 4 |
Layer 5 |
Layer 6 |
|---|---|---|---|---|---|---|
|
A |
corona PET (type A) |
polyvinyl chloride (PVC) inks |
SB−PU adhesive |
Al |
SB−PU adhesive |
cPP |
|
B |
corona PET (type B) |
PU inks |
SB−PU adhesive |
Al |
SB−PU adhesive |
cPP |
|
C |
corona PET (type B) |
nitrocellulose (NC) inks |
SF−PU adhesive |
white PE |
– |
– |
|
D |
corona PET (type A) |
polyvinyl butyral (PVB‐color) & PVC white inks |
SF−PU adhesive |
transparent PE |
– |
– |
|
E |
two‐component (2 K)‐matt lacquer |
chemPET |
NC & PU white inks |
SB−PU adhesive |
transparent PE |
– |
Formic acid (≥98 %) was supplied by Sigma Aldrich (Merck). 85, 75, and 50 vol % formic acid solution was prepared by diluting with water. Acetic acid (≥99 %), hexanoic acid (≥99 %), and decanoic acid (≥99.5 %) used for comparison of diffusivity were supplied by Sigma Aldrich (Merck).
Diffusivity of carboxylic acids through a single polymer film
A closed‐loop permeation test unit (NBN/ISO 6529) was used to measure the diffusivity of acids through a single polymer layer. In this unit (Figure 2), one side of a polymer film, placed between the chambers of the cell with diameter of 3 cm, is exposed to the acid while the other side is continuously rinsed with a carrier medium, water (100 mL). The unit is combined with a heating element and a temperature sensor in order to set different temperatures and also with an agitator to distribute the temperature equally over the acid‐containing column. As the acid passed through the polymer film and mixes with the carrier medium, the change in conductivity was recorded continuously every second via a conductometer (Methrohm 660) and simultaneously a permeation plot indicating μS cm−1 versus time [s] was shown by the Code‐Parmer USB‐based data acquisition software. Due to insufficient sensitivity of the conductometer to record the changes in s time intervals, stairstep conductivity changes were observed. These conductivity values were converted to acid concentration through elaborated calibration curve using acids at known concentrations (Figure S2).
Figure 2.
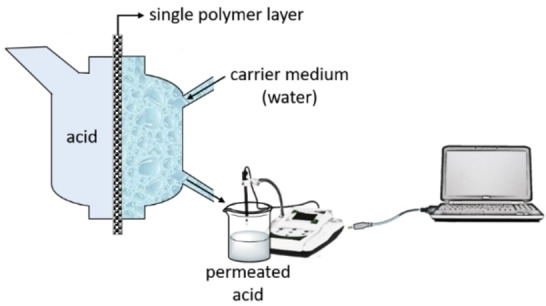
Schematic presentation of the permeation unit used to measure diffusivity of acids.
With the permeation unit, untreated polymer films constituting the studied multilayers were used to test the diffusivity of formic acid. Samples were thus not taken from the delamination experiments themselves for permeation tests. Formic acid diffusion was tested at different temperatures ranging from room temperature (RT) to 75 °C and at different concentrations ranging from 75 to 100 vol %. In addition to formic acid, 100 vol % acetic acid, hexanoic acid, and decanoic acid were also tested at 75 °C in order to investigate the effect of alkyl chain length of acids on the diffusivity.
Kinetic studies on MFPFs and pure PU adhesives
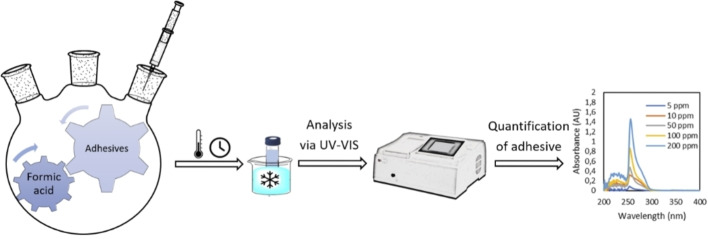
Kinetic studies were performed on the delamination of MFPFs by testing different experimental conditions (Figure 3). Delamination of MFPFs was carried out in a round‐bottom flask equipped with a condenser and a magnetic stirrer for stirring at 400 rpm. The 500 mL flask, containing formic acid (100 mL) at different concentrations, was placed into an oil bath at RT and preheated to the target temperature prior to the addition of multilayer samples (≈0.5 g) in order to minimize the delays to reach the specified temperature at atmospheric pressure. At every time interval (every min during first 5 min, followed by 5, 10, and 20 min intervals), 1 mL aliquot of liquid sample was collected from the delamination solution. The collected sample was then transferred into a vial and immersed in an ice bath to interrupt the dissolution of the (PU) adhesive. Afterwards, these collected samples were analyzed by UV/Vis measurements in order to measure the delamination rate by following the PU concentration change based on a calibration curve. The delamination rate of multilayer samples was calculated based on the PU concentration in the acid medium. During delamination, the PU adhesive in contact with the acid starts to dissolve. When dissolution of 100 % PU adhesive is achieved, this implies complete delamination of the multilayer sample.
Figure 3.
Sequence of delamination kinetic studies performed to quantify dissolved amount of adhesive.
Furthermore, kinetic studies were performed on pure SB−PU and SF−PU adhesives in order to investigate their dissolution kinetics at different temperatures and acid concentrations. During these kinetic studies, based on the solubility of adhesives in formic acid, around 0.1 and 0.07 g of SB−PU and SF−PU adhesives, respectively, were brought into contact with 100 mL of formic acid solution. During dissolution, 1 mL aliquots were collected, which were analyzed by UV/Vis spectroscopy to follow the dissolved amount of adhesives by time.
Analytical techniques for the adhesives (PU) in the acid medium
The concentration changes of the PU adhesive in the acid medium were followed by UV/Vis spectroscopy on UV‐1280 multipurpose UV/Vis spectrophotometer with a scan range of 190–1100 nm. The collected 1 mL aliquots were transferred using a 1 mL disposable plastic pipette into a semi‐micro quartz cuvette with an outer cell dimension of 12.5 mm×12.5 mm×45 mm and an optical path‐length of 10 mm. Pure formic acid solutions were measured as a reference. For each sample, the optical spectrum measurements were repeated three times to ensure its consistency and repeatability. During the spectrum scan, the strongest absorption was recorded at 256 nm for both SB−PU and SF−PU adhesives as they are aromatic‐based PUs. [49] Since the absorbance is proportional to concentration according to the Beer‐Lambert law, [50] diluted solutions of both adhesives with known concentration were measured at 256 nm and calibration curves were elaborated for both PU adhesives in order to calculate the concentration of dissolved adhesive during delamination kinetic studies as shown in Figure S2. Similarly, the solubility of both adhesives in formic acid was measured by UV/Vis spectroscopy in the temperature range of 25–95 °C.
Characterization of delaminated polymer layers
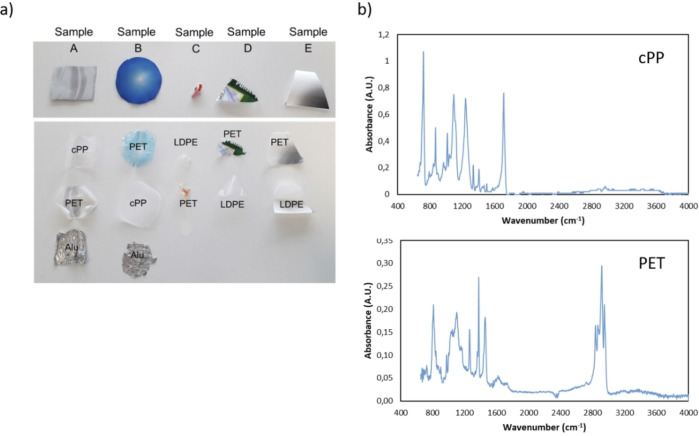
After the delamination of MFPF was completed, the separated polymer layers were characterized via Fourier‐transform (FT)IR spectroscopy on a Bruker Tensor 27 FTIR spectrometer (Figure 4). The FTIR measurements were recorded using the Omnic software in the range of 4000–400 cm−1, at resolution of 4 cm−1 and with 32 scans. For each FTIR analysis, automatic smooth and baseline correction were applied. As seen in Figure 4, multilayer components can be recovered without any degradation. When the carboxylic acid reaches the polymer‐Al interface, the low pH of the acid induces the formation of a protective aluminum oxide layer. [51] However, at pH below 4 (≈2.2 for formic acid), this layer dissolves and Al is exposed to formic acid, resulting in formation of aluminum formate which acts as a protective layer towards further acid corrosion. [52] Since concentrated formic acid was used during delamination, the production of hydronium ions was limited compared to the diluted systems, as such the reaction of Al was decreased to a large extent. [37] The presence of aluminum formate can be detected as a wide single band between 500 and 1000 cm−1 corresponding to the vibrational frequencies of coordinated O−Al−O bonds, [53] yet this is not seen in the FTIR spectra of the treated polymer films, indicating that oxidation of Al was negligible.
Figure 4.
(a) Delamination of MFPFs to their constituent polymer layers. (b) Confirmation of separated polymer layers of sample A by FTIR after delamination.
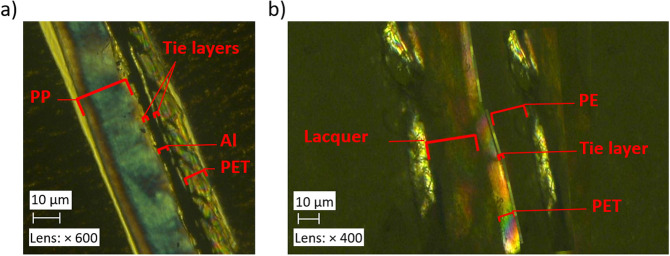
The composition of the MFPFs and the thickness of each polymer layer and PU adhesives were determined by making microtome cuts of 15 μm using a Leica RM 2245 microtome and then by placing the samples in Canada balsam and conditioning them for 24 h under a bench press. The samples were thereafter analyzed using polarized optical microscopy (POM) on a Keyence VHX‐500F microscope as shown in Figure 5. Since different types of polymers show different color under optical light, the thickness of different polymers and adhesives could be detected easily. The PU adhesives were visible in the microtome section as a thin layer of 3 μm thickness between the polymer layers.
Figure 5.
POM images of (a) sample A and (b) sample E.
Crystallinity of each constituent polymer film was calculated through differential scanning calorimetry (DSC) measurements by using a NETZSCH Polyma DSC 214 under N2 atmosphere with a flow of 20 mL min−1. Each sample was heated starting from 20 °C until 300 °C and kept at this temperature for 5 min and then cooled to 50 °C at a heating/cooling rate of 10 °C min−1. This heating/cooling run was repeated two times. Afterwards, the crystallinity of each untreated single polymer film was calculated via the following Equation 1: [54]
| (1) |
where X c is the crystallinity [%], ΔH m [J g−1] and ΔH cc [J g−1] are the measured melt and cold crystallization enthalpies of each polymer, respectively, and ΔH 0 m [J g−1] is the melting enthalpy of 100 % crystalline polymer. [55]
Based on POM and DSC measurements, the thickness of each polymer layer constituting MFPFs and their crystallinity are indicated in Table 2.
Table 2.
Thickness and crystallinity of each polymer film constituting MFPF samples.
|
Polymer type |
Thickness [cm] |
Crystallinity [%] |
|---|---|---|
|
chemPET |
0.0012 |
29.96 |
|
corona PET (type B) |
0.0012 |
32.39 |
|
corona PET (type A) |
0.0012 |
26.73 |
|
transparent PE |
0.0060 |
37.47 |
|
white PE |
0.0063 |
35.97 |
|
cPP |
0.0061 |
34.26 |
The density of both cured SB−PU and SF−PU adhesives was measured as 1.1 g cm−3 via a density scale on Kern EMB‐V. Based on POM and density measurements, the mass of each adhesive layer in the MFPF samples was calculated as 0.00033 g cm−2 and it is assumed that the adhesive is homogenously distributed over the polymer surface. Since sample A and B contain 2 layers of PU adhesive, this amount is multiplied by 2 during delamination rate calculations as shown in Equations (2) and 3:
| (2) |
| (3) |
where is the total mass of adhesive present in the MFPF [g], is the total mass of MFPF used for the delamination experiment [g], is the mass of one MFPF particle [g], is the surface area of one MFPF particle [cm2], n is the number of adhesive layers in the MFPF, and is the mass of adhesive in the acid medium at a specific time during kinetic studies [g].
Kinetic modelling
Delamination of MFPFs is in principle the combined process of diffusion of acid through the polymer layers and dissolution of adhesives when in contact with the acid. Therefore, the delamination kinetics of the MFPFs is described fundamentally based on diffusivity and solubility phenomena.[ 56 , 57 ] The diffusion of the acid through the various polymer layers is best described by Fick's first law since linear diffusion curves (diffused acid amount vs. time) were obtained once steady state was reached. In addition, as the time needed to reach steady state was too short with respect to the time frame of the whole process, the influence of the transient part of the diffusion was negligible, making Fick's first law suitable to describe the diffusion process. Based on Fick's first law, the flux of acid [mg cm−2 s−1] through a single polymer layer is described by the following Equation 4:[ 58 , 59 ]
| (4) |
where is the diffusion coefficient [cm2 s−1], is the mass transfer coefficient [cm s−1], is the polymer thickness [cm], and and are the concentration of acid in the feed side and the permeation side [mg cm−3], respectively. By using the flux of acid, J, the total diffused amount of acid, Q [mL] through each polymer layer is described by the following Equation 5: [60]
| (5) |
where is the surface area in contact with the acid [cm2], is the time interval [s], and is the density of the acid [kg cm−3]. As the concentration at the permeation side is very low compared to the bulk of the system, the concentration at the permeation side is negligible ( ≈0). Consequently, Equation (5) can be simplified to Equation 6:
| (6) |
Diffusion of acid through each polymer layer [cm2 s−1] at different temperatures was calculated based on the Arrhenius equation [Eq. 7]:[ 60 , 61 ]
| (7) |
where is the diffusion coefficient constant of a specific polymer layer [cm2 s−1], is the activation energy of the diffusivity [J mol−1], is the gas constant (8.314 J mol−1 K−1), and is the absolute temperature [K]. The experimental diffusion data of each polymer obtained through permeation tests were fitted to the Arrhenius equation by means of a script in R software using the FME package and a pseudorandom‐search algorithm in order to calculate D 0 and E d values, which are given in Table S1.
In principle, is the combination of the diffusion coefficient of acid through the polymer layer ) and the boundary layer ( ). Based on the description of the resistors in series approach, the relation between the overall mass transfer coefficient ( ), mass transfer coefficient of polymer ( ), and boundary layer ( ) is described as follows [Eq. 8 ]:[ 62 , 63 , 64 ]
| (8) |
In the permeation tests in which 100 vol % acid was used, no boundary layer was formed as no acid concentration gradient occurred during diffusion, thus only was considered to calculate the overall mass transfer coefficient. For the systems in which diluted acid was used, acid concentration gradient occurred due to depletion of acid concentration, thus the overall mass transfer coefficient in terms of diffusivity of the polymer (with thickness of ) and the boundary layer (with thickness of ) can be expressed as follows [Eq. 9]:
| (9) |
where the boundary layer thickness [cm] is expressed as Equation 10:
| (10) |
Equations (9) and (10) can be combined to determine the diffusivity of the boundary layer ( ) [Eq. 11]:
| (11) |
Since the overall mass transfer coefficient ( ) and the diffusion coefficient of the polymer ( ) at different acid concentrations are known through the permeation tests, can be calculated as shown in Equation (11).
Regarding the solubility, the maximum solubility of pure adhesives measured through UV/Vis measurements was taken into account in the delamination model. First‐order dissolution kinetics of the adhesives during delamination of MFPFs were calculated as shown in Equation 12:[ 65 , 66 ]
| (12) |
where is the dissolution rate of the adhesive [mg mL−1 s−1], is the dissolution rate constant [mg mL−1 s−1] and and are the concentration of PU adhesive in the delamination solution and the maximum solubility of PU [mg mL−1], respectively. The ratio of to is called the degree of saturation, which is indicated as . The influence of temperature on the rate constant is also described by the Arrhenius equation [Eq. 13]: [65]
| (13) |
where A 0 is the dissolution constant [mg mL−1 s−1] and E a is the activation energy [J mol−1], which were calculated by means of the FME package using the Levenberg‐Marquardt algorithm and then the experimental kinetic data was fitted on the Arrhenius equation via the pseudorandom‐search algorithm. Based on this algorithm, E a values of SB−PU and SF−PU adhesive were calculated as 27460 and 33134 J mol−1, respectively. Also, A 0 values of SB−PU and SF−PU adhesive were taken as 9.84 and 99.99 mg mL−1 s−1, respectively. Based on the obtained dissolution rate constant values at each different temperature, the dissolution rate of the adhesive R diss was calculated using Equation (12).
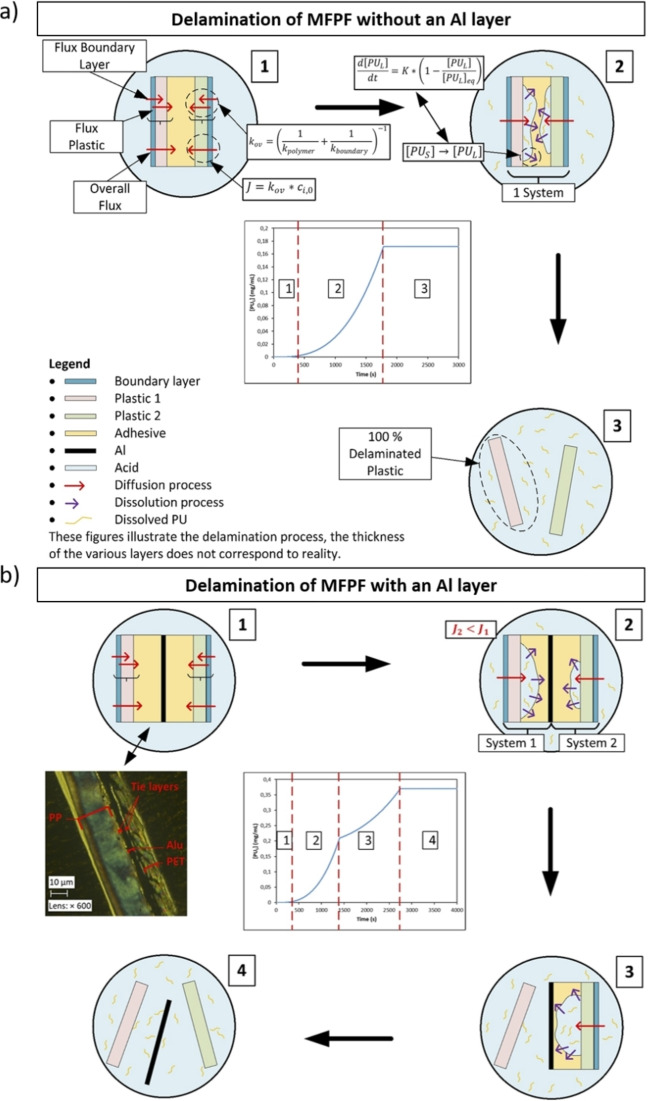
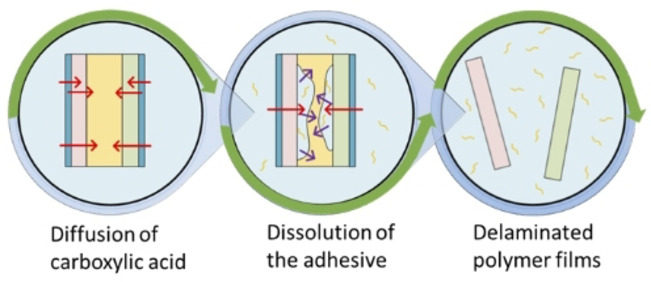
Based on the diffused amount of acid through the plastic films ( ) obtained through permeation tests and the dissolution kinetics of pure PU adhesives obtained through kinetic studies at different experimental conditions, the delamination rate of MFPFs can be estimated. Figure 6 gives an overview of the three‐stage process:
Figure 6.
Delamination mechanism of MFPF (a) without an Al layer and (b) with an Al layer.
There is a period of acid diffusion through the polymer layers.
The diffused acid starts dissolving the adhesive slowly. As more acid diffuses through the polymer layers, dissolution of the adhesive increases gradually.
All adhesives are dissolved and the layers disconnect from each other, indicating a complete delamination of the multilayer sample.
For the MFPF samples without an Al layer, the diffused amount of acid is summed up and the whole multilayer sample is considered as a single system with respect to the dissolution kinetics as shown in Figure 6a. However, for the multilayer samples containing Al layer such as sample A and B, each side of the Al layer is considered as a separate system, as the Al is considered impermeable by the acid, and the dissolution kinetics of each system are determined separately based on the corresponding diffused amount of acid as indicated in Figure 6b. Since the kinetics of acid diffusion through the diverse polymer layers are different, the PU adhesive is not dissolved at the same rate in each side of the Al layer. Therefore, a converging point is observed in the delamination rate graphs for such multilayer samples (Figure 6b). The error analysis of the fundamental kinetic model to the experimental data was performed using validation techniques such as Sum of Square of Errors (SSE) and Theil's Inequality Coefficient (TIC).
Results and Discussion
Influence of alkyl chain length on the delamination rate
Based on literature data it is expected that shorter chain carboxylic acids are a more effective delamination medium as they diffuse faster. [67] In order to confirm this hypothesis, permeation tests were performed on PP and chemPET films at 75 °C by using 100 vol % formic acid, acetic acid, hexanoic acid, and decanoic acid, separately. Based on calibration curves of each acid (Figure S1), the obtained conductivity values with permeation tests were converted to the diffused amount of acid through the polymer films as a function of time as shown in Figure 7. In case the diffusion of acid through a certain polymer film is low, the conductivity change becomes slower, as such bigger gaps are seen between the stairstep changes. In order to compare the diffusion of acids through different polymer films equally, the effect of polymer thickness on diffusivity was eliminated by multiplying the diffused amount of acid (Q) with the corresponding polymer thickness as indicated in Table 2.
Figure 7.
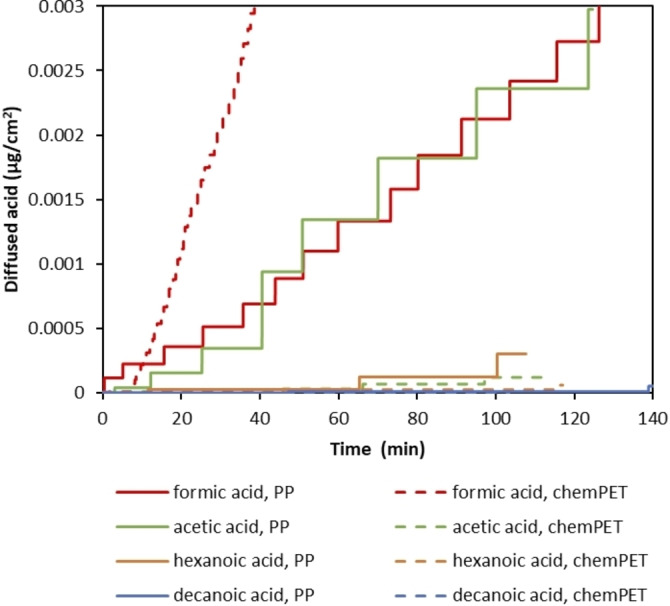
Diffused amount of different carboxylic acids [μg cm−2] through PP and chemPET at 75 °C.
As seen in Figure 7, the diffused amount of acid decreases as the alkyl chain length of the carboxylic acids increases. The fastest diffusion through both PP and chemPET is observed with formic acid whereas decanoic acid shows the slowest diffusion. Comparing the diffusion through PP and chemPET indicates that diffusion of longer‐chain carboxylic acids is relatively faster through apolar polymers (e. g., PP) compared to polar ones (e. g., PET). Interestingly, although a fast diffusion rate through PP is observed for both formic and acetic acid, the diffusion of acetic acid through chemPET is more than 20 times slower compared to the diffusion of formic acid. This might be due the fact that the polarity of the acid decreases as its chain length increases. For example, hexanoic acid is more apolar compared to formic acid due to its longer alkyl chain. Therefore, the diffusion rate of hexanoic acid through PP is relatively faster than through chemPET, whereas for a small more polar molecule like formic acid, diffusion is faster through chemPET. In addition to the effect of polarity, higher crystallinity of PP would also cause slower diffusion compared to chemPET as indicated in Table 2, despite the fact that the experimental temperature of 75 °C is well above the glass transition temperature (T g) of PP (≈−13 °C). [68]
Since the diffusion rate of acids through PP and chemPET is inversely proportional to acid chain length as shown in Figure 7, it is expected to observe slower delamination with longer chain carboxylic acids. In order to investigate this, kinetic studies were performed on sample B with particle size of 4 cm2, constituting of corona PET and PP films, by using 100 vol % formic acid, acetic acid, and hexanoic acid, separately at 75 °C. Based on the elaborated calibration curve of the PU adhesive in each acid by UV/Vis measurements and the theoretical amount of adhesive existing in the sample B, the dissolved SB−PU adhesive [%] by time was calculated via Equation (3) and the obtained results are shown in Figure 8.
Figure 8.
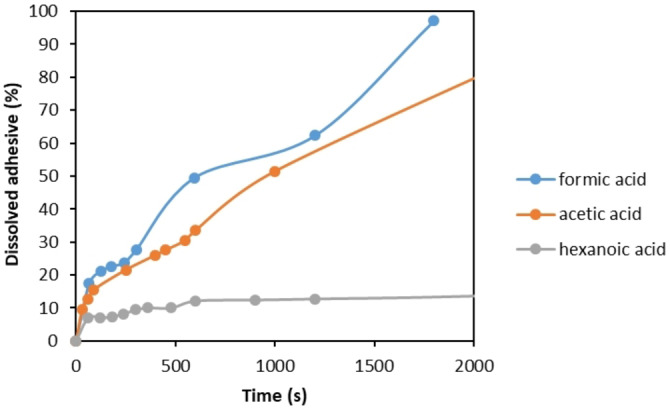
Kinetics of SB−PU adhesive dissolution [%] as a function of time during delamination of sample B in contact with different acids at 75 °C.
As seen in Figure 8, the dissolution rate of SB−PU adhesive is fastest with formic acid, followed by acetic acid and hexanoic acid, respectively. For example, while approximately 97 % adhesive dissolution is observed with formic acid in less than 2000 s, only about 14 % dissolution is obtained with hexanoic acid in the same time interval. These results clearly indicate that alkyl chain length has a significant impact on delamination rate of MFPFs. Therefore, in this study formic acid is selected as a superior medium to delaminate, and therefore the next sections focus on formic acid only.
Theoretical aspects of delamination of MFPFs
Delamination of MFPFs is a combined process of diffusion of acid through the polymer layers and dissolution of adhesives when in contact with the acid. Therefore, in principle delamination mechanism can be explained by combining diffusivity and solubility. Since different factors affect these processes such as type of polymer, acid concentration, and temperature, diffusivity of formic acid through each single polymer film and solubility of pure cured PU adhesives were investigated under different experimental conditions. Based on the obtained results, the best‐fit fundamental kinetic model was used in order to describe the delamination of diverse MFPFs.
Diffusivity
Diffusivity of the formic acid through the polymer layers depends on the type of the polymer, but also on the temperature. In order to investigate this, permeation tests were performed on the six different polymer films present in our selection of MFPFs in the temperature range between 50 and 75 °C with 100 vol % formic acid. The obtained conductivity values were converted to the amount of acid diffused by considering the thickness of each polymer film [μg cm−2] and the results are shown in Figure 9.
Figure 9.
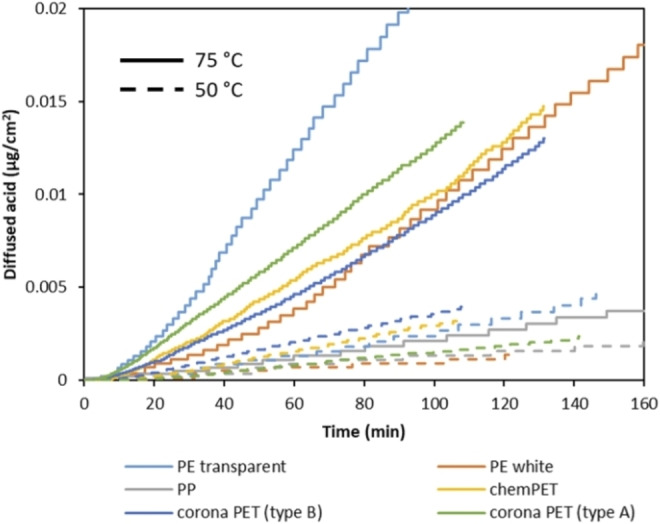
Diffused amount of formic acid as a function of time through different polymer films at 50 °C (dash lines) and 75 °C (straight lines) with 100 vol % formic acid.
According to the results, the diffusivity of formic acid is directly proportional to the temperature. As the temperature goes down from 75 to 50 °C, diffusion of formic acid halves for all polymer films. Regarding to the type of polymer, the slowest diffusion is observed through PP at both temperatures due to its lower polarity and higher crystallinity despite of its low T g (≈−13 °C). [69] Interestingly, the fastest diffusion is observed through transparent PE film at 75 °C. Although the crystallinity of transparent PE is higher than PET films as shown in Table 2, the operating temperature of 75 °C is well above the T g of PE (−125 °C), resulting in increased chain movements within the polymer structure. [69] In addition, it is observed that diffusion through transparent PE is affected by the temperature increase to a larger extent compared to the other polymer films. For example, when the temperature is decreased to 50 °C, the diffusion of formic acid through transparent PE is decreased by a factor of 8, confirming that T g can be an important factor, with most pronounced effect on PE in this case in the selected working area of formic acid. Based on the diffusion rate of formic acid at different temperatures, the diffusion coefficient of formic acid through each polymer film has been calculated as described in the “kinetic modeling” section using Equation (7) and the obtained values are shown in Table 3.
Table 3.
Diffusion coefficients for a series of polymer films (cm2/s) at 50 °C, 65 °C and 75 °C.
|
T [°C] |
Diffusion coefficient [×10−11 cm2 s−1] |
|||||
|---|---|---|---|---|---|---|
|
|
corona PET (type A) |
corona PET (type B) |
chemPET |
PE transparent |
PE white |
cPP |
|
50 |
0.16 |
0.48 |
0.33 |
0.32 |
0.08 |
0.17 |
|
65 |
0.85 |
2.20 |
1.10 |
0.83 |
0.11 |
0.33 |
|
75 |
1.81 |
2.86 |
1.68 |
2.90 |
0.83 |
0.42 |
According to Table 3, transparent PE has the highest diffusion coefficient at 75 °C (2.9×10⁻¹¹ cm2 s−1), followed by corona PET (Type B), corona PET (Type A), chemPET, white PE, and PP (0.42×10⁻¹¹ cm2 s−1), respectively.
Next to the temperature and type of polymer, the effect of acid concentration on diffusion rate has also been investigated using formic acid at concentration range between 75 and 100 vol % at 50 °C. The data obtained at 85 and 75 vol % formic acid are shown in Figure 10. According to the results, a relatively small reduction of 10 vol % acid concentration decreases the diffusion rate with a factor of 2, especially in the case of transparent PE and corona PET films. Similar to the effect of temperature, the fastest diffusion is observed through transparent PE at both 85 and 75 vol % formic acid (0.0002 and 0.0001 μg cm−2, respectively), while the lowest diffusion rates are obtained for PP and white PE layers at both acid concentrations (0.000037 and 0.000038 μg cm−2, respectively). In addition, it is noticed that temperature is a more important factor compared to concentration for transparent PE, while it is the other way around for corona PET.
Figure 10.
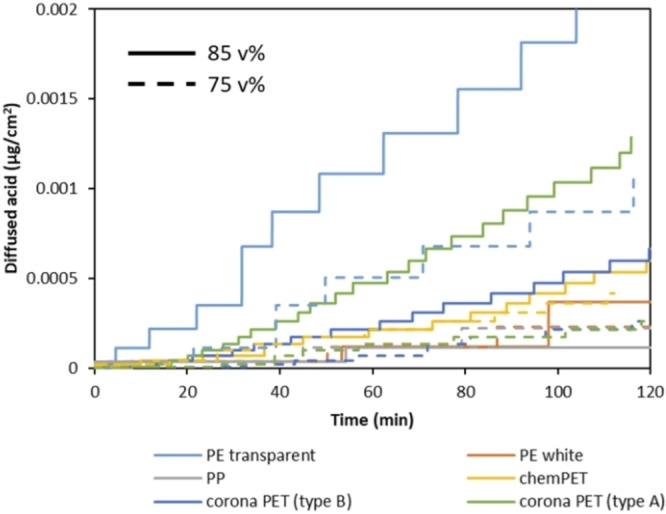
Diffused amount of formic acid through different polymer films with 85 vol % (dash lines) and 75 vol % (straight lines) formic acid at 50 °C as a function of time.
Solubility
The overall delamination rate of MFPFs depends not only on the diffusion rate of formic acid, but also on dissolution kinetics of the adhesive present between the layers. When formic acid diffuses through polymer layers and reaches the adhesive, it starts to dissolve the adhesive and the delamination process starts. As the dissolution rate of adhesives is determined by their solubility, firstly the solubility of both adhesives in formic acid was measured via UV/Vis spectroscopy in the temperature range of 25–95 °C as shown in Figure 11.
Figure 11.
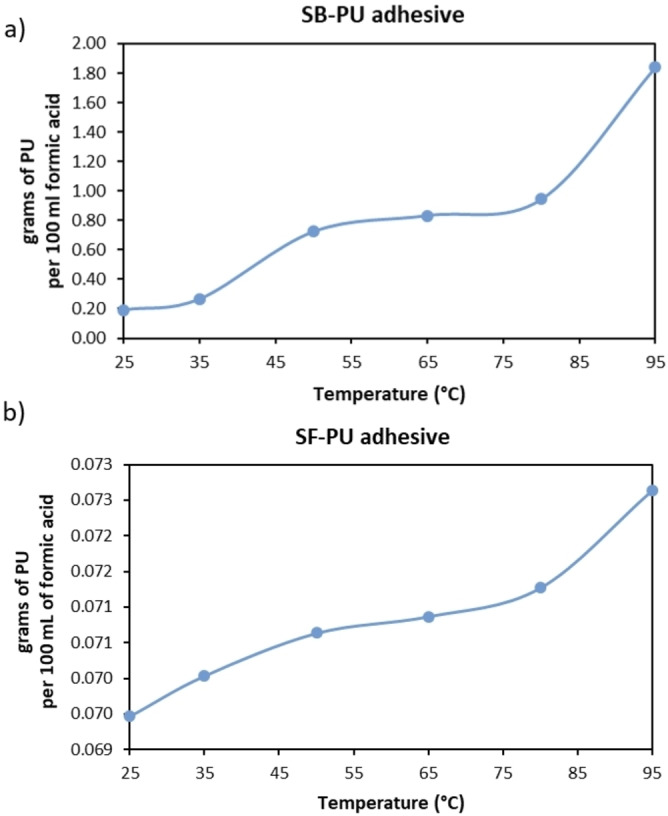
Solubility of (a) SB−PU adhesive and (b) SF−PU adhesive (g per 100 mL solvent mixture) in the temperature range of 25–95 °C.
As seen in Figure 11, there is a big difference between the solubility of SB−PU and SF−PU adhesive in formic acid. For example, at 95 °C while the solubility of SB−PU adhesive is 0.184 g L−1, the solubility of SF−PU adhesive is only 0.0073 g L−1. Therefore, during the delamination of MFPFs containing SF−PU adhesive, a lower amount of multilayer sample was used in order to eliminate saturation of adhesive in the acid medium, as such allowing 100 % delamination.
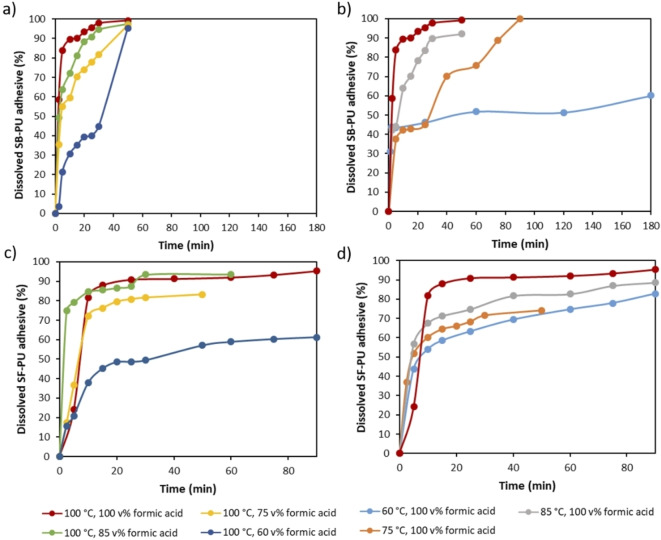
It is generally accepted that the solubility depends on temperature and concentration of solvent, and therefore dissolution kinetics of pure cured SB−PU and SF−PU adhesives were tested at temperatures ranging from 60 to 100 °C and at acid concentrations ranging from 60 to 100 vol %. The amount of pure adhesive used in the beginning of kinetic studies were determined based on the solubility of adhesives in formic acid. The dissolved amount of adhesive by time was quantified by UV/Vis measurements.
As seen in Figure 12, the dissolution rate of both SB−PU and SF−PU adhesive is directly proportional to the temperature and formic acid concentration, thus the fastest dissolution was obtained at 100 °C and with 100 vol % formic acid for each adhesive. As the solubility of SB−PU adhesive is higher than SF−PU adhesive at the same temperature, dissolution of the former adhesive is completed in a shorter time frame. Furthermore, dissolution of the SB−PU adhesive is affected to a larger extent by temperature change. For example, when the temperature is lowered from 100 to 60 °C (red and light blue straight lines in Figure 12b, respectively), a two‐fold decrease is observed for the dissolved SB−PU adhesive [%]. On the other hand, the SF−PU adhesive is more sensitive towards changes in formic acid concentration. For example, even at 100 °C the lowest dissolution (61 %) is observed with 60 vol % formic acid as shown in Figure 12c. These obtained dissolution rates of both PU adhesives at different conditions were used to describe delamination process of different MFPFs (Table 1).
Figure 12.
Dissolution kinetics of (a) pure SB−PU adhesive at different formic acid concentrations at 100 °C; (b) SB−PU adhesive at different temperatures with 100 vol % formic acid; (c) SF−PU adhesive at different formic acid concentrations at 100 °C; (d) SF−PU adhesive at different temperatures with 100 vol % formic acid.
Model development of the delamination process
Based on the mentioned experiments, a fundamental model was developed based on Fick's first law of diffusion and first‐order dissolution kinetics of PU adhesives. As shown in the delamination mechanism of MFPF (Figure 6), in the first step the acid passes through the polymer layers and reaches to the adhesive layer. In order to calculate the amount of acid accumulated between the polymer layers (Q), firstly diffusion of acid through each polymer layer (Di ) at different temperatures was calculated separately based on the Arrhenius equation [Eq. (7)] and the results are shown in Table 3. Since Fickian diffusion is not affected by the concentration, the same diffusivity values were considered for the modeling at different acid concentrations. [60] In principle, Di is the combination of the diffusion coefficient of acid through the polymer layer (D polymer) and the boundary layer (D boundary). At 100 vol % acid concentrations, the overall mass transfer coefficient (k ov) is equal to the mass transfer coefficient of polymer (k polymer). However, in the systems where diluted acid was used, the mass transfer coefficient of the boundary layer (k boundary) was also taken into account to calculate the k ov value. By considering this, based on the experimental diffusion kinetics through each single polymer layer at different conditions, k ov was calculated by using Equation (9) and the values are given in Table 4. In addition, based on these k ov values, D boundary and the thickness of the boundary layer (δ) were calculated by using Equations (10) and (11), which are also indicated in Table 4.
Table 4.
Overall mass transfer coefficient (kov) of each polymer layer, thickness of the boundary layer (δ), and diffusivity of the boundary layer (Dboundary) at different T and acid concentrations.
|
T |
acid conc. |
kov [×10−10 cm s−1] |
δ |
Dboundary |
|||||
|---|---|---|---|---|---|---|---|---|---|
|
[°C] |
[vol%] |
corona PET (type A) |
corona PET (type B) |
chemPET |
PE trans. |
PE white |
cPP |
[×10−19 cm] |
[×10−29 cm2 s−1] |
|
50 |
100 |
49.11 |
35.18 |
13.93 |
7.83 |
0.83 |
0.27 |
– |
3.06 |
|
65 |
100 |
134.64 |
272.64 |
24.53 |
34.54 |
43.14 |
12.46 |
– |
19.52 |
|
75 |
100 |
251.29 |
967.96 |
174.09 |
86.52 |
95.07 |
130.10 |
– |
61.48 |
|
75 |
50 |
6.31 |
6.43 |
6.24 |
6.01 |
6.07 |
6.16 |
9.50 |
61.48 |
|
75 |
75 |
7.57 |
7.75 |
7.47 |
7.14 |
7.23 |
7.37 |
7.87 |
61.48 |
|
75 |
85 |
22.29 |
23.86 |
21.45 |
18.95 |
19.58 |
20.59 |
2.51 |
61.48 |
These diffusivity values were used in the next part on the case studies to calculate the volume of acid passed through the polymer layer in every 0.2 s time interval through Equation (6). During this calculation, the thickness of each polymer layer (l) was considered as shown in Table 2. The density of the formic acid (ρ) and the concentration of formic acid (c (i,0)) was calculated based on the temperature and the dilution factor of the acid [vol%].[ 70 , 71 ] The ρ and c (i,0) values at different T and acid concentration are given in Table S2. As shown in Figure 6 (red arrows), acid diffusion occurs through both sides of the sample, thus the total volume of acid passed through each polymer surface was taken into account to calculate the amount of dissolved adhesive. As dissolution of adhesive starts upon diffusion of formic acid to the adhesive layer, a small lag time occurs, as such convex type of graphs are obtained. However, as this phenomenon takes such a short time compared to the entire delamination process, this lag time is not taken into account in the kinetic model. In addition to frontal diffusion, lateral diffusion (through the sides of the multilayer sample) was investigated by performing delamination tests on sample B at different particle sizes. According to the results shown in Figure S3, the difference in total delamination time is insignificant especially at higher particle sizes. These results are not conclusive as measuring lateral diffusion is not straightforward. Nevertheless, this is an indication that frontal diffusion is more profound compared to lateral diffusion during delamination of multilayer samples. In addition, under the studied conditions the kinetic model proved to successfully estimate the delamination time of MFPF with the average Theil's Inequality Coefficient (TIC) value of 0.14, which is an additional indication that frontal diffusion is dominating over lateral diffusion.
In the second step as shown in Figure 6, depending on the amount of acid accumulated between the polymer layers, dissolution of the PU adhesive starts. Dissolution rates of adhesives were calculated based on experimental kinetic data of pure SB−PU and SF−PU dissolution as presented in Figure 12 by fitting on the Arrhenius equation. Based on this, the dissolution rate constant, K [mg mL−1 s−1], was calculated for both adhesives via Equation (13) and the results are given in Table 5. In the case studies on typical MFPFs, these K values were used to calculate the dissolution rate of the adhesive, R diss, over time by using Equation (12). During this calculation, maximum solubility of PU adhesives, [PUL]eq, was derived based on the experimental solubility data of each adhesive (Figure 11) and the results are also given in Table 5. As it is assumed that the accumulated acid between the polymer layers is concentrated, the [PUL]eq value only changes based on the temperature. The concentration of PU adhesive in the delamination solution, [PUL] [mg mL−1] was calculated based on the total amount of acid passed through both polymer surfaces of multilayer sample at each time interval and also on the theoretical amount of adhesive originally present in the multilayer sample. The error of fit (R 2) for the dissolution rate constant at different conditions was calculated as 0.85 and 0.98 for the SB and the SF adhesive, respectively.
Table 5.
Dissolution rate constant (kr) and maximum solubility ([PUL]eq) of SB−PU and SF adhesive at different temperature and acid concentrations.
|
Adhesive type |
T [°C] |
Acid conc. [vol%] |
k r [×10−4 mg mL−1 s−1] |
[PUL]eq [mg mL−1] |
|---|---|---|---|---|
|
SB |
75 |
100 |
7.46 |
8.72 |
|
65 |
100 |
5.64 |
8.38 |
|
|
50 |
100 |
3.58 |
7.30 |
|
|
75 |
50 |
7.46 |
8.72 |
|
|
75 |
75 |
7.46 |
8.72 |
|
|
75 |
85 |
7.46 |
8.72 |
|
|
SF |
75 |
100 |
10.68 |
0.71 |
|
65 |
100 |
7.61 |
0.71 |
|
|
50 |
100 |
4.40 |
0.71 |
|
|
75 |
50 |
10.68 |
0.71 |
|
|
75 |
75 |
10.68 |
0.71 |
|
|
75 |
85 |
10.68 |
0.71 |
Based on these diffusivity and solubility considerations obtained through single polymer films and pure PU adhesives, respectively, the concentration of PU adhesive in the delamination solution, [PUL] was plotted as a function of time for each MFPF sample. As the increase in [PUL] indicates the delamination of multilayer sample, these graphs can also be interpreted as the delamination rate of MFPFs.
Delamination tests of typical MFPFs
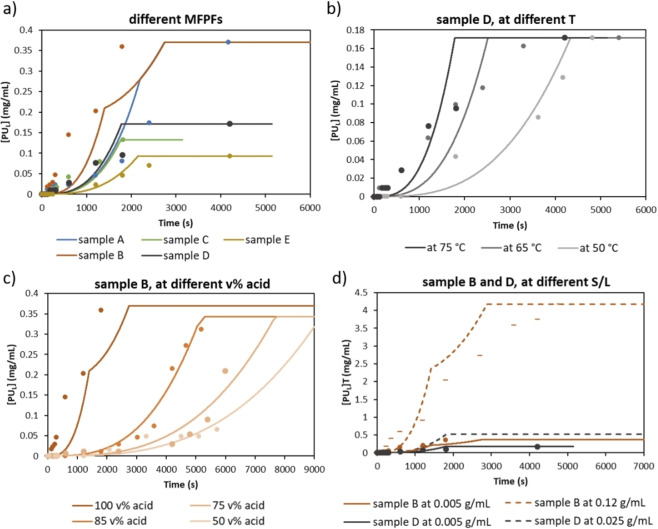
In order to validate the fundamental kinetic model elaborated based on diffusivity of formic acid through different polymer films separately and the dissolution rates that were determined based on pure SB−PU and SF−PU adhesives, case studies were performed on five typically used MFPFs at different temperatures, acid concentrations and S/L ratios. The results are shown in Figure 13 expressed as a concentration increase of PU adhesive in the delamination solution [PUL] by time. In the graphs, experimental results are indicated as dots and the kinetic model as straight lines. The plateau indicates that 100 % of the adhesive is dissolved, thus 100 % delamination is achieved as shown in Figure 6 as the third and fourth zone for MFPF without and with an Al layer, respectively. As can be seen in Figure 13, the experimental data match closely with the fundamental kinetic model. This is also confirmed through a statistical analysis, with the TIC values in all cases varying in the range of 0.06 and 0.25 as indicated in Table S3.
Figure 13.
Concentration increase of PU adhesive over time, [PUL] [mg mL−1]: (a) for each MFPF with 100 vol % formic acid and at 75 °C; (b) for sample D at 50, 65, and 75 °C with 100 vol % formic acid; (c) for sample B at 50, 75, 85, and 100 vol % formic acid at 75 °C; (d) for sample B and D both at 0.005 g mL−1 S/L (straight lines) and also at 0.12 and 0.025 g mL−1 S/L ratio, respectively (dashed lines) with 100 vol % formic acid and at 75 °C. The plateau means 100 % delamination and might lie differently depending on which sample or the amount of sample used in the experiment.
Since MFPF samples constitute of different polymer layers and PU adhesives, they show different delamination kinetics as shown in Figure 13a. Therefore, firstly the fundamental kinetic model was tested by performing kinetic studies on each MFPF sample under the same experimental condition (at 75 °C with 100 vol % formic acid). According to the results, the PU adhesive reached its maximum concentration before 3000 s for all MFPFs, indicating 100 % delamination of all 5 tested multilayer samples which is confirmed by calculating the expected adhesive concentration via Equation (2). Among all MFPFs, sample A and B showed slower delamination as they contain two layers of SB−PU adhesive. In addition, as explained in the “model development” section, a converging point was seen during delamination of samples A and B because the volume of formic acid diffused through each surface of the sample was considered separately as they contain an Al layer (Figure 6). Although sample A and B reached 100 % delamination at the same time due to their similar composition, delamination of sample B started earlier compared to sample A. This is due to higher diffusion coefficient of the type B corona PET (2.86×10⁻¹¹ cm2 s−1) compared to the type A corona PET (1.81×10⁻¹¹ cm2 s−1) as indicated in Table 3. Although a similar S/L ratio was used for each MFPF (≈0.005 g mL−1), the [PUL] reached with samples C, D, and E was the half of [PUL] reached with samples A and B as they contain only one layer of PU adhesive. Among these MFPFs, delamination of sample E required more time, probably due to presence of a lacquer layer and lower diffusion coefficient of constituent chemPET film compared to corona PET film as shown in Table 3.
Secondly, sample D was selected to validate the fundamental kinetic model at different temperatures using 100 vol % formic acid as shown in Figure 13b. As the same S/L ratio (0.005 g mL−1) is used in each test, the maximum value of [PUL] reached was the same (0.17 mg mL−1) at different temperatures. According to the results, when the temperature is increased, the delamination rate of sample D increases due to increased dissolution rate of adhesive and also higher diffusion rate of formic acid. For example, delamination of sample D was completed in less than 2000 s at 75 °C, while it took more than 4000 s at 50 °C. This can also be confirmed by the diffusion coefficients presented in Table 3, showing that diffusion coefficients of constituent polymer layers of sample D at 75 °C, transparent PE, and corona PET (Type A), are around 10‐fold higher than the values at 50 °C.
Thirdly, the fundamental kinetic model is also validated at different formic acid concentrations ranging from 50 to 100 vol % based on sample B as shown in Figure 13c. Similar to temperature, acid concentration is also directly proportional to the delamination rate of multilayer sample. Therefore, according to the kinetic model, total delamination of sample B with 100 vol % formic acid is estimated more than four‐fold faster compared to that with 50 vol % formic acid. This was also confirmed experimentally, where it was observed that the delamination of sample B with 100 vol % formic acid was completed in less than 2000 s, while it took more than 9000 s when using 50 vol % formic acid instead. Furthermore, it is noticed that as the concentration of formic acid decreases, the converging point in the graph starts to disappear. This can be due to a higher influence of the boundary layer on the overall mass transfer coefficient at lower acid concentrations. As the acid concentration decreases, the boundary layer thickness increases as presented in Table 4, as such the difference in acid diffusivity through the different polymer films becomes less significant. This results in similar overall mass transfer coefficient and diffusion, thus the converging point gets smaller.
Lastly, the effect of S/L ratio on delamination rate was investigated on sample B and D, containing SB−PU and SF−PU adhesives respectively, by using 100 vol % formic acid at 75 °C as shown in Figure 13d. Based on the solubility of both PU adhesives in formic acid at 75 °C as indicated in Figure 11, SF−PU has much lower solubility compared to SB−PU adhesive. In order to eliminate saturation of adhesive in the acid medium, 0.12 and 0.025 g mL−1 of S/L ratio was used for samples B and D, respectively. As sample D contains one layer of PU adhesive and also lower amount of multilayer sample was used for delamination, the maximum [PUL] reached was much lower compared to sample B. When the experimental data of both samples obtained at 0.005 g mL−1 of S/L were compared with the data obtained at higher S/L ratio, it is observed that increasing S/L ratio does not influence the delamination rate of multilayer samples significantly. For example, even the S/L ratio of sample B was increased 24 times (from 0.005 to 0.12 g mL−1), it still delaminated fully in the same time frame (≈2800 s). Therefore, at high S/L ratios, delamination rate is only limited by the solubility of the adhesive in formic acid.
Conclusion
Delamination could become a key process in the circular economy of plastics as it allows to recover polymers separately. In order to do so our study demonstrates that understanding the delamination mechanism is key to optimize the delamination of multilayer flexible packaging films (MFPFs) to a more competitive level. Fundamental understanding of the delamination mechanism would strongly accelerate the effort for multilayer plastic waste management and also give direction to research on related topics. In addition to fundamental understanding, this study includes typical multilayer structures at different experimental conditions in order to validate the kinetic model. These findings allow to estimate the delamination rate of various types of real multilayer waste streams and also enable process optimization, which is required to achieve competitive delamination processes.
When delaminating MFPFs using carboxylic acid, we found that the diffusion through both polar [e. g., polyethylene terephthalate (PET) (0.001 μg cm−2 in 20 min)] and apolar polymers [e. g., polypropylene (PP) (0.0004 μg cm−2 in 20 min)] occurs faster in case of formic acid due to its shorter alkyl chain. Therefore, in this study formic acid is selected as a superior medium to delaminate multilayer components.
Firstly, diffusivity of formic acid through each constituent polymer layer of multilayer samples was measured at different temperatures and acid concentrations. According to the results, the diffusion of formic acid is directly proportional to the temperature and acid concentration. For example, when temperature is decreased from 75 to 50 °C, the diffusion of formic acid through transparent polyethylene (PE) is decreased by a factor 8. In addition to this, it is observed that polymer morphology has also a significant effect on acid diffusivity. Even at the highest operating temperature and formic acid concentration (at 75 °C with 100 vol % formic acid), the slowest diffusion is observed through PP (0.004 μg cm−2 even after 160 min) due to its lower polarity and higher crystallinity. On the other hand, the fastest diffusion is observed through transparent PE film under the same experimental conditions despite of its higher crystallinity compared to PET films. This might be due to greater chain mobility of PE at 75 °C as its T g is much lower compared to that of PET.
Secondly, dissolution kinetics of pure cured solvent‐based (SB)−PU and solvent‐free (SF)−PU adhesives were investigated at temperatures ranging from 60 to 100 °C and at acid concentrations ranging from 60 to 100 vol %. The dissolution rate of both adhesives is directly proportional to the temperature and formic acid concentration. For example, when the temperature was lowered from 100 to 60 °C, a 2‐ and 1.5‐fold decrease were observed for the dissolved SB−PU and SF−PU adhesive, respectively. Interestingly, the SB−PU adhesive was affected to a larger extent by temperature changes whereas the SF−PU adhesive was more sensitive towards changes in formic acid concentration. In addition, it is observed that under the same conditions dissolution of SB−PU is faster due to its higher solubility in formic acid.
Thirdly, based on these obtained data on diffusivity and dissolution kinetics, delamination of the MFPFs was described through a kinetic model. Diffusion of formic acid through the polymer films was described by Fick's first law and the dissolution kinetics of polyurethane (PU) adhesives were calculated based on first‐order kinetics. In order to test the fundamental kinetic model, various case studies were performed at different experimental conditions. According to the results, all MFPFs were fully delaminated before 3000 s. Among these MFPFs, samples A and B, containing an Al layer, showed slower delamination as they have two layers of PU adhesive and also due to lower diffusivity of acid through the PP film. On the other hand, sample D containing transparent PE and PET films was delaminated in the shortest time frame due to the higher diffusion coefficient of constituent polymer layers. The kinetic model was also confirmed that higher temperatures and acid concentrations increase the delamination rate of MFPFs due to increased diffusivity of acid and dissolution rate of adhesives. In terms of solid/liquid (S/L) ratio, it is seen that increase in S/L ratio does not affect the delamination rate of MFPFs significantly, until solubility is reached. As the solubility of the SB−PU adhesive is almost 3 times higher than that of the SF−PU adhesive, the MFPFs with SB−PU adhesive would be more efficient to delaminate in terms of the necessary amount of formic acid.
As next steps, further optimization of delamination conditions, recovery of the delamination medium, for example by evaporation/distillation and also confirmation of the fundamental kinetic model with a broader mix of MFPF structures will be crucial to implement an economic and environmental competitive delamination process which can be assessed based on, for instance, life cycle assessment and techno‐economic assessment.
Conflict of interest
The authors declare no conflict of interest.
Supporting information
As a service to our authors and readers, this journal provides supporting information supplied by the authors. Such materials are peer reviewed and may be re‐organized for online delivery, but are not copy‐edited or typeset. Technical support issues arising from supporting information (other than missing files) should be addressed to the authors.
Supporting Information
Acknowledgements
We thank Prof. Kim Ragaert for the access to the polarized optical microscopy. This work has received support from the European Regional Development Fund (ERDF) via the PSYCHE project (Interreg France‐Wallonie‐Vlaanderen) with co‐financing from the provinces of East‐Flanders and West‐Flanders.
S. Ügdüler, T. De Somer, K. M. Van Geem, M. Roosen, A. Kulawig, R. Leineweber, S. De Meester, ChemSusChem 2021, 14, 4198.
Contributor Information
Sibel Ügdüler, www.lcpe.ugent.be.
Prof. Steven De Meester, Email: Steven.DeMeester@UGent.be.
References
- 1.PlasticsEurope., “Plastics – the Facts 2016,” can be found under https://www.plasticseurope.org/application/files/4315/1310/4805/plastic-the-fact-2016.pdf, 2016.
- 2.Plastics Europe, “Plastics in Packaging,” can be found under https://www.plasticseurope.org/en/about-plastics/packaging, 2020.
- 3. Horodytska O., Valdés F. J., Fullana A., Waste Manage. 2018, 77, 413–425. [DOI] [PubMed] [Google Scholar]
- 4.M. Devitt, “Plastic vs Cardboard Packaging: A Complex Choice,” can be found under https://theecobahn.com/packaging/plastic-vs-cardboard-packaging-a-complex-choice/#:~:text=“Reducing the weight and thickness,environment and keep costs down.”&text=In summary%2 C in the plastic,weight-to-strength ratio., 2020.
- 5. Ebnesajjad S., in: Plastic Films in Food Packaging: Materials, Technology and Applications (Ed.: Ebnesajjad S.), Elsevier, Waltham, USA, 2013, pp. 78–93. [Google Scholar]
- 6. Schyns Z. O. G., Shaver M. P., Macromol. Rapid Commun. 2020, 1–27. [Google Scholar]
- 7. Ragaert K., Delva L., Van Geem K., Waste Manage. 2017, 69, 24–58. [DOI] [PubMed] [Google Scholar]
- 8. Roosen M., Mys N., Kusenberg M., Billen P., Dumoulin A., Dewulf J., Van Geem K. M., Ragaert K., De Meester S., Environ. Sci. Technol. 2020, 54, 13282–13293. [DOI] [PubMed] [Google Scholar]
- 9. Kaiser K., Schmid M., Schlummer M., Recycling 2018, 3, 1–26. [Google Scholar]
- 10.J. Dixon, Packaging Materials: 9. Multilayer Packaging for Food and Beverages, ILSI Europe, Brussels, Belgium, 2011.
- 11. Ajji A., Utracki L. A., Polym. Eng. Sci. 1996, 36, 1574–1585. [Google Scholar]
- 12. Liu N. C., Baker W. E., Adv. Polym. Technol. 1992, 11, 249–262. [Google Scholar]
- 13. Feldman D., J. Macromol. Sci. Pure Appl. Chem. 2005, 42, 587–605. [Google Scholar]
- 14.C. Newsom, S. Blodgett, “Breakthrough Dow Technology Enables Recyclable Flexible Plastic Packaging,” can be found under https://corporate.dow.com/en-us/news/press-releases/breakthrough-dow-technology-enables-recyclable-flexible-plastic-packaging.html#:∼:text=First-of-its-Kind,Can Incorporate Barrier Film Technology&text=The stand-up pouch made,in a polyethylene recycling s, 2016.
- 15.Borealis, “Borstar®-based Full PE Laminate solution improves recyclability of flexible packaging materials,” can be found under https://www.borealisgroup.com/news/borstar-based-full-PE-laminate-solution-improves-recyclability-of-flexible-packaging-materials, 2016.
- 16.J. Gartzen, G. Heil, T. Mang (Schering AG, Berlin), WO1993004116 A1, 1993.
- 17. Mumladze T., Yousef S., Tatariants M., Kriukiene R., Makarevicius V., Lukošiute S. I., Bendikiene R., Denafas G., Green Chem. 2018, 20, 3604–3618. [Google Scholar]
- 18.E. B. Nauman, C. J. Lynch (Rensselaer Polytechnic Institute, Troy, NY), US5278282 A, 1994.
- 19.R. D. Thome, S. Kraus, J. Schubert, EP0644230A1 (Koninklijke DSM NV, Heerlen), 1993.
- 20.R. Kippenhahn, U. Knauf, T. Luck, A. Mäurer, M. Schlummer, G. Wolz (Fraunhofer Gesellschaft zur Forderung der Angewandten Forschung eV, München), EP1311599 A1, 2003.
- 21. Mäurer A., Schlummer M., Waste Manage. 2004, 4, 33–34. [Google Scholar]
- 22.W. Lindner (Der Grüne Punkt-Duales System Deutschland AG, Köln), WO2000077082, 2000.
- 23. Ügdüler S., Van Geem K. M., Roosen M., Delbeke E. I. P., De Meester S., Waste Manage. 2020, 104, 148–182. [DOI] [PubMed] [Google Scholar]
- 24. Walker T. W., Frelka N., Shen Z., Chew A. K., Banick J., Grey S., Kim M. S., Dumesic J. A., Van Lehn R. C., Huber G. W., Sci. Adv. 2020, 6, eaba7599, 1–9.. [DOI] [PMC free article] [PubMed] [Google Scholar]
- 25. Ügdüler S., Van Geem K. M., Denolf R., Roosen M., Mys N., Ragaert K., De Meester S., Green Chem. 2020, 22, 5376–5394. [Google Scholar]
- 26. Kulkarni A. K., Daneshvarhosseini S., Yoshida H., J. Supercrit. Fluids 2011, 55, 992–997. [Google Scholar]
- 27.K. M. Patel, M. M. Vaviya, M. H. Patel, WO2015159301 A3, 2016.
- 28.T. E. Kirk (Reynolds Metals Co, Auckland), US5246116 A, 1992.
- 29.E. G. Panagiotis, K. Hurley, E. Carter (Boeing Co, Seattle, WA), EP2591900B1, 2011.
- 30. Niaounakis M., in: Recycling of Flexible Plastic Packaging (Ed.: Payne E.), Matthew Deans, 2019, pp. 211–264. [Google Scholar]
- 31.D. Xianghui, CN100535039C, 2007.
- 32.A. C. Massura, E. A. Marçal De Souza, G. B. Crochemore, WO2003104315A1, 2002.
- 33.J. Kersting, DE4137895C2, 2000.
- 34. Allen K. W., J. Adhes. 1987, 21, 261–277. [Google Scholar]
- 35.A. Mukhopadhyay, US20040054018A1, 2001.
- 36.C.-K. Huang, C.-H. Shao (FGD Recycling Industrial Co Ltd, Taichung), US20040129372 A1, 2002.
- 37. Zawadiak J., Am. J. Chem. Eng. 2017, 5, 37–42. [Google Scholar]
- 38.F. Lovis, H. Seibt, S. Kernbaum (saperatec GmbH, Bielefeld), WO2015169801 A1, 2015.
- 39.Saperatec, “Industrial pilot plant,” can be found under https://www.saperatec.de/en/plant-service.html, 2020.
- 40. Yan D., Peng Z., Liu Y., Li L., Huang Q., Xie M., Wang Q., Waste Manage. 2015, 35, 21–28. [DOI] [PubMed] [Google Scholar]
- 41. Xie M., Bai W., Bai L., Sun X., Lu Q., Yan D., Qiao Q., J. Cleaner Prod. 2016, 112, 4430–4434. [Google Scholar]
- 42.European Commission, “Commission reviews implementation of EU waste rules, proposes actions to help 14 Member States meet recycling targets,” can be found under https://ec.europa.eu/info/news/commission-reviews-implementation-eu-waste-rules-proposes-actions-help-14-member-states-meet-recycling-targets-2018-sep-24_en, 2018.
- 43.Ellen McArthur Foundation, “The new plastics economy: Rethinking the future of plastics & catalysing action,” can be found under https://www.ellenmacarthurfoundation.org/assets/downloads/publications/NPEC-Hybrid_English_22-11-17_Digital.pdf, 2016.
- 44.Netherlands Institute for Sustainable Packaging, “Community of Practice Laminate Packaging,” can be found under https://kidv.nl/community-of-practice-laminates, 2020.
- 45.A. Nonclercq, “Mapping flexible packaging in a Circular Economy,” can be found under https://kidv.nl/media/rapportages/mapping_flexible_packaging.pdf?1.1.2-rc.1, 2016.
- 46.Polyplex, “CPP Films,” can be found under https://www.polyplex.com/sarafil/cpp-films, 2020.
- 47. Lindner M., Rodler N., Jesdinszki M., Schmid M., Sängerlaub S., J. Appl. Polym. Sci. 2018, 135, 45842, 1–9.. [Google Scholar]
- 48.Shanghai CN Films Company, “Chemically treated PET Film,” can be found under http://chinabopetfilm.com/chemically-treated-pet-film.html, 2018.
- 49. Zhou S., Wu L., Xiong M., He Q., Chen G., J. Dispersion Sci. Technol. 2004, 25, 417–433. [Google Scholar]
- 50.Wikipedia, “Beer-Lambert law,” can be found under https://en.wikipedia.org/wiki/Beer-Lambert_law, 2020.
- 51.J. Mattisson, The Influence of Carboxylic Acid in Packaging Materials, Lund University (Sweden), 2016.
- 52. Olafsson G., Hildingsson I., J. Agric. Food Chem. 1995, 43, 306–312. [Google Scholar]
- 53. Reyes-López S. Y., Acuña R. S., López-Juárez R., Rodríguez J. S., J. Ceram. Process. Res. 2013, 14, 627–631. [Google Scholar]
- 54. Hohne G. W. H., Thermochim. Acta 1991, 187, 283–292. [Google Scholar]
- 55.R. L. Blaine, “Thermal Applications Note - Polymer Heats of Fusion,” can be found under www.tainstruments.com/pdf/literature/TN048.pdf, 2002.
- 56. Barrer R. M. in Diffusion In and Through Solid Materials, Cambridge University Press, 1951, pp. 1–54. [Google Scholar]
- 57. Amini M. A., Morrow D. R., in: Permeability of Plastic Films and Coatings (Ed.: Hopfenberg H. B.), Plenum Press, New York, 1974, pp. 113–124. [Google Scholar]
- 58. Garbarini G. R., Eaton R. F., Kwei T. K., Tobolsky A. V., J. Chem. Educ. 1971, 48, 226–230. [Google Scholar]
- 59. Crank J. in The Mathematics of Diffusion, Oxford University Press, New York, 1975, pp. 203–254. [Google Scholar]
- 60. Ha J. H., J. Food Process. Preserv. 1998, 22, 107–122. [Google Scholar]
- 61.R. J. D. Tilley in Understanding Solids: The Science of Materials, 2nd ed., Wiley, 2004, pp. 202–223.
- 62.E. L. Cussler in Diffusion: Mass Transfer in Fluid Systems, Cambridge University Press, Cambridge, 1997, pp. 13–50.
- 63. Joshi S. Y., Harold M. P., Balakotaiah V., Chem. Eng. Sci. 2009, 64, 4976–4991. [Google Scholar]
- 64. Kreulen H., Smolders C. A., Versteeg G. F., Van Swaaij W. P. M., Chem. Eng. Sci. 1993, 48, 2093–2102. [Google Scholar]
- 65. Rickert D., Schlüter M., Wallmann K., Geochim. Cosmochim. Acta 2002, 66, 439–455. [Google Scholar]
- 66. Ries J. B., Ghazaleh M. N., Connolly B., Westfield I., Castillo K. D., Geochim. Cosmochim. Acta 2016, 192, 318–337. [Google Scholar]
- 67. Hamilton J. A., Prostaglandins Leukotrienes Essent. Fatty Acids 1999, 60, 291–297. [DOI] [PubMed] [Google Scholar]
- 68.C. E. Scott, “polypropylene,” can be found under http://www.polymerprocessing.com/polymers/PP.html, 2001.
- 69. Gibbs J. H., DiMarzio E. A., J. Chem. Phys. 1958, 28, 373–383. [Google Scholar]
- 70. Hottel H. C., Noble J. J., Sarofim A. F., Silcox G. D., Wankat P. C., Knaebel K. S., in: Perry's Chemical Engineers′ Handbook (Eds.: Perry R. H., Green D. W.), McGraw-Hill, London, 1997, pp. 697–782. [Google Scholar]
- 71. Jakobsen H. A. in Chemical Reactor Modeling, Springer-Verlag, Berlin, 2008, pp. 543–647. [Google Scholar]
Associated Data
This section collects any data citations, data availability statements, or supplementary materials included in this article.
Supplementary Materials
As a service to our authors and readers, this journal provides supporting information supplied by the authors. Such materials are peer reviewed and may be re‐organized for online delivery, but are not copy‐edited or typeset. Technical support issues arising from supporting information (other than missing files) should be addressed to the authors.
Supporting Information


