

Abstract
Parvalbumin interneurons (PVIs) are affected in many psychiatric disorders including schizophrenia (SCZ), however the mechanism remains unclear. FXR1, a high confident risk gene for SCZ, is indispensable but its role in the brain is largely unknown. We show that deleting FXR1 from PVIs of medial prefrontal cortex (mPFC) leads to reduced PVI excitability, impaired mPFC gamma oscillation, and SCZ-like behaviors. PVI-specific translational profiling reveals that FXR1 regulates the expression of Cacna1h/Cav3.2 a T-type calcium channel implicated in autism and epilepsy. Inhibition of Cav3.2 in PVIs of mPFC phenocopies whereas elevation of Cav3.2 in PVIs of mPFC rescues behavioral deficits resulted from FXR1 deficiency. Stimulation of PVIs using a gamma oscillation-enhancing light flicker rescues behavioral abnormalities cause by FXR1 deficiency in PVIs. This work unveils the function of a newly identified SCZ risk gene in SCZ-relevant neurons and identifies a therapeutic target and a potential non-invasive treatment for psychiatric disorders.
Introduction
Psychiatric disorders affect 18.1–36.1% of adults worldwide, with serious mental illnesses such as schizophrenia (SCZ) and bipolar disorders (BPD) affecting 0.8–6.8% of the world population [1]. SCZ is a devastating disorder, presenting with a variety of debilitating symptoms including hallucinations, delusions, flattened affect, associability, disordered thought, and impaired working memory. The molecular and neural basis for SCZ is poorly understood, hindering effective therapeutic development. SCZ is highly heritable [2], however studies in the past decade focusing on very few specific genes (e.g. DISC1) have yielded limited insight [3]. Advances in human genetics have facilitated better understanding of the underlying molecular pathways associated with SCZ [4–7]. For example, recent large-scale genome-wide association studies have identified 145 loci that are significantly associated with SCZ [4, 7], presenting a new opportunity for understanding the pathogenesis of SCZ and developing novel treatments. There is a pressing need for assessing the functions of these genes in the brain and evaluating their contributions to SCZ phenotypes [8].
FXR1 (FMR1 autosome homolog 1) is among the newly identified genes that are significantly associated with SCZ [4–7]. Several recent multi-modal and cross-species analyses performed by the PsychENCODE Consortium have further supported FXR1 as a high confidence risk gene for SCZ, as well as several other psychiatric disorders [7, 9–12]. FXR1 belongs to a small family of brain-enriched RNA binding proteins (FXRs) that includes fragile X mental retardation protein (FMRP or FMR1), FXR1, and FXR2. FXRs are enriched in the brain and testis, while splicing isoforms of FXR1 are also expressed in muscle [13]. A loss of FXR1 leads to perinatal lethality in mice and is absolutely intolerant in humans (pLI=1.0) [14], whereas FMRP deficiency leads to relatively mild impairments in both mice and humans [15], FXR1 is highly expressed in majority of the neurons of the cortex and the hippocampus throughout postnatal development and in adults (Allen Brain Atlas) [16, 17]. Protein interactome analysis suggests that FXR1 is highly connected with other autism-related proteins, more so than FMRP [18]. The perinatal lethality of Fxr1-null mice presumably results from defective muscle and heart development [19]; however, the neural contribution to this lethality has not been assessed. To date, only limited studies have assessed FXR1 functions in the brain [20–22]. While pan neuronal FXR1 overexpression in the prefrontal cortex (PFC) of adult mice leads to reduced anxiety [20, 21], FXR1 deletion from forebrain excitatory neurons during postnatal period using a CamK2a-Cre driver has no impact on anxiety but enhances learning in mice [22]. FXR1 is also expressed in interneurons [17], but the roles of FXR1 in interneurons have not been investigated.
A hallmark of SCZ is reduced gamma oscillations, a form of brain rhythmicity in the 30–80 Hz frequency range that is important for sensory processing, attention, working memory, and cognition [23, 24]. GABAergic interneurons form extensive local connections with principal excitatory neurons and generate and regulate network oscillations and circuit activity [25, 26]. Parvalbumin-expressing interneurons (PVIs) constitute about 40% of cortical GABAergic interneurons in mouse [27]. PVIs are sparsely distributed, fast-spiking cells that provide feedback and feedforward inhibition to principal cells. PVIs entrain cortical networks to drive gamma oscillations and control their frequency, strength, and coherence [28]. Changes in PVIs, mostly through reduced cell number or in decreased PV expression, have been found in a number of brain disorders including SCZ [29]. Therefore, PVIs offer a potential connection between the cellular and network manifestations of SCZ. However, molecular mechanisms regulating PVIs, particularly by newly discovered SCZ genes, and their impact on brain circuit and behaviors, remain elusive.
Our present comprehensive analyses, ranging from molecular and physiological to circuital and behavioral assessments, demonstrate that FXR1 is an important regulator of PVI function in the medial prefrontal cortex (mPFC). We show that deletion of FXR1 in PVIs of mPFC leads to impaired PVI excitability, reduced prefrontal gamma oscillation and synchronization, and behavioral deficits resembling psychiatric disorders. Using PVI-specific translational profiling, we discover that FXR1 targets Cacna1h mRNA that encodes Cav3.2, a T-type calcium channel known to be important for neuronal plasticity and implicated in autism and epilepsy, and that FXR1 maintains Cav3.2 protein levels in both mouse and human interneurons. Moreover, analysis of PsychENCODE data shows that FXR1 and CACNA1H levels are reduced in postmortem PFC tissues of SCZ patients. We demonstrate that selective inhibition of Cav3.2 in PVIs within the PFC results in behavioral phenotypes similar to those seen in mice with PVI-specific FXR1 deletion. On the other hand, PVI-specific transcriptional activation of Cacna1h/Cav3.2 using a dCas9Activator strategy rescues behavioral deficits in FXR1-deficient mice. Finally, visual stimulation by light flickering at 40 Hz, a non-invasive method for enhancing gamma oscillations, elevates PVI neuronal activities and rescues the behavioral deficits of mice with PVI-specific FXR1 deletion. Our data demonstrate that FXR1 is critical for PVI neuronal activity, brain circuit, and behavior and both deletion and down regulation of FXR1 in PVIs have significant impacts. In addition, we have identified Cav3.2 as a treatment target. Furthermore, we demonstrate a non-invasive light flicker as a potential therapy for SCZ and related psychiatric disorders.
Results
Deletion of FXR1 from PVIs in the mPFC leads to impaired PVI morphology
FXR1 has been identified as a risk gene for SCZ [4–7], but transcriptomic analyses have failed to find significant changes in FXR1 in SCZ brain tissue [9, 10]. To assess the relationship between FXR1 and PVIs, we utilized the PsychENCODE transcriptomic data of human dorsolateral prefrontal cortex (DLPFC, BA9) to determine the levels of PVALB (Parvalbumin) transcript (ENST00000417718) and two BA9-enriched (GTEx, https://www.gtexportal.org) FXR1 protein-coding transcripts FXR1–1(ENST00000305586), FXR1–2 (ENST00000445140). Among individuals with the highest levels of PVALB expression in patient group [top 5% in control (CTR), SCZ, and bipolar disorder (BPD) groups], we found that both PVALB (Fig. 1A) and FXR1 (Fig. 1B, C) transcripts were significantly lower in SCZ and BPD patients compared with CTR, suggesting that PV and FXR1 potentially underlie mechanisms of SCZ and BPD.
Fig. 1. FXR1 deletion in PVIs leads to morphological defects of PVIs in the mPFC.
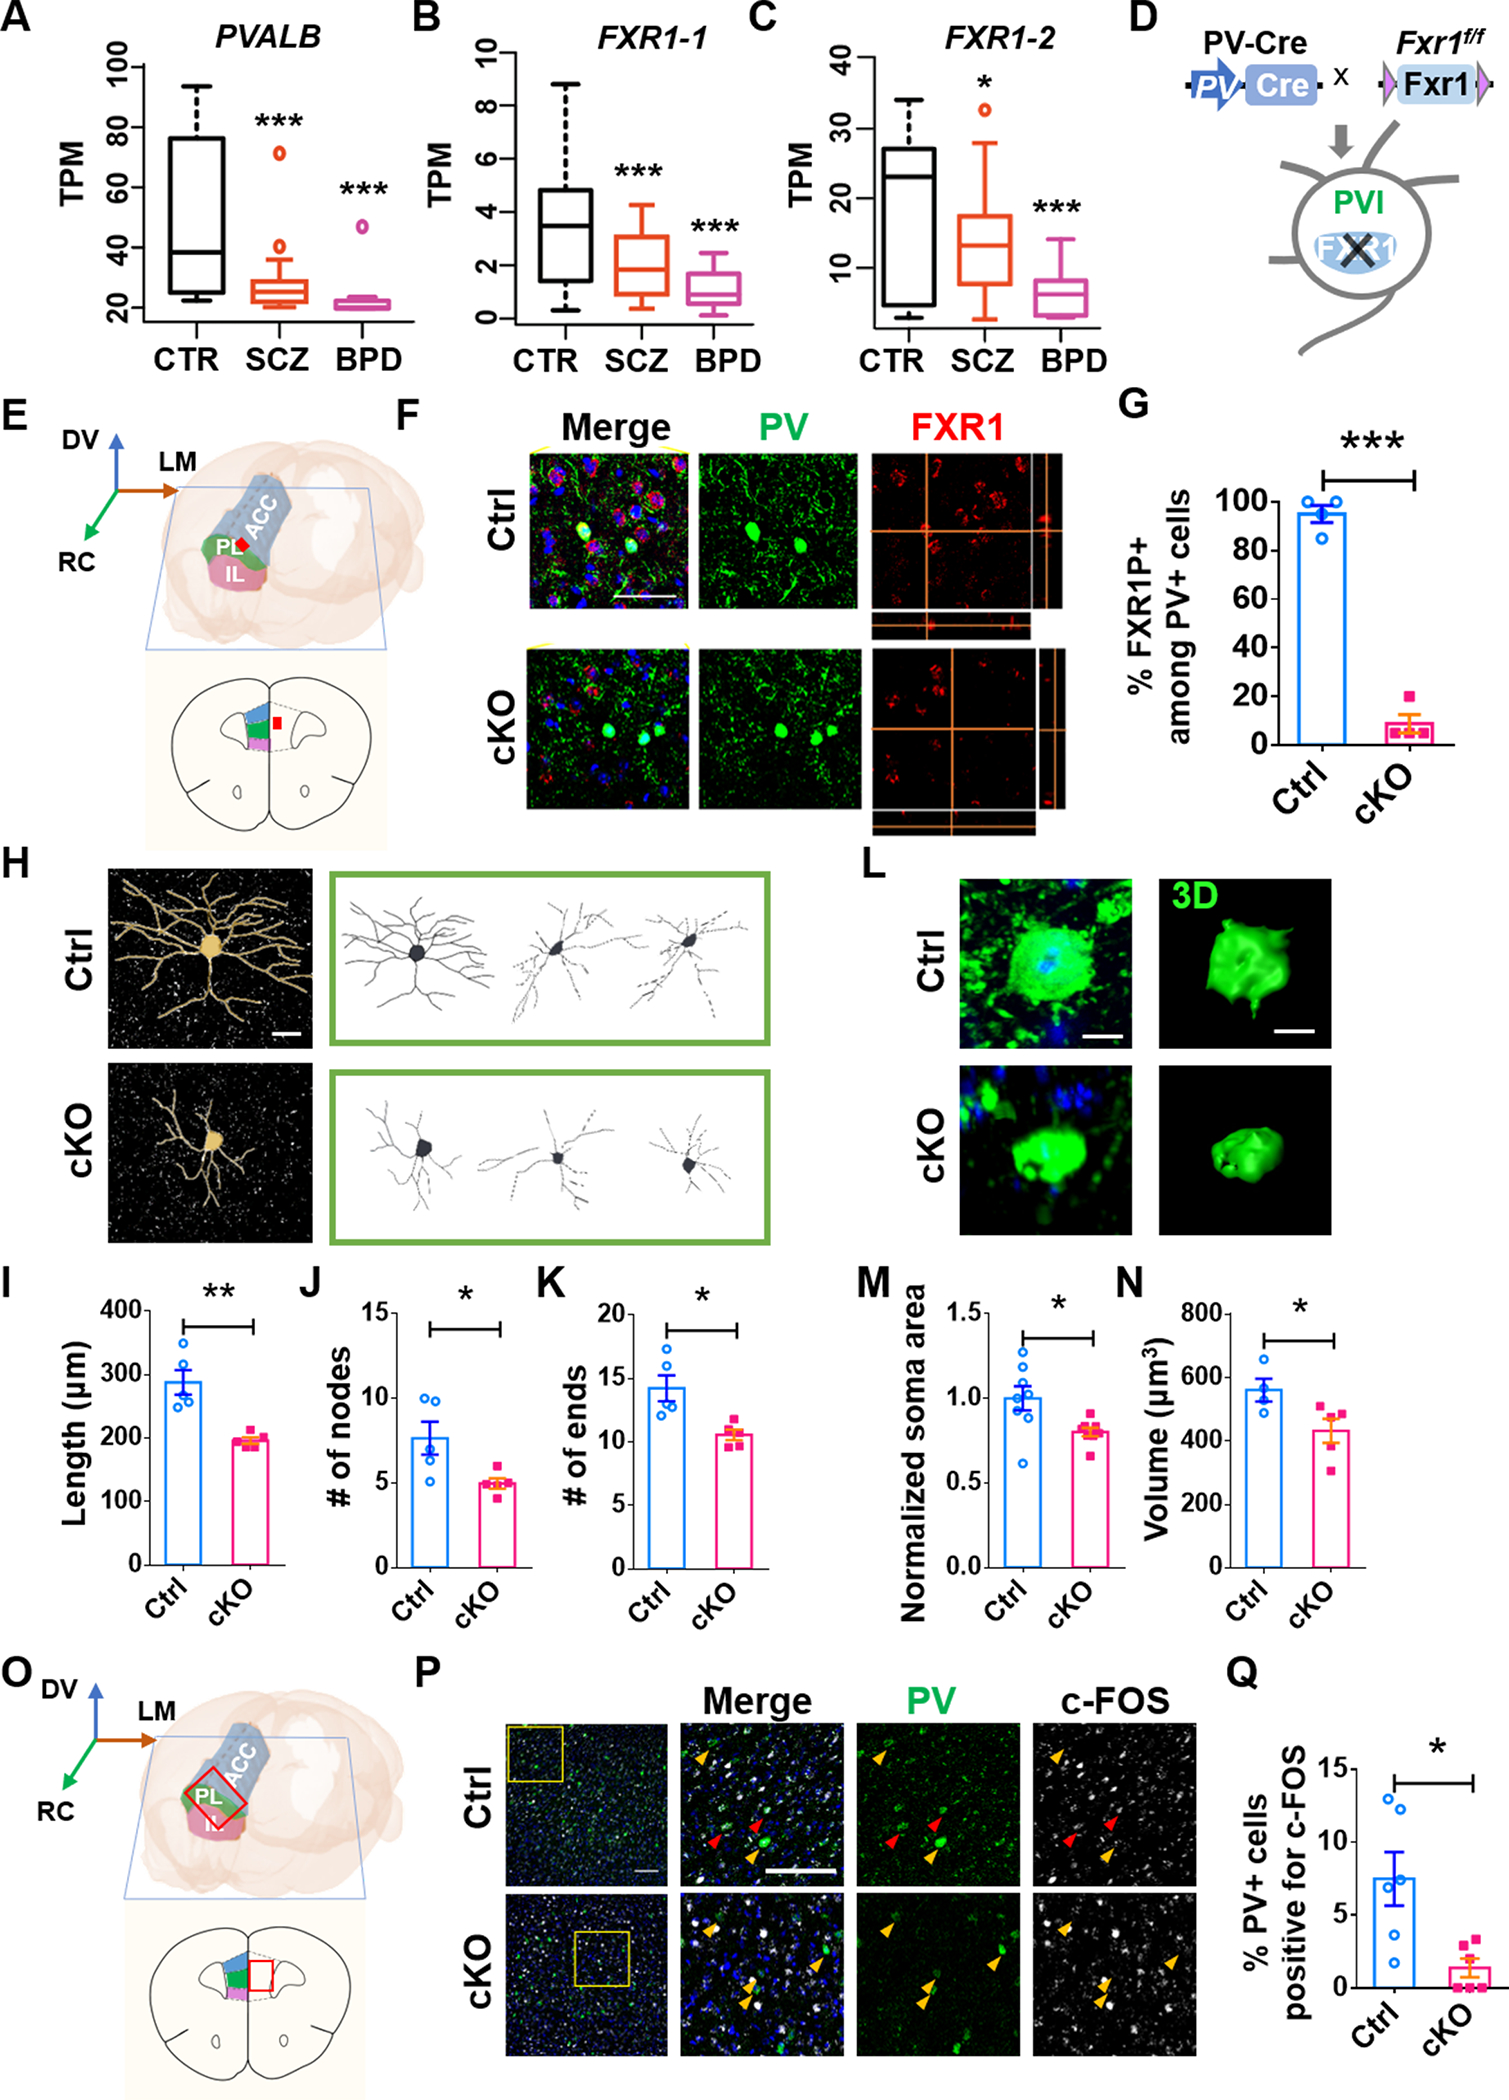
A-C Quantitative comparison of PV (A), FXR1–1 (B), FXR1–2 (C) in the top PV samples (DLPFC) in PsychENCODE from three categories: normal CTR (n=28), SCZ (n=20) and BPD (n=7). D-F FXR1-cKO mice with conditional FXR1 deletion in PVIs. D Schematic diagram showing the generation of FXR1-cKO mice. E mPFC (marked by the red dot) for analysis. F Representative confocal images of PV (green), FXR1 (red) staining of brain sections from Ctrl and FXR1-cKO mice. Scale bars: 50 μm. G Percentage of FXR1+ in PV+ cells in mPFC of FXR1-cKO and Ctrl mice. n = 4 mice for each group. H Representative confocal images and Neurolucida software-created traces of PVIs in mPFC from Ctrl and FXR1-cKO mice. Scale bar, 20 μm. I-K Quantification of length (I), nodes (J) and ends (K) of PVIs in the mPFC. n = 5 mice for each group. L-N Representative confocal images and 3D reconstruction (Scale bars: 10 μm) and quantification of soma area and 3D volume of PVIs in the mPFC. O-Q FXR1-cKO PVIs in mPFC showed reduced activity. O mPFC (marked by the red frame) for analysis. P Representative confocal images of c-FOS positive PVIs (red arrows, scale bars: 100 μm). Q Quantification of numbers of c-FOS+ PVIs. n = 6 mice for each group. In a-c, data are presented as Min to Max; In other panels, data are presented as mean ± SEM; *p < 0.05, **p < 0.01, ***p < 0.001; One-way ANOVA with Bonferroni post hoc test (A-C), Student’s two-tailed, unpaired t test (G, I-K, M, N and Q).
To determine whether FXR1 expression in PVIs is important, we crossed Fxr1-floxed and PV-Cre driver mice to obtain FXR1-cKO (Fxr1f/f;PV-Cre) mice with specific FXR1 deletion in PVIs (Fig. 1D–G). Although inhibitory neurons constitute only 20% of cortical neurons, there are diverse subtypes within this population and PVIs constitutes about 40% of all GABAergic interneurons [27]. We confirmed that FXR1 protein was expressed in somatostatin (SST)+ and vasopressin inhibitory peptide (VIP)+, but not PV+ interneurons of FXR1-cKO mice (Supplementary Fig. 1A, B). We first quantified the number of PVIs in subregions of mPFC, prelimbic cortex (PL), anterior cingulate cortex (ACC), and infralimbic cortex (IL) [30] of FXR1-cKO and control mice. We found that FXR1 deletion from PVIs did not affect either the number of PVIs or the volume of these regions within the mPFC (Supplementary Fig. 1C–E). However, the PVIs in the mPFC of FXR1-cKO mice had significantly reduced dendritic complexity including reduced length, nodes and ends (Fig. 1H–K, Supplementary Fig. 2) and soma size (Fig. 1L–N), compared to PVIs in littermate controls. Therefore, these results suggest that FXR1 deficiency in post-mitotic PVIs has limited impact on PVI survival but that FXR1 expression is important for normal morphology of PVIs in the mPFC.
Deletion of FXR1 from PVIs in the mPFC results in impaired PVI functions
Since FXR1 deletion in PVIs leads to reduced length of neuronal processes and smaller soma, we next determined whether FXR1 deficiency affects excitability and synaptic transmission of PVIs. c-FOS has been widely used as a marker for neuronal activation [31], and we found that in FXR1-cKO mice the proportion of PVIs in mPFC that were c-FOS+ was significantly lower relative to their control littermates (Fig. 1O–Q), suggesting impaired activity of PVIs in mPFC. To assess electrical properties of PVIs, we crossed mice to generate triple transgenic PV-Cre;Fxr1f/f;Ai14 (FXR1-cKO-Ai14) and littermate control PV-Cre;Ai14 (Ctrl-Ai14) mice in which 81.00 ± 6.62 (cKO) and 91.67 ± 4.33% (Ctrl) tdTomato (tdT)+ cells were PVIs (Fig. 2A, B). We performed whole-cell recordings of tdT+ PVIs in acute mPFC slices of 8-week-old animals (Fig. 2C). The frequency of action potential (AP) spikes recorded from the PVIs in the mPFC of FXR1-cKO-Ai14 mice was significantly lowered compared with those in Ctrl-Ai14 mice (Fig. 2D, E). FXR1-cKO PVIs also had increased threshold and half-width of action potential without significant change in resting membrane potential, input resistance, and membrane capacitance compared to Ctrl PVIs (Table S1). Therefore, selective deletion of FXR1 from PVIs leads to reduced neuronal excitability.
Fig. 2. FXR1 deletion in PVIs leads to impaired membrane excitability of PVIs and reduced gamma oscillation in the PFC.
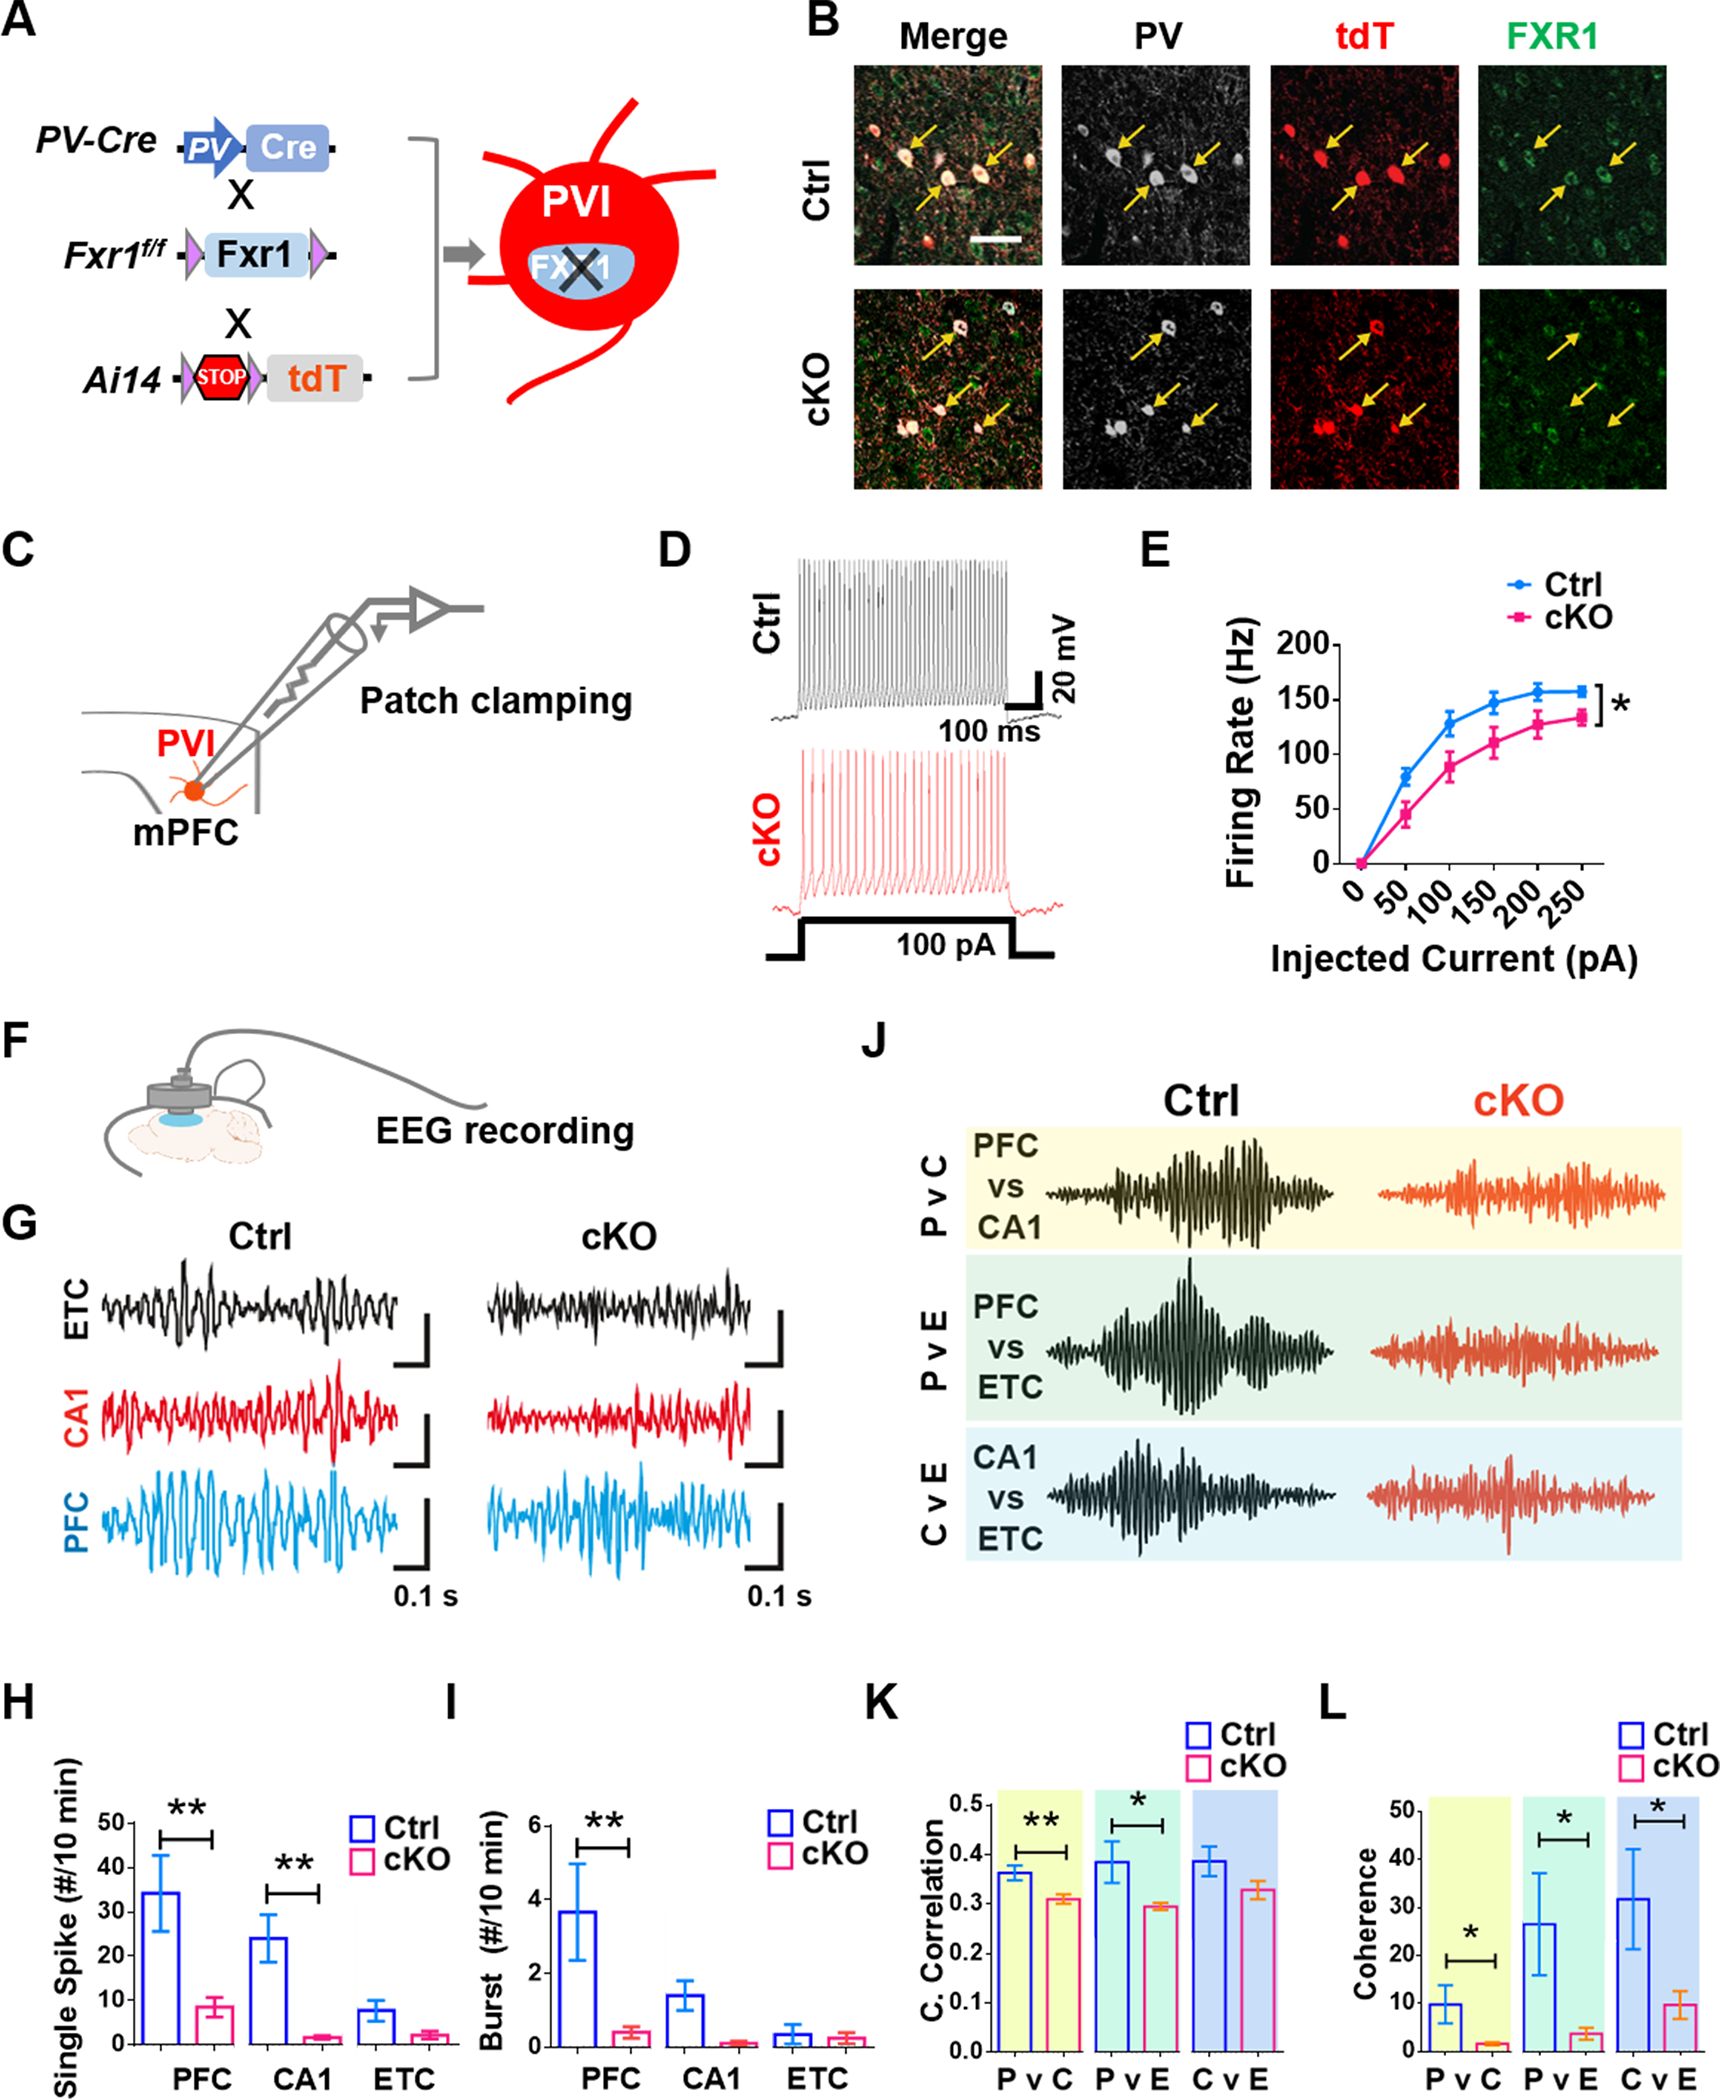
A, B FXR1-cKO-Ai14 mice with tdT+ expression in PVIs. A Schematic diagram showing the generation of FXR1-cKO-Ai14 mice. B Representative confocal images of FXR1 (white), tdT (red) and PV (green) staining of brain sections from Ctrl-Ai14 and FXR1-cKO-Ai14 mice. Scale bars: 50 μm. C-H Whole recording. FXR1-cKO PVIs in mPFC showed impaired membrane excitability (D, E). C Schematic diagram of patch clamping recording. D Representative recording trace of AP trains. E Quantification of action potential spikes upon current injections. n = 3 mice. F-L iEEG. FXR1-cKO mice showed reduced gamma oscillation in the PFC (G-I) and impaired synchronization of PFC and other regions (J-L). F Schematic diagram showing iEEG recording of prefrontal regions. G Representative EEG recording from the right entorhinal cortex (ETC), right CA1 (CA1) and right PFC (PFC). EEG recordings were bandpass-filtered (25–100Hz) to isolate gamma-band activities. Scale bars showing different amplitude and same time (0.1 s): ETC, Ctrl = 0.1 mV, KO = 1 mV; CA1, Ctrl = 0.04 mV, cKO = 0.01 mV; PFC, Ctrl = 0.08 mV, cKO = 0.008 mV. H, I Quantification of total number of spikes per 10 minutes recording period (40 ms, 600 μV) in three different regions (H) and frequency of burst (defined as the number of bursts within 10 minutes (I). J Representative gamma-band oscillations for cross-correlation analysis between ETC, CA1 and PFC. K, L Quantification of cross-correlation (K) and coherence (L) between the three brain regions. n ≥ 6 mice. All data are presented as mean ± SEM; *p < 0.05, **p < 0.01; Two-way ANOVA with Bonferroni post hoc test (E), student’s two-tailed, unpaired t test (H, I, K and L).
In the prefrontal cortex (PFC), PVIs form extensive connections with excitatory neurons and play important roles in generating gamma oscillation, known to be important for cognition and attention [32]. To assess the impacts of FXR1 deficiency in PVIs on circuit activity and function of PFC, we performed intracranial EEG (iEEG) recordings from mPFC, entorhinal cortex (ETC) and CA1 region of hippocampus of FXR1-cKO and control mice (Fig. 2F). Our iEEG recordings showed significant reduction of single iEEG spikes and bursts in the gamma-band range in PFC and CA1 of FXR1-cKO mice compared with control mice. ETC displayed lower levels of spike and burst activities and there was no difference found between FXR1-cKO and control mice (Fig. 2G–I). Additionally, we found that, compared to controls, FXR1-cKO mice exhibited significantly impaired correlation (Fig. 2J, K) and coherence (Fig. 2L) between gamma-band activities recorded from the PFC and ipsilateral CA1 (P v C) and those recorded from PFC and ETC (P v E), but only reduced coherence not correlation (Fig. 2J, L) recoded from CA1 and ETC (C v E), suggesting impaired gamma synchrony in PFC and its connected brain regions. These results suggest that FXR1 deficiency in PVIs induces impaired excitability of PVIs in the mPFC, which may lead to altered prefrontal cortical gamma-band circuit activities and synchronization with other brain regions. Together, our structural and functional analyses revealed that FXR1 plays critical roles in intrinsic properties of PVIs and circuit activities and synchronization of the PFC.
Selective FXR1 deletion from PVIs in the mPFC leads to behavioral defects
Circuit activity ultimately generates behavior. PVIs undergo rapid maturation during postnatal development coinciding with the critical period of PFC maturation and PVI activities in the PFC are directly involved in cognitive functions [33]. FXR1 has been associated with SCZ [4–7], but the causal link is lacking. Deletion of FXR1 from excitatory neurons results in enhanced learning without significant impact on other psychiatric disorders-related behaviors [22]. However, the impact of FXR1 deficiency in interneurons is unknown. We therefore decided to first assess the behavioral outcome of deleting FXR1 from PVIs throughout the central nervous system (Supplementary Fig. 3A). Both FXR1-cKO and FXR1 heterozygote knockout (Het, PV-Cre;Fxr1f/w) mice showed hyperactivity overall in an open field (OF) test but exhibited no significant change in anxiety levels as assessed by center dwelling in OF and exposed arm crossing in elevated plus maze (EPM) tests, compared to wild-type (WT) controls (Supplementary Fig. 4A–C). On the other hand, both cKO and Het mice were more manic-like [34] in a forced swimming test (FST) and had increased compulsiveness in a marble-burying (MB) test compared to WT controls (Supplementary Fig. 4C–E). Het mice and, to a lesser extent, cKO mice, exhibited impairment in spatial learning assessed by a novel location test (NLT, Supplementary Fig. 3D) but neither exhibited significant changes in objection recognition ability (NOR, Supplementary Fig. 4F). We then used two different tests to assess social behavior, a major deficit in SCZ [1]. FXR1-cKO, but not Het, mice displayed reduced preference of conspecific (S1, stranger1) to inanimate object (T, toy) in social interaction (SI) 3-chamber test, but both Het and cKO displayed reduced preference to a stranger mouse (S2, stranger2) in social novelty (SN) test (Supplementary Fig. 3E–G), suggesting either impaired social recognition or increased social anxiety towards strangers. In a “reciprocal social test (RS)” to assess interest of opposite sex, both Het and cKO male mice exhibit significant reduction in both reciprocal social interest (RSI) and novelty (RSN) towards female conspecifics (Supplementary Fig. 3H–J). Prepulse inhibition of acoustic startle (PPI) has been shown to be impaired in both SCZ patients and limited animal models [35]. We found that both cKO and Het mice exhibited significantly reduced PPI (Supplementary Fig. 3K–M). Thus, FXR1 deletion or reduction from PVIs throughout CNS leads to behavioral deficits resembling those in psychiatric disorders, including hyperactivity, manic-like behavior, increased compulsion, reduced sociability, and defective sensorimotor gating.
Since PV-Cre driver leads to FXR1 deletion throughout the brain as well as dorsal root ganglia of the spinal cord [36], we next assessed whether the behavioral deficits we have observed in FXR1-cKO mice were due to FXR1 deficiency in the PVIs within the medial PFC (mPFC), a region known to mediate hyperactivity [37], novel object/location discrimination [38], and sociability [39]. We employed the CRISPR/Cas9 gene editing to knock down FXR1 specifically in the PVIs within the mPFC. We designed 5 guide RNAs (sgRNAs) targeting various sequences in the exons of the mouse Fxr1 gene and all 5 sgRNA candidates exhibited significant effects in reducing the endogenous Fxr1 mRNA levels in Neuro2A cells, with sgRNA candidate #1 inducing the strongest down-regulation with the highest consistency (Supplementary Fig. 5). We cloned sgRNA #1 and a control sgRNA into an AAV8 vector (AAV8-sgCtrl-hSyn1-flex-mcherry). After off-target assessment, Fxr1-sgRNA (AAV-sgFxr1) and control sgRNA (AAV-sgCtrl) vectors were used to produce high titer AAV virus. Because Cas9 protein is large, we used a Rosa26-STOP-Cas9–2A-GFP mouse (cCas9) line expressing Cre-dependent Cas9 allowing for >70% indel efficiency when combined with AAV-delivered sgRNA [40]. We stereotaxically injected either AAV-sgFxr1 or control AAV-sgCtrl into the PFC of 8-weeks old PV-Cre;cCas9 double transgenic mice (Fig. 3A). Immunohistochemical analysis confirmed AAV-sgFxr1- induced knockdown of FXR1 in mPFC PVIs with high specificity and efficiency (Supplementary Fig. 6).
Fig. 3. Selective knockdown of FXR1 in PVIs within the mPFC leads to schizophrenia-like behavioral deficits.

A Specific knockdown of FXR1 in mPFC PVIs through injection of AAV expressing Fxr1 targeting guide RNA (AAV8-sgRNA-hSyn1-flex-mcherry) into the mPFC of PV-Cre;cCas9 mice. B-H Schizophrenia-like behavioral phenotypes. B No change in locomotion activity in OF test. C Impaired spatial learning ability in NLT test. D-G Sociability deficits in SI, SN, RSI and RSN. H Impaired sensory gating in PPI test. n = 14 mice. I-K Impaired activity of mPFC PVIs during reciprocal interactions. I Mice were sacrificed at 45 min after reciprocal interaction. J, K Representative confocal images (J) and quantification (K) of c-FOS+ mPFC PVIs. Scale bars: 100 μm. n = 3 mice. All data are presented as mean ± SEM; *p < 0.05, **p < 0.01, ***p < 0.001; Student’s two-tailed, unpaired t test (B-E, G and K), two-way ANOVA with Bonferroni post hoc test (F and H).
The AAV-sgFxr1-injected PV-Cre;cCas9 mice exhibited no significant difference in locomotion activity, anxiety, depression, compulsive behaviors, novel object recognition and acoustic startle response compared to AAV-sgCtrl-injected control mice (Fig. 3B, Supplementary Fig. 7). On the other hand, deletion of FXR1 in PVIs in mPFC led to impaired spatial learning (NLT, Fig 3C), similar to what we observed in FXR1-cKO mice (Supplementary Fig. 3D). More importantly, selective knockdown of FXR1 in the PVIs in the mPFC (AAV-sgFxr1-injected PV-Cre;cCas9 mice) led to impaired social recognition without significant change in preference to conspecific to inanimate object (Fig 3D, E), similar to FXR1-cKO mice (Supplementary Fig. 3F, G). In addition, the AAV-sgFxr1-injected male mice showed impaired interaction with (RSI, Fig 3F) and recognition of (RSN, Fig 3G) WT females in the reciprocal social tests, compared to AAV-sgCtrl-injected control mice. Furthermore, AAV-sgFxr1-injected mice exhibited significant impairments of PPI compared to control mice (Fig 3H). Since FXR1 deletion led to reduced PVI neuronal activities (Fig. 1O–Q), we assessed whether behavioral deficits were associated with altered PVI activities. We collected brains of animals 45 minutes after their 1-min reciprocal interaction with a stranger WT female and used c-FOS staining to test activation of mPFC PVIs during social interaction [41]. AAV-sgFxr1-injected mice had significantly reduced c-FOS+ cells among mCherry+ PVIs compared to AAV-sgCtrl-injected control mice (Fig 3I–K), suggesting impaired activation of mPFC PVIs during social interaction which might contribute to deficits of social interaction. In contrast, deletion of FXR1 in PVIs of the dorsolateral striatum (DLS), a region implicated in compulsion and habitual behaviors [42], only led to elevated compulsive behaviors in mice (Supplementary Figure 8). Therefore, selective FXR1 deletion in mPFC PVIs induced impaired spatial learning, sociability deficits, and defective sensorimotor gating.
FXR1 deficiency in PVIs leads to reduced Cav3.2 protein levels in mPFC
To identify the molecular mechanisms underlying the impacts of PVI-specific FXR1 deficiency on circuits and behaviors, we assessed PVI gene expression changes as a result of FXR1 deletion. Because PVIs form extensive connections and are sparsely located in the mPFC, we decided not to use dissected bulk tissues or sorting-isolated cells. Instead, we utilized a cell type-specific translational profiling method which allowed us to identify polyribosome-bound mRNAs specifically in PVIs without cell isolation [43]. We crossed Fxr1f/f;PV-Cre mice with RiboTag (Cre-dependent HA tagging of ribosome protein RPL22) mice [44] to generate PV-Cre;Fxr1f/f;RiboTag (FXR1-cKO-RiboTag) mice and control PV-Cre;RiboTag (Ctrl-RiboTag) mice that expressed HA-tagged RPL22 specifically in PVIs (Fig. 4A, Supplementary Fig. 9A–C). We performed translational profiling on ribosome-bound mRNAs (RiboTag-seq) of PVIs in the PFC of 6-week-old FXR1-cKO-Ribotag and Ctrl-Ribotag mice in triplicates (Fig. 4B, Table S2). We compared our dataset with published cortical neuron-type-specific enriched genes [45], and the genes identified by our RiboTaq-seq showed PVIs-specified enrichments (Supplementary Fig. 9D). Our comparison between FXR1-cKO-Ribotag and Ctrl-RiboTag yielded 23 differentially expressed (DE) genes (false discovery rate (FDR)-adjusted P < 0.05) (Supplementary Fig. 9E). These DE genes were enriched in cognition, cellular transmission, and RNA binding. (Supplementary Fig. 9F, Table S3). We compared our 23 DE genes with PsychENCODE consortium’s Cross-Disorder Differentially expressed (DEX) Genes [9] containing genes differentially expressed in patients with SCZ, BPD, and autism spectrum disorder (ASD). We found that 6 DE genes, Fxr1, Cacna1h, Slc7a3, Mybpc1, Arc, and Dnahc6, were related to SCZ (FDR- adjusted P < 0.05) (Fig. 4C), 2 DE genes, Cacna1h and Slc7a3, were also related to BD, and 1 DE gene, Fxr1, was related to ASD (Table S4). Among these genes, Cacna1h ranked the highest for association with SCZ and BD and ranked the second highest for association with ASD following Fxr1 (Table S3). We quantified the expression levels of CACNA1H (CACNA1H-1: ENST00000348261; CACNA1H-2: ENST00000564927) protein-coding transcripts in the same PsychENCODE DLPFC samples of CTR, SCZ, and BPD patients as shown in Fig. 1A–C. We found that both CACNA1H-1 and −2 exhibited significantly reduced levels in BPD patients compared with CTR with moderate significance (Supplementary Fig. 10A, B). Notably, both CACNA1H transcripts showed positive correlation to both FXR1 transcripts in both normal CTR (Fig. 4D) and SCZ patients (Fig. 4E), and CACNA1H-1 also showed positive correlation to FXR1 in BPD patients (Supplementary Fig. 10C). Together, these data suggest that Cacna1h is a noteworthy FXR1 translational target in PFC PVIs in psychiatric disorders.
Fig. 4. FXR1 deficiency leads to reduced Cav3.2 levels in PVIs.
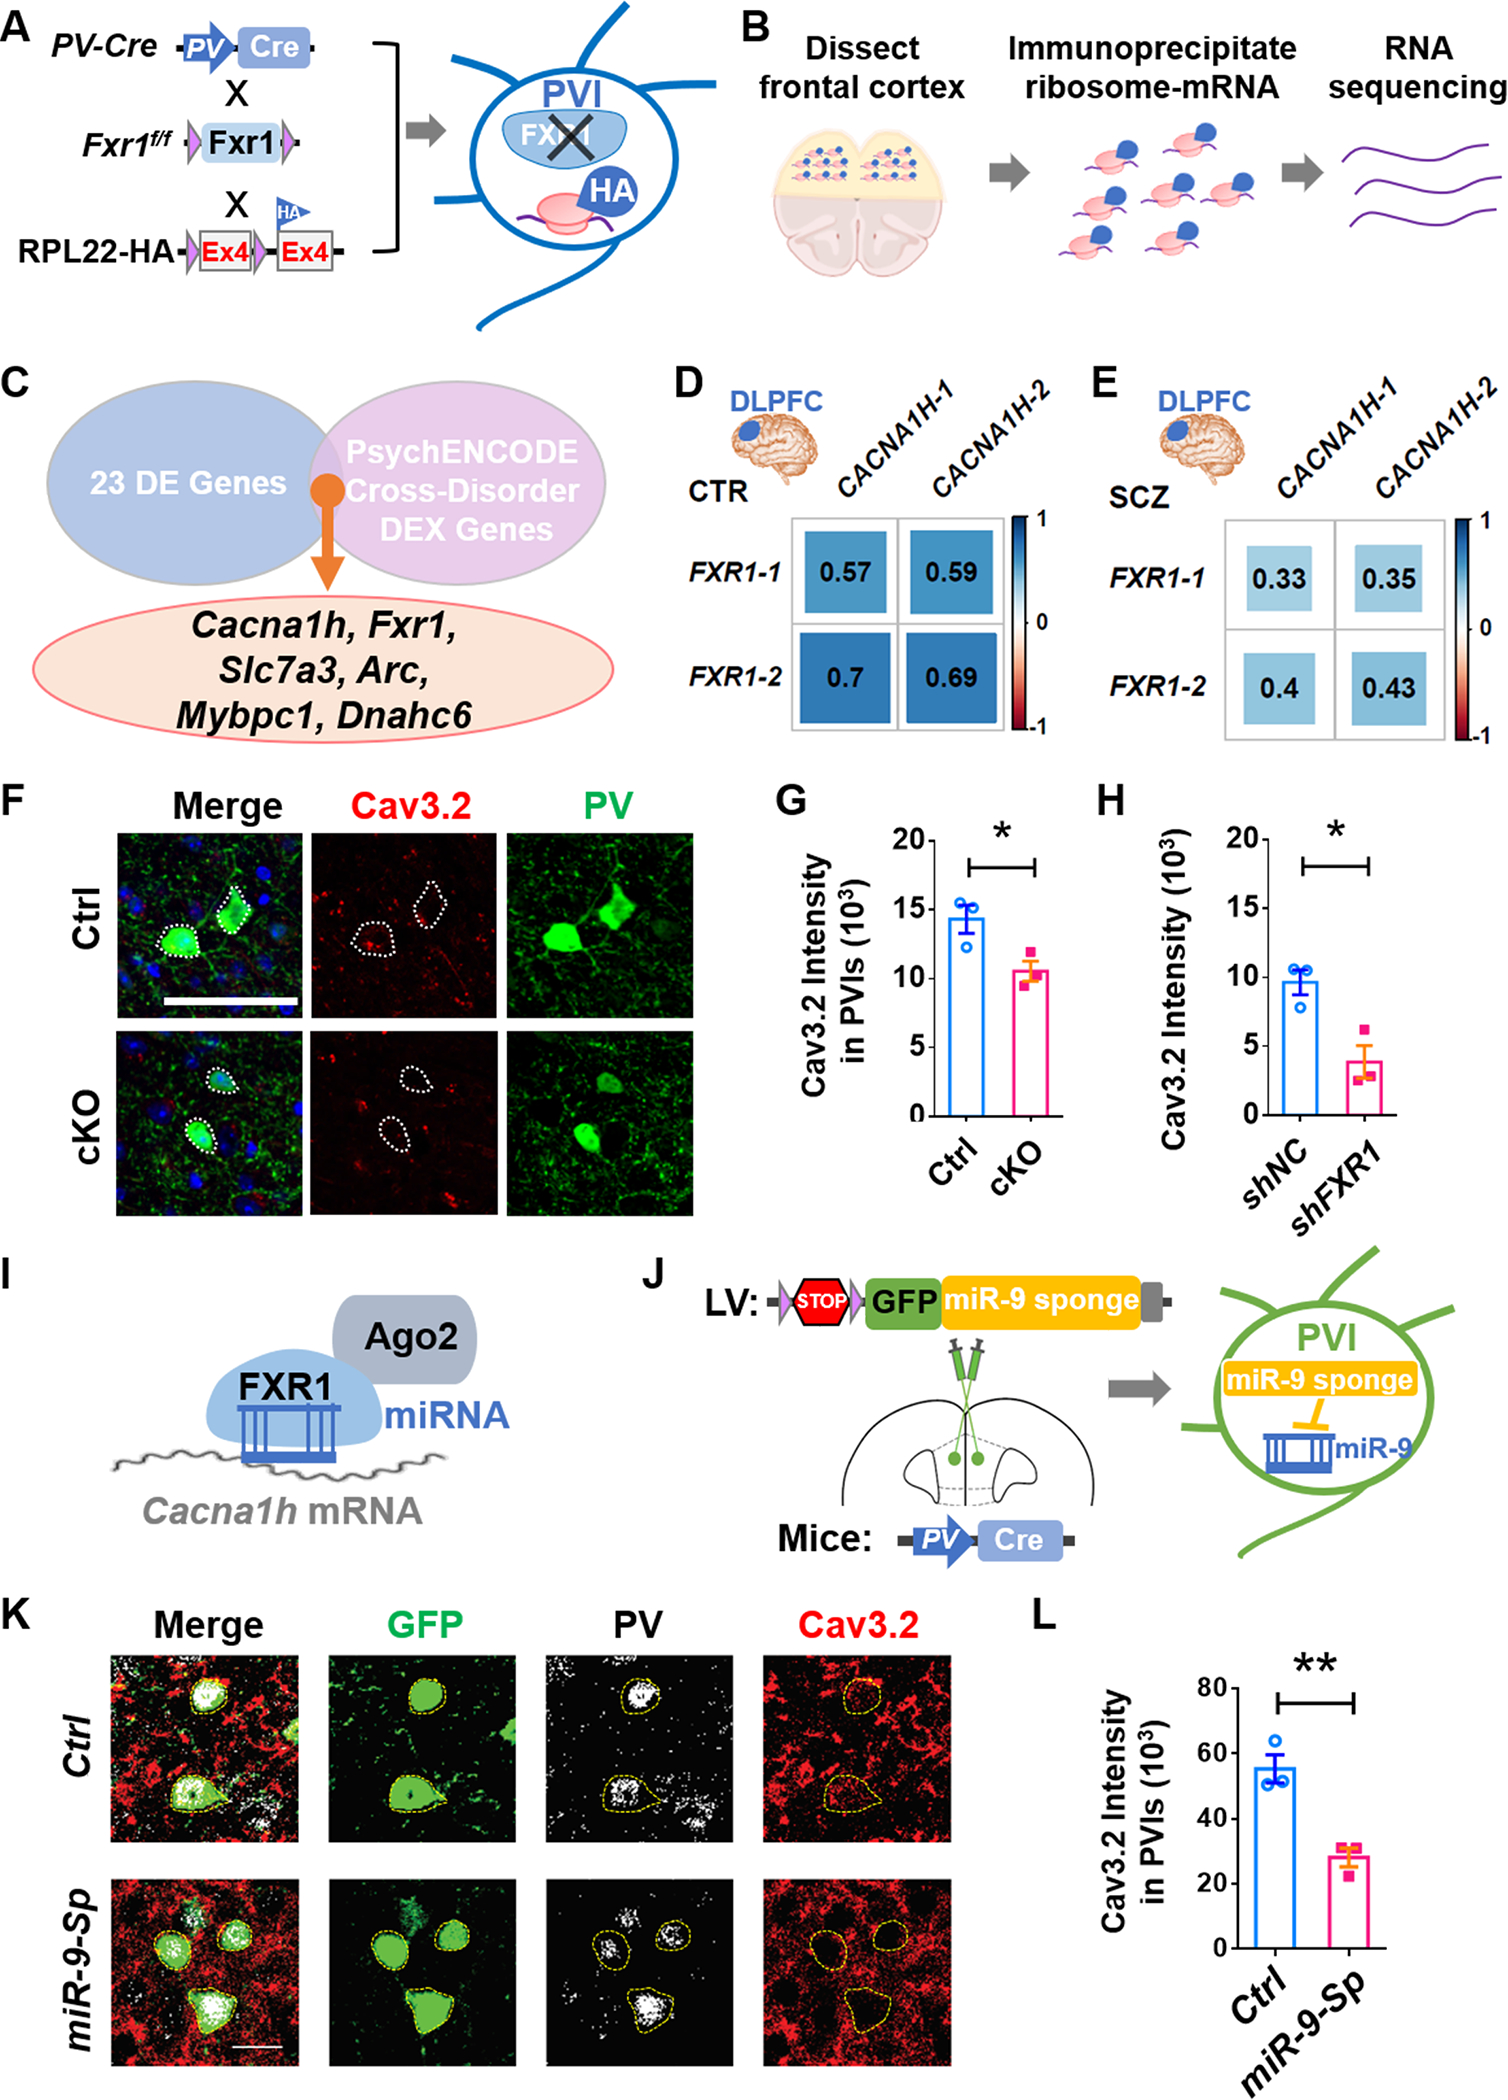
A, B Generation of FXR1-cKO-Ribotag mice expressing HA-tagged ribosomal protein specifically in PVIs and schematic diagram showing Ribotag-seq. C 6 DE genes (Fxr1, Cacna1h, Slc7a3, Mybpc1, Arc, Dnahc6) were identified among PsychENCODE consortium’s Cross-Disorder Differentially expressed (DEX) Genes. D, E Pearson correlation coefficients of FXR1 isoforms and CACNA1H isoforms of the PsychENCODE DLPFC samples with top 5% PV levels in CTR (n=28) and SCZ (n=20). F, G Representative confocal images and quantifications of Cav3.2 intensity in PVIs in mPFC. n = 3 mice. H Quantifications of Cav3.2 intensity in human inhibitory neurons infected with lentivirus-shFXR1 or shNC. n = 3 differentiations. I Schematic illustration of model for FXR1-AGO2-miRNA promoting translation of Cav3.2. J Inhibition of miR-9 in mPFC PVIs through injection of lenti-LSL-miR-9-Sp in the mPFC of PV-Cre mice. K, L Representative confocal images and quantifications of Cav3.2 intensity in GFP+ PVIs in mPFC. n = 3 mice. All data are presented as mean ± SEM; *p < 0.05, **p < 0.01, ***p < 0.001; Student’s two-tailed, unpaired t test (G, H, and L).
We next assessed the levels of proteins encoded by these top ranked DE genes. The protein levels of MybPC1 (Mybpc1), ARC (Arc), DNAHC6 (Dnahc6) and SLC7A3 (Slc7a3) showed no significant difference in PVIs in the mPFC of FXR1-cKO mice compared with those of control mice (Supplementary Fig. 10D–G). Consistent with reduced ribosome-binding of Cacna1h mRNA, Cav3.2 protein (protein product of Cacna1h) exhibited reduced expression level in FXR1-deleted PVIs but not in PV-negative neurons in the mPFC (Fig. 4F, G, Supplementary Fig. 11). We also found that Cav3.2 was reduced in FXR1-deficient interneurons isolated from mouse MGE (Supplementary Fig. 12). To determine whether FXR1 regulates Cav3.2 levels in human neurons, we differentiated H9 human embryonic stem cells into ventral inhibitory neurons and knocked down FXR1 using with lentivirus expressing shRNA (shFXR1) (Supplementary Fig. 13A, B). We found FXR1-deficient (shFXR1) inhibitory neurons showed significant reduction of Cav3.2 protein levels compared to control lentivirus (shNC)-infected neurons (Fig. 4H, Supplementary Fig. 13C, D). Therefore, these results suggest that FXR1 deficiency leads to reduced levels of Cav3.2 proteins in inhibitory interneurons in both mice and humans.
FXRs are generally regarded as translational repressors [46]. We next determined how FXR1 deficiency leads to reduced Cav3.2 protein levels. It has been shown that FXR1 can promote protein translation of specific mRNAs through binding AGO2 and microRNA targeting the mRNA transcript [47]. We hypothesized that FXR1 may promote translation of Cacna1h mRNA through interaction with AGO2 and microRNA(s) (Fig. 4I). Because the limited number of MGE-derived neurons prohibit in-depth mechanistic investigation, we resorted to other cell models. Interestingly, knocking down FXR1 in primary cortical neurons had no significant impact on Cav3.2 levels (Supplementary Fig. 14), suggesting that FXR1 may not regulate Cav3.2 levels in excitatory neurons. On the other hand, acute knockdown of either FXR1 or AGO2 in Neuro2A cells using shFxr1 or shAgo2 led to reduced Cav3.2 protein levels (Supplementary Fig. 15A, B). We therefore used Neuro2A cells as an experimental model to explore the mechanism underlying FXR1 regulation of Cav3.2. Using RNA immunoprecipitation followed by quantitative PCR (RNA-IP-qPCR), we found that FXR1 indeed bound Cacna1h mRNA and the binding was partially abolished by acute knockdown of either FXR1 (shFxr1) or AGO2 (shAgo2) (Supplementary Fig. 15C–E). To determine which miRNAs may facilitate FXR1 regulation of Cav3.2, we generated a list of miRNAs predicted to target Cacna1h and compared them with published PVI-specific AGO2-bound miRNAs [48]. We found that miR-9 and miR-129 were the top two most abundant miRNAs in PVIs that were predicted to target Cacna1h (Table S5). We then transfected Neuro2A cells with inhibitors of either miR-9 (anti-miR9) or miR-129 (anti-miR129) and found that inhibition of either microRNA led to reduced Cav3.2 protein levels, compared to control anti-miR (Supplementary Fig. 15F, G). However, inhibition of miR-9, but not miR-129 also impaired binding of FXR1 to Cacna1h mRNA as assessed by RNA-IP-qPCR (Supplementary Fig. 15H, I), suggesting that miR-9 is needed in FXR1 regulation of Cav3.2. Since miR-9 pre-miRNA levels did not change in FXR1-deficient cells (Supplementary Fig. 16A), FXR1 may not regulate miR-9 expression at the transcriptional levels.
To validate that miR-9 is needed for FXR1 regulation of Cav3.2 in PVIs of mPFC, we blocked miR-9 actions in PVIs using lentivirus expressing miR-9 sponge (miR-9-Sp) in a Cre-dependent manner (Supplementary Fig. 16B, C). We found that Cav3.2 protein levels were significantly reduced in PVIs expressing miR-9-Sp compared to control PVIs in the mPFC (Fig. 4K, L). These data suggest that FXR1, through interaction with AGO2 and miR-9, enhances the expression of Cav3.2 protein in PVIs of mPFC.
Selective inhibition of Cav3.2 in mPFC PVIs phenocopies behavioral deficits of mice with FXR1 deletion from mPFC PVIs.
T-type Ca2+ channels (Cav3.1, Cav3.2, Cav3.3) have been shown to support GABAergic synaptic transmission in PFC [49]. However, the role of Cav3.2 in PVIs in the mPFC is unknown. Since neither a specific inhibitor nor a specific activator for Cav3.2 is available, we utilized a C-terminal Cav3.2 peptide (Cav3.2ct) that has been shown to specifically block the function of Cav3.2 channels to elucidate the impact of reduced Cav3.2 levels in PFC [50]. We cloned Cav3.2ct into a lentiviral vector for Cre-dependent expression (lenti-LSL-Cav3.2ct-GFP) and injected this lentivirus (or control lenti-LSL-GFP) into the mPFC of 6–8-week-old PV-Cre mice (Fig. 5A). Blocking Cav3.2 function in the mPFC PVIs led to hyperactivity (Fig. 5B), reduced spatial learning (Fig. 5C), impaired social interaction (Fig. 5D, F) and social recognition (Fig. 5E, G), reduced acoustic sensory gating (Fig. 5H, Supplementary Fig. 17A), without effect on anxiety (Supplementary Fig. 17B), similar to the behavioral changes resulting from FXR1 deletion in PVIs (Figs 3, Supplementary Fig. 3, 4, 7). We also assessed neuronal activities of PVIs in the mPFC immediately after mice were subjected to social interactions and found that, in Cav3.2ct-injected mice, there was a reduced proportion of c-FOS-positive PVIs compared to that in control GFP-injected mice (Supplementary Fig. 17C, D). Therefore, these results indicate that reduction in either FXR1 or Cav3.2 levels in mPFC PVIs lead to similar behavioral deficits and supports our hypothesis that reduced PVI Cav3.2 levels may contribute to phenotypes induced by FXR1 deletion in mPFC PVIs.
Fig. 5. Targeted manipulations of Cav3.2 PVIs of the mPFC directly impact behaviors.
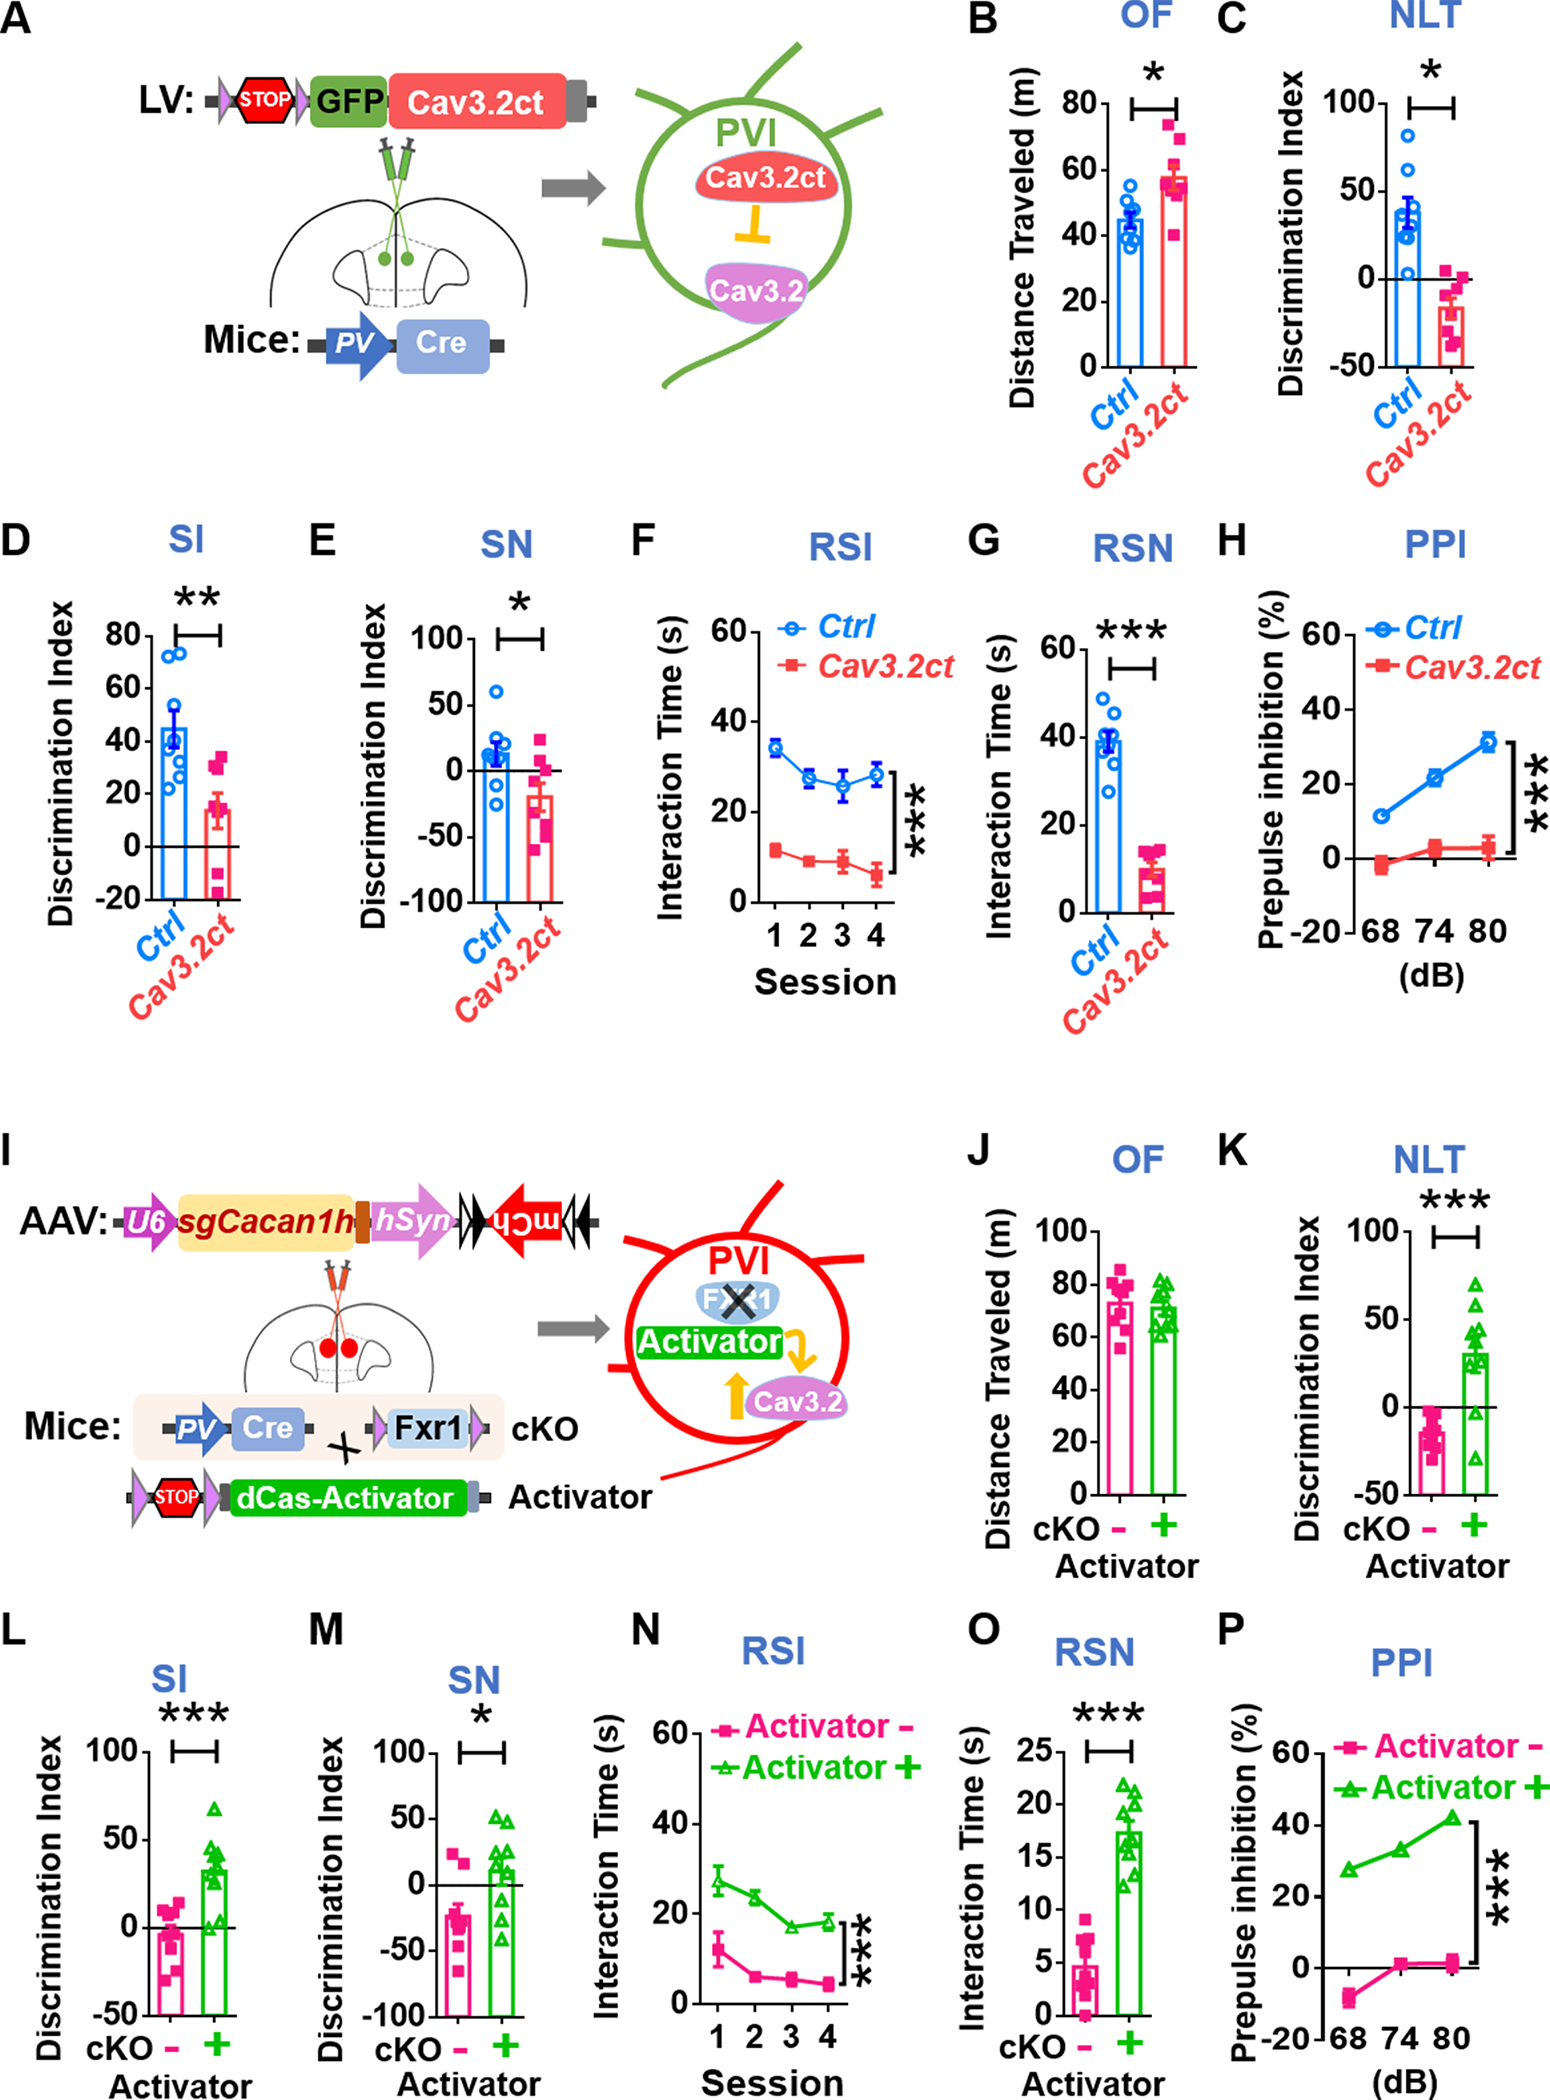
A Specific inhibition of Cav3.2 in mPFC PVIs. Stereotaxic injection of lentivirus expressing Cre-dependent Cav3.2 inhibitory peptide (lentivirus-LSL-Cav3.2ct) into mPFC of PV-Cre mice. B-H SCZ-like behavioral phenotypes. B Increased locomotion activity in OF test. C Impaired spatial learning ability in NLT test. D-G Sociability deficits in SI, SN, RSI and RSN. H Impaired sensory gating in PPI test. n = 8 mice. I Specific activation of Cacna1h transcription in FXR1-cKO PVIs in the mPFC. Achievement of activation of Cav3.2 in mPFC FXR1-cKO PVIs through generation of FXR1-cKO; dCas9 activator mice with PVI-specific dCas9-SPH activator expression and stereotaxic injection of AAV expressing Cacna1h targeting guide RNA (AAV8-sgCacna1h-hSyn1-flex-mcherry) into the mPFC. J-P Rescue of SCZ-like behavioral deficits. J Hyper-activity is not rescued in OF test. K Improved spatial learning ability in NLT test. L-O Rescue of sociability deficits in SI, SN, RSI and RSN. P Rescue of impaired sensory gating in PPI test. n = 9 mice. All data are presented as mean ± SEM; Het: #p < 0.05, ##p < 0.01, ###p < 0.001; cKO: *p < 0.05, **p < 0.01, ***p < 0.001; Student’s two-tailed, unpaired t test (B-E, G, J-M, O), two-way ANOVA with Bonferroni post hoc test (F, H, N and P).
Selective activation of Cacnah1 transcription in PVIs of mPFC rescues behavioral deficits of FXR1-cKO mice
Next, we asked whether increased Cav3.2 expression levels could rescue impaired PVI morphology and behavior deficits of FXR1-deficient mice. Cav3.2 is a large protein (~260KDa), making it difficult for gene delivery. In addition, FXR1 does not seem to regulate Cav3.2 in excitatory neurons (Supplementary Fig. 14). We therefore employed a recently generated Cre-dependent dCas9-Activator mice to achieve transcriptional activation of endogenous Cacna1h gene specifically in PVIs within the mPFC. We crossed Fxr1f/f;PV-Cre mice with Cre-dependent dCas9-Activator mice [51] to generate PV-Cre;Fxr1f/f; dCas9-Activator (FXR1-cKO;Activator+) triple transgenic mice that expressed the fusion protein dCas9-Activator (inactive Cas9 and a transcriptional activator) specifically in FXR1-cKO PVIs. The FXR1-cKO without expression of dCas9-Activator littermates (FXR1-cKO;Activator-) were used as controls. We designed 5 sgRNAs targeting the proximal promoter, between –281bp and +5 bp relative to transcription start site (TSS), of the mouse Cacna1h gene. The sgRNA candidate #1 exhibited the strongest effects in elevating the endogenous Cacna1h mRNA levels in Neuro2A cells (Supplementary Fig. 18A). We cloned sgRNA#1 into an AAV8 vector to generate AAV-sgCacna1h (AAV8-sgCacna1h-hSyn1-flex-mcherry) and stereotaxically injected AAV-sgCacna1h into the mPFC of 8-weeks old both FXR1-cKO;Activator+ and control FXR1-cKO;Activator- mice (Fig. 5I). The mCherry+ PVIs in the mPFC of FXR1-cKO;Activator+ mice exhibited significant increased dendritic length, nodes and ends compared to those in FXR1-cKO;Activator- mice (Supplementary Fig. 18B–E), suggesting rescue effects through elevated expression of Cav3.2. We then assessed the behaviors of these mice. There was no significant difference in locomotion activity (Fig. 5J) and anxiety level (Supplementary Fig. 18F) between experimental groups. On the other hand, compared to controls, FXR1-cKO;Activator+ mice showed significant improvement in spatial learning (Fig. 5K), sociability (Fig. 5L–O) and acoustic sensory gating (Fig. 5P, Supplementary Fig. 18G). Hence, elevating Cacna1h gene expression levels in the PVIs of mPFC rescues behavioral deficits of FXR1-cKO mice. These data provide a strong support for the important roles of FXR1 in maintaining Cav3.2 expression levels in PVIs of PFC and its implication for PFC-mediated behaviors, suggesting that targeting Cav3.2 may be a potential therapeutic avenue for treatment of psychiatric behaviors.
Increasing activity of PVIs rescued behavioral abnormalities in mice with FXR1 deficiency in PVIs
Although our data suggest that activation Cav3.2 in PVIs might be a potential therapeutic method for treating psychiatric disorders, gene therapy in humans is still in its infancy, and a Cav3.2-specific chemical activator is not yet available. We therefore searched for another non-invasive method that might rescue the behavioral deficits of FXR1-cKO mice. Visual stimulation by light flicker at 40 Hz drives gamma oscillations non-invasively in prefrontal cortex in addition to visual cortex [52]. We treated the adult FXR1-cKO mice with chronic 1-hour-daily light flicker at 40 Hz and investigated the therapeutic effects of gamma entrainment on the behavioral phenotypes of FXR1-cKO mice (Supplementary Fig. 19A). c-FOS immunostaining showed an increase of c-FOS positive PVIs in the mPFC of both FXR1-cKO and control mice after light treatment (Supplementary Fig. 19B, C) compared to naïve ones (Fig. 1L, N), and the gamma light treatment dramatically rescued impairment of neuronal activity of FXR1-cKO PVI, as indicated by increasing c-FOS+ PVIs (Supplementary Fig. 19B, C). After chronic visual gamma stimuli, the adult FXR1-cKO showed normal anxiety level (Supplementary Fig. 19d, e) and objective learning ability (Supplementary Fig. 19F). Noticeably, behavioral abnormities of FXR1-cKO mice such as compulsive phenotypes (Supplementary Fig. 19G), less depression (Supplementary Figure 19H), impaired spatial learning(Supplementary Figure 19I), impaired sociability (Supplementary Fig. 19J–M) and acoustic sensory gating (Supplementary Fig. 19N, O) were rescued, though FXR1-cKO mice remained hyperactive compared to the control littermates (Supplementary Fig. 19P).
Together, these data support an important role of FXR1 in positively regulating translation of Cav3.2 protein in PVIs, which enhances PVI neuronal activity and mPFC-mediated behaviors, whereas FXR1 deficiency in mPFC PVIs leads to reduced Cav3.2 protein levels, leading to morphological and functional deficits of PVIs, impaired circuit activity of mPFC, and schizophrenia-like behavior deficits (Supplementary Fig. 20).
Discussion
Although genetic advances have identified novel loci and genes associated with psychiatric disorders and provide new opportunities for understanding their pathogenesis and for developing novel treatments, the contribution of these genes to brain functions and mental illness remains unstudied. Our cell type-specific study, by tackling one of these newly identified SCZ risk genes, FXR1, in SCZ relevant PVIs, represents a first step towards understanding the functional impact of these genes in SCZ. In addition, we have unveiled previously unknown functions of FXR1 and Cacna1h/Cav3.2 in brain homeostasis and uncovered a new regulatory mechanism of PVIs important for PVI excitability, synaptic plasticity, and circuit function.
Our study defines the function of FXR1 in the brain, which has been largely unexplored. Although FXR1 is not known to directly cause diseases aside from cancer, new evidence supports important roles of this protein in mental health [46]. A SNP associated with higher FXR1 expression levels in human DLPFC correlates with better mood stability in both normal human population [20] and in patients with mood disorders [53]. In addition, analysis of 22 consanguineous Pakistani families with autosome recessive intellectual disability has identified a damaging mutation in FXR1 [54]. FXR1 is a mutation-intolerant gene in humans (pLI=1.0). Interestingly, it has been shown that mutation-intolerant genes capture much of the rare variant architecture of neurodevelopmental disorders, intellectual disability, and SCZ [7]. Past studies of human postmortem brains have not detected changes in FXR1 transcript levels in SCZ or BPD [9, 10], possibly due to the fact that the brain tissues analyzed contain mostly (>80%) excitatory neurons and other cell types. In addition, FXR1 has multiple splice isoforms and only some are expressed in the brain (Ensemble). There is no published transcriptomic data of human PVIs and single cell RNA-seq of human postmortem brains has limited depth for gene coverage. We therefore selected control and SCZ individuals that have the highest PVALB mRNA levels in DLPFC (top 5%) and found that the levels of the top two BA9-enriched FXR1 transcripts showed down regulation in both SCZ and BPD populations. To further assess the potential impact of reduced expression, rather than complete deletion, of FXR1, we analyzed behaviors of heterozygous mice (PV-Cre;Fxr1f/w). Indeed, we found that heterozygous reduction of FXR1 in PVIs led to behavioral deficits, similar to homozygous FXR1-cKO mice. Hence, although association does not mean causation, the high levels of expression of FXR1 in the brain, its ability to regulate many important genes, and neurobehavioral consequences of ablation and reduction of this gene, make it important to understand the functions of FXR1 in the brain.
Our cell-specific analyses also provide new insight into both the function and the regulatory mechanism of FXR1 in inhibitory neurons, which had not been explored previously. A previous study showed that FXR1 deletion specifically from forebrain of mature excitatory neurons using CamK2a-Cre had no impact on anxiety but led to enhanced learning [22]. Our studies using both homozygous and heterozygous deletion of FXR1 from PVIs suggest that the levels of FXR1 are important for PVIs (Supplementary Fig. 20). These observations illustrate critical roles of PVIs in the brain and suggest a more important role of FXR1 in PVIs than in excitatory neurons. Interestingly, PsychENCODE transcriptomic data show that FXR1 mRNA is expressed highly in interneurons during human prenatal development [12]. Furthermore, a CLIP-seq study of bulk postmortem human brain tissue has identified a number of FXR1-bound mRNA targets, but failed to identify CACNA1H [55], further supporting the importance of cell-type-specific analysis. Future cell-type-specific and circuit-specific studies to further dissect FXR1 function in other types of neurons, especially other types of inhibitory neurons, in different brain regions will be important to a thorough understanding of the function of FXR1. Our cCas9 combined with AAV injection method is proven to be effective in carrying out some of these analyses.
The RNA targets of FXR1 in the brain remain unclear. FXR1 exhibits high homology with FMRP and FXR2P [56]. The only published genome-wide FXR1 binding analysis, using HA-tagged FXRs expressed in HEK293 cells, shows that FXR1 and FMRP share >95% of their targets [57]. However other studies suggest that FXRs may have distinct functions and mechanisms of action [58]. In addition, FXR1 has a nucleolar localization signal which is absent in FMRP, therefore FXR1 may have a direct role in ribosome biogenesis [46]. Furthermore, mammalian FXR1, but not FMRP, interacts directly with microRNA pathways and such interactions can either promote or reduce RNA stabilities (for example [59, 60]), as well as enhance translation through interaction with AGO2 and microRNAs [47]. In fact, while FMRP deficiency has a minimal impact on mRNA levels [61, 62], FXR1 deficiency leads transcriptomic changes in C2C12 myoblast cell lines [63]. Here we found that in PVIs, FXR1 promoted the protein levels of Cav3.2 through its interaction with AGO2 and miR-9, without affecting Cacna1h mRNA levels. Whether this AGO2/miRNA interaction is a common mechanism or specific for FXR1 action will be an interesting area to pursue. Interesting, we found that FXR1 deficiency did not affect CAV3.2 levels in excitatory neurons. In fact, Tran et al used CLIP-seq to interrogate FXR1-bound mRNAs in postmortem human cortical tissues and found only a minor peak in the 5’ end of CACNA1H [55]. Since cortical tissue consists of mainly excitatory neurons, the weak signal suggests that FXR1 may not bind and regulate CACNA1H in the excitatory neurons. Our results support the notion that neuronal RNA binding proteins such as FXR1 likely have different target genes in different cell types and underscore the importance of cell-type-specific investigation of gene function.
Noticeably, compared to FXR1 knockdown in mPFC PVIs, Cav3.2 dysfunction led to more severe behavioral deficits, including impaired social preference to conspecific and hyperactivity, in addition to impaired social recognition, spatial learning and sensory gating (Supplementary Fig. 20). These findings suggest a critical role of Cav3.2 in prefrontal functions. Cav3.2 is a T-type Ca channel 3.2 (Cav3.2) that has an important role in regulating neuronal excitability. Similar to FXR1, CACNA1H has been associated with psychiatric disorders and autism [64]. Gain-of-function mutations in the CACNA1H gene have been associated with human childhood absence epilepsy, the most common form of pediatric epilepsy [64]. Loss of function mutations for Cav3.2 have not been shown in humans but mice with deleted Cav3.2 showed increased anxiety and impaired memory [65]. Cav3.2 has been shown to be widely expressed in neurons of the central nervous system, including cortical pyramidal neurons, hippocampal neurons, cerebellar Purkinje cells, and lamina II neurons of the spinal cord [66]. Although Cav3.2 is involved in GABAergic synapses [50], the expression of Cav3.2 in inhibitory neurons such as PVIs has not been evaluated previously.
Therefore, our study in PVIs unveils a previously unknown function of Cav3.2 as well. To study the function of Cav3.2, we searched for its specific inhibitors and activators. Although several molecules including inorganic ions (e.g. nickel, zinc), peptide toxins (e.g. spider toxin, monocyte chemoattractant protein-1) and small organic molecules (e.g. diuretic amiloride), as well as several antioxidants, have been shown to inhibit the activities of Cav including Cav3.2 [65], these molecules lack specificity. Our data using a Cav3.2 inhibitory peptide demonstrate that reduced Cav3.2 function in PVIs leads to detrimental behavioral deficits, suggesting that activation of Cav3.2 might be a therapeutic means for treating certain behavioral disorders. Given the emerging roles of Cav3.2 in brain disorders, developing Cav3.2-specific small molecule activators will be needed.
Reduced gamma oscillations (20–50Hz) in the frontal cortex have been found in a number of brain disorders, including SCZ and Alzheimer’s Disease [29, 67]. Iaccarino et al first demonstrated that visual stimulation by light flicker at 40 Hz enhances gamma oscillations in both PFC and visual cortex resulting in attenuation of pathology in a mouse model of Alzheimer’s disease [67]. Since then, 40-Hz light flicker has been shown to ameliorate deficits in several other disease models, including ethanol exposure [68], sleep disturbance [69], cerebral ischemia [70] and neuroinflammation [71]. Recently, multi-sensory treatment to induce gamma oscillations was developed to improve cognitive function in Alzheimer’s disease [52]. Our study demonstrates the exciting promise of similar non-invasive treatment for psychiatric disorders. Further studies are needed to determine the length and frequency of treatment required to achieve long-term effects, developmental ages optimal for the treatment, and efficacy of multisensory stimulations for SCZ.
Materials and Methods
Mice and animal husbandry
We performed all procedures involving live mice in accordance with the NIH Guide for the Care and Use of Laboratory Animals and the protocols approved by the University of Wisconsin-Madison Animal Care and Use Committee. We generated Fxr1f/f;PV-Cre mice (simplified as FXR1-cKO) by crossing FXR1P-floxed Fxr1f/f [16, 72] and PV-Cre mice [36] (JAX stock # 017320). PV-Cre;Fxr1f/f;Ai14 (FXR1-cKO-Ai14, cKO-Ai14) mice and control PV-Cre;Ai14 (Ctrl-Ai14) mice by crossing Fxr1f/f;PV-Cre and Fxr1f/f;Ai14 mice which were generated by crossing Fxr1f/f [16, 72] mice and Gt(ROSA)26Sortm14(tdTomato)Hze reporter (tdT, Ai14) [73] mice (JAX stock # 007914). PV-Cre;Fxr1f/f;Ribotag (FXR1-cKO-Ribotag, cKO-Ribotag) mice and control PV-Cre; Ribotag (Ctrl-Ribotag) mice by crossing Fxr1f/f;PV-Cre and Fxr1f/f;Ribotag mice which were got from crossing Fxr1f/f [16, 72] mice and RPL22-HA reporter (Ribotag) mice [44] (JAX stock # 011029). PV-Cre;cCas9 mice by crossing PV-Cre and Rosa26-STOP-Cas9–2A-GFP (cCas9, JAX stock # 026175) [40] mice. PV-Cre;Fxr1f/f;dCas9-Activator mice by crossing Fxr1f/f;PV-Cre and Fxr1f/f;dCas9-activator mice which were got from crossing Fxr1f/ f[16, 72] mice and Cre-dependent dCas9-SPH activator (dCas9-activator) mice [51] (JAX stock # 031645). The Ai14 mice, PV-Cre mice, Ribotag mice, cCas9 and dCas9-activator mice were purchased from Jackson Laboratory. All the mice have been bred onto a C57BL/6J genetic background. Mice were housed in groups and maintained on a 12-h light/dark cycle with food and water available ad libitum. The experiments were conducted during light phase.
Data collection timing and blinding
Data collection was carried out for a predetermined period of time, as dictated by literature or core facility-based standards, and no exclusion criteria were applied. For drug treatment, animals were randomly assigned to treatment arms with approximately equivalent numbers in each group. All cell counting and behavioral analyses were performed by experimenters who were blind to the identity and treatments of the samples.
Gene expression analysis in humans
RNA-seq gene expression data were first analyzed at the population level (Transcripts Per Million (TPM) value in the DLPFC region (BA9) in PsychENCODE. Samples with top 5% PV levels in three categories, normal CTR (n=28), SCZ (n=20) and BPD (n=7), were used for further analysis. The PV level was defined by its protein-coding transcript, ENST00000417718 expression level in TPM. The expression level of protein-coding transcripts of BA9-enriched FXR1 (FXR1–1: ENST00000305586; FXR1–2: ENST00000445140) and CACNA1H (CACNA1H-1: ENST00000348261; CACNA1H-2: ENST00000564927) across the top PV samples were calculated. The enrichment of transcript isoforms was defined by GTEx (https://www.gtexportal.org).
Tissue Preparation and Immunohistochemistry
Histological analyses of mouse brains were performed as described previously with modifications [74, 75]. Mice were euthanized by intraperitoneal injection of sodium pentobarbital and then transcardially perfused with saline followed by 4% PFA. Brains were dissected out, post-fixed overnight in 4% PFA, and then equilibrated in 30% sucrose. Forty-μm brain sections were generated using a sliding microtone and stored in a –20°C freezer as floating sections in 96-well plates filled with cryoprotectant solution (glycerol, ethylene glycol, and 0.1M phosphate buffer, pH 7.4, 1:1:2 by volume). Immunohistology was performed as published previously [74, 75]. The tissue sections were pre-blocked with TBS++ (TBS containing 3% goat or donkey serum and 0.2% Triton X-100) for 1 h at room temperature, followed by incubation with primary antibodies diluted in TBS++ overnight in 4 °C. After washing 3 times, secondary antibodies were incubated for 1 h at room temperature. All sections were counterstained with a nuclear counter stain, DAPI (4’, 6-diamidine-2’-phenylindole dihydrochloride, 1:2000, Roche Applied Science, Indianapolis, IN).
The primary antibodies used were: chicken anti-GFP (A10262, Invitrogen, Carlsbad, CA), mouse anti-FXR1P (1:500, 1F10A8D11D9, NeoClone), rabbit anti-FXR1P (1:500, A303–892A, Bethyl Lab), rabbit anti-Parvalbumin (1:5000, ab11427, Abcam), rabbit anti-c-Fos (1:1000, #2250, Cell Signaling Technology), mouse anti-HA Tag (1:500, MMS-101R, Convance), mouse anti-Cav3.2 (1:500, clone N55/10, NeuroMab), rat anti-mCherry (1:5000, M11217, ThermoFisher), rabbit anti- SST (1:200, MAB354, Sigma-Aldrich), rabbit anti- VIP (1:500, 20077, Immunostar), mouse anti- Arc (C-7) (1:500, sc-17839, Santa Cruz), rabbit anti- MYBPC1 (1:100, 22900–1-AP, Proteintech), rabbit anti- DNAH6 (1:100, 18080–1-AP, Proteintech), rabbit anti- SLC7A3 (1:500, ARP43806_P050, Aviva Systems Biology).
Fluorescent secondary antibodies were used at 1:500 dilution: goat anti-chicken-488 (A11039, Invitrogen), goat anti-mouse 568 (A11004, Invitrogen), goat anti-rabbit 647 (A21245, Invitrogen), donkey anti-goat 568 (A11057, Invitrogen), donkey anti-rabbit 647 (A31573, Invitrogen), goat anti-mouse 647 (A21235, Invitrogen), goat anti-rabbit 568 (A11011, Invitrogen), and donkey anti mouse 647 (A31571, Invitrogen). After staining, sections were mounted and maintained at 4°C in the dark until analysis.
Morphological analysis of targeted neurons
Morphological analyses of PVIs were performed as described [74, 75]. PV+ neurons were imaged on a Nikon A1R-HD confocal or a Zeiss Apotome microscope with a 60× oil objective. Z-stacks of PVI dendrites were captured at 2 μm intervals and the dendrites and the cell body of single neurons were analyzed by Neurolucida software with 3D module plug-in (MicroBrightField, Inc. Williston, VI, http://www.mbfbioscience.com/). The average values of length, node, and end numbers from each animal (at least 20 cells) was counted as n = 1 for statistical analysis. Samples from at least three individual animals, each from a different litter, per experimental condition were analyzed.
In vivo cell quantification
For quantification of PVIs in mPFC, 1 in 6 serial sections starting at beginning of mPFC (relative to bregma, 3.2 mm) to the end of mPFC (relative to bregma, −0.22 mm) were used. Volume and the PV+ cells in the PL, ACC, IL were analyzed using unbiased stereology (StereoInvestigator, MBF Biosciences, Inc) as described elsewhere [74, 75].
For quantification of c-FOS+ cells in mPFC, adult male mice were sacrificed 45 minutes after certain activities such as 1) 1-minitue reciprocal social interaction to female mice, 2) 1-hour gamma light treatment. c-FOS+ cells were quantified using the Cell Counter plugin in Fiji [74, 75]. All cells were counted within a coronal section of mPFC as defined by the Paxinos and Franklin Mouse Atlas [76]. The number of c-FOS+ cells from each animal was counted as n = 1 for statistical analysis.
The signal intensity of FXR1P, Cav3.2 in PV+ cells in the mPFC of each animal was quantified using Image J software as previously described [77]. The z-stack images (2 μm interval) were acquired using Nikon A1R-HD confocal microscope. At least 20 individual PV+ cells were randomly selected from mPFC of the brain sections in each animal and the fluorescent intensity of FXR1P, Cav3.2 was measured after subtracting background pixel intensity in the same image using Image J software (NIH). The average intensity from each animal (at least 20 cells) was counted as n = 1 for statistical analysis. Samples from at least three individual animals, each from a different litter, per experimental condition were analyzed.
Plasmids, reagents, and primers
Lenti-shFxr1, shAgo2 and shNC were cloned using lentivirus-shNC vector as a backbone and the U6 or H1-shRNA cassettes were also cloned intro the backbone through HpaI/ClaI restriction sites. The efficiency and specificity of shRNA knockdown were determined by transfecting into Neuro2A using Lipofectamine 2000 (Invitrogen, #11668–027), and analyzed at 48 h post-transfection by qPCR. Lenti-LSL-Cav3.2ct-GFP and lenti-LSL-GFP were cloned using lenti-MS2-P65-HSF1 (Addgene #61426) as a backbone. Briefly, P65 and HSF1 were first replaced with loxP-stop-loxP sequence and GFP sequence, and then the C terminal coding sequence of Rat Cav3.2 (5671–7107) was cloned into this vector through BsrGI/EcoRI restriction sites. Lenti-LSL-miR-9-sponge was cloned using the same backbone (Addgene #61426). Briefly, P65 and HSF1 were first replaced with loxP-stop-loxP sequence and GFP sequence, and then the sequence of miR9 sponge and a BGH polyA terminator, which was generated by PCR using pBabe-puro-miR-9 sponge (Addgene # 25040) as template was cloned into this vector through BsrGI/EcoRI restriction sites. The vector without miR9-sponge was used as Ctrl. PX552 (Addgene #60958) and Cas9 (Addgene #52961) published by Dr. Feng Zhang [78, 79] were obtained from Addgene. A hSyn1-flex mCherry cassette was inserted between restriction sites KpnI and BglII of PX552, resulting in a PX552- hSyn1-flex-mcherry plasmid. The 5 sgRNAs targeting various sequences in the exons of the mouse Fxr1 gene were designed in Benchling based on published scoring methods (oligo sequences in table below) and cloned to the PX552- hSyn1-flex-mcherry plasmid following the published protocol provided by Addgene. The efficacy of these sgRNAs on FXR1 protein level were assessed by co-transfection of each sgRNA together with the Cas9 vector into Neuro2A cells using Lipofectamine and analyzed at 60-hr post-transfection by Western blotting.
| sgFxr1–1F | ACCGTGGAGGTTCGCGGCTCCAA | exon1 |
| sgFxr1–1R | AACTTGGAGCCGCGAACCTCCAC | |
| sgFxr1–2F | ACCGGAGGTTCGCGGCTCCAACG | exon1 |
| sgFxr1–2R | AACCGTTGGAGCCGCGAACCTCC | |
| sgFxr1–3F | ACCGCAACTGTGAGGGAGTCTTCG | exon2 |
| sgFxr1–3R | AACCGAAGACTCCCTCACAGTTGC | |
| sgFxr1–4F | ACCGCAGTTGGCAACCAGAACGCC | exon3 |
| sgFxr1–4R | AACGGCGTTCTGGTTGCCAACTGC | |
| sgFxr1–5F | ACCGCACTTCATTAAACGGAACC | exon3 |
| sgFxr1–5R | AACGGTTCCGTTTAATGAAGTGC | |
| sgNC-1-F | ACCGACGGAGGCTAAGCGTCGCAA | NC from GeCKO v2 library |
| sgNC-1-R | AACTTGCGACGCTTAGCCTCCGTC | |
| sgNC-2-F | ACCGCGAGGTATTCGGCTCCGCG | |
| sgNC-2-R | AACCGCGGAGCCGAATACCTCGC |
dCAS9-VP64 (Addgene #61425) and MS2-P65-HSF1 (Addgene #61426) published by Dr. Feng Zhang were obtained from Addgene. The 5 sgRNAs targeting various sequences in the proximal promoter region (+7 to −281 bp from the TSS) of mouse Cacna1h gene were designed in Benchling based on published scoring methods (oligo sequences in table below) and cloned to the PX552- hSyn1-flex-mcherry plasmid following the published protocol provided by Addgene. The efficacy of these sgRNAs on transcription of Cacna1h were assessed by co-transfection of each sgRNA together with dCAS9-VP64 and MS2-P65-HSF1 into Neuro2A cells using Lipofectamine and analyzed at 60-hr post-transfection by real-time PCR.
| sgCacna1h-1F | ACCGAAGTTTCCTGCGCTGTGCG | exon1 |
| sgCacna1h-1R | AACCGCACAGCGCAGGAAACTTC | |
| sgCacna1h-2F | ACCGACCCTCAGGGACCGAGATA | promotor |
| sgCacna1h-2R | AACTATCTCGGTCCCTGAGGGTC | |
| sgCacna1h-3F | ACCGTGGGATAGCTTACGTCTGGG | promotor |
| sgCacna1h-3R | AACCCCAGACGTAAGCTATCCCAC | |
| sgCacna1h-4F | ACCGCGTACCGGCACGGAGAAACA | promotor |
| sgCacna1h-4R | AACTGTTTCTCCGTGCCGGTACGC | |
| sgCacna1h-5F | ACCGTCCCGCGAGACAGTATGGGG | promotor |
| sgCacna1h-5R | AACCCCCATACTGTCTCGCGGGAC |
Production of Lentivirus
Lentivirus production was performed as described previously [74, 75]. Briefly, lentiviral DNA was co-transfected with packaging plasmids pMDL, REV and pCMV-Vsvg into HEK293T cells using calcium phosphate method. The viral transfer vector DNA and packaging plasmid DNA were transfected into 5X15 cm dishes of cultured HEK293T cells using the calcium phosphate method. The medium containing lentivirus was collected at 36- and 60-hours post-transfection, pooled, filtered through a 0.2-μm filter, and concentrated using an ultracentrifuge at 19 k rpm for 2 hours at 4°C using a SW27 rotor (Beckman). The virus was washed once and then resuspended in 100 μl PBS. We routinely obtained 1×10⁹ infectious viral particles /ml for lentivirus.
Whole cell recording of acute mPFC slices
The recordings were performed using published methods [80]. Male FXR1-cKO-Ai14, cKO-Ai14) mice and control PV-Cre;Ai14 (Ctrl-Ai14) mice (8-week-old) were used for patch clamp experiments. Mice were euthanized with CO2 and decapitated, followed by quick transfer of brain into dissection solution comprising (mM)93 NMDG, 93 HCl, 2.5 KCl, 1.2 NaH2PO4, 30 NaHCO3, 20 HEPES, 25 glucose, 5 sodium ascorbate, 2 Thiourea, 3 sodium pyruvate, 10 MgSO4, 0.5 CaCl2. Coronal slices (400 μm thick) containing mPFC were obtained and transferred to incubation solution containing (mm): 124 NaCl, 2.5 KCl, 2.5 CaCl2, 1.2 MgCl2, 1.25 NaH2PO4, 26 NaHCO3, and 15 glucose (equilibrated with 95% O2 and 5% CO2; pH 7.4). Slices were incubated at 34 °C for 10 min and stored at room temperature for 1 hour for recovery. Then slices were transferred to a submerged recording chamber (flow rate 2–2.5 ml/min at room temperature).
PVIs were identified by expression of tdT under epifluorescence using differential interference contrast video microscopy and fast-spiking characteristics. Whole-cell patch-clamp recordings were filtered at 2 kHz and digitalized at 50 kHz for current clamp recording, respectively using Multiclamp 700B, Digidata 1440A and pClamp 10.4 Software (Molecular Devices). Series resistance was typically within 10–30 MΩ. The intrinsic properties, including the resting membrane potential, input resistance, and membrane capacitance, of PVIs were recorded. Action potentials were evoked and recorded by current injection in current clamp mode. The threshold potentials and half-width of APs were measured and calculated.
In vivo intracranial EEG (iEEG) recording
EEG recording and analysis was performed as previously described [81]. Briefly, mice were anesthetized under isoflurane anesthesia (2%, delivered in medical-grade oxygen) and secured in a stereotaxic frame (Stoelting, Wood Dale, IL) for electrode implantation. Polyimide-insulated stainless-steel wires (0.005 inch, PlasticsOne, Roanoke, VA) and connecting pins (Digikey, Thief River Falls, MN)) were implanted as bipolar electrode pairs in three brain regions and secured in place with dental cement. A ground electrode was placed into the olfactory bulb area. A screw free, glue-based electrode assembly system that allows for long-term recordings was used for all iEEG recording sessions. Recordings were performed over 24hr period with automated infrared activity tracking to detect animal movement in a recording arena that allowed for free movement of the animal. EEG signals were amplified via a differential AC amplifier (Model 1700 differential AC amplifier, A-M system, Carlsborg, WA), digitized (Power 1401 A-D converter, Cambridge Electronic Design Limited, Cambridge, England) at 2000Hz, and recorded using Spike2 software (Cambridge Electronic Design, Cambridge, England). Original EEG recordings were bandpass-filtered (25–100Hz) to isolate gamma-activities [81].
Isolation, transfection, and analysis of primary mouse MGE neurons
MGE-derived neurons were isolated as described previously [82]. Briefly, MGE neurons from E14.5–15.5 mouse embryos were grown as dispersed mixed cell cultures. The MGE-derived neurons were transfected with shFxr1-GFP or shNC-GFP using Lipofectamine 2000 (Invitrogen, #11668–027) on DIV 7. At 4 days after transfection (DIV 11), neurons were fixed with 4% paraformaldehyde, washed with Dulbecco’s phosphate-buffered saline, and coverslipped in DABCO-PVA. Neurons were imaged using an AxioImagerZ2 ApoTome confocal microscope (Plan-APOCHOROMAT, 60 × oil, numerical aperture = 0.8; Zeiss) or A1RSi confocal microscope system (Nikon) with a 100 × oil objective. Approximately 30 neurons were analyzed for each group in each experiment.
Human ESC culture, neural differentiation, and analysis
The H9 ESCs were cultured and differentiated as described [83]. Briefly, H9 ESCs were cultured on MEF feeder layers (WiCell) with a daily change of hESC medium of DMEM/F12 (Thermo Fisher Scientific), 20% knockout serum replacement (KSR, Thermo Fisher Scientific), 0.1 mM 2-mercaptoethanol (Sigma), 1x L-Glutamine (Thermo Fisher Scientific), 6 ng/ml FGF-2 (Waisman Biomanufacturing). Cells were passaged using 6 U/ml of dispase (Thermo Fisher Scientific) in hESC medium, washed and replated at a dilution of 1:5 to 1:10.
Four days after human ESCs were passaged onto MEFs, neural differentiation were induced by switching hESC medium to neural induction medium (NIM) of DMEM/F12:Neurobasal 1:1, 1x N2, 1x L-Glutamine, 1x Anti-Anti (GIBCO), 10 μM SB432542 (Selleck), 100 nM LDN193189 (Selleck), and 5 uM XAV-939 (Selleck). Cells were cultured in NIM for 9 days with a daily medium change. Cells were then dissociated with TrypLE express (Thermo Fisher Scientific) and plated 1:1 to plates coated with Matrigel (Corning) in neural progenitor cell (NPC) medium (Neurobasal medium, 1x GlutaMAX (Thermo Fisher Scientific), 1x N2, 0.5x B27 without vitamin A (Thermo Fisher Scientific), 1x Anti-Anti) supplemented with 10 μM ROCK inhibitor (Y-27632 dihydrochloride, Tocris). The NPCs were patterned for 7 days with daily change of NPC medium supplemented with 10ng/ml SHH plus 1 μM purmorphamine. For neuronal differentiation, the patterned NPCs were dissociated with Accutase (Thermo Fisher Scientific) and plated at 1:10 to polyethylenimine- and Matrigel-coated plates in neural differentiation medium (NDM; NPC medium plus 200 μM ascorbic acid (Sigma-Aldrich), 1 μM cAMP (Sigma-Aldrich), 10 ng/ml BDNF (Peprotech), and 10 ng/ml GDNF (Peprotech)) supplemented with 10 μM ROCK inhibitor and 0.1 μM Compound E (Calbiochem). Half NDM medium was changed twice every week. Neurons were collected after 1 week for experiments.
PVI-specific RiboTag-Seq
RiboTag-IP was performed according to published protocol with modifications [43, 75]. Briefly, prefrontal cortices were dissected from 3 PV-Cre;Fxr1f/f;Ribotag mice and 3 control PV-Cre;Ribotag mice at 6 weeks old, and immediately homogenized in 1ml of homogenization buffer (50mM Tris [pH 7.4], 100mM KCl, 12mM MgCl2, 1% IGEPAL, 1mM DTT, 1x RNase inhibitor, 100μg/mL Cycloheximide, 1mg/mL Heparin) with 1X complete protease inhibitors (Roche). Nuclei and debris were pelleted at 10,000 X g for 10 min. 3–6 μl monoclonal antibody against HA Tag (Covance catalog# MMS-101R) was incubated with supernatant at 4ºC for 6 hrs and before adding Dynabeads (ThermoFisher). The antibody/Dynabeads conjugation was rotated at 4ºC overnight and washed with high salt buffer (50mM Tris [pH 7.4], 300mM KCl, 12mM MgCl2, 1% IGEPAL, 1mM DTT, 100μg/mL Cycloheximide) to remove unbound proteins and RNA. Finally, Trizol was added to the beads and the supernatant was saved for RNA isolation.
RNA isolation and next generation sequencing were performed as described [75, 84]. Briefly, RNA from the RiboTag IP was isolated using the Direct-zol™ RNA MicroPrep Kit (Zymo Research Corporation. Irvine, CA, USA). Quality, size, and concentration of the isolated RNA were analyzed using Bioanalyser 2100 (RNA Pico Kit, Agilent). The libraries were then made using SMARTer® Stranded Total RNA-Seq Kit v2 (Takara Bio USA, Inc. Mountain View, CA) according to the user manual. The constructed libraries were analyzed with Qubit (ThermoFisher Scientific, Waltham, MA) and Bioanalyser 2100 (RNA Pico Kit, Agilent). Cluster generation and high-throughput sequencing were performed on a HiSeq 2500 (Illumina), using the single-end 100 bp protocol.
Bioinformatics analysis
Analysis of RiboTag-seq data were performed using published methods [75]. FastQC (https://www.bioinformatics.babraham.ac.uk/projects/fastqc/) was used to perform the quality check of the .fastq reads and then the adaptor and low-quality reads are removed with TrimGalore (https://github.com/FelixKrueger/TrimGalore). Single end reads were mapped to reference genome (GRCm38/mm10) with UCSC annotations and quantified gene expression using STAR–quantMode [85]. Reads aligned only to reverse strand were considered for further analysis.and the resulting raw counts of transcripts were generated (Table S1). Normalization (counts per million, or cpm) and differential expression analysis (likelihood ratio test) was performed by using edgeR R-package [86] (Table S1). Genes with 30% upregulation or downregulation with FDR<0.05 were selected as differentially expressed (DE) genes (Table S1).
Gene ontology analysis (Table S2) was performed by using enrichGO function in clusterProfiler R-package with ont= ALL to pool 3 GO sub-ontologies(Molecular function, Biological process, Cellular Component), and plotted using enrichplot R-package. To validate PVIs-specified enrichment pattern, cell type enriched genes in cortical PV+, SST+, VIP+ and Emx1+ neurons (225 genes in total) in published dataset were used to compare with our dataset. Mean of three replicates was taken for the correlation coefficient calculation from all six groups.
To determine whether our DE genes have association with psychiatric disorders, PsychENCODE Consortium’s Cross-Disorder Differentially expressed (DEX) Genes containing 5530 DE genes of ASD, SCZ and BD were used to compare with our DE genes.
To determine which miRNAs may facilitate FXR1P regulation of Cav3.2, we first used three miRNA target-prediction databases, TargetScan7, Exiqon, and miRMap to generate a list of miRNAs predicted to target Cacna1h and generated a list of Cacna1h-targeting miRNAs (predicted by at least one database). We then obtained the list of AGO2-bound miRNAs in PVIs in the cortex. We compared these two lists and ranked Cacna1h-targeting miRNAs according to their expression levels in PVIs [48] (Table S4).
Real-Time PCR
Real-time PCR were performed using standard methods as previously described [74, 75]. The first-strand cDNA was generated by reverse transcription with both oligo dT primer and random primers using PrimeScriptTM RT Reagent Kit (Takara, #RR037A). To quantify the mRNA levels using real-time PCR, aliquots of first-strand cDNA were amplified with gene-specific primers and universal SYBR Green PCR supermix (Bio-Rad, #172–5124) using a Step-1 Real-Time PCR System (Applied Biosystems). The PCR reactions contained 20–40 ng of cDNA (except the cDNA for the IP, for which 5% of the cDNA was used for each gene examined), and 300 nM of forward and reverse primers in a final reaction volume of 20 μl. The sequences of primers used for PCR:
| Gapdh | Forward: | AATGGGAAGCTTGTCATCAACG |
| Gapdh | Reverse: | GAAGACACCAGTAGACTCCACGACATA |
| Cacna1h | Forward: | CGTGACACTGGGCATGTTC |
| Cacna1h | Reverse: | CCACCATCTTGATAACCATCTCC |
| Ago2 | Forward: | CGTCCTTCCCACTACCACG |
| Ago2 | Reverse: | CCAGAGGTATGGCTTCCTTCA |
| Fxr1 | Forward: | GGCAGAAGATAGACAGCCAGT |
| Fxr1 | Reverse | TTCTCCCAGAGTACGCGGTAG |
RNA Immunoprecipitation (RNA-IP)
RNA-IP followed by qPCR was performed as described previously [74]. Briefly, N2A cells transfected with shRNAs or anti-microRNAs were harvested and homogenized in 2 ml of homogenization buffer (25 mM Tris (pH 7.0), 25 mM Tris (pH 8.0), 100 mM KCl, 12 mM MgCl2, 10% IGEPAL, 1 mM DTT, protease inhibitors, 1× RNase inhibitor, 200 units/mL, 100 μg/mL cycloheximide, 1 mg/mL heparin) with 2× complete protease inhibitors (Boehringer-Mannheim). Nuclei and debris were pelleted at 14,000g for 15 min. An aliquot of input was saved for RNA extraction (50 μl). A polyclonal antibody against FXR1 (A303–892A, Bethyl lab) was incubated with supernatant at 4 °C for 4 h and before adding Dynabeads (Life Technologies). The antibody–FXR1P conjugation was rotated at 4 °C overnight. After the third wash with the high-salt buffer (25 mM Tris (pH 7.0), 25 mM Tris (pH 8.0), 300 mM KCl, 12 mM MgCl2, 1 mM DTT, 100 μg/mL cycloheximide), the immunoprecipitations were resuspended into Trizol (Invitrogen) for RNA isolation. RNA from immunoprecipitation and input was used, and all real-time PCR reactions were carried out in duplicate for each sample on each amplicon.
In vivo viral grafting followed by morphological and behavioral tests.
Lentivirus (lenti-LSL-Cav3.2ct-GFP or lenti-LSL-GFP, lenti-LSL-miR-9-Sp-GFP or lenti-LSL-Ctrl-GFP) stereotaxic injection was performed as described [74, 75]. Briefly, 8-week-old male mice were anesthetized with isoflurane and placed in a stereotactic instrument (DAVID KOPF Instruments, Tujunga, CA). Microinjections were performed using custom-made injection 33-gauge needles (Hamilton, #776206, Reno, NV, USA) connected to a 10 μL syringe (Hamilton, #87930). Virus (1 μl with titer greater than 1×10⁹/ml) was stereotaxically injected into the bilateral mPFC using the following coordinates relative to bregma, caudal: +2.0 mm; lateral: +/−0.3 mm; ventral: −2.2 mm, 14-degree angle pointing lateral.
AAV (AAV8-sgFxr1-hSyn1-flex-mcherry, AAV8-sgCtrl-hSyn1-flex-mcherry and AAV8-sgCacna1h-hSyn1-flex-mcherry, Vigene Biosciences, titer greater than 1×10¹³/ml) stereotaxic injection was performed similar to lentiviral injection. 0.5 μl virus was stereotaxically injected into the mPFC bilaterally. Bilateral DLS viral injection used the following coordinates relative to bregma, caudal: +1.0 mm; lateral: +/−2.3 mm; ventral: −2.5 mm. All mice were given at least 21 days to recover before subjected to morphological tests or behavioral testing started with open field test to evaluate locomotor activity and general anxiety.
Open field activity test (OF)
This test was performed as previously described to measure locomotive activity [74]. Mice were handled for approximately 15 min a day for a minimum of 7 days prior to the experiment. Before the trial or test phase, mice were brought into testing room and were allowed to acclimate for at least 60 min. Activity was recorded at 10-min intervals for total 30-min by means of a computer operated tracking system (Omnitech Electronics Inc, USA). Total distance moved, and distance travelled in the Centre and periphery of arena were measured by the tracking system.
Elevated plus maze (EPM)
This test was performed following basic procedures to measure anxiety level [87]. For testing anxiety, mice were allowed to freely explore the two open arms or two closed (walled) arms on an elevated runways 20 cm above the ground for 5 minutes. More anxious mice prefer closed arms versus open space. All experiments were videotaped and the time in the open arms were scored by ANYmaze (Stoelting).
Marble burying test (MB)
This test was performed following basic procedures to measure compulsive behaviors [88]. Mice were placed into testing cages (40 cm × 20 cm × 30 cm, bedding depth: 3 cm) each containing 20 glass marbles (laid out in four rows of five marbles equidistant from one another). At the end of the 30-min exploration period, mice were carefully removed from the testing cages. All experiments were photographically recorded, and the number of marbles buried was scored by scientists who were blinded to experimental conditions to ensure accuracy. The marble burying index was arbitrarily defined as the following: 1 for marbles totally covered with bedding, 0.5 for marbles covered >50% with bedding, or 0 for anything less.
Forced swimming test (FST)
For a measure of antidepressant-like activity, mice were subjected to the forced swim assay as previously described [89], with modifications. Briefly, mice were placed in a plexiglas container (46 cm tall × 20 cm diameter) filled to 30 cm with 25°C (±1°C) water for a test swim lasting 6 min. Following each swim period, the mice were removed from the water, towel-dried and placed in a heated cage for 30 min. All experiments were videotaped, and the time of immobility was scored by ANYmaze (Stoelting).
Novel location test (NLT)
This test was performed as previously described to measure spatial learning [74, 77]. Briefly, testing consisted of five 6-min trials, with a 3-min intertrial interval between each trial. In the first trial (Trial 1, Pre-Exposure), each mouse was placed individually into the center of the otherwise empty open arena (38.5 cm long×38.5cm wide, and 25.5cm high walls) for 6 min. For the next three trials (Trials 2–4, Trainings), two identical objects were placed inside, and each mouse was placed individually into the arena, and was allowed to explore for 6 minutes. In the last trial (Trial 5, Test), one of the objects was moved to a novel location, and the mouse was allowed to explore the objects for 6 minutes. All experiments were videotaped and scored by ANYmaze (Stoelting). The discrimination index was calculated as the percentage of time spent investigating the object in the new location minus the percentage of time spent investigating the object in the old location.
Novel object recognition test (NOR)
This test was performed as previously described to measure memory retention for the novel object [74, 77]. Briefly, testing consisted of 3 10-min trails daily for three consecutive days. On Day 1, mice were habituated for 10 min to the V-maze, made out of black Plexiglas with two corridors (30 cm long × 4.5 cm wide, and 15 cm high walls) set at a 90° angle, in which the task was performed. On Day 2, mice were put back in the maze for 10 min, and two identical objects were presented. On Day 3, one of the familiar objects was replaced with a novel object, and the mice were again placed in the maze and were allowed to explore for 10 min. The tests were videotaped and scored by ANYmaze (Stoelting). The discrimination index was calculated as the difference between the percentages of time spent investigating the novel object and the time spent investigating the familiar objects.
Three-chamber sociability tests (SI, SN)
Three-chamber social behavior test was carried out as previously described [74]. The social behavior testing apparatus was a 3-chambered box (each chamber: 40 cm long×22 cm wide, and 23 cm high walls) with clear Plexiglas containing small circular doors (7 cm in diameter) allowing access into each chamber. Briefly, testing consisted of 3 10-min sessions: habituation, tests of social interaction/interest (SI), and social novelty recognition (SN). In habituation session, each mouse was allowed to explore all 3 chambers freely. In SI, an unfamiliar mouse (stranger 1, age and sex matched to the test mouse) was placed in a round wire cage in one of the compartments whereas the wire cage in the opposite side compartment contained a motionless toy. The test mouse was tested for evaluation of the social interaction. In SN, one side compartment contained the familiar mouse (stranger 1from the previous social interaction phase), the other side contained a novel unfamiliar mouse (stranger 2). The test mouse was tested for evaluation of the social novelty recognition test. All experiments were videotaped and scored by ANYmaze (Stoelting). The discrimination index was calculated as the difference between the percentages of time spent exploring the stranger1 and toy in Session 2, or stranger 2 and familiar stranger 1 in Session 3.
Reciprocal sociability tests (RSI, RSN)
Reciprocal social procedure was performed as previously described [90, 91]. A stimulus female was introduced into the home cage with the male mouse for a 1-min interaction for the first trial. At the end of the 1-min trial, the stimulus animal was returned to an individual holding cage. After a 10-min inter-exposure interval, the same female was introduced into the same home cage of the male mouse for 1 min. These trials were repeated and performed 4 times in all, which was reciprocal social interaction/interest test (RSI). Of the note, 10 min after the fourth trial, the fifth trial (dishabituation trial) was carried out by introducing a different stimulus female to the same male mouse for 1 min. The exploration time of the female by the male mouse was recorded, which was called reciprocal social novelty recognition test (RSN). All experiments were videotaped and scored by scientists who were blinded to experimental conditions to ensure accuracy.
Acoustic pre-pulse inhibition of tactile startle response (PPI)
PPI was performed using a SOF-825 Startle Reflex System (Med Associates Inc) as described previously [92]. The test session consisted of a background noise (65 dB) that was presented alone for 5 min and remained on for the length of the session, followed by presentation (in a pseudo-random order) of pulse-alone trials (40-ms, 120-dB broadband bursts), prepulse+pulse trials (20-ms noises that were 68, 74 and 80 dB and were presented 100 ms before the onset of the 120-dB pulse), and no stimulus trials (only the background noise). The session was divided into two equivalent parts that each contained 40 trials (8 each of the 68-, 74-, and 80-dB prepulse+pulse trials, 8 pulse-alone trials and 8 no stimulus trials). Four pulse-alone trials were presented at the beginning and the end of the session to ensure that startle magnitude was stable during the portion of the session when PPI was measured. Percent PPI of the startle response was calculated as 100—( [prepulse trial/tactile startling stimulus] × 100). A high percent PPI value reflects strong PPI and better sensorimotor gating. Maximal startle response was scored to reflect acoustic startle response level.
Gamma oscillation enhancing light flicker treatment
The light flicker treatment was performed as previously described [52]. The mice were moved to a dim room, then placed in a test cage (similar to the home cage, except three of its sides covered with black sheeting) illuminated on the open side by a Warm-white LED light strand (Gamma 40Hz Light Therapy Kit, gammalighttherapy.com) with 40Hz light flicker (12.5ms light on, 12.5ms light off, 60W) for 1h. Mice were allowed to freely move inside the cage but did not have an access to food or water during the 1 h light flicker. After 1h of light flicker exposure, mice were returned to their home cage and allowed to rest for a further 30 min before being transported back to the holding room. The mice received 40Hz visual stimulation for 1-h daily for seven days before behavior tests, and the mice continued to be exposed to 1-h 40Hz visual stimulation daily during the behavior tests. The behavior tests were done 3–24 hours after light treatment. For c-FOS quantification, mice were perfused 45 minutes after last time of 1-hour light treatment, and brains were cut at 40-μm thickness.
Statistical analysis
No statistical methods were used to pre-determine sample sizes, but our sample sizes are similar to those reported in previous publications (see citations within each procedure). Data distribution was assumed to be normal, but this was not formally tested. Statistical analysis was performed using ANOVA and Student’s t test, unless specified, with the aid of SPSS version 22 and GraphPad Prism software. Two tailed and unpaired t-test was used to compare two conditions. Two-way ANOVA with Tukey’s post hoc analysis was used for analyzing multiple groups. One-Way ANOVA with Bonferroni post hoc test used for comparison among for in vivo dendritic analysis of different genotypes (GraphPad software 6). Scholl analysis was carried out using multivariate analysis of variance (MANOVA) using SPSS statistical software. All data were shown as mean with standard error of mean (mean ± SEM). Probabilities of p < 0.05 were considered as significant.
Supplementary Material
Acknowledgments:
We thank Y. Xing, S. Minemyer, R. Risgaard, R. Mishra, A. Stanko, P. Chugh, S. Pham, Y. Zhao, Y. Sun for technical assistance, V. Bakshi, B. Baldo and J. Panksepp for helping with PPI tests, S. Liu for helping with bioinformatics, J. Pinnow, M. Perez, M. Eastwood, D. Bolling, R. Emerson, H. Mitchell and K. Knobel at the Waisman IDD Model Core, S. Splinter-BonDurant and the UW-Madison Biotechnology Center for providing next generation sequencing services. This work was supported by grants from the National Institutes of Health (RO1MH118827, R01NS105200, and R01MH116582 to X.Z., R01HD064743 to Q. C., R01NS064025, R01AG067025, and U01MH116492 to D. W., U54HD090256 to the Waisman Center; 5R01NS094550 and P20GM121310 to Q. S.). Brain Research Foundation, UW Vilas (Mid-Career Award), Wisconsin Alumni Research Foundation, Jenni and Kyle Professorship (to X.Z.), and FRAXA Postdoctoral fellowship (to M. S.).
Footnotes
Conflict of interests:
The authors declare no competing interests.
References
- 1.Kessler RC, Aguilar-Gaxiola S, Alonso J, Chatterji S, Lee S, Ormel J et al. The global burden of mental disorders: an update from the WHO World Mental Health (WMH) surveys. Epidemiol Psichiatr Soc 2009; 18(1): 23–33. [DOI] [PMC free article] [PubMed] [Google Scholar]
- 2.Sullivan PF, Kendler KS, Neale MC. Schizophrenia as a complex trait: evidence from a meta-analysis of twin studies. Arch Gen Psychiatry 2003; 60(12): 1187–1192. [DOI] [PubMed] [Google Scholar]
- 3.Niwa M, Cash-Padgett T, Kubo KI, Saito A, Ishii K, Sumitomo A et al. DISC1 a key molecular lead in psychiatry and neurodevelopment: No-More Disrupted-in-Schizophrenia 1. Mol Psychiatry 2016; 21(11): 1488–1489. [DOI] [PMC free article] [PubMed] [Google Scholar]
- 4.Schizophrenia-Working-Group. Biological insights from 108 schizophrenia-associated genetic loci. Nature 2014; 511(7510): 421–427. [DOI] [PMC free article] [PubMed] [Google Scholar]
- 5.Takata A, Matsumoto N, Kato T. Genome-wide identification of splicing QTLs in the human brain and their enrichment among schizophrenia-associated loci. Nat Commun 2017; 8: 14519. [DOI] [PMC free article] [PubMed] [Google Scholar]
- 6.Liu X, Kelsoe JR, Greenwood TA. A genome-wide association study of bipolar disorder with comorbid eating disorder replicates the SOX2-OT region. J Affect Disord 2016; 189: 141–149. [DOI] [PMC free article] [PubMed] [Google Scholar]
- 7.Pardinas AF, Holmans P, Pocklington AJ, Escott-Price V, Ripke S, Carrera N et al. Common schizophrenia alleles are enriched in mutation-intolerant genes and in regions under strong background selection. Nat Genet 2018; 50(3): 381–389. [DOI] [PMC free article] [PubMed] [Google Scholar]
- 8.Coelewij L, Curtis D. Mini-review: Update on the genetics of schizophrenia. Ann Hum Genet 2018; 82(5): 239–243. [DOI] [PubMed] [Google Scholar]
- 9.Gandal MJ, Zhang P, Hadjimichael E, Walker RL, Chen C, Liu S et al. Transcriptome-wide isoform-level dysregulation in ASD, schizophrenia, and bipolar disorder. Science 2018; 362(6420). [DOI] [PMC free article] [PubMed] [Google Scholar]
- 10.Rajarajan P, Borrman T, Liao W, Schrode N, Flaherty E, Casino C et al. Neuron-specific signatures in the chromosomal connectome associated with schizophrenia risk. Science 2018; 362(6420). [DOI] [PMC free article] [PubMed] [Google Scholar]
- 11.Wang D, Liu S, Warrell J, Won H, Shi X, Navarro FCP et al. Comprehensive functional genomic resource and integrative model for the human brain. Science 2018; 362(6420). [DOI] [PMC free article] [PubMed] [Google Scholar]
- 12.Li M, Santpere G, Imamura Kawasawa Y, Evgrafov OV, Gulden FO, Pochareddy S et al. Integrative functional genomic analysis of human brain development and neuropsychiatric risks. Science 2018; 362(6420). [DOI] [PMC free article] [PubMed] [Google Scholar]
- 13.Siomi MC, Siomi H, Sauer WH, Srinivasan S, Nussbaum RL, Dreyfuss G. FXR1, an autosomal homolog of the fragile X mental retardation gene. Embo J 1995; 14(11): 2401–2408. [DOI] [PMC free article] [PubMed] [Google Scholar]
- 14.Lek M, Karczewski KJ, Minikel EV, Samocha KE, Banks E, Fennell T et al. Analysis of protein-coding genetic variation in 60,706 humans. Nature 2016; 536(7616): 285–291. [DOI] [PMC free article] [PubMed] [Google Scholar]
- 15.Li Y, Zhao X. Concise review: Fragile X proteins in stem cell maintenance and differentiation. Stem Cells 2014; 32(7): 1724–1733. [DOI] [PMC free article] [PubMed] [Google Scholar]
- 16.Patzlaff NE, Nemec KM, Malone SG, Li Y, Zhao X. Fragile X related protein 1 (FXR1P) regulates proliferation of adult neural stem cells. Hum Mol Genet 2017. [DOI] [PMC free article] [PubMed] [Google Scholar]
- 17.Cook D, Sanchez-Carbente Mdel R, Lachance C, Radzioch D, Tremblay S, Khandjian EW et al. Fragile X related protein 1 clusters with ribosomes and messenger RNAs at a subset of dendritic spines in the mouse hippocampus. PLoS One 2011; 6(10): e26120. [DOI] [PMC free article] [PubMed] [Google Scholar]
- 18.Sakai Y, Shaw CA, Dawson BC, Dugas DV, Al-Mohtaseb Z, Hill DE et al. Protein interactome reveals converging molecular pathways among autism disorders. Sci Transl Med 2011; 3(86): 86ra49. [DOI] [PMC free article] [PubMed] [Google Scholar]
- 19.Zarnescu DC, Gregorio CC. Fragile hearts: new insights into translational control in cardiac muscle. Trends Cardiovasc Med 2013; 23(8): 275–281. [DOI] [PMC free article] [PubMed] [Google Scholar]
- 20.Del’Guidice T, Latapy C, Rampino A, Khlghatyan J, Lemasson M, Gelao B et al. FXR1P is a GSK3beta substrate regulating mood and emotion processing. Proc Natl Acad Sci U S A 2015; 112(33): E4610–4619. [DOI] [PMC free article] [PubMed] [Google Scholar]
- 21.Khlghatyan J, Evstratova A, Chamberland S, Marakhovskaia A, Bahremand A, Toth K et al. Mental Illnesses-Associated Fxr1 and Its Negative Regulator Gsk3beta Are Modulators of Anxiety and Glutamatergic Neurotransmission. Front Mol Neurosci 2018; 11: 119. [DOI] [PMC free article] [PubMed] [Google Scholar]
- 22.Cook D, Nuro E, Jones EV, Altimimi HF, Farmer WT, Gandin V et al. FXR1P limits long-term memory, long-lasting synaptic potentiation, and de novo GluA2 translation. Cell Rep 2014; 9(4): 1402–1416. [DOI] [PMC free article] [PubMed] [Google Scholar]
- 23.Cho RY, Konecky RO, Carter CS. Impairments in frontal cortical gamma synchrony and cognitive control in schizophrenia. Proc Natl Acad Sci U S A 2006; 103(52): 19878–19883. [DOI] [PMC free article] [PubMed] [Google Scholar]
- 24.Gonzalez-Burgos G, Cho RY, Lewis DA. Alterations in cortical network oscillations and parvalbumin neurons in schizophrenia. Biol Psychiatry 2015; 77(12): 1031–1040. [DOI] [PMC free article] [PubMed] [Google Scholar]
- 25.Klausberger T, Somogyi P. Neuronal diversity and temporal dynamics: the unity of hippocampal circuit operations. Science 2008; 321(5885): 53–57. [DOI] [PMC free article] [PubMed] [Google Scholar]
- 26.Isaacson JS, Scanziani M. How inhibition shapes cortical activity. Neuron 2011; 72(2): 231–243. [DOI] [PMC free article] [PubMed] [Google Scholar]
- 27.Lee SH, Kwan AC, Dan Y. Interneuron subtypes and orientation tuning. Nature 2014; 508(7494): E1–2. [DOI] [PubMed] [Google Scholar]
- 28.Bartos M, Vida I, Jonas P. Synaptic mechanisms of synchronized gamma oscillations in inhibitory interneuron networks. Nat Rev Neurosci 2007; 8(1): 45–56. [DOI] [PubMed] [Google Scholar]
- 29.Lewis DA, Hashimoto T, Volk DW. Cortical inhibitory neurons and schizophrenia. Nat Rev Neurosci 2005; 6(4): 312–324. [DOI] [PubMed] [Google Scholar]
- 30.Bicks LK, Koike H, Akbarian S, Morishita H. Prefrontal Cortex and Social Cognition in Mouse and Man. Front Psychol 2015; 6: 1805. [DOI] [PMC free article] [PubMed] [Google Scholar]
- 31.Lisman J, Cooper K, Sehgal M, Silva AJ. Memory formation depends on both synapse-specific modifications of synaptic strength and cell-specific increases in excitability. Nat Neurosci 2018; 21(3): 309–314. [DOI] [PMC free article] [PubMed] [Google Scholar]
- 32.Atallah BV, Bruns W, Carandini M, Scanziani M. Parvalbumin-expressing interneurons linearly transform cortical responses to visual stimuli. Neuron 2012; 73(1): 159–170. [DOI] [PMC free article] [PubMed] [Google Scholar]
- 33.Murray AJ, Woloszynowska-Fraser MU, Ansel-Bollepalli L, Cole KL, Foggetti A, Crouch B et al. Parvalbumin-positive interneurons of the prefrontal cortex support working memory and cognitive flexibility. Sci Rep 2015; 5: 16778. [DOI] [PMC free article] [PubMed] [Google Scholar]
- 34.Flaisher-Grinberg S, Einat H. A possible utilization of the mice forced swim test for modeling manic-like increase in vigor and goal-directed behavior. J Pharmacol Toxicol Methods 2009; 59(3): 141–145. [DOI] [PubMed] [Google Scholar]
- 35.Mena A, Ruiz-Salas JC, Puentes A, Dorado I, Ruiz-Veguilla M, De la Casa LG. Reduced Prepulse Inhibition as a Biomarker of Schizophrenia. Front Behav Neurosci 2016; 10: 202. [DOI] [PMC free article] [PubMed] [Google Scholar]
- 36.Hippenmeyer S, Vrieseling E, Sigrist M, Portmann T, Laengle C, Ladle DR et al. A developmental switch in the response of DRG neurons to ETS transcription factor signaling. PLoS Biol 2005; 3(5): e159. [DOI] [PMC free article] [PubMed] [Google Scholar]
- 37.Beckley JT, Woodward JJ. Volatile solvents as drugs of abuse: focus on the cortico-mesolimbic circuitry. Neuropsychopharmacology 2013; 38(13): 2555–2567. [DOI] [PMC free article] [PubMed] [Google Scholar]
- 38.Barker GR, Bird F, Alexander V, Warburton EC. Recognition memory for objects, place, and temporal order: a disconnection analysis of the role of the medial prefrontal cortex and perirhinal cortex. J Neurosci 2007; 27(11): 2948–2957. [DOI] [PMC free article] [PubMed] [Google Scholar]
- 39.Amodio DM, Frith CD. Meeting of minds: the medial frontal cortex and social cognition. Nat Rev Neurosci 2006; 7(4): 268–277. [DOI] [PubMed] [Google Scholar]
- 40.Platt RJ, Chen S, Zhou Y, Yim MJ, Swiech L, Kempton HR et al. CRISPR-Cas9 knockin mice for genome editing and cancer modeling. Cell 2014; 159(2): 440–455. [DOI] [PMC free article] [PubMed] [Google Scholar]
- 41.Reed MD, Yim YS, Wimmer RD, Kim H, Ryu C, Welch GM et al. IL-17a promotes sociability in mouse models of neurodevelopmental disorders. Nature 2020; 577(7789): 249–253. [DOI] [PMC free article] [PubMed] [Google Scholar]
- 42.Burguiere E, Monteiro P, Feng G, Graybiel AM. Optogenetic stimulation of lateral orbitofronto-striatal pathway suppresses compulsive behaviors. Science 2013; 340(6137): 1243–1246. [DOI] [PMC free article] [PubMed] [Google Scholar]
- 43.Gao Y, Zhao X. sncRiboTag-Seq: cell-type-specific RiboTag-Seq for cells in low abundance in mouse brain tissue. STAR Protoc 2021; 2(1): 100231. [DOI] [PMC free article] [PubMed] [Google Scholar]
- 44.Sanz E, Yang L, Su T, Morris DR, McKnight GS, Amieux PS. Cell-type-specific isolation of ribosome-associated mRNA from complex tissues. Proc Natl Acad Sci U S A 2009; 106(33): 13939–13944. [DOI] [PMC free article] [PubMed] [Google Scholar]
- 45.Paul A, Crow M, Raudales R, He M, Gillis J, Huang ZJ. Transcriptional Architecture of Synaptic Communication Delineates GABAergic Neuron Identity. Cell 2017; 171(3): 522–539 e520. [DOI] [PMC free article] [PubMed] [Google Scholar]
- 46.Patzlaff NE, Shen M, Zhao X. Regulation of Adult Neurogenesis by the Fragile X Family of RNA Binding Proteins. Brain Plast 2018; 3(2): 205–223. [DOI] [PMC free article] [PubMed] [Google Scholar]
- 47.Vasudevan S, Steitz JA. AU-rich-element-mediated upregulation of translation by FXR1 and Argonaute 2. Cell 2007; 128(6): 1105–1118. [DOI] [PMC free article] [PubMed] [Google Scholar]
- 48.He M, Liu Y, Wang X, Zhang MQ, Hannon GJ, Huang ZJ. Cell-type-based analysis of microRNA profiles in the mouse brain. Neuron 2012; 73(1): 35–48. [DOI] [PMC free article] [PubMed] [Google Scholar]
- 49.Luo F, Tang H, Cheng ZY. Stimulation of alpha1-adrenoceptors facilitates GABAergic transmission onto pyramidal neurons in the medial prefrontal cortex. Neuroscience 2015; 300: 63–74. [DOI] [PubMed] [Google Scholar]
- 50.Wang G, Bochorishvili G, Chen Y, Salvati KA, Zhang P, Dubel SJ et al. CaV3.2 calcium channels control NMDA receptor-mediated transmission: a new mechanism for absence epilepsy. Genes Dev 2015; 29(14): 1535–1551. [DOI] [PMC free article] [PubMed] [Google Scholar]
- 51.Zhou H, Liu J, Zhou C, Gao N, Rao Z, Li H et al. In vivo simultaneous transcriptional activation of multiple genes in the brain using CRISPR-dCas9-activator transgenic mice. Nat Neurosci 2018; 21(3): 440–446. [DOI] [PubMed] [Google Scholar]
- 52.Martorell AJ, Paulson AL, Suk HJ, Abdurrob F, Drummond GT, Guan W et al. Multi-sensory Gamma Stimulation Ameliorates Alzheimer’s-Associated Pathology and Improves Cognition. Cell 2019; 177(2): 256–271 e222. [DOI] [PMC free article] [PubMed] [Google Scholar]
- 53.Bureau A, Beaulieu JM, Paccalet T, Chagnon YC, Maziade M. The interaction of GSK3B and FXR1 genotypes may influence the mania and depression dimensions in mood disorders. J Affect Disord 2017; 213: 172–177. [DOI] [PubMed] [Google Scholar]
- 54.Santos-Cortez RLP, Khan V, Khan FS, Mughal ZU, Chakchouk I, Lee K et al. Novel candidate genes and variants underlying autosomal recessive neurodevelopmental disorders with intellectual disability. Hum Genet 2018; 137(9): 735–752. [DOI] [PMC free article] [PubMed] [Google Scholar]
- 55.Tran SS, Jun HI, Bahn JH, Azghadi A, Ramaswami G, Van Nostrand EL et al. Widespread RNA editing dysregulation in brains from autistic individuals. Nat Neurosci 2019; 22(1): 25–36. [DOI] [PMC free article] [PubMed] [Google Scholar]
- 56.Darnell JC, Fraser CE, Mostovetsky O, Darnell RB. Discrimination of common and unique RNA-binding activities among Fragile X mental retardation protein paralogs. Hum Mol Genet 2009; 18(17): 3164–3177. [DOI] [PMC free article] [PubMed] [Google Scholar]
- 57.Ascano M Jr., Mukherjee N, Bandaru P, Miller JB, Nusbaum JD, Corcoran DL et al. FMRP targets distinct mRNA sequence elements to regulate protein expression. Nature 2012; 492(7429): 382–386. [DOI] [PMC free article] [PubMed] [Google Scholar]
- 58.Cheever A, Ceman S. Translation regulation of mRNAs by the fragile X family of proteins through the microRNA pathway. RNA Biol 2009; 6(2): 175–178. [DOI] [PMC free article] [PubMed] [Google Scholar]
- 59.Cheever A, Blackwell E, Ceman S. Fragile X protein family member FXR1P is regulated by microRNAs. Rna 2010; 16(8): 1530–1539. [DOI] [PMC free article] [PubMed] [Google Scholar]
- 60.Xu XL, Zong R, Li Z, Biswas MH, Fang Z, Nelson DL et al. FXR1P but not FMRP regulates the levels of mammalian brain-specific microRNA-9 and microRNA-124. J Neurosci 2011; 31(39): 13705–13709. [DOI] [PMC free article] [PubMed] [Google Scholar]
- 61.Darnell JC, Van Driesche SJ, Zhang C, Hung KY, Mele A, Fraser CE et al. FMRP stalls ribosomal translocation on mRNAs linked to synaptic function and autism. Cell 2011; 146(2): 247–261. [DOI] [PMC free article] [PubMed] [Google Scholar]
- 62.Boland MJ, Nazor KL, Tran HT, Szucs A, Lynch CL, Paredes R et al. Molecular analyses of neurogenic defects in a human pluripotent stem cell model of fragile X syndrome. Brain 2017; 140(3): 582–598. [DOI] [PMC free article] [PubMed] [Google Scholar]
- 63.Davidovic L, Durand N, Khalfallah O, Tabet R, Barbry P, Mari B et al. A novel role for the RNA-binding protein FXR1P in myoblasts cell-cycle progression by modulating p21/Cdkn1a/Cip1/Waf1 mRNA stability. PLoS Genet 2013; 9(3): e1003367. [DOI] [PMC free article] [PubMed] [Google Scholar]
- 64.Zamponi GW, Striessnig J, Koschak A, Dolphin AC. The Physiology, Pathology, and Pharmacology of Voltage-Gated Calcium Channels and Their Future Therapeutic Potential. Pharmacol Rev 2015; 67(4): 821–870. [DOI] [PMC free article] [PubMed] [Google Scholar]
- 65.Gangarossa G, Laffray S, Bourinet E, Valjent E. T-type calcium channel Cav3.2 deficient mice show elevated anxiety, impaired memory and reduced sensitivity to psychostimulants. Front Behav Neurosci 2014; 8: 92. [DOI] [PMC free article] [PubMed] [Google Scholar]
- 66.Leresche N, Lambert RC. T-type calcium channels in synaptic plasticity. Channels (Austin) 2017; 11(2): 121–139. [DOI] [PMC free article] [PubMed] [Google Scholar]
- 67.Iaccarino HF, Singer AC, Martorell AJ, Rudenko A, Gao F, Gillingham TZ et al. Gamma frequency entrainment attenuates amyloid load and modifies microglia. Nature 2016; 540(7632): 230–235. [DOI] [PMC free article] [PubMed] [Google Scholar]
- 68.Yao Y, Zhang W, Ming R, Deng Q, Zuo A, Zhang S et al. Noninvasive 40-Hz Light Flicker Rescues Circadian Behavior and Abnormal Lipid Metabolism Induced by Acute Ethanol Exposure via Improving SIRT1 and the Circadian Clock in the Liver-Brain Axis. Front Pharmacol 2020; 11: 355. [DOI] [PMC free article] [PubMed] [Google Scholar]
- 69.Xing F, Fang X, Gong XD, Zhao X, Du Y, Ma ZL et al. Photoacoustic treatment mitigates cognitive dysfunction in a model of sleep-wake rhythm disturbance. Neural Regen Res 2020; 15(6): 1094–1101. [DOI] [PMC free article] [PubMed] [Google Scholar]
- 70.Zheng L, Yu M, Lin R, Wang Y, Zhuo Z, Cheng N et al. Rhythmic light flicker rescues hippocampal low gamma and protects ischemic neurons by enhancing presynaptic plasticity. Nat Commun 2020; 11(1): 3012. [DOI] [PMC free article] [PubMed] [Google Scholar]
- 71.Garza KM, Zhang L, Borron B, Wood LB, Singer AC. Gamma Visual Stimulation Induces a Neuroimmune Signaling Profile Distinct from Acute Neuroinflammation. J Neurosci 2020; 40(6): 1211–1225. [DOI] [PMC free article] [PubMed] [Google Scholar]
- 72.Mientjes EJ, Willemsen R, Kirkpatrick LL, Nieuwenhuizen IM, Hoogeveen-Westerveld M, Verweij M et al. Fxr1 knockout mice show a striated muscle phenotype: implications for Fxr1p function in vivo. Hum Mol Genet 2004; 13(13): 1291–1302. [DOI] [PubMed] [Google Scholar]
- 73.Madisen L, Zwingman TA, Sunkin SM, Oh SW, Zariwala HA, Gu H et al. A robust and high-throughput Cre reporting and characterization system for the whole mouse brain. Nat Neurosci 2010; 13(1): 133–140. [DOI] [PMC free article] [PubMed] [Google Scholar]
- 74.Shen M, Wang F, Li M, Sah N, Stockton ME, Tidei JJ et al. Reduced mitochondrial fusion and Huntingtin levels contribute to impaired dendritic maturation and behavioral deficits in Fmr1-mutant mice. Nat Neurosci 2019. [DOI] [PMC free article] [PubMed] [Google Scholar]
- 75.Gao Y, Shen M, Dong Q, Kannan S, Hoang J, Eisinger BE et al. RGS6 mediates effects of voluntary running on adult hippocampal neurogenesis. Cell Rep 2020; (in press). [DOI] [PMC free article] [PubMed] [Google Scholar]
- 76.Franklin K, Paxinos G. The Mouse Brain in Stereotaxic Coordinates, Compact 3rd Edition. Academic Press; 2008. [Google Scholar]
- 77.Li Y, Stockton ME, Eisinger BE, Zhao Y, Miller JL, Bhuiyan I et al. Reducing histone acetylation rescues cognitive deficits in a mouse model of Fragile X syndrome. Nat Commun 2018; 9(1): 2494. [DOI] [PMC free article] [PubMed] [Google Scholar]
- 78.Swiech L, Heidenreich M, Banerjee A, Habib N, Li YQ, Trombetta J et al. In vivo interrogation of gene function in the mammalian brain using CRISPR-Cas9. Nat Biotechnol 2015; 33(1): 102–U286. [DOI] [PMC free article] [PubMed] [Google Scholar]
- 79.Sanjana NE, Shalem O, Zhang F. Improved vectors and genome-wide libraries for CRISPR screening. Nat Methods 2014; 11(8): 783–784. [DOI] [PMC free article] [PubMed] [Google Scholar]
- 80.Dong Q, Liu Q, Li R, Wang A, Bu Q, Wang KH et al. Mechanism and consequence of abnormal calcium homeostasis in Rett syndrome astrocytes. Elife 2018; 7. [DOI] [PMC free article] [PubMed] [Google Scholar]
- 81.Sun QQ, Zhou C, Yang WG, Petrus D. Continuous spike-waves during slow-wave sleep in a mouse model of focal cortical dysplasia. Epilepsia 2016; 57(10): 1581–1593. [DOI] [PMC free article] [PubMed] [Google Scholar]
- 82.Franchi SA, Macco R, Astro V, Tonoli D, Savino E, Valtorta F et al. A Method to Culture GABAergic Interneurons Derived from the Medial Ganglionic Eminence. Front Cell Neurosci 2017; 11: 423. [DOI] [PMC free article] [PubMed] [Google Scholar]
- 83.Li M, Shin J, Risgaard RD, Parries MJ, Wang J, Chasman D et al. Identification of FMR1-regulated molecular networks in human neurodevelopment. Genome Res 2020. [DOI] [PMC free article] [PubMed] [Google Scholar]
- 84.Jobe EM, Gao Y, Eisinger BE, Mladucky JK, Giuliani CC, Kelnhofer LE et al. Methyl-CpG-Binding Protein MBD1 Regulates Neuronal Lineage Commitment through Maintaining Adult Neural Stem Cell Identity. J Neurosci 2017; 37(3): 523–536. [DOI] [PMC free article] [PubMed] [Google Scholar]
- 85.Dobin A, Davis CA, Schlesinger F, Drenkow J, Zaleski C, Jha S et al. STAR: ultrafast universal RNA-seq aligner. Bioinformatics 2013; 29(1): 15–21. [DOI] [PMC free article] [PubMed] [Google Scholar]
- 86.Robinson MD, McCarthy DJ, Smyth GK. edgeR: a Bioconductor package for differential expression analysis of digital gene expression data. Bioinformatics 2010; 26(1): 139–140. [DOI] [PMC free article] [PubMed] [Google Scholar]
- 87.Walf AA, Frye CA. The use of the elevated plus maze as an assay of anxiety-related behavior in rodents. Nat Protoc 2007; 2(2): 322–328. [DOI] [PMC free article] [PubMed] [Google Scholar]
- 88.Deacon RM. Digging and marble burying in mice: simple methods for in vivo identification of biological impacts. Nat Protoc 2006; 1(1): 122–124. [DOI] [PubMed] [Google Scholar]
- 89.Allan AM, Liang X, Luo Y, Pak C, Li X, Szulwach KE et al. The loss of methyl-CpG binding protein 1 leads to autism-like behavioral deficits. Hum Mol Genet 2008; 17(13): 2047–2057. [DOI] [PMC free article] [PubMed] [Google Scholar]
- 90.Niu B, Liu P, Shen M, Liu C, Wang L, Wang F et al. GRK5 Regulates Social Behavior Via Suppression of mTORC1 Signaling in Medial Prefrontal Cortex. Cereb Cortex 2017: 1–12. [DOI] [PubMed] [Google Scholar]
- 91.Jin D, Liu HX, Hirai H, Torashima T, Nagai T, Lopatina O et al. CD38 is critical for social behaviour by regulating oxytocin secretion. Nature 2007; 446(7131): 41–45. [DOI] [PubMed] [Google Scholar]
- 92.Alsene KM, Rajbhandari AK, Ramaker MJ, Bakshi VP. Discrete forebrain neuronal networks supporting noradrenergic regulation of sensorimotor gating. Neuropsychopharmacology 2011; 36(5): 1003–1014. [DOI] [PMC free article] [PubMed] [Google Scholar]
Associated Data
This section collects any data citations, data availability statements, or supplementary materials included in this article.