

SUMMARY
Alzheimer’s disease (AD) is a devastating neurodegenerative disorder with no effective treatment. Diet, as a modifiable risk factor for AD, could potentially be targeted to slow disease onset and progression. However, complexity of the human diet and indirect effects of the microbiome make it challenging to identify protective nutrients. Multiple factors contribute to AD pathogenesis, including amyloid beta (Aβ) deposition, energy crisis, and oxidative stress. Here, we use Caenorhabditis elegans to define the impact of diet on Aβ proteotoxicity. We discover that dietary vitamin B12 alleviates mitochondrial fragmentation, bioenergetic defects, and oxidative stress, delaying Aβ-induced paralysis without affecting Aβ accumulation. Vitamin B12 has this protective effect by acting as a cofactor for methionine synthase, impacting the methionine/S-adenosylmethionine (SAMe) cycle. Vitamin B12 supplementation of B12-deficient adult Aβ animals is beneficial, demonstrating potential for vitamin B12 as a therapy to target pathogenic features of AD triggered by proteotoxic stress.
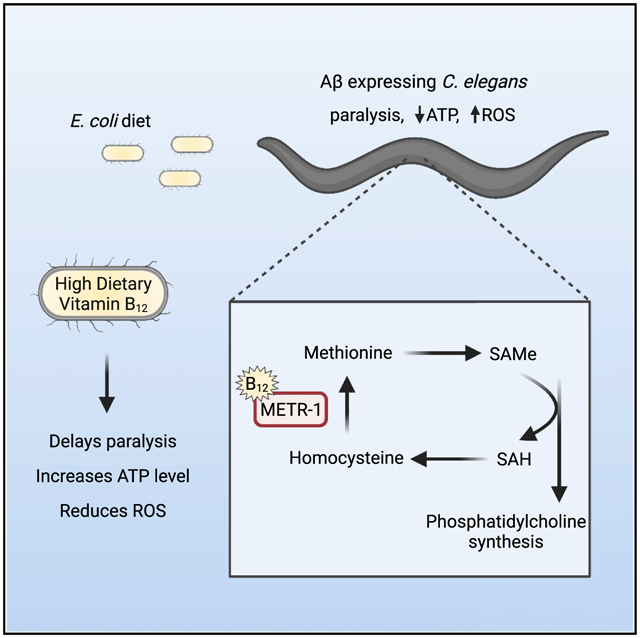
Graphical Abstract
In brief
Lam et al. discover that feeding a vitamin-B12-deficient diet to amyloid beta (Aβ)-expressing C. elegans accelerates paralysis, reduces ATP levels, and increases oxidative stress. Their results indicate that vitamin B12 affects the methionine/SAMe cycle to protect against Aβ-induced proteotoxicity.
INTRODUCTION
Alzheimer’s disease (AD), the most common cause of dementia, is a multifactorial neurodegenerative disorder characterized by accumulation of amyloid beta (Aβ) plaques, hyperphosphorylated tau, oxidative stress, mitochondrial defects, and impaired glucose metabolism (Butterfield and Halliwell, 2019; Chakravorty et al., 2019; Lin and Beal, 2006; Long and Holtzman, 2019). Some AD risk factors, including genetic predisposition and aging, are non-modifiable, while other risk factors, such as diet, can be altered to impact disease onset and progression (Thelen and Brown-Borg, 2020). Complex diets consist of macronutrients, including carbohydrates, fats, and proteins, as well as vitamin and mineral micronutrients. It is challenging to determine which individual nutrients are neuroprotective in humans as well as other mammals due to organismal complexity, genetic diversity, and consumption of complex diets. Indirect dietary effects of gut microbiota, which provide micronutrients to the host, further complicate studies.
Caenorhabditis elegans eat a simple diet of E. coli in the laboratory, and consumption of different bacterial strains affects nematode gene expression, metabolic profile, development, fertility, and fat storage (Brooks et al., 2009; Cabreiro et al., 2013; Cogliati et al., 2020; Han et al., 2017; MacNeil et al., 2013; Revtovich et al., 2019; Virk et al., 2012, 2016; Watson et al., 2014). With its genetic tools and short lifespan, C. elegans is an ideal system for the study of age-related diseases and has been used extensively to identify factors that influence Aβ proteotoxicity (Fang et al., 2019; Han et al., 2017; Hassan et al., 2015; Lublin and Link, 2013; Sorrentino et al., 2017; Teo et al., 2019). Transgenic expression of toxic human Aβ peptides in C. elegans body wall muscles generates robust time-dependent paralysis as well as AD-like pathological features, including defects in mitochondrial morphology, reduced ATP levels, and oxidative stress (Drake et al., 2003; Fonte et al., 2011; Link, 1995; McColl et al., 2012; Sorrentino et al., 2017). Our goal was to use C. elegans to define the impact of diet on Aβ-induced proteotoxicity.
We discovered that Aβ-expressing C. elegans fed HB101 E. coli exhibited delayed paralysis, higher ATP levels, decreased mitochondrial fragmentation, and reduced reactive oxygen species (ROS) compared to those raised on OP50 E. coli. Mild vitamin B12 deficiency was observed in animals grown on OP50, but not HB101. B12 supplementation delayed Aβ-induced paralysis and protected against the increase in ROS and energy crisis observed in animals fed OP50 but did not have additive beneficial impact on those that consumed HB101. The protective effects of vitamin B12 required methionine synthase, indicating function as an enzyme cofactor rather than an antioxidant, and the methionine/S-adenosylmethionine (SAMe) cycle. Vitamin B12 supplementation in adulthood was beneficial for B12-deficient C. elegans, suggesting that administration even late in life has potential as a therapeutic intervention.
RESULTS
Diet alters Aβ-induced paralysis in C. elegans
Genetic evidence suggests that Aβ-induced proteotoxicity is a causal factor in AD development (Chartier-Harlin et al., 1991; Goate et al., 1991; Long and Holtzman, 2019). Little correlation between the density of extracellular Aβ plaques and AD severity (Chen et al., 2017; De Strooper and Karran, 2016) suggests that the toxic effects likely result from small soluble Aβ oligomers, which can enter lipid bilayers (Cline et al., 2018; Pagani and Eckert, 2011). Transgenic expression of human Aβ1–42 in C. elegans muscles causes AD-like cellular abnormalities, including reduced ATP levels, defects in mitochondrial morphology, and oxidative stress, as well as robust time-dependent paralysis (Drake et al., 2003; Fonte et al., 2011; McColl et al., 2012). Altered time to paralysis has been used extensively to identify genes and pharmacological agents that influence Aβ-induced proteotoxicity (Cacho-Valadez et al., 2012; Han et al., 2017; Hassan et al., 2015; Lublin and Link, 2013; Sorrentino et al., 2017). While investigating the impact of genetic factors on Aβ-induced paralysis, we noticed that animals fed OP50 B-type E. coli consistently paralyzed faster than those given HT115(DE3), an RNase-III-deficient K12-derived E. coli used for RNA interference experiments. To determine if diet was impacting Aβ proteotoxicity, we raised Aβ animals on different E. coli diets and discovered that those fed HT115 or HB101, a B × K12 hybrid, exhibited a significant delay in paralysis compared to those that consumed OP50 (Figures 1A, S1A, and S1B).
Figure 1. Diet impacts Aβ-induced paralysis, energy availability, oxidative stress, and mitochondrial morphology without altering Aβ accumulation.
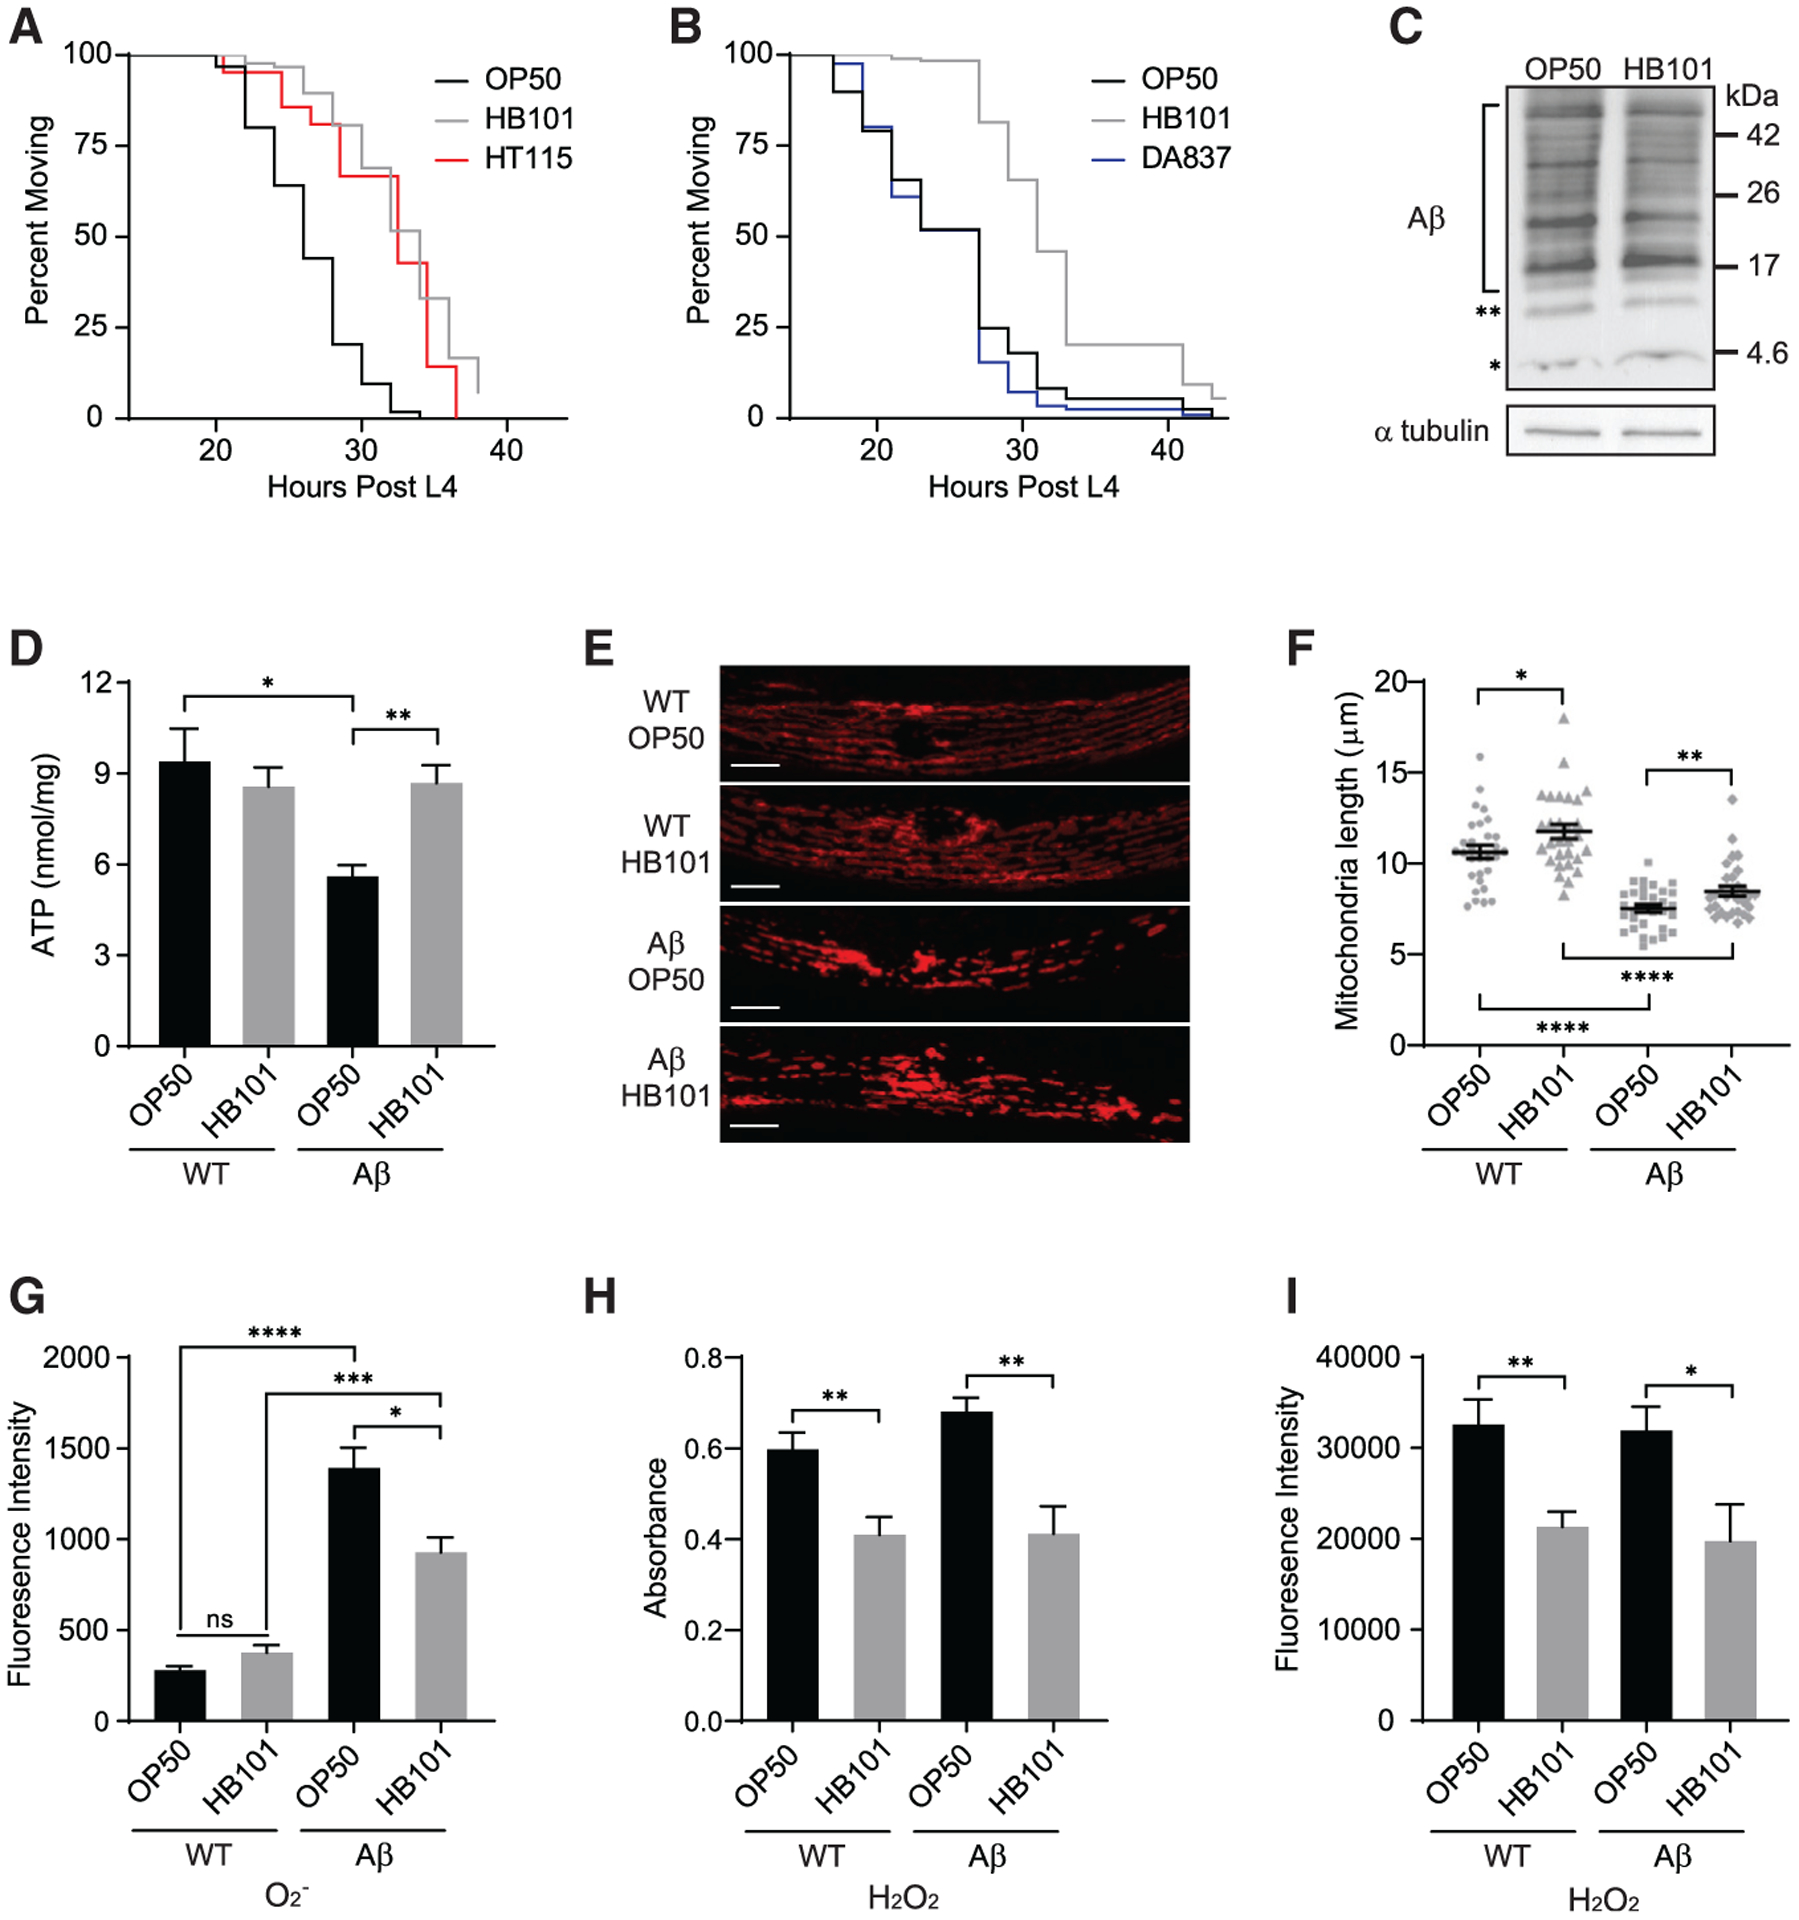
(A) Aβ animals fed HB101 (gray) and HT115 (red) exhibited delayed paralysis compared to those on OP50 (black) (n ≥ 89).
(B) Aβ animals fed DA837 (blue) and OP50 (black) became paralyzed at the same time (n ≥ 183).
(C) Western analysis showed no effect of diet on Aβ accumulation. The Aβ monomer and dimer are indicated by asterisks (* and **, respectively); bracket shows Aβ oligomers. Additional replicates are in Figure S1F.
(D) ATP levels in Aβ C. elegans fed OP50 were reduced compared to wild type (WT); the HB101 diet increased ATP in Aβ animals (n ≥ 10).
(E) Representative images of mitochondria, visualized with TOMM-20∷RFP, in WT and Aβ animals. Scale bars, 10 μm.
(F) Average mitochondrial length was affected by Aβ accumulation and diet; individual measurements (gray symbols, n ≥ 30) indicated.
(G) Superoxide (O2−), measured with MitoSox, was higher in Aβ animals fed OP50 versus HB101 (n ≥ 11).
(H) Hydrogen peroxide (H2O2) level, quantified with Amplex red, was greater in both WT and Aβ nematodes given OP50 (n ≥ 7).
(I) H2O2, measured with H2DCFDA, was increased in WT and Aβ animals fed OP50 (n ≥ 8).
Error bars show SEM; *p < 0.05, **p < 0.01, and ***p < 0.001, one-way ANOVA with Dunnett’s post-test. See also Figures S1 and S2.
Since caloric restriction reduces Aβ toxicity (Steinkraus et al., 2008), we first sought to determine if the altered time to paralysis was due to differences in bacterial growth or C. elegans feeding. We found no difference in bacterial concentration on OP50 and HB101 plates (Figure S1C) or pharyngeal pumping rates (Figure S1D) in C. elegans grown on the different diets. Aβ animals fed DA837, another E. coli B strain that is hard for worms to ingest (Shtonda and Avery, 2006), exhibited paralysis indistinguishable from those given OP50 (Figures 1B and S1A). Finally, the HB101 diet was still protective in an eat-2 mutant, which exhibits delayed Aβ-induced paralysis due to dietary restriction (Figure S1E; Steinkraus et al. 2008). Together, these results suggest that the diet-induced shift in paralysis was not due to changes in ingestion or dietary restriction.
Reducing Aβ levels delays paralysis (Sorrentino et al., 2017), so we next sought to establish if diet impacted Aβ content. We observed no difference in Aβ accumulation between animals raised on OP50 and HB101 using immunoblotting (Figures 1C and S1F). Through a genetic approach, we found that pek-1(ok275) and gcn-2(ok871), which alter protein synthesis (Baker et al., 2012; Rousakis et al., 2013; Shen et al., 2005), did not impact the HB101 protective effect (Figures S1G and S1H). Our results suggest that the HB101 diet delays Aβ-induced paralysis without affecting Aβ accumulation.
Diet impacts ATP levels, mitochondrial morphology, and ROS in Aβ animals
Bioenergetic deficits, which cause synaptic dysfunction in AD individuals, are exacerbated by Aβ accumulation (Chakravorty et al., 2019). C. elegans expressing Aβ exhibit a decrease in ATP levels and defects in electron transport chain complex activity, indicating that energy crisis is a fundamental consequence of Aβ buildup (Fang et al., 2019; Fong et al., 2016; Sorrentino et al., 2017; Teo et al., 2019). Therefore, we tested the impact of diet on ATP levels and found that Aβ animals fed HB101 had significantly higher ATP compared to those on OP50 (Figure 1D). Diet had no effect on ATP levels in wild-type C. elegans (Figure 1D), indicating that the dietary protection was only required for animals under proteotoxic stress.
To elucidate the mechanism underlying the diet-induced change in ATP level, we assessed mitochondrial gene transcripts, protein levels, morphology, and respiration activity. Transcript levels of genes required for oxidative phosphorylation (Figure S2A) and mitochondrial protein content (Figures S2B and S2C) were unchanged between Aβ animals fed different diets. Aβ expression disrupts mitochondrial network integrity, which is important for bioenergetic efficiency (Figure 1E; Fonte et al., 2011; Sorrentino et al., 2017). C. elegans muscle mitochondria are arranged in a periodic pattern that can be visualized with red fluorescent protein (RFP)-tagged TOMM-20 (Wei and Ruvkun, 2020). We quantified mitochondria length and found that the HB101 diet reduced fragmentation in both wild-type and Aβ animals (Figure 1F). To assess if these changes in mitochondrial morphology impacted cellular respiration, we used a Seahorse XFe96 Analyzer. Aβ expression caused a significant change in basal respiration rate, maximal respiration rate, and spare respiratory capacity; however, diet did not alter mitochondrial respiration in either wild-type or Aβ nematodes (Figures S2D–S2F). While it remains possible that the severe mitochondrial fragmentation in Aβ animals alters respiration, the dietary impact on morphology did not change mitochondrial function. Instead, diet likely affects ATP levels by altering glycolytic output or energy expenditure.
Ab accumulation promotes production of ROS including super-oxide (O2−) and hydrogen peroxide (H2O2). Oxidative stress, stemming from an imbalance between ROS formation and antioxidant defenses, plays a causal role in AD pathogenesis (Butterfield and Halliwell, 2019; Drake etal., 2003; Wang etal., 2014).Therefore, we investigated the impact of Aβ and diet on O2− and H2O2 levels using ROS indicators. Expression of Aβ resulted in a substantial increase in O2−, but Aβ animals fed HB101 had significantly reduced O2− levels compared to those raised on OP50 (Figure 1G). Both wild-type and Aβ C. elegans raised on OP50 exhibited significantly higher H2O2 than those on HB101 (Figures 1H and 1I). In conclusion, diet impacts ATP level, mitochondrial fragmentation, and ROS accumulation in Aβ-expressing C. elegans.
Vitamin B12 protects against Aβ-induced paralysis and energy deficits
OP50 and HB101 differ in carbohydrate content and fatty acid composition (Brooks et al., 2009; Neve et al., 2020; Revtovich et al., 2019). Thus, we considered whether differences in macronutrients could alter the paralysis of Aβ worms. Supplementation of plates with glucose (Figures 2A and S3A) or oleic acid (Figures 2B, S3A, and S3B) did not eliminate the dietary shift in Aβ-induced paralysis, suggesting that these macronutrients are not responsible for the impact of diet. However, Aβ animals raised on OP50 supplemented with glucose paralyzed significantly faster than those fed OP50 alone, consistent with reports of excess glucose shortening lifespan (Lee et al., 2009; Schulz et al., 2007). Supplementation of HB101 plates with glucose had no effect (Figures 2A and S3A), suggesting that the nutrient in HB101 that protects against Aβ proteotoxicity may also defend against the detrimental consequences of high glucose.
Figure 2. Vitamin B12 is the protective factor in the HB101 diet.
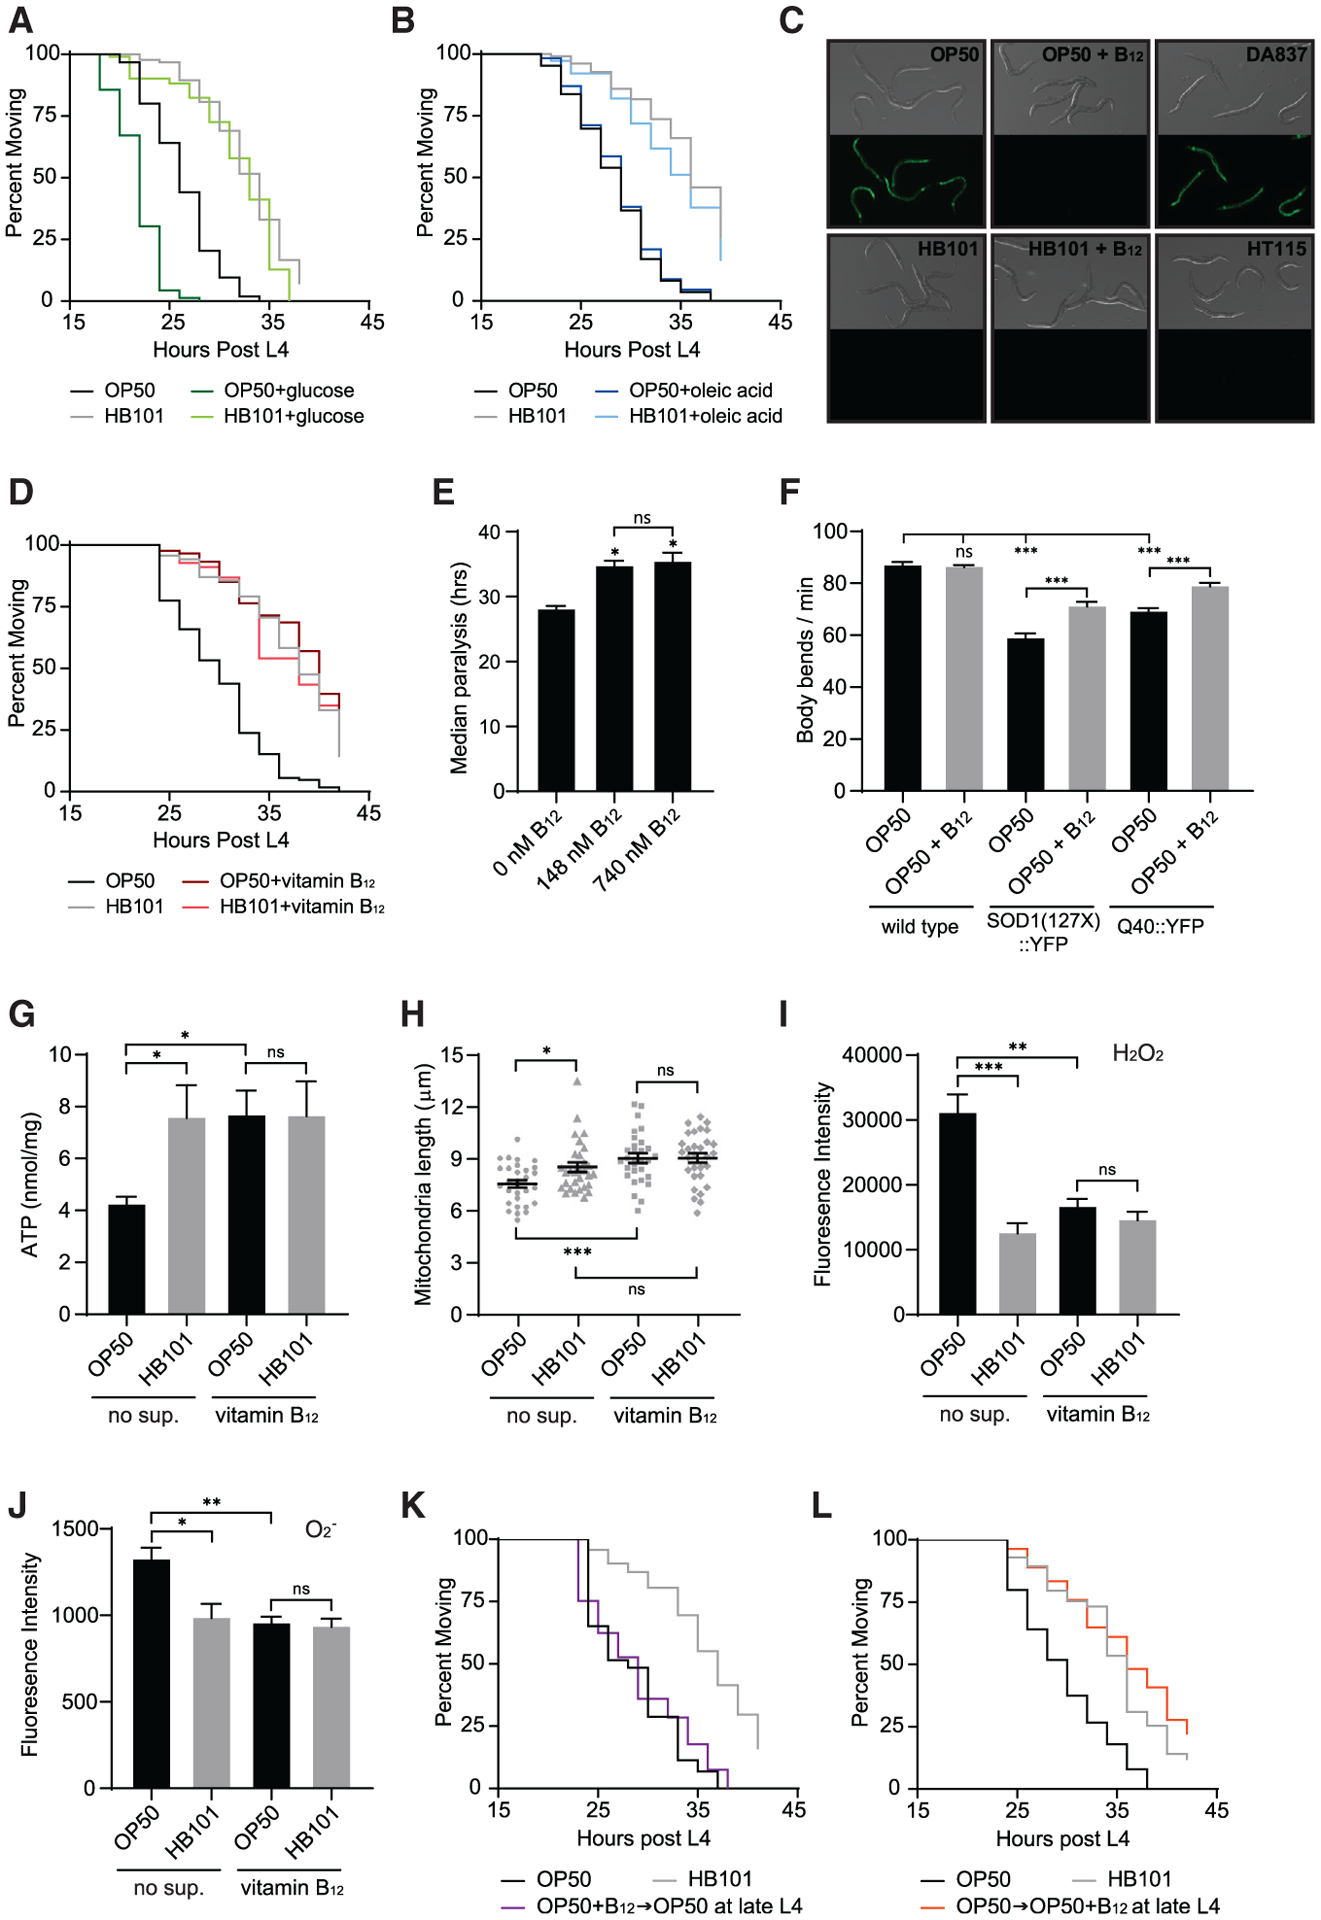
(A) Supplementation with 10 mM glucose accelerated paralysis of Aβ animals fed OP50 but did not eliminate the dietary shift (n ≥ 102).
(B) Supplementation with 0.3 mM oleic acid did not affect Aβ-induced paralysis (n ≥ 174).
(C) Pacdh-1∷GFP expression was induced in animals fed OP50 and DA837, but not OP50+B12, HB101, HB101+B12, and HT115.
(D) Supplementation with 148 nM vitamin B12 eliminated the impact of bacterial diet on paralysis of Aβ animals (n ≥ 139).
(E) Supplementation with 740 nM B12 had no added protective effect compared to 148 nM B12 (n = 3); *p < 0.05 compared to the no-supplementation control.
(F) B12 supplementation enhanced motility in C. elegans models of amyotrophic lateral sclerosis (ALS) and Huntington’s disease but did not affect the WT (n = 15).
(G) Vitamin B12 increased ATP levels in Aβ animals fed OP50 compared to those without B12 supplementation (no sup.; n = 6).
(H) Vitamin B12 increased average mitochondrial length in Aβ animals fed OP50 (n = 30).
(I) Vitamin B12 reduced H2O2, measured with H2DCFDA, in Aβ animals fed OP50 (n = 9).
(J) Vitamin B12 decreased O2−, measured with MitoSox, in Aβ animals fed OP50 (n ≥ 6).
(K) Transfer of Aβ animals from OP50 plus vitamin B12 plates to B12-free OP50 plates at the end of L4 eliminated the B12 protective effect (n ≥ 132).
(L) Transfer of Aβ animals fed OP50 to OP50 plates supplemented with B12 at the end of L4 delayed paralysis (n ≥ 54).
Error bars show SEM; *p < 0.05, **p < 0.01, and ***p < 0.001 one-way ANOVA with Dunnett’s post-test. See also Figures S2 and S3.
E. coli strains also differ in micronutrient content and C. elegans, like humans, must obtain several essential vitamins from their diet. Mild vitamin B12 deficiency is observed in animals fed OP50, which has reduced expression of the tonB transporter that mediates B12 uptake (Revtovich et al., 2019; Watson et al., 2014). C. elegans vitamin B12 status can be assessed using a Pacdh-1∷GFP reporter, which is expressed in response to propionic acid accumulation resulting from B12 deficiency (MacNeil et al., 2013; Revtovich et al., 2019; Watson et al., 2014, 2016; Wei and Ruvkun, 2020). GFP was highly expressed in animals grown on OP50 and DA837, the diets that led to faster paralysis of Aβ worms, and B12 supplementation suppressed GFP expression (Figure 2C). In contrast, GFP expression was repressed in C. elegans raised on the HB101 and HT115 protective diets, suggesting high B12 levels (Figure 2C). Supplementation of OP50 plates with 148 nM vitamin B12 eliminated the dietary shift in Aβ-induced paralysis (Figure 2D). Further increasing B12 concentration in OP50 plates by 5-fold as well as addition of vitamin B12 to HB101 plates had no added protective effect (Figures 2E and S3A). Misfolded aggregation prone proteins underlie many neurodegenerative diseases. We found that B12 supplementation also had a protective effect in C. elegans models of amyotrophic lateral sclerosis (ALS) and Huntington’s disease (Figure 2F), suggesting that B12 may protect against shared cellular defects resulting from proteotoxic stress.
We next sought to determine the impact of vitamin B12 on ATP availability, mitochondrial morphology, and ROS levels. Aβ animals fed B12 supplemented OP50 had significantly higher ATP levels compared to non-supplemented counterparts, while B12 had no effect on animals raised on HB101 (Figure 2G). Vitamin B12 supplementation did not alter mitochondrial gene transcription, protein levels, or respiration (Figures S2B–S2F) but did reduce mitochondrial fragmentation in Aβ animals fed OP50 without impacting mitochondria length in those raised on HB101 (Figure 2H). Severe B12 deficiency in C. elegans increases H2O2 content and decreases antioxidant defense (Bito et al., 2017). We found that addition of vitamin B12 to OP50 plates significantly reduced H2O2 and O2− in Aβ animals to levels observed in those raised on HB101 (Figures 2I and 2J). Together, these results show that vitamin B12 supplementation has a protective effect on Aβ animals fed the OP50 diet.
Vitamin B12 given during adulthood has protective effects
Subclinical B12 deficiency is common primarily in older individuals (Green et al., 2017). Thus, we sought to determine if manipulation of B12 availability during adulthood affected Aβ proteotoxicity in C. elegans. Animals grown on OP50 plates supplemented with vitamin B12 and then transferred to B12-free OP50 plates at the end of the fourth larval stage (L4) exhibited Aβ-induced paralysis indistinguishable from animals raised on OP50 their entire life (Figures 2K and S3C). This demonstrates that a decrease in vitamin B12 during adulthood exacerbates Aβ proteotoxicity. Furthermore, Aβ animals first grown on OP50 and then transferred to OP50 plates supplemented with B12 at the end of L4 exhibited the same delay in paralysis as those fed a vitamin-B12-rich diet their entire lifespan (Figures 2L and S3C). These results suggest potential benefit for dietary vitamin B12 supplementation later in life.
Protective effects of dietary B12 require methionine synthase
Vitamin B12 is an essential cofactor for methylmalonyl-coenzyme A (methylmalonyl-CoA) mutase (C. elegans MMCM-1), which converts methylmalonyl-CoA to succinyl-CoA in the propionyl-CoA breakdown pathway, and methionine synthase (C. elegans METR-1), which converts homocysteine (Hcy) to methionine in the methionine/SAMe cycle (Figure 3A). To define which pathway is required for the B12 protective effects, we determined the impact of mutations in mmcm-1(ok1637); propionyl-CoA carboxylase pcca-1(ok2282), which acts upstream of mmcm-1; and metr-1(ok521) on Aβ-induced paralysis. Loss of pcca-1 and mmcm-1 had no effect on the diet-induced shift in paralysis observed for Aβ animals grown on the different E. coli (Figures 3B, 3C, S4A, and S4B). However, the dietary shift was eliminated in metr-1 mutants, which exhibited an even more severe phenotype than OP50-raised Aβ animals, which have only mild vitamin B12 deficiency (Figures 3D and S4C). Consistent with the behavioral data, loss of metr-1 in Aβ animals reduced ATP levels and abolished the HB101 protective effect (Figure 3E). ROS content was also indistinguishable between metr-1 Aβ animals raised on OP50 and HB101, though loss of metr-1 caused an overall reduction in ROS levels (Figures 3F and 3G).
Figure 3. The methionine/SAMe cycle is required for the protective effects of vitamin B12.
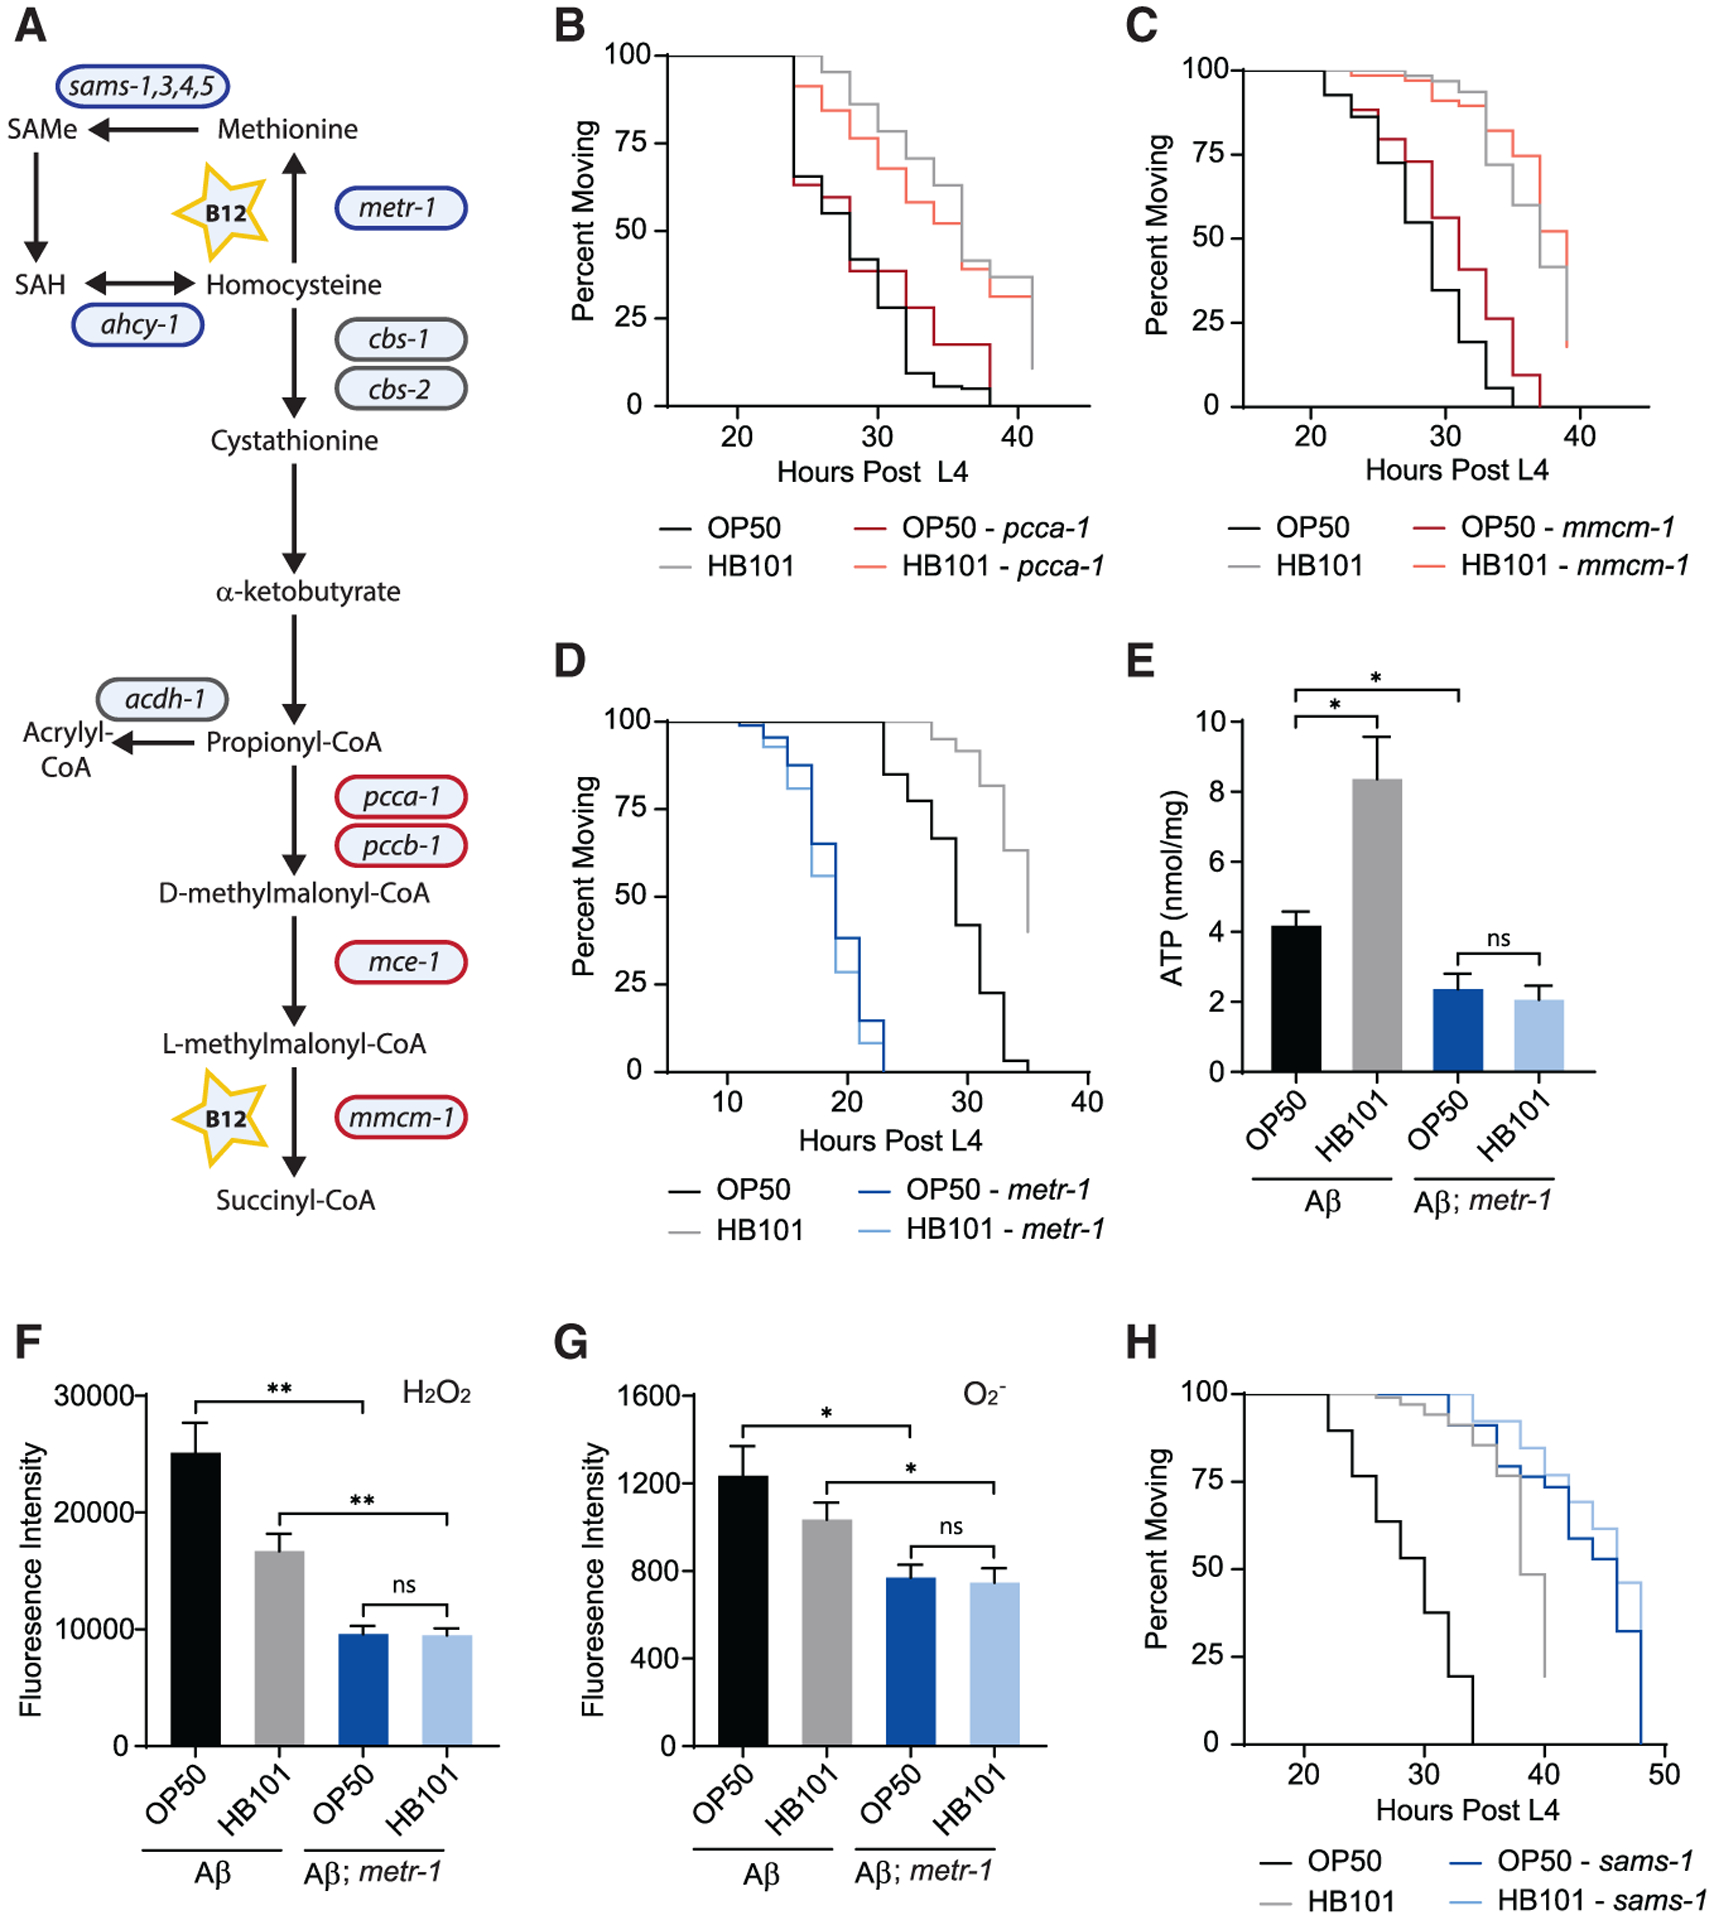
(A) Diagram of vitamin-B12-dependent pathways in C. elegans. Genes encoding enzymes that function in the methionine/SAMe cycle (blue) and the canonical B12 pathway (red) are indicated. SAMe, S-adenosylmethionine; SAH, s-adenosyl-l-homocysteine.
(B) pcca-1(ok2282) had no effect on the diet-induced shift in paralysis of Aβ animals (n ≥ 57).
(C) Loss of mmcm-1(ok1637) did not eliminate the dietary shift (n ≥ 67).
(D) metr-1(ok521) accelerated Aβ-induced paralysis and eliminated the impact of E. coli diet (n ≥ 60).
(E) In metr-1 mutant Aβ animals, ATP levels were low and unaffected by diet (n ≥ 7).
(F) H2O2 levels were unaffected by diet in metr-1 mutant Aβ animals (n = 4).
(G) O2− levels were unaffected by diet in metr-1 mutant Aβ animals (n ≥ 6).
(H) sams-1(ok2946) delayed Aβ-induced paralysis and eliminated the dietary shift (n ≥ 26).
Error bars show SEM; *p < 0.05 and ***p < 0.001, one-way ANOVA with Dunnett’s post-test. See also Figure S4.
The methionine/SAMe cycle, transsulfuration pathway, folate cycle, and polyamine biosynthesis are all disrupted in the metr-1 mutant. We found that loss of the SAMe synthetase SAMS-1, which catalyzes conversion of methionine to SAMe, eliminated the dietary shift and delayed Aβ-induced paralysis (Figures 3H and S4D). The opposite effect of the metr-1 and sams-1 mutations on time to paralysis is consistent with other previously observed phenotypes (Cabreiro et al., 2013). The elimination of dietary impact on Aβ-induced paralysis in both mutants suggests that the methionine/SAMe pathway is required for vitamin B12 protection.
Methionine and choline supplementation is protective in B12-deficient Aβ animals
B12 deficiency reduces methionine synthase activity and can lead to Hcy accumulation (Figure 4A; Andra et al., 2021). We found that Aβ animals grown on OP50 had significantly increased Hcy, which was reduced by B12 supplementation (Figure 4B). Hyperhomocysteinemia is a modifiable risk factor for AD and results in oxidative stress (Bito et al., 2017; Smith and Refsum, 2016); thus, we sought to determine the effect of Hcy on Aβ-induced paralysis. Hcy supplementation accelerated paralysis of Aβ animals raised on OP50 and HB101 but did not change the dietary shift (Figures 4C and S4E). This suggests that the increased Hcy in animals fed OP50 did not underlie the effect of low dietary vitamin B12. We next considered whether methionine level could impact Aβ toxicity. Methionine supplementation eliminated the dietary shift in paralysis (Figure 4D), having a beneficial effect on Aβ animals fed OP50 and a detrimental impact on those grown on HB101 (Figures 4D, S4F, and S4G). To establish if methionine acts directly in C. elegans or indirectly by altering bacterial metabolism, we determined if methionine supplementation could rescue the metr-1 mutant, which is completely dependent on exogenous methionine (Hannich et al., 2009). Addition of methionine significantly delayed Aβ-induced paralysis and increased ATP in the metr-1 mutant to the level observed in Aβ animals raised on OP50 (Figures 4E–4G). Bacterial diet did not affect the paralysis of Aβ-expressing metr-1 mutants grown on plates supplemented with methionine (Figure 4F). Together, these results suggest that the impact of methionine supplementation is not due to a change in bacterial metabolism.
Figure 4. Methionine and choline supplementation reduce Aβ proteotoxic effects in B12-deficient animals.
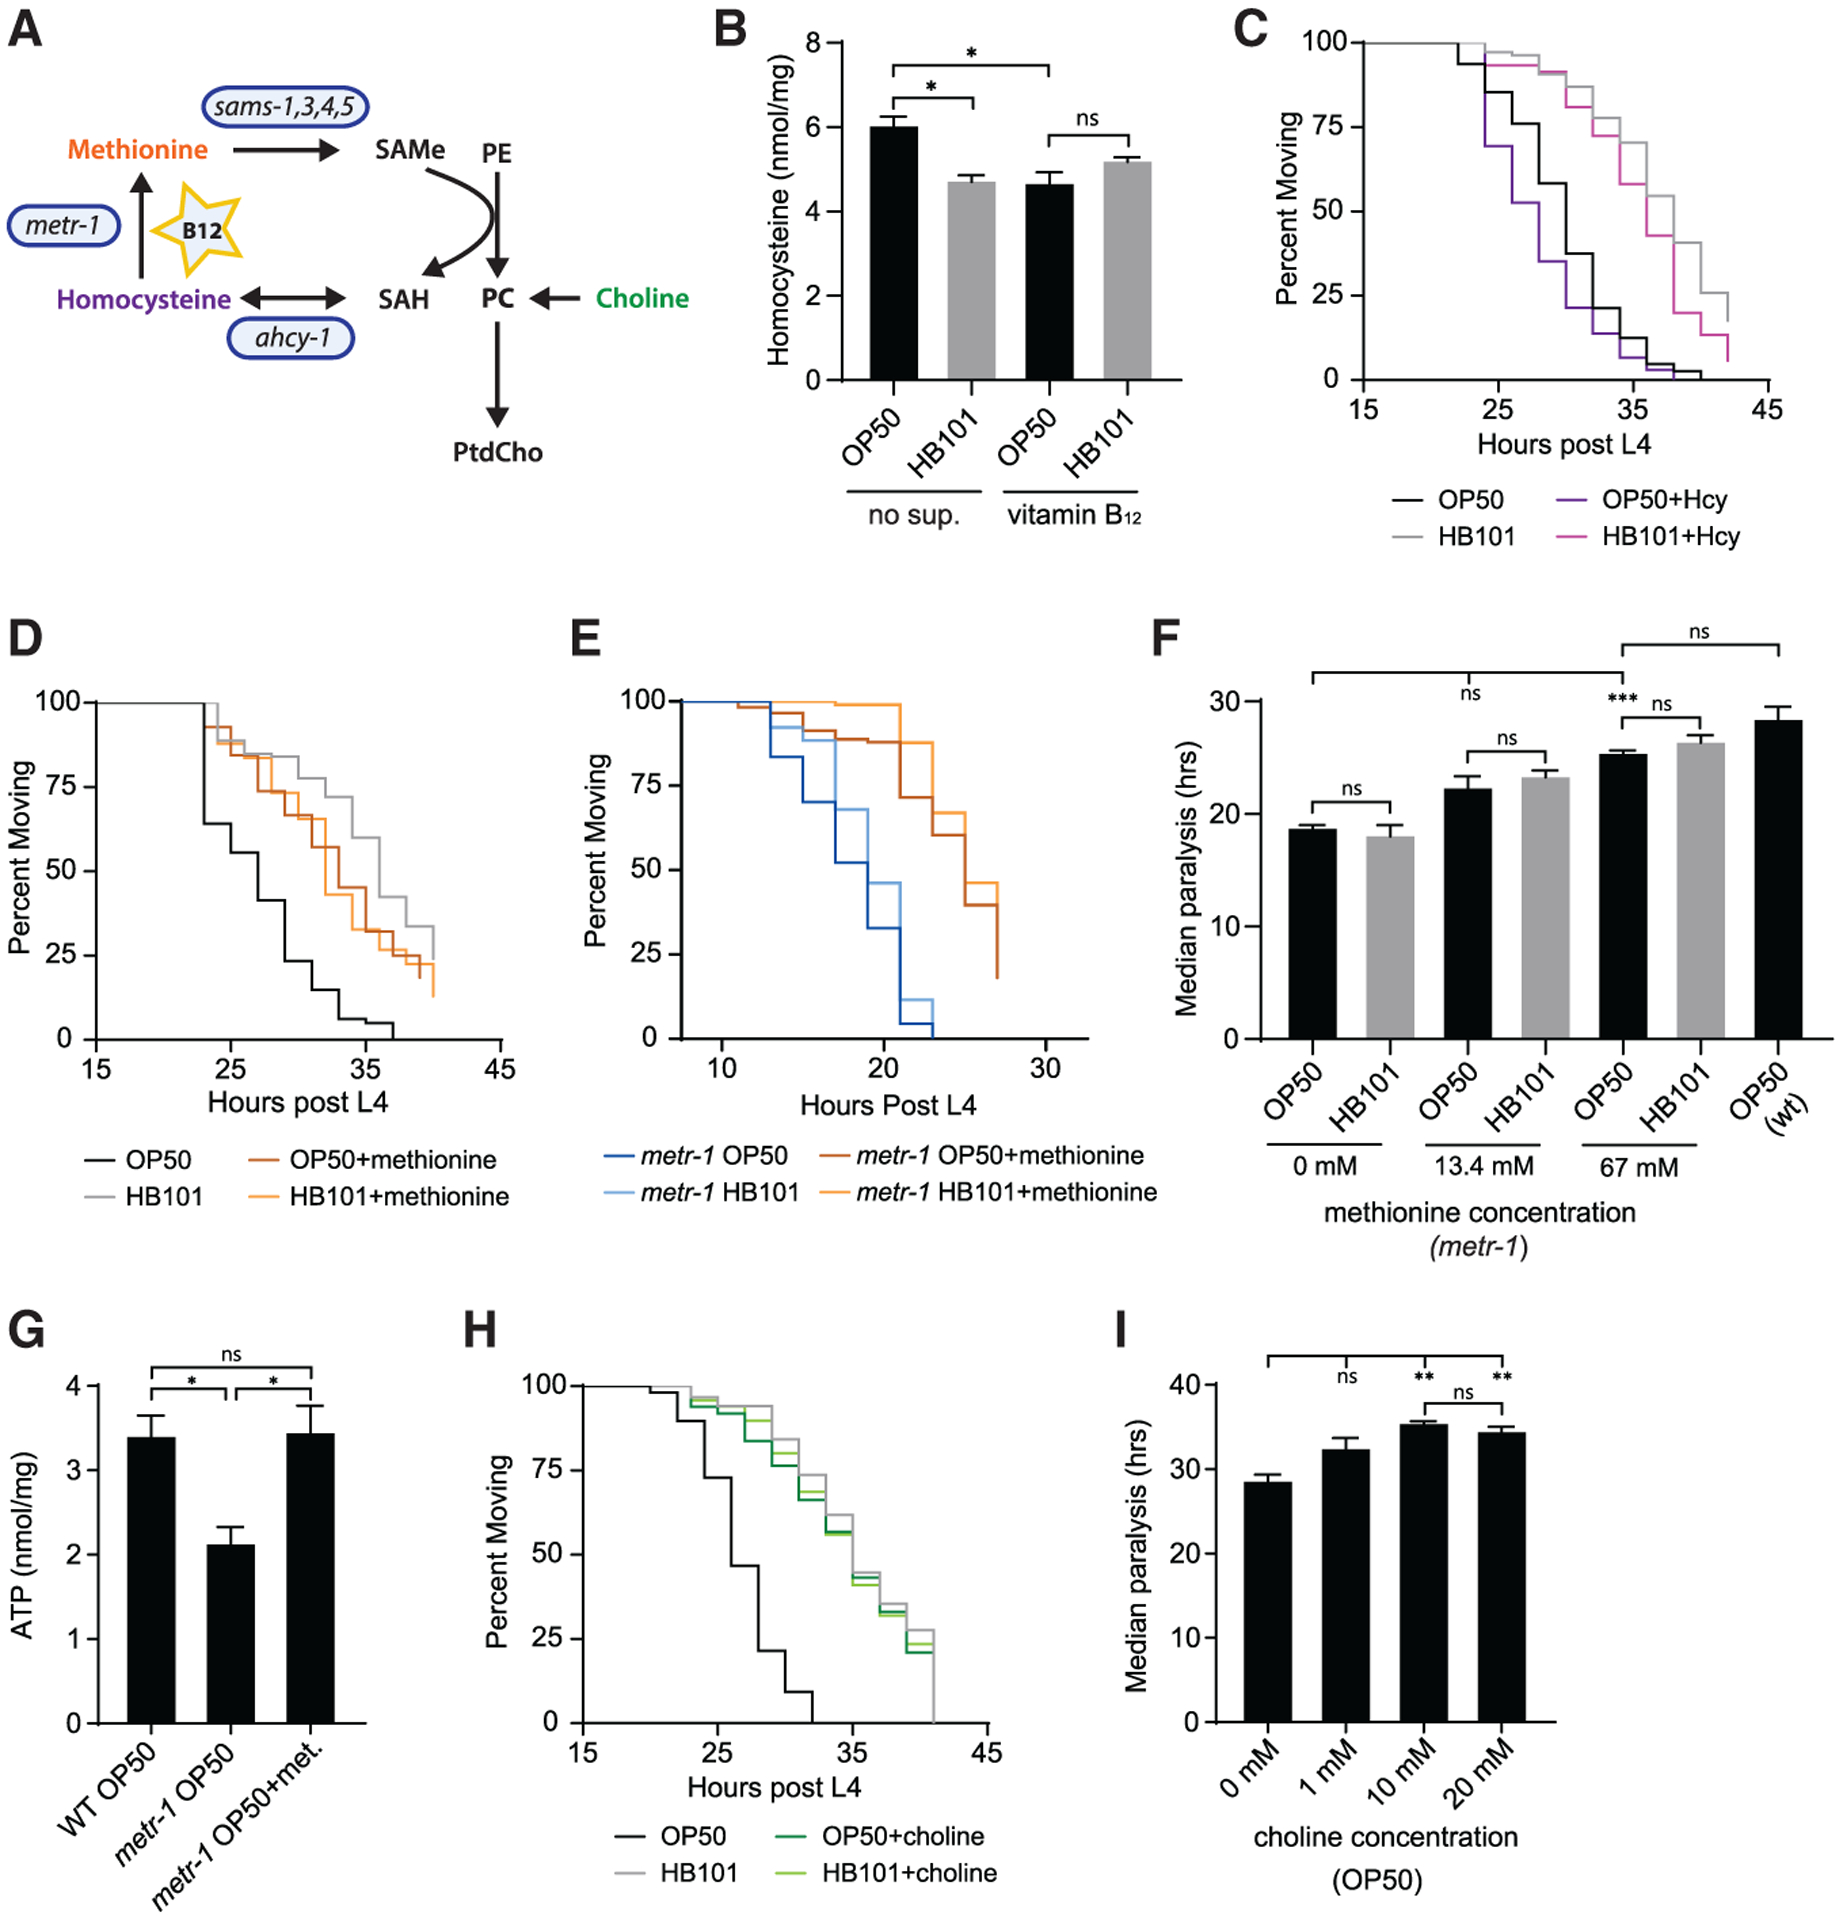
(A) Schematic diagram shows link between the vitamin-B12-dependent methionine/SAMe cycle (blue) and phospholipid biosynthesis. SAH, s-adenosyl-l-homocysteine; PE, phosphoethanolamine; PC, phosphocholine; PtdCho, phosphatidylcholine. PtdCho can be synthesized from choline or methylation of PE.
(B) Aβ animals grown on OP50 had higher levels of Hcy compared to those raised on HB101- or B12-supplemented plates (n = 4).
(C) Supplementation with 15 mM Hcy accelerated paralysis of Aβ animals grown on both OP50 and HB101 but did not eliminate the dietary shift (n ≥ 105).
(D) Supplementation with 13.4 mM L-methionine eliminated the diet-induced shift in paralysis (n ≥ 116).
(E) Methionine supplementation (67 mM) delayed Aβ-induced paralysis in the metr-1 mutant (n ≥ 67).
(F) Supplementation of the metr-1 mutant with 13.4 mM and 67 mM methionine delayed the median time to Aβ-induced paralysis (n ≥ 3).
(G) Supplementation with 67 mM methionine caused a significant increase in ATP in the metr-1 mutant (n ≥ 4).
(H) Supplementation with 10 mM choline eliminated the impact of bacterial diet on Aβ-induced paralysis (n ≥ 107).
(I) Choline concentration above 10 mM had no additional protective effect (n ≥ 3).
Error bars show SEM; *p < 0.05, **p < 0.01, and ***p < 0.001, one-way ANOVA with Dunnett’s post-test. See also Figure S4.
The loss of the dietary shift in Aβ-induced paralysis in the sams-1 mutant (Figure 3H) suggested that the methionine/SAMe cycle is required for the protective effects of B12. SAMe, the main methyl donor in cells, is utilized by many methyltransferases, which transfer methyl groups to nucleic acids, histones, and phospholipids. Since addition and removal of vitamin B12 beginning at adulthood has beneficial and detrimental effects, respectively (Figures 2K and 2L), we reasoned that it was unlikely that SAMe impacted paralysis by having an effect on DNA and protein methylation that regulates transcription. Phosphatidylcholine (PtdCho), a major component of membranes, can be synthesized by SAMe-dependent methylation of phosphoethanolamine or directly from choline through the Kennedy pathway (Figure 4A; Brendza et al., 2007; Palavalli et al., 2006), and reduced PtdCho has been observed in individuals with AD (Whiley et al., 2014). Supplementation of OP50 plates with choline delayed Aβ-induced paralysis, eliminating the dietary shift (Figure 4H). Choline provided no protection for Aβ animals fed HB101, and further increasing choline concentration did not have additional benefit for those fed OP50 (Figures 4H and 4I). These data are consistent with a model in which vitamin-B12-dependent methionine/SAMe cycle activity increases PtdCho production to reduce Aβ proteotoxic effects.
DISCUSSION
Diet is a modifiable risk factor for AD; however, the impact of specific nutrients on disease onset and progression is difficult to define due to human genetic diversity and diet complexity. Here, we used the genetically tractable nematode C. elegans, which consumes a simple E. coli diet, and discovered that vitamin B12 reduces Aβ proteotoxicity. In Aβ-expressing animals, vitamin B12 increased ATP levels, reduced mitochondrial fragmentation, and decreased ROS but did not impact Aβ levels. Currently, there is no effective disease-modifying treatment for AD, and therapeutics designed to reduce Aβ levels have failed (Long and Holtzman, 2019). Our results suggest that vitamin B12 supplementation could be a therapeutic approach to target energy crisis and oxidative stress, pathogenic features of AD triggered by Aβ accumulation.
Subclinical B12 deficiency is common, with a prevalence of 10%–15% among individuals older than 60 years and up to 35% among those older than 80 years (Green et al., 2017), and low B12 status may be a modifiable risk factor for AD (Vogiatzoglou et al., 2008). Meta-analyses of clinical trials have suggested that administration of B vitamins does not prevent cognitive decline (Clarke et al., 2014; Ford and Almeida, 2019). However, most participants did not exhibit preexisting cognitive defects, trial durations were insufficient to observe cognitive decline, and prior B12 status was not considered. Our results show that vitamin B12 supplementation was beneficial for Aβ-expressing C. elegans with mild B12 deficiency but did not offer additional protection for non-deficient animals. Consistent with our work, studies focused on individuals with low dietary vitamin B showed that supplementation with B vitamins preserved cognition (Kang et al., 2008) and slowed brain atrophy (Smith et al., 2010). Thus, the therapeutic potential for vitamin B12 is likely dependent on preexisting B12 status. How genetic profile and other components of the complex human diet further impact probability of vitamin B12 therapeutic success will need to be resolved.
Reduced ATP level hinders cellular ability to maintain ionic gradients, leading to increased intracellular Ca2+, synaptic dysfunction, and neuronal death, as observed in AD pathogenesis. Mild vitamin B12 deficiency led to reduced ATP in Aβ-expressing, but not wild-type, C. elegans, suggesting that low B12 status is detrimental during proteotoxic stress. Despite decreasing mitochondrial fragmentation, we found vitamin B12 did not prevent Aβ-induced defects in cellular respiration. Rather, B12 status appears to have an impact on the Aβ-induced energy crisis that precedes mitochondrial dysfunction (Fong et al., 2016). Both Aβ oligomers and oxidative stress can induce membrane damage, which leads to ion leakage and necessitates increased ATP expenditure by ATPases to maintain ionic gradients and membrane potential (Butterfield and Halliwell, 2019; Ronquist and Waldenström, 2003; Yang et al., 2017). Glycolysis is the dominant ATP production pathway used to fuel plasma membrane ATPases (Ronquist and Waldenström, 2003; Yellen, 2018), and studies suggest a link between impaired glucose metabolism and the severity of neurodegenerative diseases (An et al., 2018; Zhang et al., 2021). We found that dietary vitamin B12 reduced energy crisis and was protective in C. elegans models of AD, Huntington’s disease, and ALS.
Vitamin B12 causes resistance to pathogen stress in C. elegans, and this requires the methylmalonyl-CoA mutase MMCM-1 (Revtovich et al., 2019). In contrast, our work showed that loss of metr-1 or sams-1 eliminated the effect of diet on Aβ-induced paralysis, suggesting that B12 defends against proteotoxic stress by acting as a cofactor for methionine synthase, impacting the methionine/SAMe cycle. While methionine restriction results in epigenetic changes that extend lifespan in many organisms, including C. elegans (Grandison et al., 2009; Orentreich et al., 1993; Parkhitko et al., 2019), our work suggests that a reduction in methionine synthase activity is detrimental for nematodes under proteotoxic stress. Reduced methionine lowers SAMe, which is required for methylation-dependent synthesis of PtdCho. Altered ratios of phospholipids can influence energy metabolism as well as ion leak across the plasma membrane (Ronquist and Waldenström, 2003; van der Veen et al., 2017), and reduced PtdCho has been observed in individuals with AD (Whiley et al., 2014). Here, we found that choline supplementation, which increases PtdCho synthesis via the Kennedy pathway (Walker et al., 2011), eliminated the effect of vitamin B12 on paralysis of Aβ animals. Together, our results support a model in which vitamin B12 status impacts methionine/SAMe-cycle-dependent phospholipid homeostasis to protect against Aβ-induced proteotoxicity.
STAR★METHODS
RESOURCE AVAILABILITY
Lead contact
Further information and reagent requests should be directed to and will be fulfilled by the lead contact, Jessica Tanis (jtanis@udel.edu).
Materials availability
C. elegans strains generated from our studies will be provided upon request. The University of Delaware Material Transfer Agreement Request Webform will be completed when research materials are transferred to an outside party.
Data and code availability
All original data have been deposited at Mendeley Data and are publicly available as of the date of publication; DOI is listed in the key resources table.
KEY RESOURCES TABLE
| REAGENT or RESOURCE | SOURCE | IDENTIFIER |
|---|---|---|
| Antibodies | ||
| anti-β-Amyloid 6E10 | BioLegend | Cat#803001; RRID: AB_2564653 |
| anti-α-tubulin A11 | Millipore Sigma | Cat#T9026; RRID: AB_477593 |
| Anti-NDUFS3 | Abcam | Cat#ab14711; RRID: AB_301429 |
| Goat anti-Mouse IgG (H+L) Secondary Antibody, HRP | ThermoFisher Scientific | Cat#31430; RRID: AB_228307 |
| Bacterial and virus strains | ||
| Escherichia coli OP50 | Caenorhabditis Genetics Center (CGC) | N/A |
| Escherichia coli HB101 | CGC | N/A |
| Escherichia coli HT115 | CGC | N/A |
| Escherichia coli DA837 | CGC | N/A |
| Chemicals, peptides, and recombinant proteins | ||
| D(+)-glucose | Fisher Scientific | Cat#: AC410955000 CAS: 50-99-7 |
| Sodium Homogamma Linolenate | Nu-Chek Prep | Cat#: S-1143, CAS: 65881-87-0 |
| Oleic Acid | ThermoFisher Scientific | Cat#:31997, CAS: 112-80-1 |
| Methylcobalamin | Millipore Sigma | Cat#: M9756, CAS: 13422-55-4 |
| L-methionine | Fisher Scientific | Cat#: AC166160025 CAS: 63-68-3 |
| DL-Homocysteine | Millipore Sigma | Cat#: H4628, CAS: 454-29-5 |
| Choline Chloride | Millipore Sigma | Cat#: C7017–5G, CAS:67-48-1 |
| Levamisole hydrochloride | Fisher Scientific | Cat#: AC187870100 CAS: 16595-80-5 |
| EDTA-free Protease Inhibitor cocktail | Roche | Cat#: 4693159001 |
| NP-40 | ThermoFisher Scientific | Cat#: 85124, CAS: 9016-45-9 |
| Sodium Dodecyl Sulfate | Fisher Bioreagents | Cat#: BP1311-200, CAS: 151-21-3,7732-18-5 |
| Sodium Chloride (NaCl) | Fisher Bioreagents | Cat#: BP358-1 CAS:7647-14-5 |
| 1M Tris-HCl pH 8.3 | Teknova | Cat#: T5083 |
| Tris Base | Fisher Bioreagents | Cat#: BP152-500, CAS: 77-86-1 |
| TRIS-buffered saline (TBS, 10x) | Alfa Aesar | Cat#: J62938-K2, CAS: 77-86-1 |
| Tween-20 | Fisher Bioreagents | Cat#: BP337-100 CAS: 9005-64-5 |
| Non-Fat Powdered Milk | Boston BioProducts | Cat#: P-1400 |
| β-meracaptoethanol | Fisher Scientific | Cat#: AC125470100 CAS: 60-24-2 |
| Bromophenol Blue | Fisher Scientific | Cat#: AC403140050 CAS: 115-39-9 |
| Urea | ThermoFisher Scientific | Cat#: 29700, CAS: 57-13-6 |
| Glycerol | Fisher Bioreagents | Cat#: BP229-1, CAS: 56-81-5 |
| 10x Tris/Glycine/SDS Buffer | BioRad | Cat#: 1210732 |
| Glycine | Fisher Bioreagents | Cat#: BP381-500 CAS:56-40-6 |
| Methanol | Fisher Chemical | Cat#: A454-4, CAS: 67-56-1 |
| 16.5% Mini-Protean Tris-Tricine Gel | BioRad | Cat#: 4563063 |
| 10% Mini-Protean TGX Precast Protein Gels | BioRad | Cat#: 4561033 |
| Trizol | ThermoFisher Scientific | Cat#: 15596018 |
| Chloroform | Crescent Chemical Co. | Cat#: 39553.01, CAS: 67-66-3 |
| RNase-Free DNase Set | QIAGEN | Cat#: 79254 |
| PowerUp SYBR Green Master Mix | Applied Biosystems | Cat#: A25741 |
| 0.5M EDTA pH 8.0 | Invitrogen | Cat#: 15575-038 |
| 2′7’-Dichlorofluorescin diacetate | Millipore Sigma | Cat#: D6883-250, CAS: 4091-99-0 |
| Nile Red | ThermoFisher Scientific | Cat#: N1142 |
| Agarose | Fisher Bioreagents | Cat#:BP160-500, CAS: 9012-36-6 |
| Carbonyl cyanide-p-trifluoromethoxyphenylhydrazone (FCCP) | Millipore Sigma | Cat#: C2920-10, CAS: 370-86-5 |
| DMSO (Dimethyl Sulfoxide) LC-MS Grade | ThermoFisher Scientific | Cat#: 85190, Cas:67-68-5 |
| Sodium Azide | Acros Organics | Cat#: 19038-1000, CAS: 26629-22-8 |
| Paraformaldehyde (16%) Solution EM Grade | Electron Microscopy Sciences | Cat#: 15710, CAS: 30525-89-4 |
| Water, Molecular Grade, Sterile, DEPC Free | Fisher Scientific | Cat#: R91450001G, CAS: 7732-18-5 |
| Critical commercial assays | ||
| Pierce BCA Protein Assay Kit | ThermoFisher Scientific | Cat#: 23327 |
| ATP Bioluminescence Assay Kit CLS II | Roche Diagnostics | Cat#: 11699695001 |
| SuperSignal West Pico PLUS Chemiluminescent Substrate | Thermo Scientific | Cat#: 34580 |
| iScript cDNA Synthesis Kit | BioRad | Cat#: 1708890 |
| RNeasy Mini Kit | QIAGEN | Cat#: 74104 |
| MitoSox Red Mitochondrial Superoxide Indicator | ThermoFisher Scientific | Cat#: M36008 |
| Amplex red Hydrogen Peroxide/Peroxidase Assay Kit | ThermoFisher Scientific | Cat#: A22188 |
| Homocysteine Fluorometric Kit | Abcam | Cat#: Ab228559 |
| Seahorse XFe96 FluxPak | Agilent | Cat#: 102416-100 |
| Seahorse XFe96 Cell Culture Microplate | Agilent | Cat#: 101085-004 |
| Deposited data | ||
| Mendeley Data | This study | https://doi.org/10.17632/djjv7tg4rv.1 |
| Experimental models: Organisms/strains | ||
| Caenorhabditis elegans (WT) | CGC | N2 |
| dvIs100 [unc-54p::A-beta-1-42::unc-54 3′-UTR + mtl-2p::GFP] V | CGC | GMC101 |
| smg-1(cc546) I; dvIs27 [myo-3p::A-Beta (1-42)::let-851 3′UTR) + rol-6(su1006)] X | CGC | CL4176 |
| eat-2 (ad465) II; dvls100[unc-54p::A-beta-1-42 + mtl-2p::GFP] V | This study | UDE96 |
| gcn-2(ok871) II; dvIs100 [unc-54p::A-beta-1-42:: unc-54 3′UTR + mtl-2p::GFP] V | This study | UDE90 |
| dvIs100[unc-54p::A-beta-1-42::unc-54 3′UTR + mtl-2p::GFP] V; pek-1(ok275) X | This study | UDE21 |
| foxSi16 [myo-3p::tomm-20:: mKate2::HA::tbb-2 3′ UTR] I | CGC | SJZ47 |
| foxSi16 [myo-3p::tomm-20::mKate2::HA::tbb-2 3′ UTR] I; dvls100 [unc-54p::A-beta-1-42 + mtl-2p::GFP] V | This study | UDE123 |
| wwIs24 [acdh-1p::GFP + unc-119(+)] | CGC | VL749 |
| dvIs100[unc-54p::A-beta-1-42::unc-54 3′UTR + mtl-2p::GFP] V; pcca-1(ok2282) X | This study | UDE148 |
| metr-1(ok521) II; dvIs100 [unc-54p::A-beta-1-42:: unc-54 3′UTR + mtl-2p::GFP] V | This study | UDE146 |
| mmcm-1 (ok1637) III; dvls100[unc-54p:: A-beta-1-42 + mtl-2p::GFP] V | This study | UDE194 |
| dvls100[unc-54p::A-beta-1-42 + mtl-2p:: GFP] V; sams-1 (ok2946) X | This study | UDE205 |
| rmIs133[unc-54p::Q40::YFP] I | CGC | AM141 |
| rmIs290 [unc-54p::Hsa-sod-1 (127X)::YFP] IV | CGC | AM725 |
| Oligonucleotides | ||
| eat-2(ad465) II | eat-2 forward: GCTCATTCGCACTGTTGAA TAACACTTATAGCGGTTTCT | Common Reverse: GTTACTTA AGGCGTACGAGCC |
| Wild type at eat-2(ad465) II locus | WT forward: GCTCATTCGCACTGTTGAATAACA CTTATAGC GGTTTCC | Common Reverse: GTTACTTA AGGCGTACGAGCC |
| gcn-2(ok871) II | gcn-2 forward: GTGTTCACCGCTG AATCGG | Common Reverse: GACCACA TCCATCGCAACAC |
| Wild type at gcn-2(ok871) II locus | WT forward: GCAGTGTTCTTCGCCTTCTC | Common Reverse: GACCACA TCCATCGCAACAC |
| pek-1(ok275) X | pek-1 forward: CTCTTGACAGCGTACTCG | Common Reverse: GCCAACA GTACATCGATG |
| Wild type at pek-1(ok275) X locus | WT forward: GACACCAATCTCAGCTGTAG | Common Reverse: GCCAACA GTACATCGATG |
| pcca-1(ok2282) X | pcca-1 forward: CAGGTGAGGGTAATGGCATC | Common Reverse: GCTGGA GCCAAGTTCATC |
| Wild type at pcca-1(ok2282) X locus | WT forward: CCTGAAGACGAGTGTTCATC | Common Reverse: GCTGGA GCCAAGTTCATC |
| metr-1(ok521) II | metr-1 forward: GAGGAGTCGACGTG CTTCTC | Common Reverse: CGTCCG ACAAAGGAAGGC |
| Wild type at metr-1(ok521) II locus | WT forward: GTCGTTGGAGAGCTGTTC | COMMON REVERSE: CGTCCGA CAAAGGAAGGC |
| mmcm-1(ok1637) III | mmcm-1 forward: GATGGCATTCTTGG GACCAG | Common Reverse: GAGAGACGC GGAGCAAATGC |
| Wild type at mmcm-1(ok1637) III locus | WT forward: GAGAGACGCGGAG CAAATGC | Common Reverse: GAGAGAC GCGGAGCAAATGC |
| sams-1(ok2946) X | sams-1 forward: GGAGAAATTACCT CCAAGGC | Common Reverse: GCGATAGC AGATGTGGCTGG |
| Wild type at sams-1(ok2946) X locus | WT forward: GGTCTCTACCCAACACTCTC | Common Reverse: GCGATAGC AGATGTGGCTGG |
| nuo-2 qRT-PCR primers | GTGCTGACTGGTTTGAGC | GACCTCGTTGTATCCCG |
| mev-1 qRT-PCR primers | GGACAGATCTACAAATCGGG | CTTGTTGCTCTTGTTCTGGC |
| cyc-1 qRT-PCR primers | CGACATTGCTTCTGTACG | CAGTCATGATTGTGTCAACG |
| nduo-1 qRT-PCR primers | GCCATCCGTGCTAGAAGAC | CAAATGGCGCCCGGTTAAG |
| act-2 qRT-PCR primers | GCGCAAGTACTCCGTCTGGATCG | GGGTGTGAAAATCCGTAAGGCAGA |
| Software and algorithms | ||
| ImageJ | National Institutes of Health | https://imagej.nih.gov/ij/ |
| Graph Pad Prism 9 | GraphPad Software Inc. | https://www.graphpad.com/ |
| Quantstudio6 Real-time PCR | Thermofisher Scientific | Cat: 4485694 |
| ZEN 2.3 Digital Imaging System | Zeiss | https://www.zeiss.com/corporate/int/home.html?vaURL=www.zeiss.de/en |
This paper does not report original code.
Any additional information required to reanalyze the data reported in this paper is available from the lead contact upon request.
EXPERIMENTAL MODEL AND SUBJECT DETAILS
Nematode Culture
All C. elegans strains were maintained on nematode growth medium (NGM) at 20°C as described (Brenner, 1974). The wild-type strain was Bristol N2; all other strains used in this study can be found in the key resources table. eat-2(ad465) was detected with SuperSelective genotyping (Touroutine and Tanis, 2020); standard duplex PCR genotyping was used for all deletion mutants.
Bacterial Strains
Escherichia coli strains used in this study include OP50, HB101, HT115, and DA837. Bacterial cultures for assay plates were grown in LB overnight shaking at 37°C to an OD600 of 1.0 (Eppendorf BioPhotometer D30) and seeded onto NGM plates. All plates were dried for three days at room temperature and stored at 4°C before use. Relative amount of bacteria on seeded plates was measured by washing bacteria off plates with M9 buffer following a 24 hour temperature shift to 25°C and OD600 was measured using an Eppendorf BioPhotomer D30.
METHOD DETAILS
Aβ-induced Paralysis Assay
Animals were synchronized by a pulse egg lay for paralysis assays, however, we note that the dietary shift in paralysis was also observed with worms synchronized by bleaching or picking of late fourth larval stage (L4) animals to assay plates (not shown). Four adult animals were placed on 6 cm NGM plates seeded with different bacteria for 4 hours and then removed. The animals grew at 20°C and then were shifted to 25°C when the majority reached the late L4 stage, identified by a white crescent with black central dot at the vulva. Starting 12 to 20 hours post temperature upshift, depending on the genotype of the strain being assayed, the number of paralyzed and non-paralyzed animals were counted every two hours. Due to substantial acceleration of Aβ-induced paralysis in pek-1 mutants, animals were assessed for movement every hour following temperature upshift until all paralyzed. To determine the impact of B12 post development, animals grown on OP50+B12 plates were transferred to B12-free OP50 plates at the end of the L4 stage immediately prior to temperature upshift. For the inverse experiment, animals grown on B12-free plates were transferred to B12 supplemented plates at the end of L4 stage. A minimum of three biological replicates were performed per C. elegans strain / bacterial condition. Data were used to generate Kaplan-Meier survival plots and determine median time to paralysis (GraphPad Prism 9).
Nutrient and Metabolite Supplementation
Nutrient supplemented plates for paralysis assays contained 10mM D(+)-glucose (Fisher Scientific), 0.3mM sodium homogamma linolenate (Nu-Chek Prep), 0.1mM or 0.3mM oleic acid (ThermoFisher Scientific),148nM or 740 nM methylcobalamin (Millipore Sigma), 1.34 mM, 6.7 mM, 13.4mM, or 67 mM L-methionine (Fisher Scientific), 1 mM, 10 mM, or 20 mM choline chloride (Millipore Sigma), and 15mM or 30 mM DL-Homocysteine (Millipore Sigma). Supplements were added to autoclaved NGM media at 55°C. Specific concentrations used for each supplementation experiment are indicated in the figures and legends. Some of these concentrations for glucose (Alcántar-Fernández et al., 2018), fatty acids (Deline et al., 2013), methylcobalamin (Revtovich et al., 2019), L-methionine (Wei and Ruvkun, 2020), homocysteine (Wei and Ruvkun, 2020), and choline (Walker et al., 2011) were used in prior C. elegans work; additional concentrations were used to determine dose-dependent effects for certain treatments. Plates were stored at 4°C. Fatty acid supplemented plates were covered with foil to prevent light oxidation. Plates were seeded with the different E. coli cultures (OD600 = 1.0) and dried for three days before use.
Mitochondrial imaging and analysis
Mitochondrial morphology was visualized by imaging C. elegans expressing RFP-tagged TOMM-20 (Pmyo-3∷tomm-20∷mKate2∷HA∷tbb-2 3′ UTR) 24 hours after temperature upshift of late L4 animals to 25°C. Animals were immobilized with 10 μM levamisole on 3% agar pads and Z stack images were obtained with a Zeiss LSM880 confocal microscope. Images were analyzed with ImageJ by drawing a ROI around muscles and using the script below to determine mitochondrial length. Values below 1 μm were excluded, then average branch length was calculated. Images from at least thirty animals were analyzed for each condition. The following script was used: run(“Clear Results”); run(“Median…,” “radius=1.5”); run(“Unsharp Mask…,” “radius=2.5 mask=0.90”); setAutoThreshold(“Li dark”); //run(“Threshold…”); setOption(“BlackBackground,” true); run(“Convert to Mask”); run(“Skeletonize (2D/3D)”); run(“Analyze Skeleton (2D/3D),” “prune=[shortest branch] prune_0 calculate show display”); run(“Summarize”);
Vitamin B12 reporter imaging
Images of Pacdh-1∷gfp expression were taken of adult animals, 24 hr post L4, that had been immobilized on 3% agarose pads with 10 μM levamisole. All images were collected under identical exposure conditions using a Zeiss AxioZoom V16 microscope with Axiocam 702 mono camera and ZEN 2.3 Digital Imaging System.
Nile Red Staining
Nile Red staining of fixed C. elegans was performed as previously described with modifications (Brooks et al., 2009). Synchronized populations of animals were raised on plates ± 0.3 mM oleic acid and then suspended in 1 mL of water 24 hr post L4. 50 μL of fresh 10% paraformaldehyde solution (Electron Microscopy Sciences) was added, and the worms were placed on a nutator for 1 hr at room temperature. The PFA solution was removed, 1 mL of 1 μg/mL Nile Red (Thermofisher Scientific) in 1x M9 was added, and the worms were incubated for 30 minutes at room temperature. After removal of the Nile Red solution, the animals were washed 1x with M9 and mounted on 3% agarose pads. Z stack images were obtained with a Zeiss LSM880 confocal microscope using identical settings.
ATP, ROS, and Homocysteine Quantification
Approximately 1000 first larval stage (L1) animals synchronized by bleaching were grown on 10 cm plates at 20°C. Once the animals reached late L4, plates were shifted to 25°C for 24 hours (Figure 2) or 18 hours (Figures 3 and 4). Animals were washed 3x with 1x M9 and sonicated on ice with Tris-EDTA buffer (100mM Tris, 4mM EDTA pH 7.75) using a model 150V/T Ultrasonic Homogenizer for 5 minutes, then centrifuged at 14,000 RPM for 15 minutes at 4°C. The supernatant was collected and moved to a fresh tube. ATP quantitation was performed with the ATP Bioluminescence Assay Kit CLS II (Roche Diagnostics) using a Glomax Multi-Detection System reader as described (Chaya et al., 2021). ATP was normalized to protein content measured with the Pierce BCA protein assay kit (ThermoFisher Scientific). Triplicate technical replicates were performed for each sample; at least four biological samples were assayed for each dietary condition.
For ROS quantification, animals were prepared as for ATP quantification except animals were sonicated on ice in M9 buffer. To normalize samples, the Pierce BCA protein assay kit was used to determine supernatant volume required for 25 mg of protein. Hydrogen peroxide levels were measured using 2′,7′-Dichlorofluorescein diacetate/H2DCFDA (Sigma-Aldrich) as described (Yoon et al., 2018). Briefly 50 μL of 50 μM H2DCFDA was added to normalized worm samples in black 96 well plates and incubated at room temperature for 6 hours before fluorescence was measured. The Amplex Red Hydrogen Peroxide/Peroxidase Assay Kit (Thermofisher Scientific) was also used to measure hydrogen peroxide levels. Superoxide levels were assessed with the MitoSox Red Mitochondrial Superoxide Indicator Kit (ThermoFisher Scientific) following manufacturers protocols. Fluorescence and absorbance values were measured using a Glomax Multi-Detection System. Triplicate technical replicates were performed for each sample; at least six biological samples were assayed for each dietary condition.
For homocysteine quantification, animals were prepared as for ROS quantitation. Homocysteine levels in supernatants containing 25 μg of protein were determined using the Homocysteine Assay Fluorometric Kit (Abcam) following manufacturer instructions. Fluorescence was measured with use of a Glomax Multi-Detection System. Triplicate technical replicates were performed for each sample; four biological samples were assayed for each condition.
Oxygen Consumption Rate Measurements
Oxygen consumption was determined using a Seahorse XFe96 Analyzer (Agilent) as described (Ng and Gruber, 2019) with some modifications. Compounds to be injected were made and pipetted into the sensor cartridge from the Seahorse XFe96 FluxPak (Agilent) as follows. 40 mM Carbonyl cyanide-p-trifluoromethoxyphenylhydrazone (FCCP; Millipore Sigma) stock was made from 10 mg FCCP in 984 μl DMSO and 25 μl aliquots were stored at −20°C. 25 μl of FCCP stock was diluted in 2475 μl M9 buffer immediately before use and 22 μl of this 400 μM FCCP was loaded into drug port A of the sensor cartridge for a final well concentration of 40 μM following injection. 800 mM sodium azide (Acros Organics) stock was made from 130 mg sodium azide in 2.5 mL dH2O; 24 μl was loaded into drug port B of the sensor cartridge for a final well concentration of 80 mM following injection. Animals were grown as indicated for the ATP assays, then washed 3x with 1x M9 buffer 24 hours post 25°C temperature shift and diluted to ~1 worm/μl in M9. 20 μl of nematodes in M9 solution were pipetted into 180 μl of M9 buffer. 10–18 animals in a total volume of 200 μl was the target number of nematodes for each well of a Seahorse XFe96 Cell Culture Microplate; four blank wells without animals were left for background correction.
Basal respiration measurements were conducted for 6 loops, then FCCP was injected and maximal respiration was measured for 6 loops, followed by sodium azide injection and non-mitochondrial oxygen consumption was measured for 6 loops. Each loop consisted of mix for 3 minutes, wait for 2 minutes, measure for 3 minutes. Data analysis was performed on wells with than contained 10–18 animals similar to previously described (Koopman et al., 2016). Basal respiration was calculated by averaging oxygen consumption rate (OCR) from loops 3–6 then subtracting non-mitochondrial oxygen consumption as determined from loop 18, the last measurement following sodium azide addition. Maximal respiration was determined following FCCP injection by averaging OCR from loops 9–11, then subtracting non-mitochondrial OCR from loop 18. For each well, basal and maximal OCR were divided by the number of animals in that well and are presented as pmol O2/min/worm. Spare capacity was determined by subtracting basal from maximal OCR. Three independent assays were conducted over different days; at least 18 wells were analyzed per strain / diet.
Western Blotting
Eggs from gravid adults were isolated by bleaching and allowed to hatch rocking in M9 buffer overnight. Approximately 1000 starved L1s were pipetted onto each plate the following day. Plates were moved to 25°C when a majority of animals were late L4 and 24 hours later, worms were washed 3x with M9 and the pellet was flash frozen. 100 μL lysis buffer (100mM NaCl, 100mM Tris pH 7.5, 1% NP-40) supplemented with an EDTA-free Protease Inhibitor cocktail tablet (Roche) was added to the pellet, sonicated on ice (Model 150V/T Ultrasonic Homogenizer), and centrifuged 15 minutes at 4°C. The supernatant was transferred to a new tube and 20 μL was set aside for protein quantification (Pierce BCA protein assay kit). 2x protein sample buffer (80 mM Tris-HCl, 2% SDS, 10% glygerol, 0.0006% Bromophenol blue with 10% β-meracaptoethanol and 8M Urea) was added to the supernatant. Samples were heated at 55°C for 5 minutes and 30 μg of protein per sample was run on Tris-Tricine 16.5% precast polyacrylamide gels (BioRad) for Aβ or 10% Tris-Glycine (TGX) precast protein gels (BioRad) for NUO-2. Samples were transferred onto 0.2 μm (Aβ) or 0.45 μm (NUO-2) nitrocellulose membranes (BioRad) for 40 minutes at 70V. Membranes were blocked in 5% non-fat milk in TBS with 0.1% Tween-20 one hour at room temperature. Primary antibody incubation was overnight at 4°C; Aβ (6E10 Biolegend cat#803001, 1:1000), NUO-2 (Abcam cat#ab14711, 1:5000), and α-tubulin (Sigma cat#T9026, 1:5000) antibodies were used. Incubation with a goat anti-Mouse IgG-HRP (ThermoFisher Scientific cat#31430, 1:5000) secondary antibody conjugated to horseradish peroxidase was 1 ½ hr. at room temperature. Chemiluminescence detection used SuperSignal West Pico PLUS (ThermoFisher Scientific) and a Chemidoc MP Imaging System (BioRad). NUO-2 and the α-tubulin loading control were detected together on the same membrane, however, Aβ membranes had to be stripped and re-probed with the loading control antibody to ensure equal protein loading across gels. All experiments were done with five biological replicates.
qRT-PCR
C. elegans were synchronized as described for western blotting. 24 hr after temperature upshift, animals were washed three times with M9 and one time with non-DEPC treated RNase free water (Fisher Scientific), then transferred to a microcentrifuge tube. 400 μL of Trizol (ThermoFisher Scientific) was added and samples were flash frozen. RNA was isolated using the RNeasy Mini Kit (QIAGEN). Briefly, 200 μL of Trizol was added to thawed samples along with 140 μL of chloroform (ThermoFisher Scientific). Samples were centrifuged, the aqueous layer was removed, and equal volume of 70% ethanol was added. RNeasy spin columns (Quiagen) were used for on-column DNase treatment. Total RNA was transcribed into cDNA using the iScript cDNA Synthesis kit (BioRad). qRT-PCR was performed with PowerUp SYBR Green Master Mix (Applied Biosystems) using a Quantstudio 6 Flex Real-time PCR System (ThermoFisher Scientific) following the standard cycling mode with an anneal/extend temperature at 58°C followed by a default dissociation step. act-2 was used as the housekeeping reference. The ΔΔCt method was used to determine relative expression. Triplicate technical replicates were performed for each sample; data presented are from at least three biological replicates per condition.
Pharyngeal Pumping Rate Measurements
Animals were grown at 20°C to early L4 stage. Using the Zeiss AxioZoom V16 microscope the number of pharyngeal pumps per 30 s was counted. At least 25 animals were measured per diet.
Thrashing assay
Motility was assessed by quantitating thrashing rate in liquid. The wild-type was compared to animals expressing either a mutated form of human SOD-1 or a polyglutamine expansion transgene 24 hours post L4 on day 1 of adulthood. Nematodes were individually placed into a 10 μl drop of M9 buffer on a microscope slide and allowed to acclimate for 1 minute. The number of body bends completed in 1 minute was determined for 15 animals per strain / condition.
Preparation of Figures
Main text and supplemental figures were made with Adobe Illustrator; the graphical abstract was created with BioRender.com.
QUANTIFICATION AND STATISTICAL ANALYSIS
Data were analyzed with one-way ANOVA, performing multiple comparisons with the Dunnett test except where otherwise noted. Statistical analyses and graphing were performed with GraphPad Prism 9. Significant differences are indicated as *p < 0.05, **p < 0.01, ***p < 0.001, ****p < 0.0001.
Supplementary Material
Highlights.
Dietary vitamin B12 reduces the proteotoxic effects of Aβ in C. elegans
Vitamin B12 is protective even when given to deficient worms only during adulthood
B12 has this impact by acting in C. elegans as a cofactor for methionine synthase
ACKNOWLEDGMENTS
We thank Jeffrey Caplan from the University of Delaware BioImaging Center for writing the script to measure mitochondrial length. Nematode strains were provided by the Caenorhabditis Genetics Center, which is supported by the NIH-ORIP (P40 OD010440). Microscopy access was supported by grants from the NIH-NIGMS (P20 GM103446), NSF (IIA-1301765), and the State of Delaware. This work was supported by a University of Delaware Graduate Scholars award (to A.B.L.), NIH-NIGMS INBRE Pilot Project grant P20 GM103446, NIGMS-NIH Alzheimer’s Supplement P20 GM103446-21S1, and University of Delaware Research Foundation Award 18A00929 (to J.E.T.).
Footnotes
SUPPLEMENTAL INFORMATION
Supplemental information can be found online at https://doi.org/10.1016/j.celrep.2021.109753.
DECLARATION OF INTERESTS
The authors declare no competing interests.
REFERENCES
- Alcántar-Fernández J, Navarro RE, Salazar-Martínez AM, Pérez-Andrade ME, and Miranda-Ríos J (2018). Caenorhabditis elegans respond to high-glucose diets through a network of stress-responsive transcription factors. PLoS ONE 13, e0199888. [DOI] [PMC free article] [PubMed] [Google Scholar]
- An Y, Varma VR, Varma S, Casanova R, Dammer E, Pletnikova O, Chia CW, Egan JM, Ferrucci L, Troncoso J, et al. (2018). Evidence for brain glucose dysregulation in Alzheimer’s disease. Alzheimers Dement. 14, 318–329. [DOI] [PMC free article] [PubMed] [Google Scholar]
- Andra A, Tanigawa S, Bito T, Ishihara A, Watanabe F, and Yabuta Y (2021). Effects of Vitamin B12 Deficiency on Amyloid-β Toxicity in Caenorhabditis elegans. Antioxidants 10, 962. [DOI] [PMC free article] [PubMed] [Google Scholar]
- Baker BM, Nargund AM, Sun T, and Haynes CM (2012). Protective coupling of mitochondrial function and protein synthesis via the eIF2α kinase GCN-2. PLoS Genet. 8, e1002760. [DOI] [PMC free article] [PubMed] [Google Scholar]
- Bito T, Misaki T, Yabuta Y, Ishikawa T, Kawano T, and Watanabe F (2017). Vitamin B12 deficiency results in severe oxidative stress, leading to memory retention impairment in Caenorhabditis elegans. Redox Biol. 11, 21–29. [DOI] [PMC free article] [PubMed] [Google Scholar]
- Brendza KM, Haakenson W, Cahoon RE, Hicks LM, Palavalli LH, Chiapelli BJ, McLaird M, McCarter JP, Williams DJ, Hresko MC, and Jez JM (2007). Phosphoethanolamine N-methyltransferase (PMT-1) catalyses the first reaction of a new pathway for phosphocholine biosynthesis in Caenorhabditis elegans. Biochem. J 404, 439–448. [DOI] [PMC free article] [PubMed] [Google Scholar]
- Brenner S (1974). The genetics of Caenorhabditis elegans. Genetics 77, 71–94. [DOI] [PMC free article] [PubMed] [Google Scholar]
- Brooks KK, Liang B, and Watts JL (2009). The influence of bacterial diet on fat storage in C. elegans. PLoS ONE 4, e7545. [DOI] [PMC free article] [PubMed] [Google Scholar]
- Butterfield DA, and Halliwell B (2019). Oxidative stress, dysfunctional glucose metabolism and Alzheimer disease. Nat. Rev. Neurosci 20, 148–160. [DOI] [PMC free article] [PubMed] [Google Scholar]
- Cabreiro F, Au C, Leung KY, Vergara-Irigaray N, Cochemé HM, Noori T, Weinkove D, Schuster E, Greene NDE, and Gems D (2013). Metformin retards aging in C. elegans by altering microbial folate and methionine metabolism. Cell 153, 228–239. [DOI] [PMC free article] [PubMed] [Google Scholar]
- Cacho-Valadez B, Muñoz-Lobato F, Pedrajas JR, Cabello J, Fierro-González JC, Navas P, Swoboda P, Link CD, and Miranda-Vizuete A (2012). The characterization of the Caenorhabditis elegans mitochondrial thioredoxin system uncovers an unexpected protective role of thioredoxin reductase 2 in β-amyloid peptide toxicity. Antioxid. Redox Signal 16, 1384–1400. [DOI] [PMC free article] [PubMed] [Google Scholar]
- Chakravorty A, Jetto CT, and Manjithaya R (2019). Dysfunctional Mitochondria and Mitophagy as Drivers of Alzheimer’s Disease Pathogenesis. Front. Aging Neurosci. 11, 311. [DOI] [PMC free article] [PubMed] [Google Scholar]
- Chartier-Harlin MC, Crawford F, Houlden H, Warren A, Hughes D, Fidani L, Goate A, Rossor M, Roques P, Hardy J, et al. (1991). Early-onset Alzheimer’s disease caused by mutations at codon 717 of the β-amyloid precursor protein gene. Nature 353, 844–846. [DOI] [PubMed] [Google Scholar]
- Chaya T, Patel S, Smith EM, Lam A, Miller E, Clupper M, Kervin K, and Tanis JE (2021). A C. elegans genome-wide RNAi screen for altered levamisole sensitivity identifies genes required for muscle function. G3 (Bethesda) 11, jkab047. [DOI] [PMC free article] [PubMed] [Google Scholar]
- Chen GF, Xu TH, Yan Y, Zhou YR, Jiang Y, Melcher K, and Xu HE (2017). Amyloid beta: structure, biology and structure-based therapeutic development. Acta Pharmacol. Sin 38, 1205–1235. [DOI] [PMC free article] [PubMed] [Google Scholar]
- Clarke R, Bennett D, Parish S, Lewington S, Skeaff M, Eussen SJPM, Lewerin C, Stott DJ, Armitage J, Hankey GJ, et al. ; B-Vitamin Treatment Trialists’ Collaboration (2014). Effects of homocysteine lowering with B vitamins on cognitive aging: meta-analysis of 11 trials with cognitive data on 22,000 individuals. Am. J. Clin. Nutr 100, 657–666. [DOI] [PMC free article] [PubMed] [Google Scholar]
- Cline EN, Bicca MA, Viola KL, and Klein WL (2018). The Amyloid-β Oligomer Hypothesis: Beginning of the Third Decade. J. Alzheimers Dis 64 (s1), S567–S610. [DOI] [PMC free article] [PubMed] [Google Scholar]
- Cogliati S, Clementi V, Francisco M, Crespo C, Argañaraz F, and Grau R (2020). Bacillus Subtilis Delays Neurodegeneration and Behavioral Impairment in the Alzheimer’s Disease Model Caenorhabditis Elegans. J. Alzheimers Dis 73, 1035–1052. [DOI] [PubMed] [Google Scholar]
- De Strooper B, and Karran E (2016). The Cellular Phase of Alzheimer’s Disease. Cell 164, 603–615. [DOI] [PubMed] [Google Scholar]
- Deline ML, Vrablik TL, and Watts JL (2013). Dietary supplementation of polyunsaturated fatty acids in Caenorhabditis elegans. J. Vis. Exp 81, 50879. [DOI] [PMC free article] [PubMed] [Google Scholar]
- Drake J, Link CD, and Butterfield DA (2003). Oxidative stress precedes fibrillar deposition of Alzheimer’s disease amyloid β-peptide (1–42) in a transgenic Caenorhabditis elegans model. Neurobiol. Aging 24, 415–420. [DOI] [PubMed] [Google Scholar]
- Fang EF, Hou Y, Palikaras K, Adriaanse BA, Kerr JS, Yang B, Lautrup S, Hasan-Olive MM, Caponio D, Dan X, et al. (2019). Mitophagy inhibits amyloid-β and tau pathology and reverses cognitive deficits in models of Alzheimer’s disease. Nat. Neurosci 22, 401–412. [DOI] [PMC free article] [PubMed] [Google Scholar]
- Fong S, Teo E, Ng LF, Chen CB, Lakshmanan LN, Tsoi SY, Moore PK, Inoue T, Halliwell B, and Gruber J (2016). Energy crisis precedes global metabolic failure in a novel Caenorhabditis elegans Alzheimer Disease model. Sci. Rep 6, 33781. [DOI] [PMC free article] [PubMed] [Google Scholar]
- Fonte V, Dostal V, Roberts CM, Gonzales P, Lacor PN, Velasco PT, Magrane J, Dingwell N, Fan EY, Silverman MA, et al. (2011). A glycine zipper motif mediates the formation of toxic β-amyloid oligomers in vitro and in vivo. Mol. Neurodegener 6, 61. [DOI] [PMC free article] [PubMed] [Google Scholar]
- Ford AH, and Almeida OP (2019). Effect of Vitamin B Supplementation on Cognitive Function in the Elderly: A Systematic Review and Meta-Analysis. Drugs Aging 36, 419–434. [DOI] [PubMed] [Google Scholar]
- Goate A, Chartier-Harlin MC, Mullan M, Brown J, Crawford F, Fidani L, Giuffra L, Haynes A, Irving N, James L, et al. (1991). Segregation of a missense mutation in the amyloid precursor protein gene with familial Alzheimer’s disease. Nature 349, 704–706. [DOI] [PubMed] [Google Scholar]
- Grandison RC, Piper MDW, and Partridge L (2009). Amino-acid imbalance explains extension of lifespan by dietary restriction in Drosophila. Nature 462, 1061–1064. [DOI] [PMC free article] [PubMed] [Google Scholar]
- Green R, Allen LH, Bjørke-Monsen AL, Brito A, Guéant JL, Miller JW, Molloy AM, Nexo E, Stabler S, Toh BH, et al. (2017). Vitamin B12 deficiency. Nat. Rev. Dis. Primers 3, 17040. [DOI] [PubMed] [Google Scholar]
- Han B, Sivaramakrishnan P, Lin CJ, Neve IAA, He J, Tay LWR, Sowa JN, Sizovs A, Du G, Wang J, et al. (2017). Microbial Genetic Composition Tunes Host Longevity. Cell 169, 1249–1262.e13. [DOI] [PMC free article] [PubMed] [Google Scholar]
- Hannich JT, Entchev EV, Mende F, Boytchev H, Martin R, Zagoriy V, Theumer G, Riezman I, Riezman H, Knölker HJ, and Kurzchalia TV (2009). Methylation of the sterol nucleus by STRM-1 regulates dauer larva formation in Caenorhabditis elegans. Dev. Cell 16, 833–843. [DOI] [PubMed] [Google Scholar]
- Hassan WM, Dostal V, Huemann BN, Yerg JE, and Link CD (2015). Identifying Aβ-specific pathogenic mechanisms using a nematode model of Alzheimer’s disease. Neurobiol. Aging 36, 857–866. [DOI] [PMC free article] [PubMed] [Google Scholar]
- Kang JH, Cook N, Manson J, Buring JE, Albert CM, and Grodstein F (2008). A trial of B vitamins and cognitive function among women at high risk of cardiovascular disease. Am. J. Clin. Nutr 88, 1602–1610. [DOI] [PMC free article] [PubMed] [Google Scholar]
- Koopman M, Michels H, Dancy BM, Kamble R, Mouchiroud L, Auwerx J, Nollen EAA, and Houtkooper RH (2016). A screening-based platform for the assessment of cellular respiration in Caenorhabditis elegans. Nat. Protoc 11, 1798–1816. [DOI] [PMC free article] [PubMed] [Google Scholar]
- Lee SJ, Murphy CT, and Kenyon C (2009). Glucose shortens the life span of C. elegans by downregulating DAF-16/FOXO activity and aquaporin gene expression. Cell Metab. 10, 379–391. [DOI] [PMC free article] [PubMed] [Google Scholar]
- Lin MT, and Beal MF (2006). Mitochondrial dysfunction and oxidative stress in neurodegenerative diseases. Nature 443, 787–795. [DOI] [PubMed] [Google Scholar]
- Link CD (1995). Expression of human β-amyloid peptide in transgenic Caenorhabditis elegans. Proc. Natl. Acad. Sci. USA 92, 9368–9372. [DOI] [PMC free article] [PubMed] [Google Scholar]
- Long JM, and Holtzman DM (2019). Alzheimer Disease: An Update on Pathobiology and Treatment Strategies. Cell 179, 312–339. [DOI] [PMC free article] [PubMed] [Google Scholar]
- Lublin AL, and Link CD (2013). Alzheimer’s disease drug discovery: in vivo screening using Caenorhabditis elegans as a model for β-amyloid peptide-induced toxicity. Drug Discov. Today. Technol 10, e115–e119. [DOI] [PMC free article] [PubMed] [Google Scholar]
- MacNeil LT, Watson E, Arda HE, Zhu LJ, and Walhout AJM (2013). Diet-induced developmental acceleration independent of TOR and insulin in C. elegans. Cell 153, 240–252. [DOI] [PMC free article] [PubMed] [Google Scholar]
- McColl G, Roberts BR, Pukala TL, Kenche VB, Roberts CM, Link CD, Ryan TM, Masters CL, Barnham KJ, Bush AI, and Cherny RA (2012). Utility of an improved model of amyloid-beta (Aβ1–42) toxicity in Caenorhabditis elegans for drug screening for Alzheimer’s disease. Mol. Neurodegener 7, 57. [DOI] [PMC free article] [PubMed] [Google Scholar]
- Neve IAA, Sowa JN, Lin CJ, Sivaramakrishnan P, Herman C, Ye Y, Han L, and Wang MC (2020). Escherichia coli metabolite profiling leads to the development of an RNA interference strain for Caenorhabditis elegans. G3 (Bethesda) 10, 189–198. [DOI] [PMC free article] [PubMed] [Google Scholar]
- Ng LF, and Gruber J (2019). Measurement of Respiration Rate in Live Caenorhabditis elegans. Bio Protoc. 9, e3243. [DOI] [PMC free article] [PubMed] [Google Scholar]
- Orentreich N, Matias JR, DeFelice A, and Zimmerman JA (1993). Low methionine ingestion by rats extends life span. J. Nutr 123, 269–274. [DOI] [PubMed] [Google Scholar]
- Pagani L, and Eckert A (2011). Amyloid-Beta interaction with mitochondria. Int. J. Alzheimers Dis 2011, 925050. [DOI] [PMC free article] [PubMed] [Google Scholar]
- Palavalli LH, Brendza KM, Haakenson W, Cahoon RE, McLaird M, Hicks LM, McCarter JP, Williams DJ, Hresko MC, and Jez JM (2006). Defining the role of phosphomethylethanolamine N-methyltransferase from Caenorhabditis elegans in phosphocholine biosynthesis by biochemical and kinetic analysis. Biochemistry 45, 6056–6065. [DOI] [PubMed] [Google Scholar]
- Parkhitko AA, Jouandin P, Mohr SE, and Perrimon N (2019). Methionine metabolism and methyltransferases in the regulation of aging and lifespan extension across species. Aging Cell 18, e13034. [DOI] [PMC free article] [PubMed] [Google Scholar]
- Revtovich AV, Lee R, and Kirienko NV (2019). Interplay between mitochondria and diet mediates pathogen and stress resistance in Caenorhabditis elegans. PLoS Genet. 15, e1008011. [DOI] [PMC free article] [PubMed] [Google Scholar]
- Ronquist G, and Waldenström A (2003). Imbalance of plasma membrane ion leak and pump relationship as a new aetiological basis of certain disease states. J. Intern. Med 254, 517–526. [DOI] [PubMed] [Google Scholar]
- Rousakis A, Vlassis A, Vlanti A, Patera S, Thireos G, and Syntichaki P (2013). The general control nonderepressible-2 kinase mediates stress response and longevity induced by target of rapamycin inactivation in Caenorhabditis elegans. Aging Cell 12, 742–751. [DOI] [PMC free article] [PubMed] [Google Scholar]
- Schulz TJ, Zarse K, Voigt A, Urban N, Birringer M, and Ristow M (2007). Glucose restriction extends Caenorhabditis elegans life span by inducing mitochondrial respiration and increasing oxidative stress. Cell Metab. 6, 280–293. [DOI] [PubMed] [Google Scholar]
- Shen X, Ellis RE, Sakaki K, and Kaufman RJ (2005). Genetic interactions due to constitutive and inducible gene regulation mediated by the unfolded protein response in C. elegans. PLoS Genet. 1, e37. [DOI] [PMC free article] [PubMed] [Google Scholar]
- Shtonda BB, and Avery L (2006). Dietary choice behavior in Caenorhabditis elegans. J. Exp. Biol 209, 89–102. [DOI] [PMC free article] [PubMed] [Google Scholar]
- Smith AD, and Refsum H (2016). Homocysteine, B Vitamins, and Cognitive Impairment. Annu. Rev. Nutr 36, 211–239. [DOI] [PubMed] [Google Scholar]
- Smith AD, Smith SM, de Jager CA, Whitbread P, Johnston C, Agacinski G, Oulhaj A, Bradley KM, Jacoby R, and Refsum H (2010). Homocysteine-lowering by B vitamins slows the rate of accelerated brain atrophy in mild cognitive impairment: a randomized controlled trial. PLoS ONE 5, e12244. [DOI] [PMC free article] [PubMed] [Google Scholar]
- Sorrentino V, Romani M, Mouchiroud L, Beck JS, Zhang H, D’Amico D, Moullan N, Potenza F, Schmid AW, Rietsch S, et al. (2017). Enhancing mitochondrial proteostasis reduces amyloid-β proteotoxicity. Nature 552, 187–193. [DOI] [PMC free article] [PubMed] [Google Scholar]
- Steinkraus KA, Smith ED, Davis C, Carr D, Pendergrass WR, Sutphin GL, Kennedy BK, and Kaeberlein M (2008). Dietary restriction suppresses proteotoxicity and enhances longevity by an hsf-1-dependent mechanism in Caenorhabditis elegans. Aging Cell 7, 394–404. [DOI] [PMC free article] [PubMed] [Google Scholar]
- Teo E, Ravi S, Barardo D, Kim HS, Fong S, Cazenave-Gassiot A, Tan TY, Ching J, Kovalik JP, Wenk MR, et al. (2019). Metabolic stress is a primary pathogenic event in transgenic Caenorhabditis elegans expressing panneuronal human amyloid beta. eLife 8, e50069. [DOI] [PMC free article] [PubMed] [Google Scholar]
- Thelen M, and Brown-Borg HM (2020). Does Diet Have a Role in the Treatment of Alzheimer’s Disease? Front. Aging Neurosci 12, 617071. [DOI] [PMC free article] [PubMed] [Google Scholar]
- Touroutine D, and Tanis JE (2020). A Rapid, SuperSelective Method for Detection of Single Nucleotide Variants in Caenorhabditis elegans. Genetics 216, 343–352. [DOI] [PMC free article] [PubMed] [Google Scholar]
- van der Veen JN, Kennelly JP, Wan S, Vance JE, Vance DE, and Jacobs RL (2017). The critical role of phosphatidylcholine and phosphatidylethanolamine metabolism in health and disease. Biochim. Biophys. Acta Biomembr 1859 (9 Pt B), 1558–1572. [DOI] [PubMed] [Google Scholar]
- Virk B, Correia G, Dixon DP, Feyst I, Jia J, Oberleitner N, Briggs Z, Hodge E, Edwards R, Ward J, et al. (2012). Excessive folate synthesis limits lifespan in the C. elegans: E. coli aging model. BMC Biol. 10, 67. [DOI] [PMC free article] [PubMed] [Google Scholar]
- Virk B, Jia J, Maynard CA, Raimundo A, Lefebvre J, Richards SA, Chetina N, Liang Y, Helliwell N, Cipinska M, and Weinkove D (2016). Folate Acts in E. coli to Accelerate C. elegans Aging Independently of Bacterial Biosynthesis. Cell Rep. 14, 1611–1620. [DOI] [PMC free article] [PubMed] [Google Scholar]
- Vogiatzoglou A, Refsum H, Johnston C, Smith SM, Bradley KM, de Jager C, Budge MM, and Smith AD (2008). Vitamin B12 status and rate of brain volume loss in community-dwelling elderly. Neurology 71, 826–832. [DOI] [PubMed] [Google Scholar]
- Walker AK, Jacobs RL, Watts JL, Rottiers V, Jiang K, Finnegan DM, Shioda T, Hansen M, Yang F, Niebergall LJ, et al. (2011). A conserved SREBP-1/phosphatidylcholine feedback circuit regulates lipogenesis in meta-zoans. Cell 147, 840–852. [DOI] [PMC free article] [PubMed] [Google Scholar]
- Wang X, Wang W, Li L, Perry G, Lee H, and Zhu X (2014). Oxidative stress and mitochondrial dysfunction in Alzheimer’s disease. Biochim. Biophys. Acta Mol. Basis Dis 1842, 1240–1247. [DOI] [PMC free article] [PubMed] [Google Scholar]
- Watson E, MacNeil LT, Ritter AD, Yilmaz LS, Rosebrock AP, Caudy AA, and Walhout AJM (2014). Interspecies systems biology uncovers metabolites affecting C. elegans gene expression and life history traits. Cell 156, 759–770. [DOI] [PMC free article] [PubMed] [Google Scholar]
- Watson E, Olin-Sandoval V, Hoy MJ, Li CH, Louisse T, Yao V, Mori A, Holdorf AD, Troyanskaya OG, Ralser M, and Walhout AJ (2016). Metabolic network rewiring of propionate flux compensates vitamin B12 deficiency in C. elegans. eLife 5, e17670. [DOI] [PMC free article] [PubMed] [Google Scholar]
- Wei W, and Ruvkun G (2020). Lysosomal activity regulates Caenorhabditis elegans mitochondrial dynamics through vitamin B12 metabolism. Proc. Natl. Acad. Sci. USA 117, 19970–19981. [DOI] [PMC free article] [PubMed] [Google Scholar]
- Whiley L, Sen A, Heaton J, Proitsi P, García-Gómez D, Leung R, Smith N, Thambisetty M, Kloszewska I, Mecocci P, et al. ; AddNeuroMed Consortium (2014). Evidence of altered phosphatidylcholine metabolism in Alzheimer’s disease. Neurobiol. Aging 35, 271–278. [DOI] [PMC free article] [PubMed] [Google Scholar]
- Yang T, Li S, Xu XH, Walsh DM, and Selkoe DJ (2017). Large Soluble Oligomers of Amyloid beta from Alzheimer Brain Are Far Less Neuroactive Than the Smaller Oligomers to Which They Dissociate. J. Neurosci 37, 152–163. [DOI] [PMC free article] [PubMed] [Google Scholar]
- Yellen G (2018). Fueling thought: Management of glycolysis and oxidative phosphorylation in neuronal metabolism. J. Cell Biol 217, 2235–2246. [DOI] [PMC free article] [PubMed] [Google Scholar]
- Yoon DS, Lee M-H, and Cha DS (2018). Measurement of Intracellular ROS in Caenorhabditis elegans Using 2′,7′-Dichlorodihydrofluorescein Diacetate. Bio Protoc. 8, e2774. [DOI] [PMC free article] [PubMed] [Google Scholar]
- Zhang X, Alshakhshir N, Zhao L, Wood L, and Kaplin AI (2021). Glycolytic Metabolism, Brain Resilience, and Alzheimer’s Disease. Front. Neurosci 15, 662242. [DOI] [PMC free article] [PubMed] [Google Scholar]
Associated Data
This section collects any data citations, data availability statements, or supplementary materials included in this article.
Supplementary Materials
Data Availability Statement
All original data have been deposited at Mendeley Data and are publicly available as of the date of publication; DOI is listed in the key resources table.
KEY RESOURCES TABLE
| REAGENT or RESOURCE | SOURCE | IDENTIFIER |
|---|---|---|
| Antibodies | ||
| anti-β-Amyloid 6E10 | BioLegend | Cat#803001; RRID: AB_2564653 |
| anti-α-tubulin A11 | Millipore Sigma | Cat#T9026; RRID: AB_477593 |
| Anti-NDUFS3 | Abcam | Cat#ab14711; RRID: AB_301429 |
| Goat anti-Mouse IgG (H+L) Secondary Antibody, HRP | ThermoFisher Scientific | Cat#31430; RRID: AB_228307 |
| Bacterial and virus strains | ||
| Escherichia coli OP50 | Caenorhabditis Genetics Center (CGC) | N/A |
| Escherichia coli HB101 | CGC | N/A |
| Escherichia coli HT115 | CGC | N/A |
| Escherichia coli DA837 | CGC | N/A |
| Chemicals, peptides, and recombinant proteins | ||
| D(+)-glucose | Fisher Scientific | Cat#: AC410955000 CAS: 50-99-7 |
| Sodium Homogamma Linolenate | Nu-Chek Prep | Cat#: S-1143, CAS: 65881-87-0 |
| Oleic Acid | ThermoFisher Scientific | Cat#:31997, CAS: 112-80-1 |
| Methylcobalamin | Millipore Sigma | Cat#: M9756, CAS: 13422-55-4 |
| L-methionine | Fisher Scientific | Cat#: AC166160025 CAS: 63-68-3 |
| DL-Homocysteine | Millipore Sigma | Cat#: H4628, CAS: 454-29-5 |
| Choline Chloride | Millipore Sigma | Cat#: C7017–5G, CAS:67-48-1 |
| Levamisole hydrochloride | Fisher Scientific | Cat#: AC187870100 CAS: 16595-80-5 |
| EDTA-free Protease Inhibitor cocktail | Roche | Cat#: 4693159001 |
| NP-40 | ThermoFisher Scientific | Cat#: 85124, CAS: 9016-45-9 |
| Sodium Dodecyl Sulfate | Fisher Bioreagents | Cat#: BP1311-200, CAS: 151-21-3,7732-18-5 |
| Sodium Chloride (NaCl) | Fisher Bioreagents | Cat#: BP358-1 CAS:7647-14-5 |
| 1M Tris-HCl pH 8.3 | Teknova | Cat#: T5083 |
| Tris Base | Fisher Bioreagents | Cat#: BP152-500, CAS: 77-86-1 |
| TRIS-buffered saline (TBS, 10x) | Alfa Aesar | Cat#: J62938-K2, CAS: 77-86-1 |
| Tween-20 | Fisher Bioreagents | Cat#: BP337-100 CAS: 9005-64-5 |
| Non-Fat Powdered Milk | Boston BioProducts | Cat#: P-1400 |
| β-meracaptoethanol | Fisher Scientific | Cat#: AC125470100 CAS: 60-24-2 |
| Bromophenol Blue | Fisher Scientific | Cat#: AC403140050 CAS: 115-39-9 |
| Urea | ThermoFisher Scientific | Cat#: 29700, CAS: 57-13-6 |
| Glycerol | Fisher Bioreagents | Cat#: BP229-1, CAS: 56-81-5 |
| 10x Tris/Glycine/SDS Buffer | BioRad | Cat#: 1210732 |
| Glycine | Fisher Bioreagents | Cat#: BP381-500 CAS:56-40-6 |
| Methanol | Fisher Chemical | Cat#: A454-4, CAS: 67-56-1 |
| 16.5% Mini-Protean Tris-Tricine Gel | BioRad | Cat#: 4563063 |
| 10% Mini-Protean TGX Precast Protein Gels | BioRad | Cat#: 4561033 |
| Trizol | ThermoFisher Scientific | Cat#: 15596018 |
| Chloroform | Crescent Chemical Co. | Cat#: 39553.01, CAS: 67-66-3 |
| RNase-Free DNase Set | QIAGEN | Cat#: 79254 |
| PowerUp SYBR Green Master Mix | Applied Biosystems | Cat#: A25741 |
| 0.5M EDTA pH 8.0 | Invitrogen | Cat#: 15575-038 |
| 2′7’-Dichlorofluorescin diacetate | Millipore Sigma | Cat#: D6883-250, CAS: 4091-99-0 |
| Nile Red | ThermoFisher Scientific | Cat#: N1142 |
| Agarose | Fisher Bioreagents | Cat#:BP160-500, CAS: 9012-36-6 |
| Carbonyl cyanide-p-trifluoromethoxyphenylhydrazone (FCCP) | Millipore Sigma | Cat#: C2920-10, CAS: 370-86-5 |
| DMSO (Dimethyl Sulfoxide) LC-MS Grade | ThermoFisher Scientific | Cat#: 85190, Cas:67-68-5 |
| Sodium Azide | Acros Organics | Cat#: 19038-1000, CAS: 26629-22-8 |
| Paraformaldehyde (16%) Solution EM Grade | Electron Microscopy Sciences | Cat#: 15710, CAS: 30525-89-4 |
| Water, Molecular Grade, Sterile, DEPC Free | Fisher Scientific | Cat#: R91450001G, CAS: 7732-18-5 |
| Critical commercial assays | ||
| Pierce BCA Protein Assay Kit | ThermoFisher Scientific | Cat#: 23327 |
| ATP Bioluminescence Assay Kit CLS II | Roche Diagnostics | Cat#: 11699695001 |
| SuperSignal West Pico PLUS Chemiluminescent Substrate | Thermo Scientific | Cat#: 34580 |
| iScript cDNA Synthesis Kit | BioRad | Cat#: 1708890 |
| RNeasy Mini Kit | QIAGEN | Cat#: 74104 |
| MitoSox Red Mitochondrial Superoxide Indicator | ThermoFisher Scientific | Cat#: M36008 |
| Amplex red Hydrogen Peroxide/Peroxidase Assay Kit | ThermoFisher Scientific | Cat#: A22188 |
| Homocysteine Fluorometric Kit | Abcam | Cat#: Ab228559 |
| Seahorse XFe96 FluxPak | Agilent | Cat#: 102416-100 |
| Seahorse XFe96 Cell Culture Microplate | Agilent | Cat#: 101085-004 |
| Deposited data | ||
| Mendeley Data | This study | https://doi.org/10.17632/djjv7tg4rv.1 |
| Experimental models: Organisms/strains | ||
| Caenorhabditis elegans (WT) | CGC | N2 |
| dvIs100 [unc-54p::A-beta-1-42::unc-54 3′-UTR + mtl-2p::GFP] V | CGC | GMC101 |
| smg-1(cc546) I; dvIs27 [myo-3p::A-Beta (1-42)::let-851 3′UTR) + rol-6(su1006)] X | CGC | CL4176 |
| eat-2 (ad465) II; dvls100[unc-54p::A-beta-1-42 + mtl-2p::GFP] V | This study | UDE96 |
| gcn-2(ok871) II; dvIs100 [unc-54p::A-beta-1-42:: unc-54 3′UTR + mtl-2p::GFP] V | This study | UDE90 |
| dvIs100[unc-54p::A-beta-1-42::unc-54 3′UTR + mtl-2p::GFP] V; pek-1(ok275) X | This study | UDE21 |
| foxSi16 [myo-3p::tomm-20:: mKate2::HA::tbb-2 3′ UTR] I | CGC | SJZ47 |
| foxSi16 [myo-3p::tomm-20::mKate2::HA::tbb-2 3′ UTR] I; dvls100 [unc-54p::A-beta-1-42 + mtl-2p::GFP] V | This study | UDE123 |
| wwIs24 [acdh-1p::GFP + unc-119(+)] | CGC | VL749 |
| dvIs100[unc-54p::A-beta-1-42::unc-54 3′UTR + mtl-2p::GFP] V; pcca-1(ok2282) X | This study | UDE148 |
| metr-1(ok521) II; dvIs100 [unc-54p::A-beta-1-42:: unc-54 3′UTR + mtl-2p::GFP] V | This study | UDE146 |
| mmcm-1 (ok1637) III; dvls100[unc-54p:: A-beta-1-42 + mtl-2p::GFP] V | This study | UDE194 |
| dvls100[unc-54p::A-beta-1-42 + mtl-2p:: GFP] V; sams-1 (ok2946) X | This study | UDE205 |
| rmIs133[unc-54p::Q40::YFP] I | CGC | AM141 |
| rmIs290 [unc-54p::Hsa-sod-1 (127X)::YFP] IV | CGC | AM725 |
| Oligonucleotides | ||
| eat-2(ad465) II | eat-2 forward: GCTCATTCGCACTGTTGAA TAACACTTATAGCGGTTTCT | Common Reverse: GTTACTTA AGGCGTACGAGCC |
| Wild type at eat-2(ad465) II locus | WT forward: GCTCATTCGCACTGTTGAATAACA CTTATAGC GGTTTCC | Common Reverse: GTTACTTA AGGCGTACGAGCC |
| gcn-2(ok871) II | gcn-2 forward: GTGTTCACCGCTG AATCGG | Common Reverse: GACCACA TCCATCGCAACAC |
| Wild type at gcn-2(ok871) II locus | WT forward: GCAGTGTTCTTCGCCTTCTC | Common Reverse: GACCACA TCCATCGCAACAC |
| pek-1(ok275) X | pek-1 forward: CTCTTGACAGCGTACTCG | Common Reverse: GCCAACA GTACATCGATG |
| Wild type at pek-1(ok275) X locus | WT forward: GACACCAATCTCAGCTGTAG | Common Reverse: GCCAACA GTACATCGATG |
| pcca-1(ok2282) X | pcca-1 forward: CAGGTGAGGGTAATGGCATC | Common Reverse: GCTGGA GCCAAGTTCATC |
| Wild type at pcca-1(ok2282) X locus | WT forward: CCTGAAGACGAGTGTTCATC | Common Reverse: GCTGGA GCCAAGTTCATC |
| metr-1(ok521) II | metr-1 forward: GAGGAGTCGACGTG CTTCTC | Common Reverse: CGTCCG ACAAAGGAAGGC |
| Wild type at metr-1(ok521) II locus | WT forward: GTCGTTGGAGAGCTGTTC | COMMON REVERSE: CGTCCGA CAAAGGAAGGC |
| mmcm-1(ok1637) III | mmcm-1 forward: GATGGCATTCTTGG GACCAG | Common Reverse: GAGAGACGC GGAGCAAATGC |
| Wild type at mmcm-1(ok1637) III locus | WT forward: GAGAGACGCGGAG CAAATGC | Common Reverse: GAGAGAC GCGGAGCAAATGC |
| sams-1(ok2946) X | sams-1 forward: GGAGAAATTACCT CCAAGGC | Common Reverse: GCGATAGC AGATGTGGCTGG |
| Wild type at sams-1(ok2946) X locus | WT forward: GGTCTCTACCCAACACTCTC | Common Reverse: GCGATAGC AGATGTGGCTGG |
| nuo-2 qRT-PCR primers | GTGCTGACTGGTTTGAGC | GACCTCGTTGTATCCCG |
| mev-1 qRT-PCR primers | GGACAGATCTACAAATCGGG | CTTGTTGCTCTTGTTCTGGC |
| cyc-1 qRT-PCR primers | CGACATTGCTTCTGTACG | CAGTCATGATTGTGTCAACG |
| nduo-1 qRT-PCR primers | GCCATCCGTGCTAGAAGAC | CAAATGGCGCCCGGTTAAG |
| act-2 qRT-PCR primers | GCGCAAGTACTCCGTCTGGATCG | GGGTGTGAAAATCCGTAAGGCAGA |
| Software and algorithms | ||
| ImageJ | National Institutes of Health | https://imagej.nih.gov/ij/ |
| Graph Pad Prism 9 | GraphPad Software Inc. | https://www.graphpad.com/ |
| Quantstudio6 Real-time PCR | Thermofisher Scientific | Cat: 4485694 |
| ZEN 2.3 Digital Imaging System | Zeiss | https://www.zeiss.com/corporate/int/home.html?vaURL=www.zeiss.de/en |
This paper does not report original code.
Any additional information required to reanalyze the data reported in this paper is available from the lead contact upon request.