Abstract
The electrochemical behavior of magnetite (Fe3O4) aggregates with submicrometric size is investigated. Specifically, cyclic voltammetry tests were performed in both acidic (pH ∼ 4.5) and alkaline (pH ∼ 12.8) solutions, exploiting a conventional three-electrode cell. In the first case, the working electrode was made of a glassy carbon substrate loaded with magnetite nanoaggregates, forming a continuous film. In a second configuration, magnetite nanoaggregates were dispersed in solution, kept under stirring, as a fluidized electrode. The latter approach showed an increase in the electrochemical response of the particles, otherwise limited by the reduced active area as in the former case. Electrochemical-atomic force microscopy (EC-AFM) investigation was carried out in an acidic environment, showing the topography evolution of nanoaggregates during the electrochemical characterization. X-ray diffraction (XRD) analysis was carried out to evaluate the microstructural variation in the Fe3O4 electrodes after cathodic polarization tests in an alkaline environment.
1. Introduction
Magnetite (Fe3O4) nanoparticles possess unique properties, such as high saturation magnetization,1,2 biocompatibility, and stability, making them suitable for biomedical applications as electrochemical sensors,3−5 cancer treatment,6,7 or medical imaging.8,9 Moreover, magnetite nanoparticles have been investigated in catalysis,10,11 supercapacitors,12,13 energy storage,14,15 and wastewater remediation.16−18 Together with the wide range of applications, the use of large-volume and low-cost fabrication methods, such as co-precipitation,19−23 makes magnetite even more attractive and worth to be investigated. The definition of the electrochemical behavior24−26 is thus the first step toward the assessment of the potential effectiveness of such a material. However, dealing with nanoparticles may result in practical problems connected to the intrinsic health hazard of nanoparticles themselves,27−30 particularly true when a large volume of material is involved, e.g., in the recovery of metal ions from large volumes of plating baths. The use of submicrometric aggregates with a high active surface area is a compromise between the performances, some of which are strongly connected to this parameter, and their ease of handling. Therefore, in the present study, the electrochemical activity of magnetite aggregates with the submicrometric size is investigated in both acidic and alkaline media. To assess the potential use of magnetite aggregates in large-volume applications, such as in electrochemical-based wastewater remediation, a dispersed active material configuration is investigated. The results are compared with the traditional configuration, which comprises the active particles supported on an inert electrode.
2. Results and Discussion
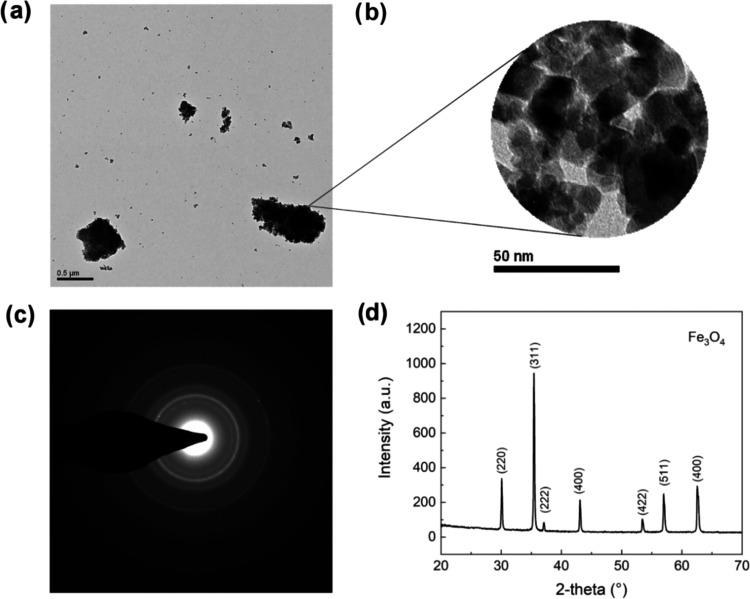
Magnetite nanoaggregates synthesized by the co-precipitation method were characterized by transmission electron microscopy (TEM) and X-ray diffraction (XRD) analyses. Figure 1a,b shows the TEM images of micrometric aggregates formed by small nanoparticles, having an average diameter of about 8–10 nm. These characteristics result in magnetite clusters that can be easily handled, avoiding the main drawback of nanoparticles, yet having a large surface area, a desired feature for electrochemical applications. The selected area electron diffraction (SAED) pattern obtained indicated the presence of Fe3O4 (Figure 1c). The result was also confirmed by the XRD pattern, obtained using a conventional Bragg–Brentano configuration, which showed the formation of pure magnetite (Figure 1d). No secondary iron oxide phases were detected from the XRD analysis. In addition, the high peak intensity-to-peak width ratio suggested the high crystallinity of the Fe3O4 clusters.
Figure 1.
(a, b) TEM images. (c) TEM diffraction pattern. (d) Diffraction pattern collected with XRD apparatus for magnetite aggregates.
2.1. Electrochemical Characterization in an Acidic Environment
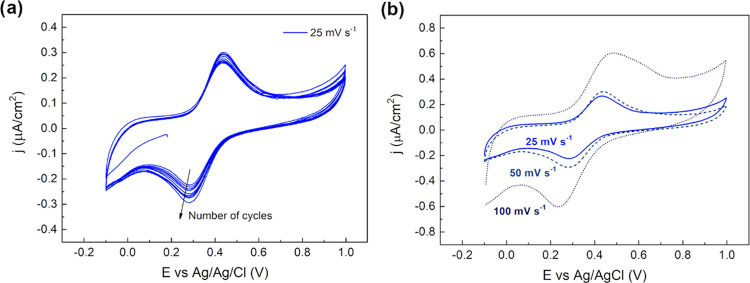
Cyclic voltammetries were first carried out in an acidic electrolyte, at room temperature, in a supported electrode configuration. A 10 g L–1 of Fe3O4 concentrated solution was drop-cast (5 μL) on the glassy carbon (GC) electrode surface. The resulting loading of nanoaggregates onto the GC electrode was 0.71 mg cm–2. Once the solvent was evaporated, particles were covered with 5 μL of Nafion solution, both to prevent their dissolution in acidic electrolyte and to guarantee their adhesion to the GC substrate, according to the procedure reported by Murugappan et al.26 As it can be seen from the results collected at 25 mV s–1, shown in Figure 2a, significant electrochemical activity was detected in both the cathodic and anodic branches. In particular, the reduction peak was centered at +0.28 V vs Ag/AgCl, while the corresponding oxidation one at +0.44 V vs Ag/AgCl, resulting in a peak-to-peak distance of ∼0.16 V. Furthermore, the peak intensity increased during the cycles both for the cathodic and the anodic sweeps. This trend may be attributed to better activation of the Nafion coating, gradually achieved over time, allowing a better diffusion of hydrogen ions through the protective film, thus improving the electrochemical response. The redox reactions are expected to be limited by the diffusion of protons through the Nafion layer.26 By keeping the particles’ load constant, the same experiment was performed with increasing scan rate, from 25 to 50 mV s–1 and 100 mV s–1.
Figure 2.
Cyclic voltammetry of magnetite aggregates supported on GC under acidic conditions (H2SO4, pH 4.5, room temperature). (a) Cyclability study at 25 mV s–1. (b) Effect of different scan rates at (25, 50, 100) mV s–1.
The first cycle for the three different scan rates is shown in Figure 2b, and the peak-to-peak distance increased with the scan rate, suggesting that a quasi-reversible process was involved, as already demonstrated in previous studies.26 Specifically, the peak-to-peak values (ΔV) measured for the different scan rates were ΔV25 = 0.16, ΔV50 = 0.19, ΔV100 = 0.23 V. The percentage of the effectively electroactive particles, in the supported configuration, was calculated by combining the moles of the particles electrochemically active, determined by charge exchanged during the cyclic voltammetries, with the amount of Fe3O4 effectively loaded onto the GC surface by drop-casting. In particular, the first value was extrapolated by integration of the redox peaks in the CV curves, considering Faraday’s law, while the latter was experimentally determined by knowing the solution concentration and the drop-cast volume (SI). Therefore, considering the loading of particles on the WE and the exchanged charge by peaks integration, the actual percentage of electroactive particles is equal to 0.0026%, for a calculated specific capacity of 0.039 mAh g –1. To understand how the percentage of effectively electroactive particles changed with the drop-cast volume, cyclic voltammetries were performed at different Fe3O4 loadings. Specifically, the drop-cast volume of the concentrated solution was varied from 1 to 7 μL while a scan rate of 100 mV s–1 was selected. The results reported in Table 1 show the increasing percentage of electroactive particles with decreasing drop-cast volume. This behavior suggested that only the aggregates in intimate contact with the electrolyte interface contributed to the electrochemical reaction, approximately 5% of particle utilization for 1 μL of concentrated solution, corresponding to a specific capacity of 75 mAh g–1.
Table 1. Percentage of Electroactive Particles as a Function of Drop-Cast Volume on the GC Electrode in Acid Solution (H2SO4, pH 4.5, Room Temperature).
| drop-cast volume (μL) | 1 | 3 | 5 | 7 |
|---|---|---|---|---|
| active particles (%) | 5 | 0.08 | 0.003 | 0.002 |
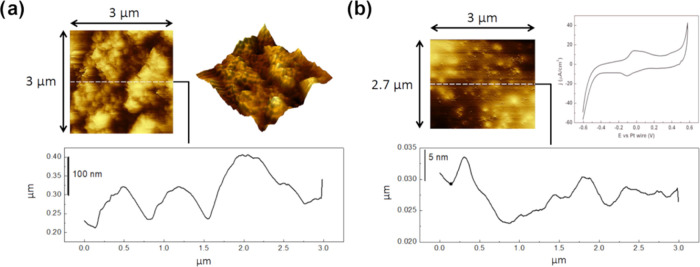
The chemical and electrochemical stability of the particles in the weakly acidic environment was then investigated using EC-AFM analysis recording particles’ topography before and after the electrochemical activity: 5 μL of a solution containing 10 g L–1 aggregates was drop-cast onto a gold electrode. For this experiment, the particles were not coated with the Nafion protective film to assess the stability of the bare Fe3O4. The CV was performed again in a dilute solution of sulfuric acid at pH 4.5 using Pt wire as the reference electrode (RE) and counter electrode (CE). Results in Figure 3 show that the supported particles, before the electrochemical activity, were characterized by a relatively rough surface; after the CV (Figure 3b), the topography completely changed, becoming flat, due to desegregation and dissolution phenomena induced by acidic pH and the applied potential. As expected, the results suggested the limited applicability of the Fe3O4 particles in acidic solutions. Due to this limitation, the electrochemical characterization of the magnetite particles was carried out under alkaline conditions.
Figure 3.
EC-AFM of magnetite nanoaggregates before (a) and after (b) cyclic voltammetry in acidic solution (H2SO4, pH 4.5, room temperature) and cyclic voltammetry at 100 mV s–1 collected during the analysis.
2.2. Electrochemical Characterization in an Alkaline Environment
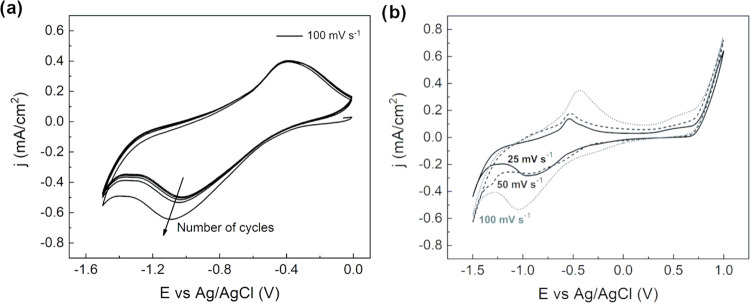
Cyclic voltammetry experiments in an alkaline electrolyte were performed using diluted NaOH solution at pH 12.8, at room temperature and different scan rates, i.e., 25, 50, and 100 mV s–1. The pH value was chosen to fit the experimental conditions in which iron-based particles are usually carried out in sensing applications.31 Moreover, considering the chemical stability of magnetite in an alkaline environment, the use of Nafion coating was not necessary, as previously explained. The CVs were performed analogously to the tests carried out in the acidic solution: the potential was scanned to −1.5 V vs Ag/AgCl to 1 V vs Ag/AgCl at different scan rates (Figure 4a,b). In the first case, 5 μL of magnetite nanoaggregate concentrated solution was drop-cast onto the GC surface. Referring to the iron Pourbaix diagram32 and considering the environmental conditions, several reactions could be observed. In particular, the first broad cathodic peak of current, centered at −0.9 V vs Ag/AgCl, suggested that different reduction reactions were involved. The reduction of Fe3O4 to iron hydroxide and, eventually, to metallic iron is probably occurring at potentials too close to be discriminated.
Figure 4.
(a) Cyclic voltammetry (100 mV s–1) at room temperature of magnetite nanoaggregates under alkaline conditions (NaOH, pH 12.8, room temperature). (b) Cyclic voltammetry (25, 50, 100 mV s–1) at room temperature of magnetite particles under alkaline conditions (NaOH, pH 12.8, room temperature). Supported electrode configuration.
Looking at the anodic branch, the current peak centered at −0.54 V vs Ag/AgCl could be attributed to the reverse electrochemical reaction i.e., oxidation to Fe3O4. As in the case of acidic conditions, redox peaks are here shifted with the scan rate: ΔV25 = 0.4 V, ΔV50 = 0.47 V, ΔV100 = 0.63 V. To study the variation of the percentage of effectively electroactive particles with the volume drop also for the alkaline case, electrochemical experiments involving different volumes, 1–7 μL, were performed at 100 mV s–1 in NaOH solution at pH 12.8 (Figure 5). Results in Figure 5 show that the percentage of electroactive particles again increased by decreasing the drop-cast volume, confirming that only the nanoaggregates close to the electrode surface take part in the electrochemical process. For the alkaline case, 10% of particle utilization was reached for 1 μL of concentrated solution, for a specific capacity of 156.6 mAh g–1. The increase in the percentage of particle utilization for the alkaline study can be ascribed to the absence of the Nafion coating, needed to carry out tests in an acidic environment to guarantee the particles’ stability.
Figure 5.
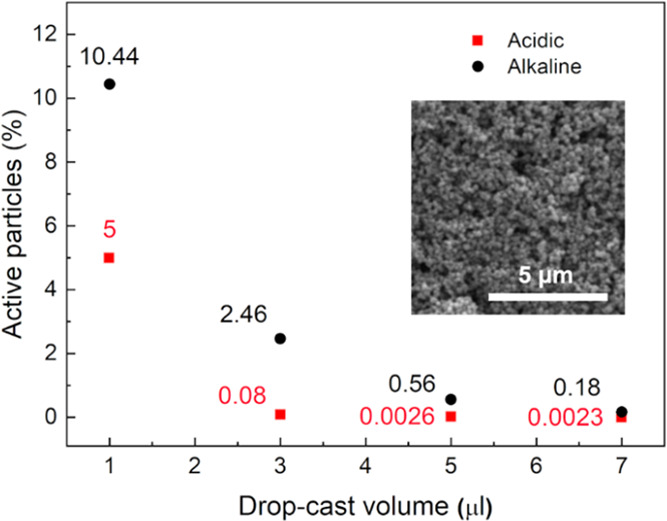
Percentage of electroactive particles as a function of drop-cast volume on GC electrode under acidic (H2SO4, pH 4.5, room temperature) (red) and alkaline (NaOH, pH 12.8, room temperature) (black) conditions. The inset shows the SEM micrograph of 7 μL of concentrated solution drop-cast on the GC electrode. Scale bar: 5 μm.
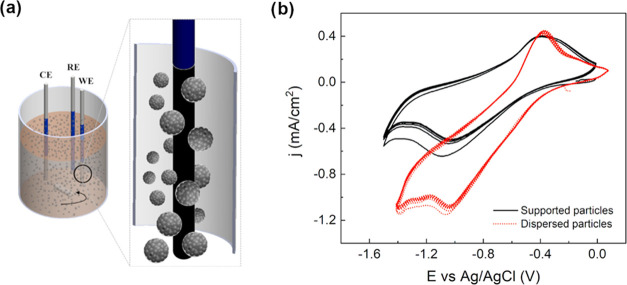
Because of the limited exploitation of the material due to the intrinsic constraints on the experimental setup, a different configuration was investigated. Specifically, the magnetite aggregates were dispersed in the solution rather than being in continuous contact with the current collector. By keeping the solution under stirring, the active particles eventually hit the surface of the electrode, contributing to the electrochemical reactions. Therefore, the use of magnetite particles as dispersed active materials was introduced to enhance the electrochemical activity by taking advantage of the continuous collisions of the particles with the WE (Figure 6a). Using the same electrolyte, the CV was recorded in dispersed configuration, and considering the same amount of magnetite particles used in the supported one, the potential sweep was run from 0 V vs Ag/AgCl to −1.5 V vs Ag/AgCl. As shown in Figure 6a, the positions of the peaks were unaffected by the configuration used, suggesting that the same redox reactions occurred. Nevertheless, higher current density values were recorded for the dispersed particles, suggesting that the number of electrochemically active species indeed increased thanks to aggregates collisions with the WE (Figure 6b).
Figure 6.
(a) Three-electrode configuration cell for dispersed electrode case where glassy carbon is used as WE, Pt wire as CE, and pseudo-RE. (b) Cyclic voltammetry (100 mV s–1, T = 25 °C) of magnetite nanoaggregates in supported (black) and dispersed (red dot) configurations under alkaline conditions (NaOH, pH 12.8, room temperature).
By comparing the dispersed electrode case with the supported one, it was possible to demonstrate the effective improvement of the percentage of active particles by a factor of 10, from 0.17 to 1.47%, for the same amount of nanoaggregates considered. This suggests the possibility of better utilization of the electroactive material in the dispersed case compared to the supported case. Moreover, the dispersion of the active material would allow the potential exploitation of Fe3O4 particles electrochemistry on the industrial scale. In fact, in this context, the supporting apparatus would significantly limit the amount of active material exploited (Figure 7).
Figure 7.
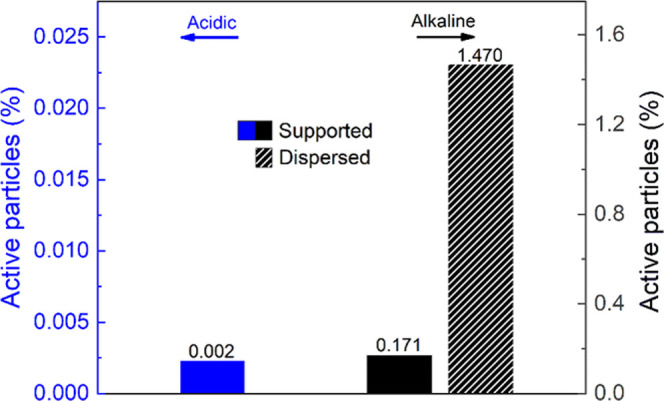
Percentage of electroactive particles under acidic (H2SO4, pH 4.5, room temperature) and alkaline (NaOH, pH 12.8, room temperature) conditions for supported (full) and dispersed (line pattern) nanoaggregates configurations calculated using eqs S1 and S2 (SI).
2.2.1. Fe3O4 Electrochemical Reactions
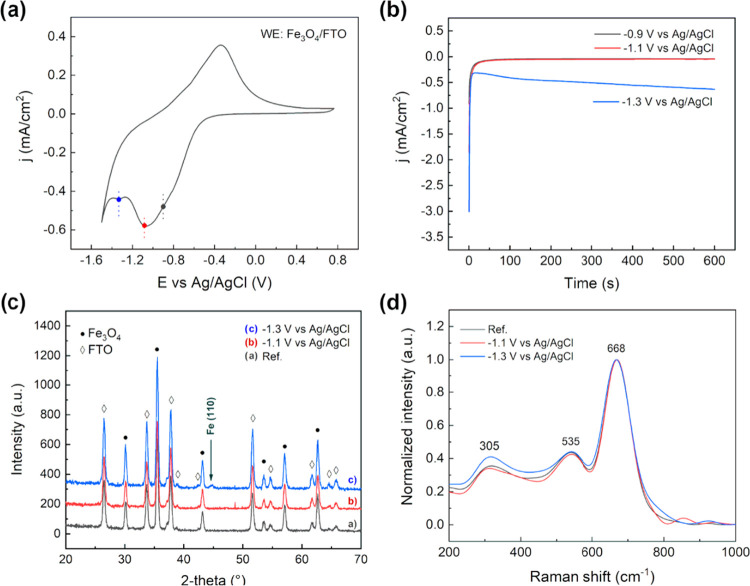
Additional tests were carried out to highlight the electrochemical reaction occurring at the magnetite nanoparticle surface. The Fe3O4 dispersion was drop-cast on fluorine-doped tin oxide (FTO)-coated soda lime glass, used as the working electrode (WE). The electrochemical behavior agreed with the previous result on the supported configuration. In the cathodic scan, two different peaks may be identified, suggesting two different reduction reactions to occur (Figure 8a). To further clarify the entity of such processes, potentiostatic tests were carried followed by microstructural analysis. The j–V characteristics of the polarization suggested a capacitive behavior up to −1.1 V vs Ag/AgCl. On the other hand, at −1.3 V vs Ag/AgCl, the current density stabilized at hundreds of μA cm–2, suggesting the occurrence of an electrochemical reaction (Figure 8b). X-ray diffraction was carried out on the Fe3O4/FTO electrode, showing the partial reduction of the magnetite to metallic iron (Figure 8c), as indicated by the diffraction peak at 2θ = 45°, at high cathodic potentials. On the other hand, no microstructural changes were observed at −1.1 V vs Ag/AgCl, as confirmed also by Raman spectroscopy (Figure 8d), showing the characteristic peaks of magnetite.
Figure 8.
(a) Cyclic voltammetry (25 mV s–1, T = 25 °C) of magnetite nanoaggregates supported on FTO, in a pH 12.8 solution. (b) Potentiostatic polarization curves (j–V graph) at varying electrode potential. (c) XRD pattern of the Fe3O4/FTO electrodes before and after polarization test. (d) Raman spectra of Fe3O4/FTO electrodes before and after polarization test.
An additional test was carried out to evaluate the reactivity of Fe3O4 at an extended polarization time. Specifically, the supported electrode (Fe3O4/FTO) was polarized for 5 h, at −1.3 V vs Ag/AgCl. The sample was then analyzed by XRD, in analogy to the previous test. The result obtained agreed with the 10 min test; no significant differences were observed in the magnetite pattern, while a small reflection peak associated with metallic iron was detected (Figure 9). This suggested the reaction to be surface-limited. Despite the polarization for a longer time, a limited portion of the iron oxide was converted: the formation of an external iron shell is expected. This interpretation agrees with the intensity of the metallic iron diffraction peak, which remained unchanged after 5 h of polarization. Once the external iron layer is formed, the iron oxide core is expected to react until it is no longer in contact with the electrolyte. At the same time, the iron external layer is cathodically polarized and reduction reactions, involving the solvent, are eventually occurring on the surface.
Figure 9.
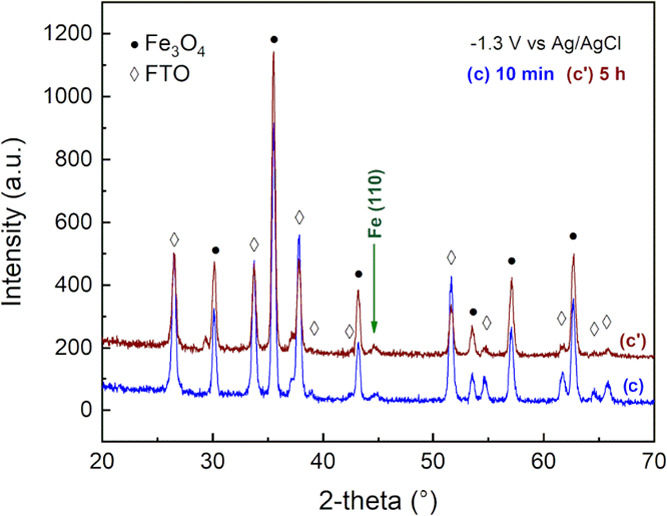
XRD pattern of the Fe3O4/FTO electrodes at different polarization times (10 min and 5 h) at −1.3 V vs Ag/AgCl.
3. Conclusions
The electrochemical behavior of magnetite nanoaggregates was investigated in both acidic and alkaline media by cyclic voltammetry, exploiting a three-electrode configurations. Overall, the percentage of active magnetite aggregates increased with decreasing drop-cast volume, for maximum utilization of 5% for the 1 μL case in acidic medium, showing an intrinsic limitation of the supported electrode setup. On the other hand, by dispersing the nanoaggregates in the alkaline electrolyte under stirring, the electrochemical response was increased more than two times. The dispersed active material approach allows taking advantage of a higher number of magnetite nanoaggregates collisions with the current collector, improving the electrochemical activity. XRD analysis after polarization tests showed the reduction to metallic iron at a high cathodic potential (<−1.3 V vs Ag/AgCl). The results suggested the formation of a core-shell structure, where the external Fe layer avoided further reaction of the inner Fe3O4 core.
4. Materials and Methods
Magnetite nanoparticle aggregates were synthesized by Captive System S.r.l., following a co-precipitation method previously reported.17 It is worth noticing that the process parameters and chemicals used for particle preparation can greatly affect their aggregation properties, which depend on the mixing rate of the acidic and alkaline solutions and organic coating thickness. Therefore, in this study, the mixing rate was carefully kept constant (25 mL min–1) to have nanoparticle aggregates with the same size for all electrochemical characterizations. The magnetite aggregates were obtained by a co-precipitation reaction in a basic environment described as follows. First, a solution of Fe(II) chloride and Fe(III) chloride (commercial grade, Brenntag) in a molar ratio of 1:2 was prepared. The alkaline solution was obtained by dissolving sodium hydroxide in distilled water. The as-prepared Fe(II–III) chloride solution and the basic solution were directed using two syringe pumps with a flow rate of 25 ml min–1 into a mixing device that ensures a turbulent flow. Subsequently, multiple cycles of washing using distilled water and centrifuge (Sorvall ST 8 Benchtop Centrifuge, Thermo Fisher Scientific) were performed aiming to remove the excess of NaOH. The washing procedure was repeated until the pH of the rinsing bath was neutral. Finally, the particles were recovered by filtration (Figure 10). A transmission scanning microscope (TEM) (PHILIPS CM200) was employed to determine the dimension and morphology of the as-produced magnetite aggregates. Particle morphology was studied through scanning electron microscopy (SEM) (Zeiss EVO 50 EP). X-ray diffraction (XRD) (Philips model PW1830. Kα1Cu = 1.54058 Å) was used to define the microstructure of the oxide. The as-obtained nanoparticles were then used to prepare a concentrated solution dispersing 10 g L–1 in demineralized water. The concentrated solution was thoroughly stirred for 2 h and sonicated for 1 h at 40 kHz to avoid further agglomeration.
Figure 10.
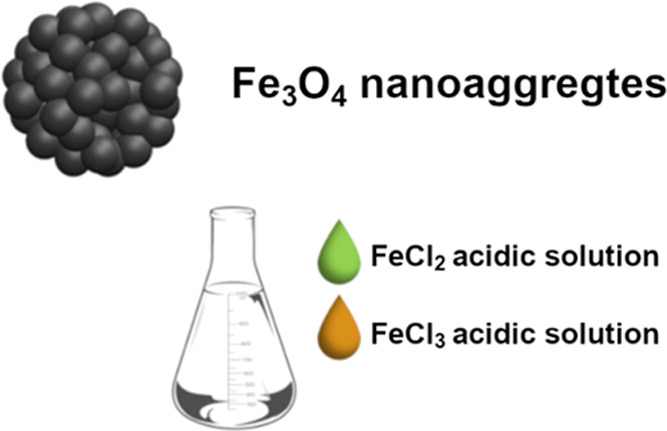
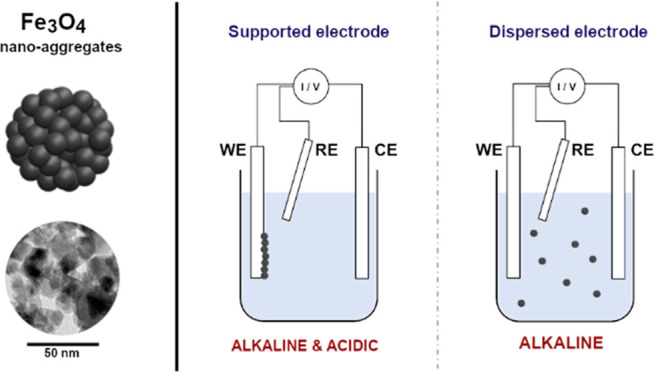
Schematic representation of magnetite aggregates used in this study and chemical precursors used for particle synthesis.
The electrochemical activity was characterized by cyclic voltammetry (CV) at 25, 50, and 100 mV s–1 using an AMEL 2550 potentiostat/galvanostat. A conventional three-electrode cell was considered where a platinum mesh was used as the counter electrode (CE), Ag/AgCl 3 M KCl as the reference electrode (RE), and glassy carbon (GC) electrode (3 mm diameter) as the working electrode (WE). The electrochemical tests were carried out in two different WE configurations. In the supported electrode configuration, 1–7 μL of the concentrated solution (Fe3O4 10 g L–1) was drop-cast on a mirror-polished glassy carbon and the solvent was allowed to evaporate for 30 min; a Nafion solution was obtained by thoroughly mixing 10 wt % Nafion perfluorinated resin solution (5 wt % in a mixture of lower aliphatic alcohols and water that contains 45 v/v % water, Sigma-Aldrich) in 2-propanol (Sigma-Aldrich), and 5 μL of the solution was then drop-cast onto the electrode surface and dried at room temperature for 1 h. On the other hand, in the dispersed active material configuration, the same amount of magnetite nanoaggregate concentrated solution was added directly into the electrolyte forming a suspension. In this case, a platinum pseudo-reference electrode was employed as RE to avoid any detrimental diffusion issues of the magnetite particles through the ceramic frit of the Ag/AgCl electrode. Therefore, the curves obtained in the dispersed configuration were shifted according to the potential difference between platinum and Ag/AgCl, experimentally determined by measuring the open-circuit potential in a two-electrode cell. The measure was performed in both acidic and alkaline solutions considered. The electrochemical activity of the nanoaggregates was first investigated in a H2SO4 (Sigma-Aldrich 95–98%) solution at pH 4.5 for both the configurations; the magnetite supported on the GC electrode was protected with a Nafion ionomer coating to avoid their dissolution due to the acidic environment. The electrochemical stability of magnetite particles, without Nafion coating, was investigated with EC-AFM (Keysight 5500 apparatus). AFM images were collected in contact mode before and after cyclic voltammetry in the acidic electrolyte. The electrochemical behavior was later assessed in NaOH (Sigma-Aldrich 97%) solution at pH 12.8 to compare the dispersed and supported configurations also in an alkaline environment. No Nafion coating is employed in this last configuration since magnetite particles are known to be stable in alkaline pH, in agreement with the Pourbaix diagram of iron.32
Acknowledgments
This work was supported by European Union’s Horizon 2020 research and innovation programme under grant agreement no. 821431 (PureNano).
Supporting Information Available
The Supporting Information is available free of charge at https://pubs.acs.org/doi/10.1021/acsomega.1c03142.
Calculation of the Fe3O4 active particle percentage (PDF)
The authors declare no competing financial interest.
Supplementary Material
References
- Schwertmann U.; Oxides T. I.. The Iron Oxides: Structure, Properties, Reactions, Occurrences and Uses, 2nd ed.; Cornell R. M.; Schwertmann U., Eds.; John Wiley & Sons: Weinheim, 2007; 2003. [Google Scholar]
- Goya G. F.; Berquó T. S.; Fonseca F. C.; Morales M. P. Static and Dynamic Magnetic Properties of Spherical Magnetite Nanoparticles. J. Appl. Phys. 2003, 94, 3520–3528. 10.1063/1.1599959. [DOI] [Google Scholar]
- Cheng G.; Zhao J.; Tu Y.; He P.; Fang Y. A Sensitive DNA Electrochemical Biosensor Based on Magnetite with a Glassy Carbon Electrode Modified by Muti-Walled Carbon Nanotubes in Polypyrrole. Anal. Chim. Acta 2005, 533, 11–16. 10.1016/j.aca.2004.10.044. [DOI] [Google Scholar]
- Gao L.; Zhuang J.; Nie L.; Zhang J.; Zhang Y.; Gu N.; Wang T.; Feng J.; Yang D.; Perrett S.; Yan X. Intrinsic Peroxidase-like Activity of Ferromagnetic Nanoparticles. Nat. Nanotechnol. 2007, 2, 577–583. 10.1038/nnano.2007.260. [DOI] [PubMed] [Google Scholar]
- Rossi L. M.; Quach A. D.; Rosenzweig Z. Glucose Oxidase-Magnetite Nanoparticle Bioconjugate for Glucose Sensing. Anal. Bioanal. Chem. 2004, 380, 606–613. 10.1007/s00216-004-2770-3. [DOI] [PubMed] [Google Scholar]
- Jordan A.; Scholz R.; Wust P.; Fähling H.; Felix R. Magnetic Fluid Hyperthermia (MFH): Cancer Treatment with AC Magnetic Field Induced Excitation of Biocompatible Superparamagnetic Nanoparticles. J. Magn. Magn. Mater. 1999, 201, 413–419. 10.1016/S0304-8853(99)00088-8. [DOI] [Google Scholar]
- Jordan A.; Scholz R.; Wust P.; Schirra H.; Thomas S.; Schmidt H.; Felix R. Endocytosis of Dextran and Silan-Coated Magnetite Nanoparticles and the Effect of Intracellular Hyperthermia on Human Mammary Carcinoma Cells in Vitro. J. Magn. Magn. Mater. 1999, 194, 185–196. 10.1016/S0304-8853(98)00558-7. [DOI] [Google Scholar]
- Brähler M.; Georgieva R.; Buske N.; Muller A.; Muller S.; Pinkernelle J.; Teichgräber U.; Voigt A.; Bäumler H. Magnetite-Loaded Carrier Erythrocytes as Contrast Agents for Magnetic Resonance Imaging. Nano Lett. 2006, 6, 2505–2509. 10.1021/nl0618501. [DOI] [PubMed] [Google Scholar]
- Bulte J. W. M.; Kraitchman D. L. Iron Oxide MR Contrast Agents for Molecular and Cellular Imaging. NMR Biomed. 2004, 17, 484–499. 10.1002/nbm.924. [DOI] [PubMed] [Google Scholar]
- Hu A.; Yee G. T.; Lin W. Magnetically Recoverable Chiral Catalysts Immobilized on Magnetite Nanoparticles for Asymmetric Hydrogenation of Aromatic Ketones. J. Am. Chem. Soc. 2005, 127, 12486–12487. 10.1021/ja053881o. [DOI] [PubMed] [Google Scholar]
- Ranjbakhsh E.; Bordbar A. K.; Abbasi M.; Khosropour A. R.; Shams E. Enhancement of Stability and Catalytic Activity of Immobilized Lipase on Silica-Coated Modified Magnetite Nanoparticles. Chem. Eng. J. 2012, 179, 272–276. 10.1016/j.cej.2011.10.097. [DOI] [Google Scholar]
- Qu Q.; Yang S.; Feng X. 2D Sandwich-like Sheets of Iron Oxide Grown on Graphene as High Energy Anode Material for Supercapacitors. Adv. Mater. 2011, 23, 5574–5580. 10.1002/adma.201103042. [DOI] [PubMed] [Google Scholar]
- Zhao X.; Johnston C.; Crossley A.; Grant P. S. Printable Magnetite and Pyrrole Treated Magnetite Based Electrodes for Supercapacitors. J. Mater. Chem. 2010, 20, 7637–7644. 10.1039/c0jm00028k. [DOI] [Google Scholar]
- Zhang W. M.; Wu X. L.; Hu J. S.; Guo Y. G.; Wan L. J. Carbon Coated Fe3O4 Nanospindles as a Superior Anode Material for Lithium-Ion Batteries. Adv. Funct. Mater. 2008, 18, 3941–3946. 10.1002/adfm.200801386. [DOI] [Google Scholar]
- Zhang S.; Li C.; Zhang X.; Sun X.; Wang K.; Ma Y. High Performance Lithium-Ion Hybrid Capacitors Employing Fe3O4-Graphene Composite Anode and Activated Carbon Cathode. ACS Appl. Mater. Interfaces 2017, 9, 17136–17144. 10.1021/acsami.7b03452. [DOI] [PubMed] [Google Scholar]
- Kumari M.; Pittman C. U.; Mohan D. Heavy Metals [Chromium (VI) and Lead (II)] Removal from Water Using Mesoporous Magnetite (Fe3O4) Nanospheres. J. Colloid Interface Sci. 2015, 442, 120–132. 10.1016/j.jcis.2014.09.012. [DOI] [PubMed] [Google Scholar]
- Moscatelli (12) United States Patent (54) AMPHIPHILIC MAGNETIC NANOPARTICLES AND AGGREGATES TO REMOVE HYDROCARBONS AND METAL IONS AND SYNTHESIS THEREOF (58) Field of Classification Search Written Opinion of PCT/IB2015/053652 Dated Sep Prior Publication Dat, 2015.
- Feng Z.; Zhu S.; Martins De Godoi D. R.; Samia A. C. S.; Scherson D. Adsorption of Cd 2+ on Carboxyl-Terminated Superparamagnetic Iron Oxide Nanoparticles. Anal. Chem. 2012, 84, 3764–3770. 10.1021/ac300392k. [DOI] [PubMed] [Google Scholar]
- Ahn T.; Kim J. H.; Yang H. M.; Lee J. W.; Kim J. D. Formation Pathways of Magnetite Nanoparticles by Coprecipitation Method. J. Phys. Chem. C 2012, 116, 6069–6076. 10.1021/jp211843g. [DOI] [Google Scholar]
- Valenzuela R.; Fuentes M. C.; Parra C.; Baeza J.; Duran N.; Sharma S. K.; Knobel M.; Freer J. Influence of Stirring Velocity on the Synthesis of Magnetite Nanoparticles (Fe3O4) by the Co-Precipitation Method. J. Alloys Compd. 2009, 488, 227–231. 10.1016/j.jallcom.2009.08.087. [DOI] [Google Scholar]
- Khalil M. I. Co-Precipitation in Aqueous Solution Synthesis of Magnetite Nanoparticles Using Iron(III) Salts as Precursors. Arabian J. Chem. 2015, 8, 279–284. 10.1016/j.arabjc.2015.02.008. [DOI] [Google Scholar]
- Petcharoen K.; Sirivat A. Synthesis and Characterization of Magnetite Nanoparticles via the Chemical Co-Precipitation Method. Mater. Sci. Eng., B 2012, 177, 421–427. 10.1016/j.mseb.2012.01.003. [DOI] [Google Scholar]
- Mascolo M. C.; Pei Y.; Ring T. A. Room Temperature Co-Precipitation Synthesis of Magnetite Nanoparticles in a Large Ph Window with Different Bases. Materials 2013, 6, 5549–5567. 10.3390/ma6125549. [DOI] [PMC free article] [PubMed] [Google Scholar]
- Cabrera L.; Gutierrez S.; Menendez N.; Morales M. P.; Herrasti P. Magnetite Nanoparticles: Electrochemical Synthesis and Characterization. Electrochim. Acta 2008, 53, 3436–3441. 10.1016/j.electacta.2007.12.006. [DOI] [Google Scholar]
- Rodríguez-López A.; Torres-Torres D.; Mojica-Gomez J.; Estrada-Arteaga C.; Antaño-López R. Characterization by Electrochemical Impedance Spectroscopy of Magnetite Nanoparticles Supported on Carbon Paste Electrode. Electrochim. Acta 2011, 56, 8078–8084. 10.1016/j.electacta.2010.11.039. [DOI] [Google Scholar]
- Murugappan K.; Silvester D. S.; Chaudhary D.; Arrigan D. W. M. Electrochemical Characterization of an Oleyl-Coated Magnetite Nanoparticle-Modified Electrode. ChemElectroChem 2014, 1, 1211–1218. 10.1002/celc.201402012. [DOI] [Google Scholar]
- Bystrzejewska-Piotrowska G.; Golimowski J.; Urban P. L. Nanoparticles: Their Potential Toxicity, Waste and Environmental Management. Waste Manage. 2009, 29, 2587–2595. 10.1016/j.wasman.2009.04.001. [DOI] [PubMed] [Google Scholar]
- Kreyling W. G.; Semmler-Behnke M.; Möller W. Health Implications of Nanoparticles. J. Nanopart. Res. 2006, 8, 543–562. 10.1007/s11051-005-9068-z. [DOI] [Google Scholar]
- Warheit D. B. Nanoparticles: Health Impacts?. Mater. Today 2004, 7, 32–35. 10.1016/S1369-7021(04)00081-1. [DOI] [Google Scholar]
- Hoet P. H. M.; Brüske-Hohlfeld I.; Salata O. V. Nanoparticles - Known and Unknown Health Risks. J. Nanobiotechnol. 2004, 2, 12 10.1186/1477-3155-2-12. [DOI] [PMC free article] [PubMed] [Google Scholar]
- Tian K.; Prestgard M.; Tiwari A. A Review of Recent Advances in Nonenzymatic Glucose Sensors. Mater. Sci. Eng., C 2014, 41, 100–118. 10.1016/j.msec.2014.04.013. [DOI] [PubMed] [Google Scholar]
- Beverskog B.; Puigdomenech I. Revised Pourbaix Diagrams for Iron at 25-300°C. Corros. Sci. 1996, 38, 2121–2135. 10.1016/S0010-938X(96)00067-4. [DOI] [Google Scholar]
Associated Data
This section collects any data citations, data availability statements, or supplementary materials included in this article.


