

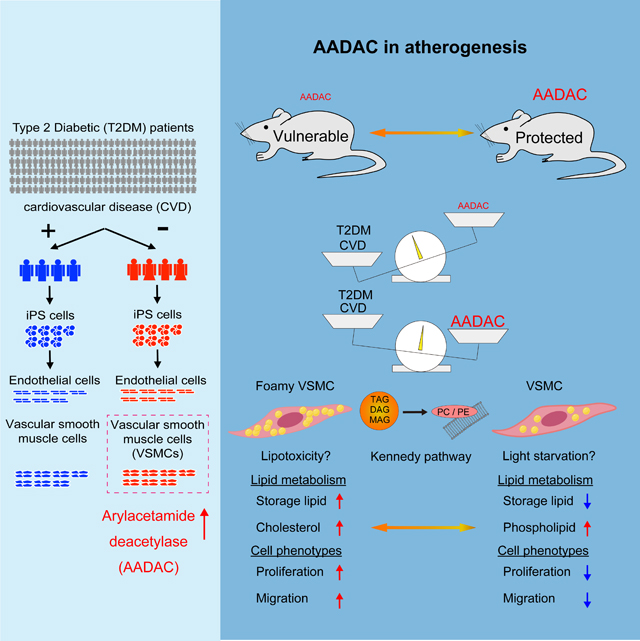
Summary
Although susceptibility to cardiovascular disease (CVD) is different for every patient, why some patients with type II diabetes mellitus (T2DM) develop CVD while others are protected has not yet been clarified. Using T2DM patient-derived hiPSCs, we found that in patients protected from CVD there was significantly elevated expression of an esterase, arylacetamide deacetylase (AADAC) in vascular smooth muscle cells (VSMCs). We overexpressed this esterase in human primary VSMCs and VSMCs differentiated from hiPSCs and observed that the number of lipid droplets was significantly diminished. Further metabolomic analyses revealed a marked reduction in storage lipids and an increase in membrane phospholipids suggesting changes in the Kennedy pathway of lipid bioassembly. Cell migration and proliferation were also significantly decreased in AADAC-overexpressing VSMCs. Moreover, apolipoprotein E (Apoe) knockout mice overexpressing VSMC-specific Aadac showed amelioration of atherosclerotic lesions. Our findings suggest that higher AADAC expression in VSMCs protects T2DM patients from CVD.
Graphical Abstract
Introduction
T2DM has long been recognized as a major risk factor for CVD. However, the mechanisms involved in T2DM leading to CVD require further investigation. It has not yet been elucidated why only certain populations of diabetic patients appear protected from CVD while others are affected by the physiologic consequences imposed by diabetes. The endogenous factors protecting against CVD are not fully known, although a number of genetic, epigenetic and metabolic factors have been associated with the onset of CVD in T2DM patients (De Rosa et al., 2018).
Induced pluripotent stem cells (iPSCs) have the ability to differentiate into all adult cell types in vitro and have become a powerful tool for understanding human disease (Takahashi et al., 2007; Takahashi and Yamanaka, 2006; Yu et al., 2007). iPSCs have primarily been used for modeling monogenic human diseases as iPSC-derived cells carry the causal genotype and are likely to recapitulate disease associated cellular phenotypes (Ebert et al., 2009). We recently showed iPSCs may also prove useful for exploring polygenic diseases such as metabolic diseases in a dish (Warren et al., 2017a; Warren et al., 2017b). Thus, iPSCs harboring complex polygenic genotypes can be utilized for studies of disease relevant phenotypes such as expression quantitative trait loci (eQTL) and functional QTL (fQTL) studies (Warren et al., 2017b). In several reports, iPSCs ascertained solely on clinical phenotypes have been shown to recapitulate disease specific cellular phenotypes (Brennand et al., 2015; Carcamo-Orive et al., 2017; Drawnel et al., 2014). Although the promise of iPSCs to reveal the molecular basis of disease when derived from patients with a specific clinical phenotype but of unknown genotype remains unrealized.
Results
AADAC is upregulated in differentiated VSMCs derived from type2 diabetic patients without CVD
In this study, we sought to identify the endogenous molecular factors that protect some T2DM patients from CVD using hiPSCs. A major obstacle is the inaccessibility of human vascular cells, which are known to play important roles in the onset of CVD. Human primary vascular cells are not easily isolated from patients, especially those who do not undergo surgical procedures. However, we recently established an efficient method for differentiating hiPSCs into endothelial cells (ECs) and VSMCs that could be used to faithfully model human diseases as confirmed by the transcription profiles, protein expression, functional assessment, and in vivo assessment (Patsch et al., 2015). We identified two cohorts of T2DM patients from a patient database at Massachusetts General Hospital (MGH), the first consisting of T2DM patients without CVD and the second comprised of T2DM patients with CVD (Fig. 1A). Surprisingly, we found a very small number of the patients who had suffered from T2DM for an extended period, 17–37 years, but had not been diagnosed with any stenosis or occlusion in their coronary arteries as determined by direct coronary catheterization (Table S1). Some individuals without CVD exhibited severe diabetic nephropathy and retinopathy, suggesting that they had already suffered diabetic microvascular complications but were devoid of any measurable macrovascular complications. The second group of patients also had T2DM but had been diagnosed with CVD despite in some cases a brief history of diabetes (Table S1). We generated seven hiPSC lines from four T2DM patients without CVD and seven hiPSC lines from four T2DM patients with CVD and confirmed they exhibited markers associated with undifferentiated pluripotent cells and retained normal karyotypes. All the patient-derived hiPSC lines were differentiated into ECs (dECs) and VSMCs (dVSMCs) (Figures 1A–1C and Figures S1A–S1D). We next performed transcriptional profiling of patient-derived vascular cells in order to investigate the molecular mechanisms that appear to protect certain diabetic patients from CVD.
Figure 1: AADAC is upregulated in dVSMCs derived from type 2 diabetic patients without CVD.

(A) Experimental scheme for transcriptional profiling experiments of endothelial cells (dECs) and vascular smooth muscle cells (dVSMCs) differentiated from type 2 diabetic patients with or without cardiovascular disease (CVD).
(B and C) Representative immunofluorescence staining for vascular endothelial cadherin (VE-cadherin) and Von Willebrand factor (vWF) in dECs (B), and for alpha smooth muscle actin (αSMA) and Calponin in dVSMCs (C). (DAPI nuclear counterstain; Scale bar: 100 μm.)
(D and E) Volcano plots of gene expression differences in dECs (D) and dVSMC (E) derived from T2DM patients without CVD compared with T2DM patients with CVD. Red dots denote genes with a false discovery rate (FDR) < 20%.
(F and G) Heatmaps of the top ranking gene list (F) and the bottom ranking gene list (G) (FDR< 20%) in dVSMCs derived from T2DM patients without CVD.
(H) Top and bottom ranking of dbGAP gene sets enriched in dVSMCs derived from T2DM patients without CVD vs patients with CVD.
(I and J) Heatmaps of cholesterol homeostasis-related genes (I) and cell proliferation-related genes (J) in dVSMCs derived from T2DM patients with and without CVD.
(K and L) Quantitative polymerase chain reaction (qPCR) expression analysis of AADAC (K) and MMP13 (L) in human primary VSMCs (T2DM with CVD: n = 9; Healthy control: n = 4, by Mann-Whitney test).
Data represent mean ± standard error of the mean (SEM), *P < 0.05. See also Figure S1, Table S1–S3.
When gene expression profiles of the two patient cohorts were compared, the extent of gene expression differences between dECs was much less than those observed in dVSMCs (Figures 1D and 1E; Tables S2 and S3). In fact, only one gene was observed with a significant expression difference in dECs between the two cohorts while 266 genes exhibited statistically significant expression changes in dVSMCs (Figures 1D and 1E). Further examination of those genes significantly downregulated in dVSMCs from T2DM patients protected from CVD revealed a number of genes previously reported as risk factors for CVD. Interestingly, the gene most downregulated was matrix metallopeptidase 13 (MMP13) (−11.2-fold change), which is known to play a pivotal role in the regulation of collagen and calcification in atherosclerotic plaques (Deguchi et al., 2005; Hutcheson et al., 2016; Quillard et al., 2014) (Figure 1G and Table S3). Additionally, the second most downregulated gene, biglycan (BGN) (−8.3-fold change), has also been reported to increase VSMC proliferation and migration and is thought to influence the susceptibility of arteries to vascular injury (Shimizu-Hirota et al., 2004) (Figure 1G and Table S3). In contrast, we found that the gene most highly expressed in dVSMCs derived from T2DM patients without CVD as compared to those from T2DM patients with CVD was arylacetamide deacetylase (AADAC) (27.5-fold change), which has previously been described to function as an esterase at the endoplasmic reticulum (ER) (Trickett et al., 2001) (Figures 1E and 1F; Table S3). AADAC exhibited extraordinarily high expression in dVSMCs derived from T2DM without CVD even when compared to the other genes exhibiting increased expression (Figure 1E). Of note, the expression of VSMC markers, alpha smooth muscle actin (αSMA) and smooth muscle 22 alpha (SM22), were indistinguishable between the two patient cohorts (Figures S1C and S1D). We verified the observed expression differences in dVSMCs of AADAC and MMP13 by quantitative polymerase chain reaction (qPCR) (AADAC: 10.5-fold, p = 0.004; MMP13: 0.04-fold, p = 0.026) (Figures S1E and S1F). Further gene set enrichment analysis using the database of human genotypes and phenotypes (dbGaP) showed that lipid metabolism-related genes were activated in dVSMCs from T2DM patients without CVD while coronary artery disease-related genes were decreased (Figure 1H). A second gene set enrichment analysis using Hallmark gene sets indicated that cholesterol metabolism-related genes were upregulated and genes associated with cell proliferation-related were downregulated (Figures 1I and 1J). These analyses suggested that the potential endogenous protective mechanism against atherosclerosis in these patients may involve lipid metabolism and cell proliferation in VSMCs. Moreover, we could confirm dVSMCs from even healthy individuals (4 cell lines from 3 healthy individuals) had higher AADAC expression than dVSMCs derived from T2DM patients with CVD while MMP13 expression oppositely tended to decrease in healthy people (AADAC: 4.51-fold, p = 0.04; MMP13: 0.04-fold, p = 0.07) (Figures S1E and S1F). Similar results were observed in primary human VSMCs isolated from healthy control (n = 4) and T2DM patients with CVD (n = 9) (AADAC: 3.48-fold, p = 0.01; MMP13: 0.41-fold, p = 0.05) (Figures 1K and 1L). Previous reports have shown that AADAC functions as an esterase in the liver assembling very low-density lipoprotein (VLDL) or promoting β-oxidation (Lo et al., 2010; Quiroga and Lehner, 2011; Trickett et al., 2001). However, AADAC function in VSMCs has not been investigated. As it has been reported that the overexpression of similar lipid hydrolases at the ER, such as cholesteryl esters hydrolase 1 (CEH1) in macrophages, reduced atherosclerotic lesions (Zhao et al., 2007), we sought to clarify the function of AADAC in VSMCs and understand the mechanism of its potential protection against CVD.
AADAC overexpression affects lipid metabolism in human VSMCs
We hypothesized that individuals with higher levels of expression of AADAC in VSMCs may be protected from CVD, especially as AADAC expression in VSMCs is generally quite low when compared to cell types in other organs such as liver and intestines (Table S4). To explore this hypothesis, we established a doxycycline (Dox) inducible AADAC expression system using lentivirus in both primary coronary artery VSMCs (CAVSMCs) and dVSMCs which increased the expression of AADAC to similar levels as those observed in dVSMC from T2DM patients without CVD (Figures 2A, S1E, S1G, and S1H). As AADAC has a known function in lipid metabolism in other tissues we sought to examine the lipid content of VSMCs by staining intracellular neutral lipid droplets with LipidTOX or BODIPY 493/503 and quantifying the number of droplets per cell by high content imaging using a Cellomics Arrayscan. These analyses revealed that the number of lipid droplets per cell significantly decreased both in CAVSMCs and dVSMCs overexpressing AADAC (CAVSMC: 36.4 ± 4.4 / cell vs. 20.6 ± 1.3 / cell, p = 0.0003; dVSMC: 11.7 ± 0.2 / cell vs. 7.0 ± 0.6 / cell, p = 0.001) (Figures 2B–2E, S1I, and S1J). Whereas, the number of lipid droplets did not change in VSMCs where GFP was overexpressed using the same titer of virus and the same amount of Dox (Figures 2B–2E). To verify the effect of AADAC on lipid metabolism, we also generated AADAC knockout cell lines from a hiPSC from T2DM patient without CVD (Figures S2A–S2C). We observed a significant increase in the number of lipid droplets in AADAC knockout dVSMCs, suggesting that the level of AADAC expression is inversely correlated with the number of lipid droplets per cell (Figure S2D). To further investigate possible alterations in lipid metabolism, we performed comprehensive metabolomic and lipidomic analyses via mass spectroscopy with the wild type (n = 6) and the AADAC-overexpressing VSMCs (n = 6). Although many lipid types were generally reduced in AADAC-overexpressing VSMCs, storage lipids such as triacylglycerol (TAG) and diacylglycerol (DAG) were dramatically decreased (CAVSMC: −17.3%, p = 0.04 (TAG) and −23.7%, p = 0.006 (DAG); dVSMC: −25.0%, p = 0.003 (TAG) and −24.5%, p = 0.001 (DAG)) (Figures 2F and 2G). Upon investigating the lipid composition of AADAC-overexpressing cells, we found that phosphatidylcholine (PC) was increased in both VSMC lines, especially in dVSMCs (CAVSMC: 34.2 ± 0.1% vs. 34.7 ± 0.2%, p = 0.06; dVSMC: 37.8 ± 0.1% vs. 39.8 ± 0.2%, p < 0.0001), of note among the PC species, unsaturated PCs were significantly increased in AADAC overexpressing VSMCs (Figure S1K). Again we observed several species of storage lipids were markedly decreased (Figures 2H and 2I). This quantitative reduction in storage lipids was consistent with the observed decrease in lipid droplets. Cholesterol and saturated fatty acids have been reported to increase in the cell membranes of T2DM and obese patients with a higher cholesterol/ phospholipid ratio observed in these patients, which is thought to contribute to membrane rigidity and affect signaling pathways related to membrane proteins such as the insulin receptor (Bakan et al., 2006; Perona, 2017). Increased intracellular phospholipid biosynthesis has also been reported as an important adaptive response to excess free cholesterol (Shiratori et al., 1994). The increase of phospholipid and unsaturated fatty acid observed in AADAC overexpressing VSMCs may ameliorate the environmental changes associated with lipid metabolism and membrane fluidity associated with T2DM and obesity. Taken together, these results suggest that AADAC overexpression may work to alter lipid metabolism in VSMCs and thereby protect against atherosclerosis.
Figure 2: AADAC overexpression affects lipid metabolism in human VSMCs.

(A) Schematic of doxycycline (Dox)-inducible AADAC overexpression by lentivirus and quantification of lipid droplets in human VSMCs.
(B-E) Representative staining for neutral lipid droplets by lipidTOX and immunofluorescence staining for GFP on culture day 7 in CAVSMCs (B) and dVSMCs (C) infected by GFP- or AADAC-overexpressing lentivirus with or without Dox (Scale bar: 50 μm.), and number of lipid droplets per cell in CAVSMCs (D; n = 5) and dVSMCs (E; n = 4) on day 0 and day 7. one-way ANOVA with Sidak’s multiple comparisons test.
(F and G) Total amount of lipid detected in CAVSMCs (F) and dVSMCs (G) (n = 6). Welch’s two-sample t-test. CE, Cholesterol Ester; TAG, Triacylglycerol; DAG, Diacylglycerol; MAG, Monoacylglycerol; FFA, Free Fatty Acid; SM, Sphingomyelin; CER, Ceramide; HCER, Hexosylceramide; LCER, Lactosylceramide; DCER, Dihydroceramide; PC, Phosphatidylcholine; PE, Phosphatidylethanolamine; PI, Phosphatidylinositol; LPC, Lysophosphatidylcholin; LPE, Lysophosphatidylethanolamine.
(H and I) Mole percentage of phospholipids and storage lipids in CAVSMCs (H) and dVSMCs (I) (n = 6) in relation to the total number of lipid classes detected. Illustrations show lipid classes that achieved statistically significant increase (red) and decrease (blue) (P < 0.05), as well as those approaching significant increase (light red) (0.05 < P < 0.10). Welch’s two-sample t-test. Data represent mean ± SEM, *P < 0.05, **P < 0.01, ***P < 0.001, ****P < 0.0001. See also Figure S1 and S2, Table S4.
AADAC overexpression reduces the migration and proliferation in human VSMCs
A number of additional cellular processes are thought to play key roles in the contribution of VSMCs to atherosclerosis and CVD, including migration, proliferation, and apoptosis (Allahverdian et al., 2018; Lacolley et al., 2012). As our previous transcriptional analysis had identified cell proliferation-related genes downregulated in dVSMCs derived from T2DM patients without CVD (Figure 1J), we investigated the effects of AADAC on proliferation, as well as the associated cellular processes of migration and apoptosis. We found AADAC overexpression reduced the proliferation of VSMCs as measured by proliferating cell nuclear antigen (PCNA) positive cells (CAVSMC: 15.2 ± 0.8% vs. 7.4 ± 0.4%, p = 0.0002; dVSMC: 58.3 ± 1.9% vs. 47.5 ± 1.3%, p = 0.01) (Figures 3A and 3B). Interestingly, migration also decreased significantly in AADAC-overexpressing VSMCs (CAVSMC: 267953 ± 26545 μm2 vs. 117434 ± 26650 μm2, p < 0.0001 (36 hours); dVSMC: 499281 ± 27476 μm2 vs. 354771 ± 57237 μm2, p = 0.03 (24 hours)) (Figures 3C and 3D). Furthermore, the high-content imaging analysis showed that the percentage of cleaved Caspase 3 positive cells in AADAC-overexpressing VSMCs did not increase but rather decreased (Figures 3E and 3F). In contrast, proliferation, migration and apoptosis were not changed in GFP-overexpressing VSMCs (Figures 3A–3F). Although it was technically difficult to generate AADAC knockout CAVSMCs, AADAC knockout dVSMCs exhibited significantly increased proliferation and migration, suggesting that the level of AADAC expression was inversely related to these cellular processes (Figures S2E–S2H). These results suggest that expression levels of AADAC may function to alter the progression of atherosclerosis by affecting lipid accumulation, proliferation, migration and possibly apoptosis in VSMCs.
Figure 3. AADAC overexpression reduces the migration, proliferation, and apoptosis in human VSMCs.

(A and B) Representative immunostaining of PCNA positive cells (Scale bar: 50 μm.) and percentage of PCNA positive cells of CAVSMCs (A; n = 5) and dVSMCs (B; n = 10) infected by GFP- or AADAC- overexpressing lentivirus with or without doxycycline (Dox). one-way ANOVA with Sidak’s multiple comparisons test.
(C and D) Representative images of cell migration (Scale bar: 100 μm.) and quantified cell migration area of CAVSMCs (C; n = 8) and dVSMCs (D; n = 4) infected by GFP- or AADAC- overexpressing lentivirus with or without doxycycline (Dox) treatment. Red lines represent the borders of cell migration. two-way ANOVA with Sidak’s multiple comparisons test.
(E and F) Representative immunostaining of Cleaved Caspase 3 (CC-3) positive cells (Scale bar: 50 μm.) and percentage of Cleaved Caspase 3 positive cells of CAVSMCs (E; n = 10) and dVSMCs (F; n = 10) infected by GFP- or AADAC- overexpressing lentivirus with or without doxycycline (Dox) treatment. one-way ANOVA with Sidak’s multiple comparisons test (E) and Kruskal-Wallis test (F).
Data represent mean ± SEM, *P < 0.05, **P < 0.01, ***P < 0.001, ****P < 0.0001. See also Figure S2.
Aadac-overexpressing Apoe deficient mice show the significant improvement of atherosclerosis
To investigate the function of AADAC in vivo, we generated transgenic Apoe deficient (Apoe−/−) mice which overexpress Aadac specifically in VSMCs (Aadac-Tg mouse). First, we generated transgenic Apoe−/− mice harboring an inducible expression cassette containing the CAG promoter, a floxed STOP sequence, a cDNA encoding mouse Aadac, and an IRES-GFP. Next, we crossed these mice with a strain that expresses Cre recombinase under the control of the SM22 promoter (SM22-Cre) thereby restricting Cre expression to VSMCs (Boucher et al., 2003). We confirmed that GFP was overexpressed in aortic VSMCs of the Aadac-Tg mouse (Mendeley Data). Isolated mouse primary VSMCs (mpVSMC) also expressed GFP and AADAC (Mendeley Data). In the Aadac-Tg mouse, we confirmed via histological analysis that the morphology of the aorta was not altered as compared to wild type animals. Moreover, we verified that Aadac was not overexpressed in monocytes in our Aadac-Tg mice (Mendeley Data). The atherosclerotic lesions at the aorta and the stenosis of the brachiocephalic artery were significantly ameliorated in the Aadac-Tg mice (n = 5) fed a high-fat diet (−50.9% in the atherosclerotic lesions and −41.2% in the stenosis) while body weight and serum levels of triglyceride and cholesterol were not different when compared to littermate control mice (n = 9) (Figures 4A–4C, body weight and lipid data are in Mendeley Data). A closer examination of the mpVSMCs from Aadac-Tg mice revealed a reduction of the number of lipid droplets per cell when compared to mpVSMCs with wild-type levels of Aadac (21.6 ± 1.6 / cell vs. 12.9 ± 0.5 / cell, p = 0.002). These data closely mirrored those from human VSMCs (Figure 4D). To confirm our findings, we also generated VSMC specific Aadac knockout mice in which the lipase active site was deleted, and found that the atherosclerotic lesions at the aorta and the stenosis of the brachiocephalic artery exhibited significant expansion in the Aadac knockout mice (n = 10) compared to littermate control mice (n = 9) (65.6% in the atherosclerotic lesions and 62.3% in the stenosis) (Figures S3A–S3D). mpVSMCs isolated from Aadac knockout mice also displayed an increase in the number of lipid droplets per cell (Figure S3E). Extensive metabolomic and lipidomic analyses of Aadac overexpressing mpVSMCs showed the most of lipid species were significantly decreased (Figure 4E), with storage lipids such as TAG and monoacylglycerol (MAG) being the most pronounced (TAG: 0.78 ± 0.01% vs. 0.65 ± 0.02%, p = 0.003; MAG: 0.73 ± 0.03% vs. 0.41 ± 0.04%, p < 0.0001) while phosphatidylethanolamine (PE), in particular unsaturated PE (Figure S1K) were increased (PE: 38.4 ± 0.2% vs. 40.4 ± 0.4%, p = 0.003), again similar to data in human cells (Figure 4F). The apparent differences in lipid composition between human and mouse VSMCs were likely due to previously reported species specific differences which may also affect the function of AADAC and ultimately explain the somewhat divergent lipid profiles. Additionally, the proliferation, migration and apoptosis observed in the Aadac-Tg mpVSMCs were also significantly decreased, similar to data from human VSMCs overexpressing AADAC (Figures 4G–4I). In contrast, mpVSMCs from Aadac knockout mice showed an increase in the proliferation, migration and apoptosis, again similar to the data from human AADAC knockout dVSMCs (Figures S3F–S3H). Interestingly, the observed amelioration of atherosclerosis does not appear dependent on the formation of cholesterol crystals or inflammasome pathway (Duewell et al., 2010). Although we found that the total lipid accumulation was significantly reduced in the plaques of Aadac-overexpressing mice as shown by oil red O staining, the cholesterol crystal positive area and the number of inflammatory cells per area were not altered as compared to wild type or Aadac-overexpressing mice (Figures S4A–S4D). These data are consistent with the observation that overexpressing AADAC decreased storage lipids rather than acting directly to reduce cholesterol esters, which suggests that AADAC may function to indirectly counteract the effect of excess cholesterol in VSMCs. Combined, these results suggest that changes in Aadac expression in VSMCs alters atherosclerosis in vivo. We found that higher levels of Aadac expression in VSMCs reduced lipid accumulation, proliferation, migration and possibly apoptosis and ameliorated atherosclerosis, while lower levels resulted in opposite cellular phenotypes and an exacerbation of disease associated phenotypes.
Figure 4: Aadac-overexpressing Apoe−/− mice show the significant improvement of atherosclerosis.

(A) Representative H&E staining of the aortic arch in SM22-Cre mice and Aadac-Tg/SM22-Cre mice. (Scale bar: 500 μm.)
(B and C) Quantification of plaque size at the aorta (B) and percent stenosis at branchiocephalic artery (C) in SM22-Cre (n = 9) and Aadac-Tg/ SM22-Cre (n = 5). Mann-Whitney test.
(D) Representative staining for neutral lipid droplets by lipidTOX (Scale bar: 100 μm.) and number of the lipid droplets per cell in mouse VSMCs isolated from SM22-Cre and Aadac-Tg/ SM22-Cre (n = 4). two-tailed unpaired t-test.
(E) Total amount of lipid detected in mouse VSMCs isolated from SM22-Cre and Aadac-Tg/ SM22-Cre (n = 6). CE, Cholesterol Ester; TAG, Triacylglycerol; DAG, Diacylglycerol; MAG, Monoacylglycerol; FFA, Free Fatty Acid; SM, Sphingomyelin; CER, Ceramide; HCER, Hexosylceramide; LCER, Lactosylceramide; DCER, Dihydroceramide; PC, Phosphatidylcholine; PE, Phosphatidylethanolamine; PI, Phosphatidylinositol; LPC, Lysophosphatidylcholin; LPE, Lysophosphatidylethanolamine. Welch’s two-sample t-test.
(F) Mole percentage of phospholipids and storage lipids in mouse VSMCs isolated from SM22-Cre and Aadac-Tg/ SM22-Cre (n = 6). An illustration shows lipid classes that achieved statistically significant increase (red) and decrease (blue) (P < 0.05). Welch’s two-sample t-test.
(G) Representative immunostaining (Scale bar: 50 μm.) and percentage of PCNA positive cells of mouse VSMCs isolated from SM22-Cre and Aadac-Tg/ SM22-Cre (n = 4). two-tailed unpaired t-test.
(H) Representative images of cell migration (Scale bar: 100 μm.) and quantified cell migration area of mouse VSMCs isolated from SM22-Cre and Aadac-Tg/ SM22-Cre (n = 6). Red lines represent the borders of cell migration. two-way ANOVA with Sidak’s multiple comparisons test.
(I) Representative images (Scale bar: 50 μm.) and percentage of TUNEL positive cells of mouse VSMCs isolated from SM22-Cre and Aadac-Tg/ SM22-Cre (n = 5). Mann-Whitney test.
Data represent mean ± SEM, *P < 0.05, **P < 0.01, ***P < 0.001, ****P < 0.0001. See also Figure S3 and S4.
Discussion
In summary, hiPSCs-derived from T2DM patients without CVD identified elevated levels of AADAC in VSMCs as a putative factor involved in atherosclerosis. We showed that the expression or reduction of AADAC in both human and mouse VSMCs functioned to alter lipid metabolism, proliferation, migration and presumably apoptosis. Furthermore, mice expressing or lacking Aadac specifically in VSMCs displayed significant changes in atherosclerosis and stenosis. Thus, we have revealed a function for AADAC in VSMCs and linked this directly to CVD.
AADAC has been previously described as an esterase involved in lipid metabolism and the hydrolysis of various substances including some drugs (Fukami et al., 2015; Lo et al., 2010; Quiroga and Lehner, 2011; Trickett et al., 2001). Our detailed metabolomic and lipidomic analyses suggest that AADAC alters lipid metabolism in VSMCs causing a shift of storage lipids to phospholipids in which unsaturated phospholipids were increased (Figures S1K and S1L). Although some other lipid species might be altered by AADAC as it is a general esterase, these data are consistent with the redistribution of intracellular lipids via the Kennedy pathway of phospholipid bioassembly as well as other lipid pathways which may mitigate the cellular impact of high cholesterol and other excess lipids in the serum of patients with T2DM (Perona, 2017). Additionally, the increase of phospholipids and unsaturated fatty acids in VSMCs could help buffer the cell membrane against excess cholesterol and saturated lipids. The similar lipid hydrolases at the ER, such as cholesteryl esters hydrolase 1 (CEH1) in macrophages, has been reported to play an important role in atherosclerogenesis (Sekiya et al., 2009; Zhao et al., 2007). Our study clarified lipid hydrolases in VSMCs would be also involved with atherosclerosis formation. Recently, intracellular lipid metabolism and alterations in lipid droplets have been shown to play important roles in a number of cellular and physiological functions (Krahmer et al., 2013; Paul et al., 2008; Wang et al., 2016) some of which may ultimately help to protect cells from contributing to atherosclerotic plaques. However, several questions remain unanswered that must be addressed in order to fully understand the role of lipid metabolism in the formation of atherosclerosis such as the roles of lipids other than cholesterol esters, the contribution of various lipids to foam cell formation, the influence of the lipid composition on atherogenesis, and the possible differences in lipid composition of lipid droplets between macrophages and VSMCs (Goldberg et al., 2018).
We speculate that AADAC functions at an early stage of atherogenesis to protect against CVD. Although the embryological origins of VSMCs in the aortic arch and the aortic root may be different (Sinha et al., 2014), we observed similar phenotypes at the aortic root and the aortic arch, which suggests AADAC does not affect the development of these arteries but rather exerts an effect after the expression of SM22 has been established (Figures S4E and S4F). Of note, while the data observed at the aortic root are similar to the results from the aortic arch or even more significant, the lipid accumulation per plaque area in Aadac-knockout mice does not show a significant difference when compared to the lipid accretion in the wild type mice (Figure S4F). Perhaps one possible explanation for our observation is that the difference in lipid accumulation between wild type and Aadac-knockout mice might be due to a decrease in Aadac expression in atherosclerosis. We observed that as atherosclerosis advances, the expression level of Aadac decreases (Figure S4G). Thus, lipid accretion might be less clear at later time points in Aadac-knockout mice, whereas this gradual down regulation of endogenous Aadac would not affect the lipid accumulation in Aadac-overexpressing mice. Finally, we found that some Oil red O positive cells in the aortic root exhibited both alpha SMA (a VSMC marker) and F4/80 (a macrophage marker) expression (Figure S4H). These data suggest that phenotypic switching of VSMCs towards macrophage-like cells as previously described (Bennett et al., 2016) may be one of the causes for the observed differences in lipid accumulation observed in our AADAC mouse models. Further experiments, such as those utilizing genetic inducible fate mapping, would be needed to clarify the exact cells in which AADAC is acting to alter atherogenesis. While additional studies will be required to understand the precise mechanism and function of AADAC in CVD, our study implicates roles of VSMCs and lipid metabolism in VSMCs in this complex disease etiology.
In conclusion, our study demonstrates the utility of patient hiPSCs for investigating not only monogenic and polygenic diseases but also clinical phenotypes. Patients who were not diagnosed with CVD despite a long history of diabetes remain relatively rare. And while these individuals may yet teach us about the factors that protect against CVD especially in the context of metabolic disease, it has proven difficult to use small patient cohorts to understand the genetic basis for many diseases. Our study may point to a shift in paradigm, wherein rare clinical phenotypes may be successfully explored by carefully examining the cells involved in the earliest stages of a disease process. As human primary cells such as ECs and VSMCs are not easily procured, hiPSCs provide one source for investigating the molecular mechanisms of disease in patients which may help provide clues to the development of new and effective clinical therapies for CVD (Linden et al., 2014). Finally, our differentiation method can generate relatively mature ECs and VSMCs, but it remains challenging to generate fully mature vascular cells that correspond to a specific organ. Our results suggest that to accurately recapitulate certain pathological phenotypes in vitro, methods for differentiating hiPSCs into organ specific vascular cells must be developed.
STAR Methods text
Key Resources Table
Resource Availability
Lead Contact
Further information and request for resources and reagents should directed to, and will be fulfilled by the Lead Contact, Chad A Cowan (ccowan@fas.harvard.edu).
Materials Availability
All unique/stable reagents generated in this study are available from the Lead Contact with a completed Materials Transfer Agreement.
Data and Code Availability
The raw microarray and normalized data are available at Gene Expression Omnibus (GEO: https://www.ncbi.nlm.nih.gov/geo/) (the GSE number is GSE113969). The data of Aadac-Tg mice are available at Mendeley Data (https://data.mendeley.com) (DOI: 10.17632/m3x3czkwhm.1).
Experimental model and Subject Details
Patient recruitment.
Human iPSC lines were derived from anonymized patient skin cells following full informed consent and approval by the Partners Healthcare Human Research Committee. T2DM patients without CVD and with CVD were chosen from approximately 3000 T2DM patients whose coronary arteries had been all investigated by coronary angiography at MGH. Healthy control iPSC lines were derived from participants of the FHS offspring Cohort (Warren et al., 2017b).
Animal protocol and genetic experiments.
All procedures used in animal experiments were in accordance and with approval from the pertinent Institutional Animal Care and Use Committees at Harvard University and Beth Israel Deaconess Medical Center. As for Aadac-overexpressing mice, the coding region of mouse Aadac was inserted into the CAG-loxP-STOP-loxP-IRES-GFP vector kindly provided by Jens Bruning(Stohr et al., 2013). We aimed to generate Apoe deficient mice harboring the CAG promoter, a floxed STOP sequence, a cDNA encoding for mouse Aadac, and IRES-GFP via CRISPR/Cas9 technology in Genome Modification Facility at Harvard University. An sgRNA (sequence: CTGGCTTCTGAGGACCGCCC) was designed to generate DNA double-strand breaks on the targeted ROSA26 sequences and then integrated into our modified gRNA cloning vector (BbsI site was added on gRNA cloning Vector (Addgene, #41824)). To evaluate the cutting efficiency of the sgRNA, we transfected the gRNA cloning vector and pCas9-GFP (Addgene, #44719) into 293T cells and detected mutation by using Surveyor Mutation Detection kits (Integrated DNA Technologies). The sgRNA was then synthesized using MEG shortscript T7 kit and MEGA clear kit (Thermo Fisher) according to the previously published paper31. Sixty-four ng ul−1 Cas9 protein, 50 ng ul−1 sgRNA, and 100 ng ul−1 of the template DNA vector were injected to 160 zygotes from Apoe deficient mice (#002052, The Jackson Laboratory) and 19 pups were born. At least 3 pups harbored the CAG-loxP-STOP-loxP-Aadac-IRES-GFP cassette. One of them was fertile and the cassette was inherited to its offspring according to Mendelian law. The descendants were mated with SM22-Cre mouse (#004746, The Jackson Laboratory) with ApoE knockout background to generate VSMC-specific Aadac-overexpressing mice. To generate Aadac conditional knockout mice, we have generated floxed Aadac mice harboring two loxPs before and after Aadac exon 4 that includes Aadac lipase active site. Two sgRNAs (sequence: ATAAAATGCAATGATCACGT and GTGACATGGTTTCCCATACC) were synthesized as described in Aadac-overexpressing mice. One hundred ng ul−1 Cas9 mRNA (TriLink Biotechnologies), 50 ng ul−1 sgRNA, and 100 ng ul−1 of the template DNA vector were injected to 200 zygotes from C57BL/6 mice and 35 pups were born. At least two pups harbored two loxPs in the right sites. In one of them, the inserted loxPs were inherited to its offspring according to Mendelian law. The descendants were mated with ApoE deficient mouse and then crossbred with SM22-Cre mouse with ApoE knockout background to generate VSMC-specific Aadac-knockout mice. The deletion of Aadac exon 4 was confirmed by PCR and sequencing. Male 8-week-old mice and their littermates without the transgene were fed a high-fat high-cholesterol diet (D12108C, Research Diets) for 10 weeks and then sacrificed for further analyses of atherosclerotic lesions. All mice were housed on a 12-hour light/dark cycle with food and water ad libitum.
Method Details
iPSC reprogramming.
Fibroblast cells from patient skin biopsies were reprogrammed at the Harvard Stem Cell Institute iPSC core facility (https://ipscore.hsci.harvard.edu). On day zero, 2.0 × 10⁵ fibroblast cells were seeded into one well of a 12-well plate with fibroblast medium (DMEM, 10% FBS, 1% Penicillin and Streptomycin, 1% L-Glutamine) and transduced by adding vectors from CytoTune-iPS 2.0 Sendai Reprogramming Kit (MOI KOS: hc-Myc: hKlf4 = 5:5:3) (Thermo Fisher). After 24 h, the medium was replaced with fresh fibroblast medium every other day. Seven days later, cells were passaged into a 10 cm dish pre-seeded with 2×10⁶ irradiated MEFs on 0.1% gelatin. The medium was switched to human embryonic stem cell (hESC) media (DMEM/F12, 20% KnockOut Serum Replacement (Thermo Fisher), 1% L-Glutamine, 1% Penicillin and Streptomycin, 1% MEM-NEAA, 1μL mL−1 55 mM 2-Mercaptoethanol, 10 ng mL−1 bFGF). After at least three weeks of feeding with hESC medium, colonies were picked into separate wells pre-coated with irradiated MEFs on 0.1% gelatin. iPSCs on MEFs were fed with hESC media and passaged as aggregates using Collagenase Ⅳ for 10 min at 37°C. After approximately four weeks, iPSCs were transferred to plates coated with hESC-qualified Matrigel (Corning) and cultured in mTeSR1 (StemCell Technologies). Feeder-free iPSCs were passaged as aggregates with Gentle Cell Dissociation Reagent (StemCell Technologies, Inc.) for 5 min at room temperature. Undifferentiated markers were confirmed by immunostaining. After iPSC cell lines were established, they were passaged as single cells with Accutase (diluted 1:3 in PBS) (StemCell Technologies, Inc.) for 4 min at 37°C and replated into plates coated with Geltrex (Life Technologies). iPSCs were cultured in mTeSR1 including 10mM Y-27632 dihydrochloride (Santa Cruz) for the first 24 h after passage and then cultured in mTeSR1 without Y-27632 dihydrochloride. iPSCs were confirmed to exhibit markers associated with undifferentiated pluripotent cells and retained normal karyotypes at the iPSC core facility.
Immunofluorescence.
Cells were fixed in 4% paraformaldehyde (PFA) for 20 min at 4°C. After washing with PBS three times, cells were incubated in PBS supplemented with 0.1% triton X-100 (PBS-T) including 5% donkey serum (Jackson Immuno Research) for blocking for 1 h at room temperature. All primary antibodies were incubated overnight at 4°C. The following day, cells were washed with PBS three times and then incubated with secondary antibodies in blocking buffer for 1 h at room temperature in the dark. After the incubation, the buffer was removed and replaced with PBS supplemented with Hoechst (Life Technologies) at room temperature for 30 min in the dark. Cells were then washed twice more with PBS. Antibodies were listed in key resources table.
KEY RESOURCES TABLE
| REAGENT or RESOURCE | SOURCE | IDENTIFIER |
|---|---|---|
| Antibodies | ||
| VE-Cadherin | R&D | AF938 RRID:AB_355726 |
| vWF | Dako | A0082 RRID:AB_2315602 |
| αSMA for ICC/IF | Abcam | ab7817 RRID:AB_262054 |
| Calponin | Abcam | ab46794 RRID:AB_2291941 |
| AADAC | Origene | TA323312 |
| βActin | Santa Cruz | sc-47778 RRID:AB_2714189 |
| PCNA | Abcam | Ab29 RRID:AB_303394 |
| Cleaved Caspase 3 | Cell Signaling Technology | 9664 RRID:AB_2070042 |
| GFP | Abcam | ab6556 RRID:AB_305564 |
| αSMA for IHC | Agilent | N1584 RRID:AB_2335694 |
| CD11b | Biolegend | 101207 RRID:AB_312790 |
| CD107b | BD Biosciences | 553322 RRID:AB_394780 |
| NLRP3 | Novus Biology | NBP1–77080 RRID:AB_11031962 |
| F4/80 | Biolegend | 123101 RRID:AB_893504 |
| Chemicals, Peptides, and Recombinant Proteins | ||
| CHIR99021 | Cayman Chemical | 13122 |
| Bone morphogenetic protein 4 | R&D Systems | 314-BP |
| Y-27632 | Santa Cruz | Sc-281642 |
| Vascular endothelial growth factor | Aldevron | N/A |
| Forskolin | Abcam | Ab120058 |
| Platelet-derived growth factor | PeproTech | 100–14B |
| Activin A | Cell guidance systems | GFH6–10 |
| Critical Commercial Assays | ||
| Cytotune-iPS 2.0 Sendai Reprogramming Kit | Thermo Fisher | A16517 |
| RNeasy mini kit | Qiagen | 74104 |
| qScript cDNA supermix | Quanta Bioscience | 95048 |
| FAST SYBR Green Master Mix | Thermo Fisher | 4385616 |
| Taqman Gene Expression Master Mix | Thermo Fisher | 4369016 |
| GeneChip WT PLUS Reagent kit | Fisher Scientific | 902280 |
| Human Gene 2.1 Array Strips | Fisher Scientific | 902120 |
| Radius TM 96-well cell migration assay | Cell biolabs | CBA-126 |
| Deposited Data | ||
| Microarray data | NCBI Gene Expression Omnibus | GSE113969 |
| Data of Aadac-Tg mice | Mendeley Data | 10.17632/m3x3czkwhm.1 |
| Experimental Models: Cell Lines | ||
| 14 iPSC lines | This manuscript | N/A |
| Healthy control iPSC lines | (Warren et al., 2017b) | N/A |
| 2 AADAC knockout iPS lines | This manuscript | N/A |
| Healthy Human primary coronary artery endothelial cells | Lonza | CC-2545 |
| Healthy human primary coronary artery vascular smooth muscle cells | Lonza | CC-2583 |
| Human primary coronary artery vascular smooth muscle cells from T2DM pateints with CVD | Dr. Alexandre C Pereira | Dinardo et al., 2015 |
| Experimental Models: Organisms/Strains | ||
| Apoe deficient mouse | The Jackson laboratory | 002052 |
| SM22-Cre mouse | The Jackson laboratory | 004746 |
| Aadac-Tg mouse | This manuscript | N/A |
| Aadacflox/flox mouse | This manuscript | N/A |
| Oligonucleotides | ||
| PECAM1 | Life technologies | Hs00169777_m1 |
| vWF | Life technologies | Hs01109446_m1 |
| RPLPO | Life technologies | 4333761F |
| αSMA | Life technologies | Hs00426835_g1 |
| SM22 | Life technologies | Hs00162558_m1 |
| mouse Aadac | Life technologies | Mm00469758_m1 |
| mouse Itgam | Life technologies | Mm00434455_m1 |
| Primers for SYBR green real-time RT-PCR | This manuscript | Methods S1 |
| Recombinant DNA | ||
| Plasmid: pDONR221 | Thermo Fisher | 12536017 |
| Plasmid: FU-TetO-Gateway | Addgene | 43914 |
| Plasmid: pRSV-Rev | Addgene | 12253 |
| Plasmid: pMDLg/pRRE | Addgene | 12251 |
| Plasmid: gRNA cloning vector | Addgene | 41824 |
| Plasmid: CAG-loxP-STOP-loxP-IRES-GFP vector | Dr. Jens Bruning | Stohr et al., 2013 |
| Plasmid: pCas9-GFP | Addgene | 44719 |
| Plasmid: FU-TetO-AADAC | This manuscript | N/A |
| Software and Algorithms | ||
| Database of Genotypes and Phenotypes (dbGaP) | https://www.ncbi.nlm.nih.gov/gap | N/A |
| GSEA-Hallmarks analysis | http://software.broadinstitute.org/gsea/msigdb/collections.jsp | N/A |
| Columbus image data storage and analysis system | PerkinElmer | N/A |
| HCS studio cell analysis software | Thermo Fisher | N/A |
| Graph Pad Prism 7 | GraphPad Software | https://www.graphpad.com/ |
| Other | ||
| Knockout Serum Replacement | Thermo Fisher | 10828010 |
| Matrigel | Corning | 354263 |
| mTeSR1 | StemCell Technologies | 05850 |
| Gentle Cell Dissociation Reagent | StemCell Technologies | 07174 |
| Accutase | StemCell Technologies | 07920 |
| 32% paraformaldehyde solution | Electron Microscopy Sciences | 15714 |
| Donkey serum | Jackson Immuno Research | 017–000-121 |
| Hoechst33342 | Thermo Fisher | H1399 |
| Geltrex | Thermo Fisher | A1413202 |
| TRIzol reagent | Thermo Fisher | 15596018 |
| StemPro 34 SFM medium | Thermo Fisher | 10639–011 |
| Medium 231 | Thermo Fisher | M-231–500 |
| Smooth muscle growth supplement | Thermo Fisher | S-007–25 |
| LR Clonase II | Thermo Fisher | 12538120 |
| Lenti-X concentrator | TaKaRa | 631231 |
| qPCR Lentivirus titration kit | Abm | LV900 |
| Smooth muscle growth medium-2 | Lonza | CC-3182 |
| Complete mini protease inhibitor tablets | Roche | 11697498001 |
| Pierce BCA protein assay kit | Thermo Fisher | 23227 |
| BODIPY | Thermo Fisher | D-3922 |
| In situ cell death detection kit | Roche | 11684795910 |
| Surveyor Mutation Detecion kits | Integrated DNA technologies | 706020 |
| MEG short script T7 kit and MEGA clear kit | Thermo Fisher | AM1354 |
| Cas9 mRNA | TriLink Biotechnologies | L-6125 |
| High-fat high-cholesterol diet | Research diet | D12108C |
| EasySep mouse monocyte isolation kit | Stemcell technologies | 19861 |
| Elastase | Sigma | E1250 |
| Collagenase B | Sigma | 11088815001 |
RNA isolation, cDNA synthesis and qPCR.
RNA extraction was done using TRIzol® reagent (Thermo Scientific) or RNeasy mini kit (Qiagen) according to the manufacturer’s instructions. cDNA synthesis was performed by qScript cDNA supermix according to the manufacturer’s instructions (Quanta Biosciences). α-SMA, SM22, AADAC, MMP13, human β-actin, mouse Aadac, and mouse β-actin qPCR were performed using primer sets listed in key resources table in conjunction with Fast SYBR® Green master mix on a Viia7 Real-Time PCR System (Thermo Scientific). PECAM1, VWF and RPLP0 qPCR were performed using TaqMan Gene Expression Assays listed in key resources table and TaqMan Gene Expression Master Mix (Thermo Scientific). Expression data is presented after calculating the relative expression compared with the endogenous control gene β-actin or RPLP0.
Karyotyping.
Karyotype G-banding was performed by Cell Line Genetics at least one passage after the Sendai virus was no longer detectable in the iPSC population by qPCR.
Differentiation into ECs and VSMCs.
Differentiation was performed as described previously (Patsch et al., 2015). Briefly, iPSCs were plated at a density of 47,000–67,000 cells cm−2 in mTeSR1 with 10 μM Y-27632 dihydrochloride. On day one, mesoderm induction medium was added, consisting of N2B27 medium (1:1 mixture of DMEM:F12 (1:1) with Glutamax and Neurobasal media supplemented with N2 and B27: all Life Technologies), 8 μM CHIR99021 (Cayman Chem) and 25 ng ml−1 Bone morphogenetic protein (BMP) 4 (R&D Systems). On day four and five, medium was replaced with EC induction medium consisting of StemPro 34 SFM medium (Life Technologies), 200 ng ml−1 Vascular endothelial growth factor (VEGF) (Aldevron) and 2 μM forskolin (Abcam). On day six of differentiation, ECs were AutoMACS-enriched using CD144 MicroBeads (Miltenyi Biotec). CD 144+ cells were re-plated on human fibronectin (Sigma-Aldrich)-coated plates at a density of 25,000 cells cm−2 in EC expansion Medium (1:1 mixture of day six medium and StemPro-34 SFM supplemented with 50 ng ml−1 VEGF). For VSMC differentiations, medium was replaced on day four and five by VSMC induction medium, consisting of N2B27 medium with 12.5 ng ml−1 platelet-derived growth factor (PDGF)-BB (PeproTech) and 12.5 ng ml−1 Activin A (Cell guidance systems). On day six, cells were dissociated and plated at 35,000 cells cm−2 on gelatin-coated plates in Medium 231 (Thermo Fisher) supplemented with smooth muscle growth supplement (SMGS) (Thermo Fisher). Microarray analysis was performed with dECs and dVSMCs at passage 3. Other experiments described in this manuscript were performed with dVSMCs at passage 4–5.
Microarray and gene set enrichment analysis.
RNA quality was verified using the Agilent Bioanalyzer and the 6000 nano kit. Total RNA samples were processed according to the GeneChip® WT PLUS Reagent kit (Affymetrix). Affymetrix Human Gene 2.1 Array Strips were hybridized, processed and scanned using the appropriate Affymetrix protocols. Generated CEL files were imported into Partek Genomics Suite software.6.6 for subsequent analysis. Probeset data were normalized as follows: pre-background adjustments were made for GC correction and probe sequence bias followed by RMA background correction and quantile normalization. Normalized probeset data were log2 transformed and summarized by median polish method. Differential expression was determined by an ANOVA model and the p-value was adjusted for multiple tests by Storey FDR method.
For the analysis of overrepresented biological phenotypes associated with the differentially expressed genes, we performed gene set enrichment analysis using the database of Genotypes and Phenotypes (dbGaP: https://www.ncbi.nlm.nih.gov/gap) that is integrated in EnrichR tool using the list of up- and down-regulated genes (absolute fold change larger than 1.5 and p-value smaller than 0.5). The pathway analysis was performed using GSEA-Hallmarks analysis (http://software.broadinstitute.org/gsea/msigdb/collections.jsp) using a gene expression list that was sorted based on multiplication of negative logP and fold change value. The GSEA parameters were set to 1000 permutations with a gene size set from 15 – 5000 members. The scoring scheme for enrichment statistic was weighted_p2.
Human primary cell lines.
Human primary coronary artery endothelial cells (CAEC) and CAVSMCs from healthy individuals were purchased from Lonza (CC-2545 and CC-2583). Human primary coronary artery vascular smooth muscle cells from T2DM patients with CVD were isolated as previously reported by Dr. Pereira (Dinardo et al., 2015; Dinardo et al., 2014; Vaquero et al., 2012).
AADAC overexpression by lentivirus.
Human AADAC cDNA and GFP cDNA were cloned into pDONR221 vector (Life Technologies) according to the manufacturer’s instructions. To generate lenti-AADAC plasmid and lenti-GFP plasmid, pDONR221-AADAC and pDONR221-GFP were recombined with the FU-tetO-Gateway vector (Addgene, #43914) using LR Clonase Ⅱ (Life Technologies). We also generated UbC promoter-reverse tetracycline-controlled transactivator protein (rtTA)-P2A-tetracycline-controlled transcriptional silencer (tTS) lentivirus plasmid that can eliminate transgene leak in Dox inducible expression system. All clones were confirmed by restriction digest screening and sequencing. A third-generation packaging system was used to generate Dox-inducible lentivirus (Ahfeldt et al., 2012). The vectors - either lenti-AADAC plasmid or lenti-GFP plasmid - together with the two packaging plasmids - pMDL, pREV - and the plasmid coding for VSV-G envelope were transfected into HEK293T cells using polyethylenimine (PEI). rtTA-P2A-tTS lentivirus vector was also transfected into HEK293T with pMDL, pREV and pVSV-G in the same way. Cell media/viral supernatant was collected 48 and 72 h after transfection, passed through a 0.45 μm filter, and concentrated using Lenti-X Concentrator (TaKaRa). Titer of the concentrated viruses was determined by qPCR Lentivirus Titration (Titer) Kit (abm). CAVSMCs and dVSMCs were transduced with 1 × 10⁴ IU ml−1 lenti-AADAC or lenti-GFP, 1 × 10⁵ IU ml−1 rtTA-P2A-tTS lentivirus, and 2 μg ml−1 polybrene. After cells were incubated at 37°C overnight, viral supernatant was removed. CAVSMCs and dVSMCs were further cultured in smooth muscle growth medium-2 (SmGM-2) (Lonza) and Medium 231 supplemented with SMGS respectively. In Dox treatment groups, CAVSMCs and dVSMCs were treated with Dox at 50 ng ml−1 and 15 ng ml−1 respectively. qPCR analysis confirmed AADAC was overexpressed reproducibly to the similar level using the same titer of virus and the same amount of Dox.
AADAC knockout iPSC lines.
Genome editing in an iPS cell line from T2DM patient without CVD was performed following a published protocol (Peters et al., 2008) using the guide RNAs (GCACTTAACATGACTGTATC and GCCTCTCCCAGATAACGTTG) and screening primers (Forward: ACTTTGCCCTAGTTTCCTATTACTC, Reverse: TTCTCTGGGTCAAATGGTGGTG). The sgRNAs were designed to generate DNA double-strand breaks on the targeted human AADAC exon 1 sequences and then integrated into our modified gRNA cloning vector (BbsI site (Ran et al., 2013) was added on gRNA cloning Vector (Addgene, #41824)). The deletion of the exon 1 sequences was confirmed by PCR and sequencing. The AADAC knockout was verified by qPCR.
Western blot analysis.
Cells were lysed using RIPA buffer supplemented with a protease inhibitor mix (Complete Mini Protease Inhibitor cocktail tablets, Roche) and sonicated by Q125 Sonicator (Qsonica). Protein concentrations were measured using Pierce BCA protein Assay Kit (Thermo Fisher). Protein samples were supplemented with LDS sample buffer (Thermo Fisher) prior to heating at 95% for 10 min. Proteins were separated by SDS-PAGE and blotted onto nitrocellulose membranes (Bio-Rad) in NuPAGE transfer buffer (Thermo Fisher) for 1.5 h by applying 100 volts of constant voltage at 4°C. Membranes were probed with specific primary antibodies and then with peroxidase-conjugated secondary antibodies. The bands were visualized by chemiluminescence (20X LumiGLO® Reagent and 20X Peroxide, Cell Signaling Technology) using autoradiography film (HyBlot, Denville Scientific).
Lipid droplet staining.
Cells were plated in gelatin-coated 96 well plates at a density of 30,000 cells cm−2 and cultured for seven days. The LipidTox Red and BODIPY (Thermo Scientific) were used for labeling neutral lipids according to the manufacturer’s instructions. To detect cell nucleus and cytoplasm, cells were simultaneously stained with Hoechst and Whole Cell Stain Blue (Thermo Scientific). For lipid droplet quantification, 49 fields per well were imaged at 20x magnification using Cellomics ArrayScan VTI (Thermo Scientific) or ImageXpress Micro Confocal High-Content Imaging System (Molecular Devices). Subsequent image quantification was performed automatically using the Columbus Image Data Storage and Analysis System (PerkinElmer) or HCS Studio Cell Analysis Software (Thermo Scientific).
Metabolomics and lipidomics.
Sample preparation and metabolic profiling was performed on samples of 4–5 × 10⁶ cells. The untargeted metabolic profiling platform and further lipid platform were performed by Metabolon. The data were normalized by protein level of each sample. Because three different cell lines such as CAVSMC, dVSMC and mpVSMC were lined up as biological replicates, Welch’s two-sample t-test was used to comprehensively identify metabolites and lipids that differed significantly between experimental groups.
Cell migration assay.
VSMC migration was analyzed using Radius TM 96-well cell migration assay according to the manufacturer’s instructions (Cell Biolabs). Cells were plated on 96 well plates at a density of 30,000 cells cm−2 and Radius gel was removed after the cells become confluent. As for CAVSMC and dVSMC, cells were cultured with or without Dox at least for three days before removal of Radius gel. After Radius gel was removed, photographs were taken with a Nikon digital camera attached to a Nikon Eclipse Ti inverted microscope (Nikon Instruments) at each time point according to speed of migration, and gap closure was measured blindly.
Cell proliferation assay.
Cells were plated on gelatin-coated 96 well plates at a density of 30,000 cells cm−2 and stained with anti-proliferating cell nuclear antigen (PCNA) antibody (abcam, ab29, 1:200) when the cells are at 60–70% confluent. As for CAVSMC and dVSMC, cells were cultured with or without Dox before the assay. To detect cell nucleus and cytoplasm, cells were simultaneously stained with Hoechst and Whole Cell Stain Blue. For counting PCNA positive cells, 49 fields per well were imaged at 20x magnification using Cellomics ArrayScan VTI. Subsequent image quantification was performed automatically using the Columbus Image Data Storage and Analysis System or HCS Studio Cell Analysis Software (Thermo Scientific).
Cell death analysis.
Cells were plated on gelatin-coated 96 well plates at a density of 30,000 cells cm−2. In situ cell death detection was performed three days after passage by TUNEL technology as described by the manufacturer (In situ Cell Death Detection Kit or In situ Cell Death Detection Kit, TMR red, Roche). As for human VSMCs, cells were cultured with or without Dox before the assay and apoptotic cells were also detected by staining with anti-Cleaved Caspase-3 antibody (Cell Signaling Technology, #9664, 1:400). To detect cell nucleus and cytoplasm, cells were simultaneously stained with Hoechst and Whole Cell Stain Blue. For counting apoptotic cells, 49 fields per well were imaged at 20x magnification using Cellomics ArrayScan VTI. Subsequent image quantification was performed automatically using the Columbus Image Data Storage and Analysis System or HCS Studio Cell Analysis Software (Thermo Scientific).
Histology and immunohistochemical analysis.
Atherosclerotic lesion was analyzed as previously reported (Figueiredo et al., 2015; Fukuda et al., 2012; Nakano et al., 2019). We perfused 0.9% sodium chloride solution and then OCT compound (Tissue Tek) at a constant pressure via the left ventricle and removed thoracic aortas immediately. The aortas were embedded in OCT compound and frozen. The samples were then sectioned serially (7 μm for the aortic arch and 5 μm for the aortic root) and stained with hematoxylin and eosin for general morphology. Images were captured and processed using an Eclipse 80i microscope (Nikon Instruments) or BZ-9000 fluorescence microscope (Keyence). Plaque size and stenosis of brachiocephalic artery were measured blindly. Immunofluorescence staining was performed using anti-GFP antibody (abcam, ab6556, 1:1000), anti-αSMA antibody (Dako, 1A4, 1:1000), anti-CD107b antibody (BD Biosciences, 553322, 1:800), anti-NLRP3 antibody (Novus Biology, NBP1–77080, 1:400) and anti-F4/80 antibody (Biolegend, 123101, 1:400). CD107b and NLRP3 positive cells were counted as previously reported (Nakano et al., 2019). The samples were fixed with cold acetone for 10 min, washed with PBS for 5 min twice, blocked with 3% skim milk for 30 min, and incubated with primary antibodies overnight. The sections were then stained with secondary antibodies and Hoechst.
Oil red O staining.
Oil red O staining was performed as previously reported (Sukhova et al., 2003). The percentage of oil red O positive areas was quantified from digitally captured images from the whole plaque in the aorta (Adobe Photoshop CC 2018). The sum of positive pixels was determined and the area was calculated from the pixel size.
Cholesterol crystal detection.
The atherosclerotic lesions were imaged on a Zeiss 880 confocal microscope and the Zeiss technical support assisted in setting up the experiment. Crystals were observed with laser reflection using enhanced transmittance of the acousto-optical beam splitter as described in previous paper (Duewell et al., 2010). The percentage of cholesterol crystal positive areas was quantified from five digitally captured sections per mouse (Adobe Photoshop CC 2018) as reported previously (Duewell et al., 2010). The sum of positive pixels was determined and the area was calculated from the pixel size.
Monocyte isolation.
Monocyte isolation was done by EasySep™ Mouse Monocyte Isolation Kit (STEMCELL Technologies) according to the manufacturer’s instructions. The purification of the monocytes was confirmed by qPCR and flow cytometry. Flow cytometry was performed as previously reported (Ferreira et al., 2016). Briefly, isolated monocytes were blocked in PBS including 4% FBS with TruStain fcX antibody (Biolegend, 101319, 1:100) for 30 min and stained with PE anti-CD11b antibody (Biolegend, 101207, 1:100) in PBS including 1% FBS for 45 min.
Isolation of mouse primary VSMCs.
The aortas were dissected from 4-weeks old mice under sterile conditions using a stereoscope and placed in sterile HBSS (Life Technologies). The aortas were incubated for 20 min in Digest medium (HBSS supplemented with 2.5 U mL−1 Elastase (Sigma, E1250) and 175 U mL−1 Collagenase B (Sigma 11088815001)) with shaking at 37°C and replated in sterile HBSS after digestion. The adventitia was carefully removed under stereoscope. The aortas without adventitia were cut into 1–2 mm rings, transferred to 15 mL falcon tube and spinned down. After HBSS was aspirated, the aortas were resuspended in growth media (DMEM (Corning) supplemented with 20% FBS) and plated on gelatin-coated plates. After 48 h, the growth media were carefully removed and then replaced by adding dropwise media. The growth media were changed every 48 h. VSMCs sprouted from attached fragments after 3–4 days and were passaged using 0.5% trypsin. Other experiments described in this manuscript were performed with VSMCs at passage 2–4.
Quantification and Statistical Analysis
Statistical analysis.
Prism 7 (Graphpad) was used to create charts and perform statistical analyses. Statistical analysis was performed by unpaired, two-tailed Student’s t-test, or one-way ANOVA followed by Sidak’s multiple comparison test unless mentioned otherwise. If the data were not normally distributed, they were analyzed by Mann-Whitney test or Kruskal-Wallis test. To contrast the results in Figure S1E and F with Figure 1K and L, these were both analyzed by Mann-Whitney test. For all bar graphs, data are represented as mean ± SEM. P values <0.05 were considered significant.
Supplementary Material
Methods S1: Primers for SYBR green real-time RT-PCR, Related to STAR Methods
Table S2: Gene expression data of dECs, Related to Figure 1
Table S3: Gene expression data of dVSMCs, Related to Figure 1
Table S4: AADAC expression levels in human tissues and cells, Related to Figure 2
Acknowledgements
We thank Lin Wu, Zhenjuan Wang and Sarah Johnson at Genome Modification Facility in Harvard University for generating AADAC-Tg mice and AADAC knockout mice, Justus Ackermann, Jens Bruning for the conditional overexpression cassette, and Jorge Plutzky for the protocol of mouse VSMC isolation. We also thank Ying Shao and Laurence Daheron at the Harvard Stem Cell Institute’s iPS Core for generating iPSCs from T2DM patients and Rocky Stroud for assistance in revising the manuscript. Patricia Sheridan and Lisa White at Metabolon assisted with our metabolomic and lipidomic analyses. Barrett Lee at the imaging core and Lay-Hong Ang at the confocal core in BIDMC supported our imaging experiments. Vladimir Ghukasyan from Carl Zeiss assisted with the cholesterol crystal detection. Miki Yoshizawa and Fumiko Date at Biomedical Research Core of Tohoku University Graduate School of Medicine supported our histological analysis. We also thank Biomedical Research Unit of Tohoku University Hospital for technical support. Chitose Suzuki, Kiyomi Kisu and Alastair Poole also assisted our experiments. These studies were supported by Roche Pharmaceuticals (C.A.C., F. Hoffman-LaRoche, Ltd/A203889), the National Institutes of Health (C.A.C., NIDDK/R01DK097768, NHLBI/U01HL100408; M.A., NHLBI/R01HL126901) and the Harvard Stem Cell Institute (C.A.C.).
Declaration of Interests
C.A.C is a founder of CRISPR Therapeutics and Sana Biotechnology. F.R. is an employee of F.Hoffmann-La Roche ltd. Neither a reagent nor any funding from F.Hoffmann-La Roche ltd was used in this study.
References
- Ahfeldt T, Schinzel RT, Lee YK, Hendrickson D, Kaplan A, Lum DH, Camahort R, Xia F, Shay J, Rhee EP, et al. (2012). Programming human pluripotent stem cells into white and brown adipocytes. Nat Cell Biol 14, 209–219. [DOI] [PMC free article] [PubMed] [Google Scholar]
- Allahverdian S, Chaabane C, Boukais K, Francis GA, and Bochaton-Piallat ML (2018). Smooth muscle cell fate and plasticity in atherosclerosis. Cardiovasc Res 114, 540–550. [DOI] [PMC free article] [PubMed] [Google Scholar]
- Bakan E, Yildirim A, Kurtul N, Polat MF, Dursun H, and Cayir K. (2006). Effects of type 2 diabetes mellitus on plasma fatty acid composition and cholesterol content of erythrocyte and leukocyte membranes. Acta Diabetol 43, 109–113. [DOI] [PubMed] [Google Scholar]
- Bennett MR, Sinha S, and Owens GK (2016). Vascular smooth muscle cells in atherosclerosis. Circ Res 19, 692–702. [DOI] [PMC free article] [PubMed] [Google Scholar]
- Boucher P, Gotthardt M, Li WP, Anderson RG, and Herz J. (2003). LRP: role in vascular wall integrity and protection from atherosclerosis. Science 300, 329–332. [DOI] [PubMed] [Google Scholar]
- Brennand K, Savas JN, Kim Y, Tran N, Simone A, Hashimoto-Torii K, Beaumont KG, Kim HJ, Topol A, Ladran I, et al. (2015). Phenotypic differences in hiPSC NPCs derived from patients with schizophrenia. Mol Psychiatry 20, 361–368. [DOI] [PMC free article] [PubMed] [Google Scholar]
- Carcamo-Orive I, Hoffman GE, Cundiff P, Beckmann ND, D’Souza SL, Knowles JW, Patel A, Papatsenko D, Abbasi F, Reaven GM, et al. (2017). Analysis of Transcriptional Variability in a Large Human iPSC Library Reveals Genetic and Non-genetic Determinants of Heterogeneity. Cell Stem Cell 20, 518–532 e519. [DOI] [PMC free article] [PubMed] [Google Scholar]
- De Rosa S, Arcidiacono B, Chiefari E, Brunetti A, Indolfi C, and Foti DP (2018). Type 2 Diabetes Mellitus and Cardiovascular Disease: Genetic and Epigenetic Links. Front Endocrinol (Lausanne) 9, 2. [DOI] [PMC free article] [PubMed] [Google Scholar]
- Deguchi JO, Aikawa E, Libby P, Vachon JR, Inada M, Krane SM, Whittaker P, and Aikawa M. (2005). Matrix metalloproteinase-13/collagenase-3 deletion promotes collagen accumulation and organization in mouse atherosclerotic plaques. Circulation 112, 2708–2715. [DOI] [PubMed] [Google Scholar]
- Dinardo CL, Santos HC, Vaquero AR, Martelini AR, Dallan LA, Alencar AM, Krieger JE, and Pereira AC (2015). Smoking and Female Sex: Independent Predictors of Human Vascular Smooth Muscle Cells Stiffening. PLoS One 10, e0145062. [DOI] [PMC free article] [PubMed] [Google Scholar]
- Dinardo CL, Venturini G, Zhou EH, Watanabe IS, Campos LC, Dariolli R, da Motta-Leal-Filho JM, Carvalho VM, Cardozo KH, Krieger JE, et al. (2014). Variation of mechanical properties and quantitative proteomics of VSMC along the arterial tree. Am J Physiol Heart Circ Physiol 306, H505–516. [DOI] [PubMed] [Google Scholar]
- Drawnel FM, Boccardo S, Prummer M, Delobel F, Graff A, Weber M, Gerard R, Badi L, Kam-Thong T, Bu L, et al. (2014). Disease modeling and phenotypic drug screening for diabetic cardiomyopathy using human induced pluripotent stem cells. Cell Rep 9, 810–821. [DOI] [PubMed] [Google Scholar]
- Duewell P, Kono H, Rayner KJ, Sirois CM, Vladimer G, Bauernfeind FG, Abela GS, Franchi L, Nunez G, Schnurr M, et al. (2010). NLRP3 inflammasomes are required for atherogenesis and activated by cholesterol crystals. Nature 464, 1357–1361. [DOI] [PMC free article] [PubMed] [Google Scholar]
- Ebert AD, Yu J, Rose FF Jr., Mattis VB, Lorson CL, Thomson JA, and Svendsen CN (2009). Induced pluripotent stem cells from a spinal muscular atrophy patient. Nature 457, 277–280. [DOI] [PMC free article] [PubMed] [Google Scholar]
- Ferreira LM, Meissner TB, Mikkelsen TS, Mallard W, O’Donnell CW, Tilburgs T, Gomes HA, Camahort R, Sherwood RI, Gifford DK, et al. (2016). A distant trophoblast-specific enhancer controls HLA-G expression at the maternal-fetal interface. Proc Natl Acad Sci U S A 113, 5364–5369. [DOI] [PMC free article] [PubMed] [Google Scholar]
- Figueiredo JL, Aikawa M, Zheng C, Aaron J, Lax L, Libby P, de Lima Filho JL, Gruener S, Fingerle J, Haap W, et al. (2015). Selective cathepsin S inhibition attenuates atherosclerosis in apolipoprotein E-deficient mice with chronic renal disease. Am J Pathol 185, 1156–1166. [DOI] [PMC free article] [PubMed] [Google Scholar]
- Fukami T, Kariya M, Kurokawa T, Iida A, and Nakajima M. (2015). Comparison of substrate specificity among human arylacetamide deacetylase and carboxylesterases. Eur J Pharm Sci 78, 47–53. [DOI] [PubMed] [Google Scholar]
- Fukuda D, Aikawa E, Swirski FK, Novobrantseva TI, Kotelianski V, Gorgun CZ, Chudnovskiy A, Yamazaki H, Croce K, Weissleder R, et al. (2012). Notch ligand delta-like 4 blockade attenuates atherosclerosis and metabolic disorders. Proc Natl Acad Sci U S A 109, E1868–1877. [DOI] [PMC free article] [PubMed] [Google Scholar]
- Goldberg IJ, Reue K, Abumrad NA, Bickel PE, Cohen S, Fisher EA, Galis ZS, Granneman JG, Lewandowski ED, Murphy R, et al. (2018). Deciphering the Role of Lipid Droplets in Cardiovascular Disease: A Report From the 2017 National Heart, Lung, and Blood Institute Workshop. Circulation 138, 305–315. [DOI] [PMC free article] [PubMed] [Google Scholar]
- Hutcheson JD, Goettsch C, Bertazzo S, Maldonado N, Ruiz JL, Goh W, Yabusaki K, Faits T, Bouten C, Franck G, et al. (2016). Genesis and growth of extracellular-vesicle-derived microcalcification in atherosclerotic plaques. Nat Mater 15, 335–343. [DOI] [PMC free article] [PubMed] [Google Scholar]
- Krahmer N, Farese RV Jr., and Walther TC (2013). Balancing the fat: lipid droplets and human disease. EMBO Mol Med 5, 973–983. [DOI] [PMC free article] [PubMed] [Google Scholar]
- Lacolley P, Regnault V, Nicoletti A, Li Z, and Michel JB (2012). The vascular smooth muscle cell in arterial pathology: a cell that can take on multiple roles. Cardiovasc Res 95, 194–204. [DOI] [PubMed] [Google Scholar]
- Linden F, Domschke G, Erbel C, Akhavanpoor M, Katus HA, and Gleissner CA (2014). Inflammatory therapeutic targets in coronary atherosclerosis-from molecular biology to clinical application. Front Physiol 5, 455. [DOI] [PMC free article] [PubMed] [Google Scholar]
- Lo V, Erickson B, Thomason-Hughes M, Ko KW, Dolinsky VW, Nelson R, and Lehner R. (2010). Arylacetamide deacetylase attenuates fatty-acid-induced triacylglycerol accumulation in rat hepatoma cells. J Lipid Res 51, 368–377. [DOI] [PMC free article] [PubMed] [Google Scholar]
- Nakano T, Katsuki S, Chen M, Decano JL, Halu A, Lee LH, Pestana DVS, Kum AST, Kuromoto RK, Golden WS, et al. (2019). Uremic Toxin Indoxyl Sulfate Promotes Proinflammatory Macrophage Activation Via the Interplay of OATP2B1 and Dll4-Notch Signaling. Circulation 139, 78–96. [DOI] [PMC free article] [PubMed] [Google Scholar]
- Patsch C, Challet-Meylan L, Thoma EC, Urich E, Heckel T, O’Sullivan JF, Grainger SJ, Kapp FG, Sun L, Christensen K, et al. (2015). Generation of vascular endothelial and smooth muscle cells from human pluripotent stem cells. Nat Cell Biol 17, 994–1003. [DOI] [PMC free article] [PubMed] [Google Scholar]
- Paul A, Chang BH, Li L, Yechoor VK, and Chan L. (2008). Deficiency of adipose differentiation-related protein impairs foam cell formation and protects against atherosclerosis. Circ Res 102, 1492–1501. [DOI] [PMC free article] [PubMed] [Google Scholar]
- Perona JS (2017). Membrane lipid alterations in the metabolic syndrome and the role of dietary oils. Biochim Biophys Acta Biomembr 1859, 1690–1703. [DOI] [PubMed] [Google Scholar]
- Peters DT, Cowan CA, and Musunuru K. (2008). Genome editing in human pluripotent stem cells. In StemBook (Cambridge (MA)). [PubMed] [Google Scholar]
- Quillard T, Araujo HA, Franck G, Tesmenitsky Y, and Libby P. (2014). Matrix metalloproteinase-13 predominates over matrix metalloproteinase-8 as the functional interstitial collagenase in mouse atheromata. Arterioscler Thromb Vasc Biol 34, 1179–1186. [DOI] [PMC free article] [PubMed] [Google Scholar]
- Quiroga AD, and Lehner R. (2011). Role of endoplasmic reticulum neutral lipid hydrolases. Trends Endocrinol Metab 22, 218–225. [DOI] [PubMed] [Google Scholar]
- Ran FA, Hsu PD, Wright J, Agarwala V, Scott DA, and Zhang F. (2013). Genome engineering using the CRISPR-Cas9 system. Nat Protoc 8, 2281–2308. [DOI] [PMC free article] [PubMed] [Google Scholar]
- Sekiya M, Osuga J, Nagashima S, Ohshiro T, Igarashi M, Okazaki H, Takahashi M, Tazoe F, Wada T, Ohta K, et al. (2009). Ablation of neutral cholesterol ester hydrolase 1 accelerates atherosclerosis. Cell Metab 10, 219–228. [DOI] [PubMed] [Google Scholar]
- Shimizu-Hirota R, Sasamura H, Kuroda M, Kobayashi E, Hayashi M, and Saruta T. (2004). Extracellular matrix glycoprotein biglycan enhances vascular smooth muscle cell proliferation and migration. Circ Res 94, 1067–1074. [DOI] [PubMed] [Google Scholar]
- Shiratori Y, Okwu AK, and Tabas I. (1994). Free cholesterol loading of macrophages stimulates phosphatidylcholine biosynthesis and up-regulation of CTP: phosphocholine cytidylyltransferase. J Biol Chem 269, 11337–11348. [PubMed] [Google Scholar]
- Sinha S, Iyer D, and Granata A. (2014). Embryonic origins of human vascular smooth muscle cells: implications for in vitro modeling and clinical application. Cell Mol Life Sci 71, 2271–2288. [DOI] [PMC free article] [PubMed] [Google Scholar]
- Stohr O, Schilbach K, Moll L, Hettich MM, Freude S, Wunderlich FT, Ernst M, Zemva J, Bruning JC, Krone W, et al. (2013). Insulin receptor signaling mediates APP processing and beta-amyloid accumulation without altering survival in a transgenic mouse model of Alzheimer’s disease. Age (Dordr) 35, 83–101. [DOI] [PMC free article] [PubMed] [Google Scholar]
- Sukhova GK, Zhang Y, Pan JH, Wada Y, Yamamoto T, Naito M, Kodama T, Tsimikas S, Witztum JL, Lu ML, et al. (2003). Deficiency of cathepsin S reduces atherosclerosis in LDL receptor-deficient mice. J Clin Invest 111, 897–906. [DOI] [PMC free article] [PubMed] [Google Scholar]
- Takahashi K, Tanabe K, Ohnuki M, Narita M, Ichisaka T, Tomoda K, and Yamanaka S. (2007). Induction of pluripotent stem cells from adult human fibroblasts by defined factors. Cell 131, 861–872. [DOI] [PubMed] [Google Scholar]
- Takahashi K, and Yamanaka S. (2006). Induction of pluripotent stem cells from mouse embryonic and adult fibroblast cultures by defined factors. Cell 126, 663–676. [DOI] [PubMed] [Google Scholar]
- Trickett JI, Patel DD, Knight BL, Saggerson ED, Gibbons GF, and Pease RJ (2001). Characterization of the rodent genes for arylacetamide deacetylase, a putative microsomal lipase, and evidence for transcriptional regulation. J Biol Chem 276, 39522–39532. [DOI] [PubMed] [Google Scholar]
- Vaquero AR, Ferreira NE, Omae SV, Rodrigues MV, Teixeira SK, Krieger JE, and Pereira AC (2012). Using gene-network landscape to dissect genotype effects of TCF7L2 genetic variant on diabetes and cardiovascular risk. Physiol Genomics 44, 903–914. [DOI] [PubMed] [Google Scholar]
- Wang L, Jiang Y, Song X, Guo C, Zhu F, Wang X, Wang Q, Shi Y, Wang J, Gao F, et al. (2016). Pdcd4 deficiency enhances macrophage lipoautophagy and attenuates foam cell formation and atherosclerosis in mice. Cell Death Dis 7, e2055. [DOI] [PMC free article] [PubMed] [Google Scholar]
- Warren CR, Jaquish CE, and Cowan CA (2017a). The NextGen Genetic Association Studies Consortium: A Foray into In Vitro Population Genetics. Cell Stem Cell 20, 431–433. [DOI] [PubMed] [Google Scholar]
- Warren CR, O’Sullivan JF, Friesen M, Becker CE, Zhang X, Liu P, Wakabayashi Y, Morningstar JE, Shi X, Choi J, et al. (2017b). Induced Pluripotent Stem Cell Differentiation Enables Functional Validation of GWAS Variants in Metabolic Disease. Cell Stem Cell 20, 547–557 e547. [DOI] [PubMed] [Google Scholar]
- Yu J, Vodyanik MA, Smuga-Otto K, Antosiewicz-Bourget J, Frane JL, Tian S, Nie J, Jonsdottir GA, Ruotti V, Stewart R, et al. (2007). Induced pluripotent stem cell lines derived from human somatic cells. Science 318, 1917–1920. [DOI] [PubMed] [Google Scholar]
- Zhao B, Song J, Chow WN, St Clair RW, Rudel LL, and Ghosh S. (2007). Macrophage-specific transgenic expression of cholesteryl ester hydrolase significantly reduces atherosclerosis and lesion necrosis in Ldlr mice. J Clin Invest 117, 2983–2992. [DOI] [PMC free article] [PubMed] [Google Scholar]
Associated Data
This section collects any data citations, data availability statements, or supplementary materials included in this article.
Supplementary Materials
Methods S1: Primers for SYBR green real-time RT-PCR, Related to STAR Methods
Table S2: Gene expression data of dECs, Related to Figure 1
Table S3: Gene expression data of dVSMCs, Related to Figure 1
Table S4: AADAC expression levels in human tissues and cells, Related to Figure 2
Data Availability Statement
The raw microarray and normalized data are available at Gene Expression Omnibus (GEO: https://www.ncbi.nlm.nih.gov/geo/) (the GSE number is GSE113969). The data of Aadac-Tg mice are available at Mendeley Data (https://data.mendeley.com) (DOI: 10.17632/m3x3czkwhm.1).